Assessing the Impact of Local and Regional Influences on Nitrogen Loads to Buzzards Bay, MA
 Shanna C. Williamson
 Jennie E. Rheuban
 Joseph E. Costa3
  David M. Glover
 Scott C. Doney
- 1Department of Marine Chemistry and Geochemistry, Woods Hole Oceanographic Institution, Woods Hole, MA, USA
- 2Virginia Institute of Marine Science, College of William and Mary, Gloucester Point, VA, USA
- 3Buzzards Bay National Estuary Program, Massachusetts Office of Coastal Zone Management, East Wareham, MA, USA
Nitrogen and chlorophyll-a concentrations in estuarine systems often correlate positively with increased nitrogen input. To determine the interactions between nitrogen load, physical drivers, and water quality indicators, we estimated nitrogen inputs to 28 estuaries within the Buzzards Bay, Massachusetts (USA) watershed from 1985 to 2013. Estimates were derived by combining parcel specific wastewater disposal, point source wastewater discharge, land use, and atmospheric nitrogen deposition data with a previously verified nitrogen loading model. Linear regression analysis was used to quantify temporal trends in individual data sets and characterize relationships between variables. The land-use data indicated that fractional coverage of impervious surfaces increased with time for all sub-watersheds at the expense of vegetation and agriculture land use classes, reflecting a growth in residential unit density. Nitrogen loads decreased with time for most watersheds on the western side of Buzzards Bay, reflecting decreased atmospheric nitrogen deposition combined with management efforts to mitigate wastewater pollution. For most of Buzzards Bay's eastern watersheds, increases in nitrogen sourced from wastewater, driven primarily by the development of homes with on-site wastewater disposal, resulted in stable or overall nitrogen load increases. The relationship between nitrogen load and mean summer in situ chlorophyll a underwent a shift to more chlorophyll a per unit nitrogen input over time that was partially correlated to climatic variables such as increased precipitation and warming water column temperatures.
Introduction
The ecological functioning of coastal marine ecosystems is largely dependent on an adequate supply of nutrients delivered from watersheds or exchanged from the open ocean. In recent decades, excessive nutrient supply has degraded nearshore water quality around the world (Bricker et al., 2008; Selman et al., 2008). Increased human populations and development along coasts has enhanced eutrophication, defined here as an increased supply rate of organic matter to an ecosystem (Nixon, 1995) and is often caused by excess nutrient inputs. Eutrophic systems are often impacted by hypoxia or anoxia (Rabalais et al., 2001; Anderson et al., 2002) leading to ecosystem habitat loss (Short and Burdick, 1996; Orth et al., 2006; Waycott et al., 2009; Costello and Kenworthy, 2010), fish kills (Paerl et al., 1998), and the introduction of harmful algal species to a system (Anderson et al., 2002; Glibert et al., 2005), that can result in shellfish poisoning (Shumway, 1990). Human-induced eutrophication threatens the ecological and economic integrity of coastal waters, highlighting the need to identify nutrient sources in coastal watersheds so that the best mitigation strategies can be implemented.
Nitrogen tends to be the limiting nutrient in many estuarine systems (Howarth and Marino, 2006). Major nitrogen sources to estuarine and coastal waters typically include atmospheric nitrogen deposition that percolates through land cover mosaics, chemical fertilizer applied to lawns and agricultural areas, and wastewater, either directly discharged to surface waters or discharged to the groundwater (Valiela et al., 1997). The relative contribution of these sources is dependent on watershed land use such as residential development and agriculture (Valiela and Bowen, 2002; Latimer and Charpentier, 2010). For example, increased residential, commercial and agricultural land use increases nutrient inputs sourced from wastewater and fertilizer into receiving waters (Bolstad and Swank, 1997; Schoonover et al., 2005; Huang et al., 2013), especially during storm events (Bolstad and Swank, 1997). Two major wastewater disposal methods are typically used in the US: onsite septic systems, and centralized wastewater treatment facilities. Onsite septic systems represent a large nonpoint source of nitrogen to the groundwater, and wastewater effluent from treatment facilities is often a point source to surface waters. Infrastructure used to treat wastewater can remove some or most nitrogen depending on level of treatment. However, if wastewater is sourced from outside the watershed of the estuary where effluent is discharged rather than treating homes within a given watershed, the effluent can add an additional point source of nitrogen to an estuary. A high proportional coverage of naturally vegetated land in a watershed can preserve water quality by storing in the soil a fraction of the nitrogen that is deposited on the watershed surface (Tong and Chen, 2002; Lee et al., 2009; Rothenberger et al., 2009). However, the spatial distribution of vegetated land can have a large impact on the effectiveness in attenuating pollutants and nitrogen (Lee et al., 2009); unlike larger forested areas, smaller fragmented forests are typically interspersed with urbanized areas, which may decrease their ability to filter pollutants before reaching adjoining waters (Lee et al., 2009).
Nutrient pollution and eutrophication can be exacerbated by other factors such as climate change. Changes in precipitation can directly impact estuarine hydrodynamics such as freshwater flow, mixing, and residence time. Under drier conditions, decreases in freshwater flow may increase water residence time within an estuary and retention of nutrients and phytoplankton, making an estuary more susceptible to eutrophication (Howarth et al., 2000). Increased precipitation to estuaries with longer residence times can lead to higher discharge of freshwater rich in nutrients that may initiate phytoplankton blooms (Randall and Day, 1997; Yin et al., 1997). Alternatively, in systems with short residence times, increased precipitation is unlikely to change primary productivity if freshwater discharge exceeds some threshold such that phytoplankton and nutrients do not remain in the system long enough to initiate blooms (Boyer et al., 1993). Increased water column temperatures can intensify poor water quality by enhancing phytoplankton growth rates (Eppley, 1972), strengthening stratification, exacerbating biomass accumulation in the surface waters, and depletion of oxygen beneath the surface layer. As anthropogenic climate changes intensifies trends globally (Dore, 2005; Alexander et al., 2006), the need to understand how estuarine systems respond to precipitation patterns becomes that much more important.
Simple watershed-level empirical models offer a cost effective approach to track dominant nutrient sources and estimate nutrient loads. In this study, we used an empirical nitrogen loading model (NLM, Valiela et al., 1997) to quantify nitrogen loads for the estuaries surrounding Buzzards Bay, MA (USA). In this study, (1) we identified annual changes in these nitrogen loads from 1985 to 2013, (2) assessed the relationship of water quality to nitrogen loading rates, and (3) determined if these relationships were influenced by climate factors such as warming or precipitation. As most estuaries in New England are typically limited by nitrogen (Howarth and Marino, 2006), an improved understanding of how nitrogen loads to Buzzards Bay's embayments changed over time can highlight the effect of nutrient reduction efforts and explain patterns in water quality.
Methods
Study Area
Buzzards Bay is an elongated, shallow estuary (max depth ~11 m) bordering southeastern Massachusetts and Cape Cod covering approximately 600 square kilometers. We analyzed 28 sub-watersheds within the broader Buzzards Bay watershed (Buzzards Bay National Estuary Program, BBNEP). The largest sub-watersheds are on the bay's western portion and are drained by several river basins, while smaller watersheds on the eastern portion are predominantly drained mostly by groundwater (Figure 1). Previous work on historical land-use data (1951–1985) found that the spatial extent of forested areas, pastures, open water (including wetlands), and cropland within the bay's watershed decreased by 12.6, 63.5, 54.1, and 23%, respectively, while residential land use increased by nearly 100% (Smith et al., 1989). These land-use changes were associated with declining water quality as represented by decreases in eelgrass and fish community abundance from ~1970-present (Costa, 1988; Hughes et al., 2002; Costello and Kenworthy, 2010). Despite efforts to reduce nitrogen pollution in Buzzards Bay, in situ estuarine chlorophyll-a (Chla) concentration (a proxy for phytoplankton abundance) nearly doubled across most of the estuaries surrounding Buzzards Bay over the 1992–2013 period; concurrently, estuarine total nitrogen concentration remained relatively stable, suggesting that worsening water quality conditions may not simply reflect water column nutrient enrichment (Rheuban et al., 2016).
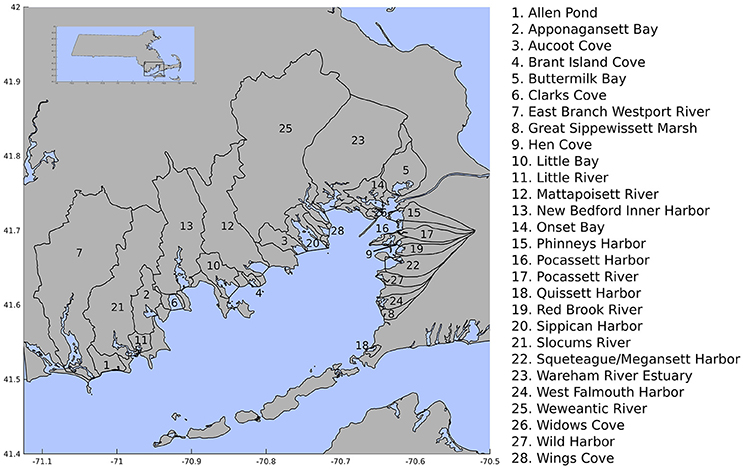
Figure 1. Buzzards Bay subwatersheds analyzed in this study.
Model Description
The nitrogen loading model (NLM) used for this analysis was developed for the Waquoit Bay, MA watershed, which is located approximately 4 kilometers east of Buzzards Bay's watershed boundary (Valiela et al., 1997). The NLM has been widely used in the southern New England region to estimate nitrogen loads from Connecticut, Rhode Island, and Massachusetts watersheds since its initial development (Valiela et al., 1997, 2016; Latimer and Charpentier, 2010). The NLM includes three major nitrogen inputs to watersheds: (1) atmospherically deposited nitrogen (AD-N) that percolates through four broadly defined surfaces including natural vegetation, turf, agricultural land and impervious surfaces; (2) fertilizer applied to turf and agricultural land; and (3) septic systems and leaching fields (Valiela et al., 1997). The NLM was later modified to include point source nitrogen inputs, such as wastewater treatment plants, and AD-N deposited directly onto open waters (Latimer and Charpentier, 2010). Nitrogen load estimates represent nitrogen leaving the watershed to enter the estuary accounting for a series of transmission rates through land cover types and attenuation through the watershed (Table 1). The output from the NLM includes total nitrogen load and contributions by source: direct and indirect atmospheric nitrogen, wastewater, and fertilizer. We also include loads from animal waste and direct wastewater discharge. Nitrogen contributions from these sources will be dependent on the dominant land cover types within a subwatershed, changes to residential counts, and changes to atmospheric deposition (Valiela and Bowen, 2002).
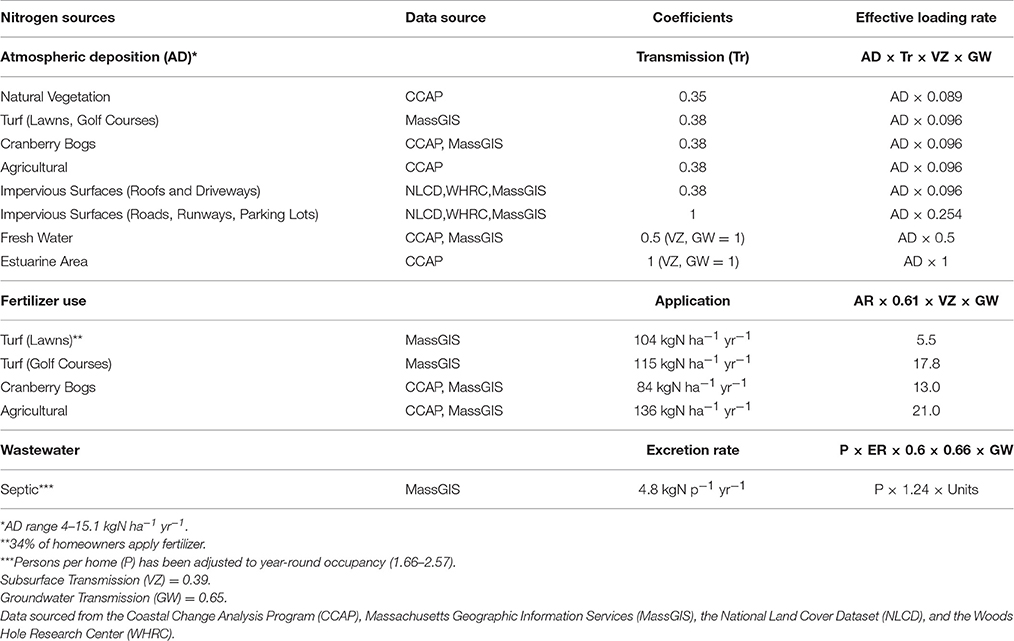
Table 1. Nitrogen load calculation and data sources.
Data Sets and Model Parameters
The NLM requires input data on land use (including impervious surface areas), atmospheric deposition, number of homes using septic systems, point source discharges into the estuary, and land cover to estimate nitrogen loads (Valiela et al., 1997). Linear interpolation was used between each year of available data type to generate a time series of land use, impervious surface coverage, and wastewater effluent loads from 1985 to 2013 at sub-watershed spatial resolution. Watershed boundaries for Buzzards Bay's embayments were obtained through the Buzzards Bay National Estuary Program (http://buzzardsbay.org/gis-data/bbnep_subbasins_apr10.zip). A detailed description of the data used in this analysis is described below.
Land-Use
We used land cover estimates from a combined dataset based on the Coastal Change Analysis Program (C-CAP) (National Oceanic Atmospheric Administration, 1996, 2001, 2006, 2010; http://coast.noaa.gov/digitalcoast/tools/lca) and through the state of Massachusetts' GIS program (MassGIS www.mass.gov). C-CAP is developed primarily from Landsat Thematic Mapper satellite imagery and has land cover data for the years 1996, 2001, 2006, and 2010 at a 30 m resolution. Land cover classifications are based upon of the Anderson Level II classification system for inland areas while wetland categories are based on Cowardin's Classification of Wetlands and Deepwater Habitats (National Oceanic Atmospheric Administration, 2015). An accuracy assessment has been carried out for C-CAP 2010 with an overall accuracy of 84% for the Northeast region (National Oceanic Atmospheric Administration, 2015). MassGIS land cover from 1985 and 1999 were also used. Since MassGIS land cover data is derived directly from orthoimagery, spatial accuracy is believed to be higher than C-CAP (MassGIS; http://www.mass.gov/anf/research-and-tech/it-serv-and-support/application-serv/office-of-geographic-information-massgis/) although a thorough accuracy assessment has not been carried out.
To combine the two land use databases, data from MassGIS was rasterized from a 1:25,000 scale aerial photography photo (1985, 1999) or 0.5 meter resolution (2005) to a 30 m pixel resolution and land use from both datasets was aggregated into simplified classifications including open estuary, freshwater ponds, natural landscapes, horticultural/agricultural land, and urban areas. Because cranberry bogs are a substantial portion of the agriculture in the Buzzards Bay watershed and CCAP does not distinguish between types of agriculture, we separated cranberry bogs from other agriculture using watershed specific percentages determined from the MassGIS 1999 land use data layer and applied this to the full land-use dataset. To maintain consistency between the two datasets, aggregated classifications from MassGIS from year 1999 were corrected to the aggregated classifications from CCAP's 2001 data. This correction was then applied to the MassGIS data from 1985. All corrections applied were both classification and watershed specific.
Golf Courses
Because the use of fertilizer on golf courses is a strong source of groundwater nitrogen and CCAP does not separate golf areas from one of its urban classifications, we used MassGIS's 1985, 1999, 2005 land cover datasets to determine how the area of golf courses changed over time (MassGIS, 2002, 2009). MassGIS changed its classification scheme for its 2005 land cover data that resulted in decreasing golf area between the 1999 and 2005 data. Thus, we corrected the 1985 and 1999 golf areas by the ratio between the 2005 and 1999 areas. Analysis of orthoimagery post 2005 revealed few new golf courses thus we assumed golf areas remained unchanged after the year 2005.
Residential and Commercial Units
MassGIS Level 3 assessors' data from the 17 towns within the Buzzards Bay watershed were used to quantify the number of homes in each sub-watershed. Residential and commercial parcels were separated using the Massachusetts property classification code book (Pitter and Cronin, 2015, http://www.mass.gov/dor/docs/dls/bla/classificationcodebook.pdf). The number of residential units on each parcel was determined using the use-code classification (e.g., 101 use-code is a parcel that has a single-family home, while 104 is a two-family home), the Massachusetts town-level structures database, and orthoimagery. Each residential unit was assumed to have, on average, a 5000 sqft (0.046 ha) lawn (Howes et al., 2006a). Parcels in the New Bedford Harbor watershed were assumed to have a smaller lawn size of 1000 sqft (0.0093 ha) as many parcels are less than 5000 sqft in total.
Impervious Surface Data
Impervious surface data for the years 1985 and 2002 was obtained from the Woods Hole Research Center (WHRC, Stone, personal communication, accessed January 10, 2015), and coverage for years 2001 (Homer et al., 2007), 2006 (Fry et al., 2011), and 2011 (Homer et al., 2015) was obtained from the National Land Cover Dataset (NLCD). Impervious surface coverage from the WHRC data did not classify areas that were between 1 and 10% impervious causing a bias in total impervious surface areas between the WHRC 2002 impervious data layer and the NLCD 2001 data layer. We corrected the 2002 WHRC dataset to the 2001 NLCD dataset by scaling each watershed individually, and applied the scale factor to the 1985 dataset from WHRC.
The NLM separates impervious surfaces such as “roads, runways, and parking lots” from “roofs and driveways” because of the capacity for infiltration of deposition onto lawns and natural vegetation rather than into storm-water infrastructure. Impervious areas from roofs and driveways were determined from watershed total parcel counts by assuming an average driveway of 0.0125 ha (Latimer and Charpentier, 2010) and watershed-specific average roof area from the Massachusetts town-level structures database. Impervious surfaces from roads, runways, and parking lots were assumed to be the difference between the total impervious surface determined from the corrected WHRC and NLCD data layers, roof areas from building footprint layers and parcel counts, and driveway areas from parcel counts.
Wastewater—Non-point Sources
Unless connected to a sewer line, residential units and commercial parcels were assumed to have a septic system and thus contribute to non-point sources of wastewater. Sewering has expanded over time in many subwatersheds in the Buzzards Bay area, which we accounted for with sewered area maps supplied by the Buzzards Bay National Estuary Program (http://www.buzzardsbay.org/wastewater-timeline.html). If a residential unit or commercial parcel became sewered over time, we assumed it no longer contributed to non-point source wastewater. Nitrogen loads from residential septic systems were calculated as in the Valiela et al. (1997), and loads from commercial systems were calculated as in Howes et al. (2011a), assuming a 180 gallon per day water use and 23.63 mg/L of nitrogen reaching the groundwater. This approach does not account for the lag time between the time of construction and the arrival of septic loads to the receiving waters. Because occupancy of homes in the region varies considerably due to the high degree of summer tourism in many sub-watersheds, we used sub-watershed-specific year round occupancy rates determined from block-level data from the 2010 Census with vacant units adjusted for likely seasonal occupancy rates based on a survey of Cape Cod property owners. The seasonal and year round estimates were converted into a year-round net annualized occupancy rate for all properties within a watershed.
Wastewater—Point Sources
Five of the sub-watersheds analyzed here are influenced by large point sources of wastewater disposal. Treated wastewater effluent is discharged directly into surface waters of the Wareham River Estuary (#23), Aucoot Cove (#3), and New Bedford Harbor (#13). Wastewater is also discharged into groundwater that flows into West Falmouth Harbor (#24, Howes et al., 2006a; Howarth et al., 2014; Hayn et al., 2014). West Falmouth Harbor also receives loading from sewage lagoons previously sited at the municipal landfill. Finally, Clarks Cove (#6) and New Bedford Harbor also receive combined sewer overflow (CSO) discharges. Detailed databases of wastewater effluent discharge are available from 2006 to present through reporting to the EPA. To extend wastewater discharges back to 1985, we compiled historical nitrogen loads from these treatment plants and CSO discharges (Supplementary Table 1). Because the facility discharging into groundwater upstream of West Falmouth Harbor does not report effluent discharge in the same way and also includes a closed sewage lagoon discharge site, we compiled estimates of effluent load reaching the estuary from literature values (Howes et al., 2006a; Howarth et al., 2014; Hayn et al., 2014). Measurements from Smith (1999) and Howes et al. (2006a) found 40–50% attenuation of the wastewater load due to nitrogen uptake by vegetation, in the subsurface, and through the downstream marsh, thus we assumed 50% subsurface attenuation of annual discharge from the plant reported in Howes et al. (2006a). Missing values for all facility or CSO discharges were interpolated linearly using neighboring data points.
Atmospheric Deposition
Measurements of atmospheric deposition in the region are sparse. Only 3 long-term stations were available within a ~100 mile radius of Buzzards Bay, one in Connecticut (CT13), one near Boston (MA13), and one near Provincetown, MA (MA01). As such, we used a combined analysis of gridded total nitrogen deposition (wet and dry organic and inorganic nitrogen) and inorganic nitrogen deposition from the National Atmospheric Deposition Program (Schwede and Lear, 2014, ftp://ftp.epa.gov/castnet/tdep/grids/) to create time series of atmospheric nitrogen deposition for each sub-watershed. The inorganic nitrogen deposition maps at sampling locations had absolute average differences from the measurements by 0.3, 18, and 16% with root mean square errors of 0.043, 0.89, and 0.76 kgN yr−1 from CT13, MA01, and MA15 stations, respectively (Supplementary Figure 1). Because total nitrogen deposition maps were only available from years 2000 to 2013, while inorganic deposition maps date back to 1985, we corrected sub-watershed-specific inorganic nitrogen deposition to total deposition using the overlapping years. Grids of total deposition were refined beginning in 2007 and better describe the Cape Cod region, thus we used the data from 2007 to 2013 to calibrate inorganic deposition to total (r2 > 0.63, p < 0.03 for all sub-watersheds, Supplementary Figure 2).
Animal Waste
In one watershed, the east branch of the Westport River, nitrogen loads from dairy cows and other livestock appreciably exceeded septic system loading (Howes et al., 2012). However, livestock type and numbers, as measured in total USDA Animal Units (1000lbs of animal biomass), also declined from 3105 in 1987 (US Environmental Protection Agency, 1988) to 2657 in 2012 (Howes et al., 2012). This decline included a reduction in the number of chickens (which produce high nitrogen waste) from 60,000 individuals (US Environmental Protection Agency, 1988) to a little over a 1000 (Howes et al., 2012). To account for a history of animal waste, we used county-level data from the USDA historical census of agriculture available at 5 year intervals (US Department of Agriculture, 1994, 2004, 2014; USDA) and estimated the number of cows in the Westport watershed as a percentage of total state numbers based on Westport specific animal counts from US Environmental Protection Agency (1988) and Howes et al. (2012). Finally, the East Branch of the Westport River is estimated to have 75% of the total animals in the watershed (Howes et al., 2012). Nitrogen load from cows and chickens is determined from Howes et al. (2012) as 55.8 and 0.4 kgN animal−1 yr−1, respectively, assuming 40% leaching to the groundwater.
Precipitation
To estimate precipitation to each sub-watershed, we used high-resolution reanalysis data from the PRISM interpolation method (Daly et al., 2008, http://www.prism.oregonstate.edu/). Monthly 4 × 4 km precipitation values were extracted for each sub-watershed from 1992 to 2013. Precipitation from the PRISM dataset was compared to rain gages from the Massachusetts Rainfall Program located around Buzzards Bay (Falmouth, Wareham, and Dartmouth, MA). These rain gages had absolute differences from the gridded dataset on average of 13.2, 3.0, and 9.8% with a root mean square error of 164, 51.3, and 173 mm, respectively (Supplementary Figure 3). Total precipitation from April through June was correlated to the following summertime water quality.
In situ Water Quality Data
The in situ water quality data used in this analysis was collected through a bay-wide citizen-science monitoring program facilitated by a local non-profit organization, the Buzzards Bay Coalition. This data set contains 20+ years of regularly monitored summertime water quality data including inorganic and organic nitrogen, orthophosphate, chlorophyll and phaeopigments, dissolved oxygen, salinity, secchi depth, and temperature. For a more complete description and analysis of these data please see Rheuban et al. (2016).
Data Analysis
Linear regression analysis through time was used to assess if land use in each sub-watershed changed from 1985 to 2013, assuming a 16% uncertainty in land cover classifications (NOAA-e). Because the datasets used to estimate nitrogen load incorporate data with different temporal resolution and thus mixed degrees of freedom in a regression analysis, we determined trends in nitrogen load through a Taylor expansion of the linearized NLM. Total nitrogen load (kg yr−1) from watersheds is determined as:
where Nfert, NWW, NADD, and NADI, Nfert NWW NADD NADI, are nitrogen from fertilizer, wastewater, direct atmospheric deposition, and indirect atmospheric deposition after attenuation by plants and in the subsurface. Thus, the overall trend in Nload would be:
Using wastewater as an example:
where Er is the human nitrogen excretion rate (kg person−1 yr−1), P is the watershed average number of people per home adjusted for seasonal occupancy, Tseptic is the nitrogen transmission rate through septic systems and the subsurface, Units is the total number of housing units on septic, and Discharge is the direct wastewater discharge from wastewater treatment plants or combined sewer overflows (kg yr−1). Each of the terms in Equation (4) has an associated error, σi approximated as the overall error in the NLM (Collins et al., 2000). We estimate the error in the nitrogen load trend for each component using standard error propagation assuming independent errors. For example, the error on the trend in nitrogen sourced from wastewater is as follows:
The other terms were derived similarly.
Because the underlying datasets had mixed degrees of freedom and we chose to estimate trends through a Taylor expansion and propagation of error, we estimated that a trend was different from zero if the magnitude of the slope was more than 2 times the propagated error. If the magnitude of the slope was smaller than 2 times the error, we assumed there was no significant trend in nitrogen loading. Regression analysis was conducted comparing average Buzzards Bay summertime, in situ water quality data (total nitrogen and chlorophyll a), as reported in Rheuban et al. (2016), to our estimated nitrogen loads and climate drivers (temperature and precipitation). A multiple linear regression (MLR) approach was used to determine the relative importance of nitrogen load, temperature, and precipitation on predicting summertime Chla and TN concentrations. Data were standardized prior to the MLR to estimate effect sizes of nitrogen load, temperature, and precipitation on water quality using Chla and TN as water quality indicators. Nitrogen load, Chla, and TN were log-transformed prior to analyses to reduce the dynamic range in the nitrogen loads, because Chla was log-normally distributed, and TN had very long positive tails.
Sources Omitted from the Analysis
This analysis did not include nitrogen sourced from landfills, which do not account for an appreciable source of loading in any watershed except West Falmouth Harbor; however, this source is already accounted in the loading estimates used for this report.
Results
Primary Nitrogen Load Drivers
Time series (1985–2013) of key nitrogen-loading drivers across the Buzzards Bay watershed are shown in Figure 3. There was an increase in housing development (r2 = 0.98, p < 0.0001), with increases from 47,841 to 62,525 sewered homes (r2 = 0.64, p < 0.0001) and slight increases in homes with onsite septic systems followed by declines with expansion of centralized wastewater infrastructure (Figure 3, top panel). Over the corresponding time period, atmospheric nitrogen deposition averaged over the region declined from a maximum of 12.5 to a minimum of 6.31 (kg N ha−1 yr−1; p < 0.001), agreeing well with other estimates of atmospherically deposited nitrogen (AD-N) in New England (Lehmann et al., 2005; Valiela et al., 2016; Figure 3, bottom panel).
Over the study period, land use for the Buzzards Bay regions analyzed here were, on average, 78.5% natural vegetation, 6.2% agricultural land, 0.4% golf courses, 4.7% impervious, 2.5% freshwater, 2.2% lawns, and 5.4% estuary area (Table 2). From 1985 to 2013, there were losses in natural vegetation (slope = −131.1 ± 18.1 Ha yr−1; r2 = 0.911; p = 0.002, n = 6), increases in agricultural land (slope = 25.2 ± 8.68 Ha yr−1; r2 = 0.598; p = 0.044, n = 6), increases in impervious surfaces (slope = 71.8 ± 7.6 Ha yr−1; r2 = 0.95; p = 0.0007, n = 6), and slight increases in golf courses (slope = 7.16 ± 0.6 Ha yr−1; r2 = 0.99; p = 0.051). At the subwatershed level, the dominant land cover type for most of the subwatersheds was also natural vegetation, with values ranging from 22.4 to 91.4% of land area (Table 2). Open water (estuarine area, lakes, ponds, rivers) covered 2.0–45.4% of the sub-watershed area, horticultural/agricultural land covered 0–16.9%, impervious surface area covered 0.5–19.6%, and golf area covered 0–0.2% (Table 2). All sub-watersheds exhibited increased impervious area ranging from a factor of 1.3–3.2 growth from 1985 to 2013 (Figure 2). This expansion of impervious area is reflected in a 23% increase in residential units and other urban infrastructure (Figures 2, 3). Consequently, there were decreases in one or a combination of the remaining land cover types (i.e., natural vegetation, agriculture/horticulture, and/or golf) (Figure 2).
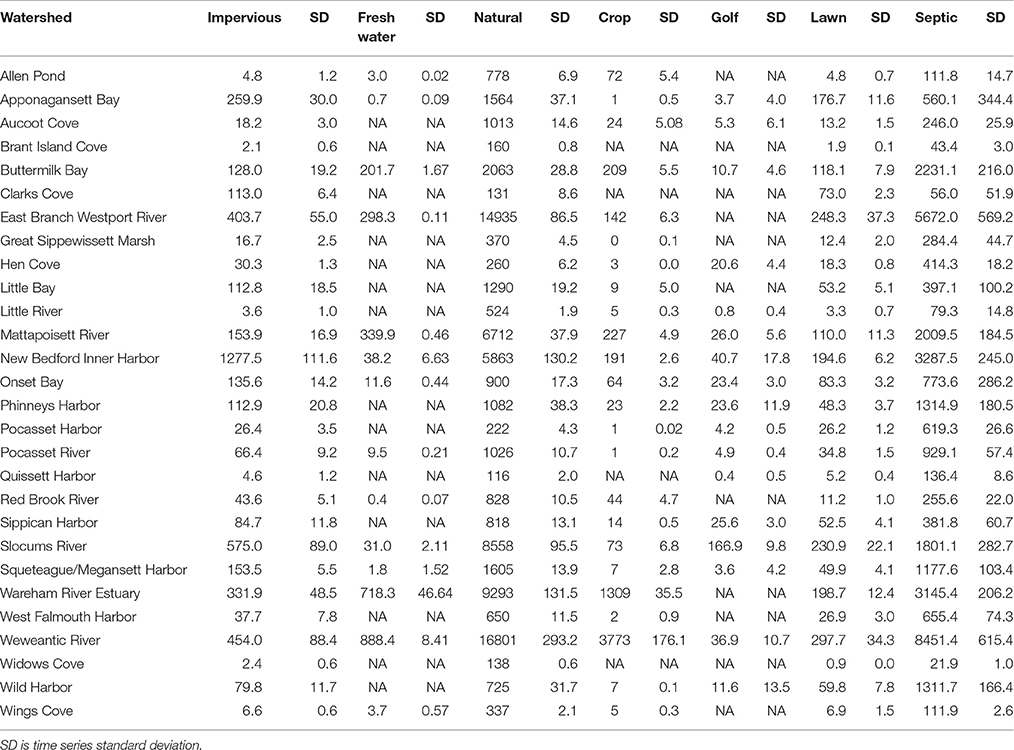
Table 2. Mean land use areas (Ha) in the 28 sub-watersheds of Buzzards Bay from 1985 to 2013.
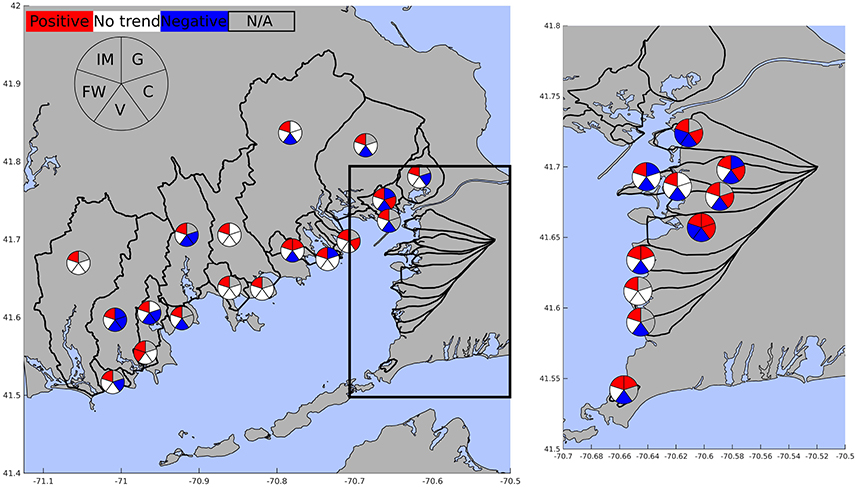
Figure 2. Trends in land use for impervious surface (IM), golf (G), cropland (C), vegetated land (V), and freshwater (FW). Color coding indicates significant trends with red colors indicating increasing trends, blue indicating decreasing trends, and white indicating no trend in land use. Grayed pie segments indicate the land use class was not found in the watershed.
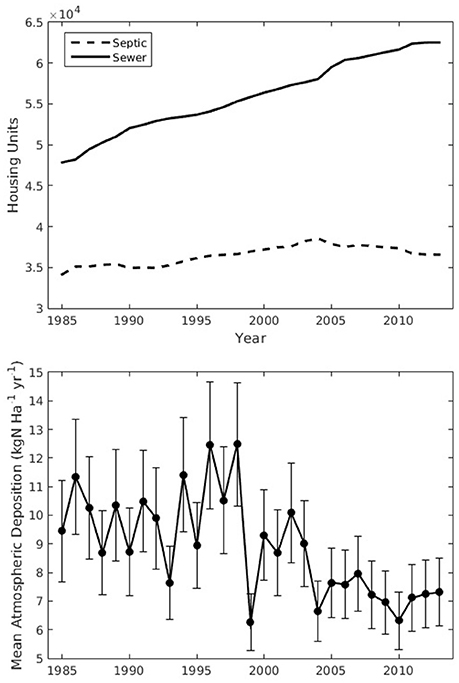
Figure 3. Drivers of nitrogen loads. The top panel shows housing development as the total number of units counted on septic (dashed) and on sewer (solid). The bottom panel shows the mean atmospheric deposition rates across the 28 subwatersheds. Error bars in the bottom panel are spatial standard deviation.
Nitrogen Load Estimates
Across the land areas within the Buzzards Bay watershed analyzed here, fertilizer use on agricultural land and wastewater from septic systems contributed equally to total nitrogen load, followed by atmospheric deposition, direct discharge from combined sewer overflows and wastewater treatment facilities, and animal waste (Figure 4). Normalizing average nitrogen loads by sub-watershed land area resulted in estimates of 2.2–29.4 kg N haW−1 yr−1 (Table 3, Figure 5), while normalizing to sub-watershed estuarine area resulted in loads of 10.1–398 kg N haE−1 yr−1 (Table 3, Figure 5).
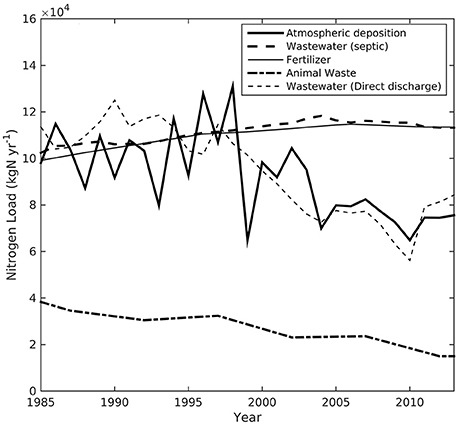
Figure 4. Total nitrogen load to Buzzards Bay estuaries from all watersheds analyzed in this study from the four major sources: atmospheric deposition, wastewater from onsite septic systems, wastewater from wastewater treatment facilities, fertilizer, and animal waste. Atmospheric is the sum of both direct deposition to the estuary and indirect deposition after transmission through the landscape.
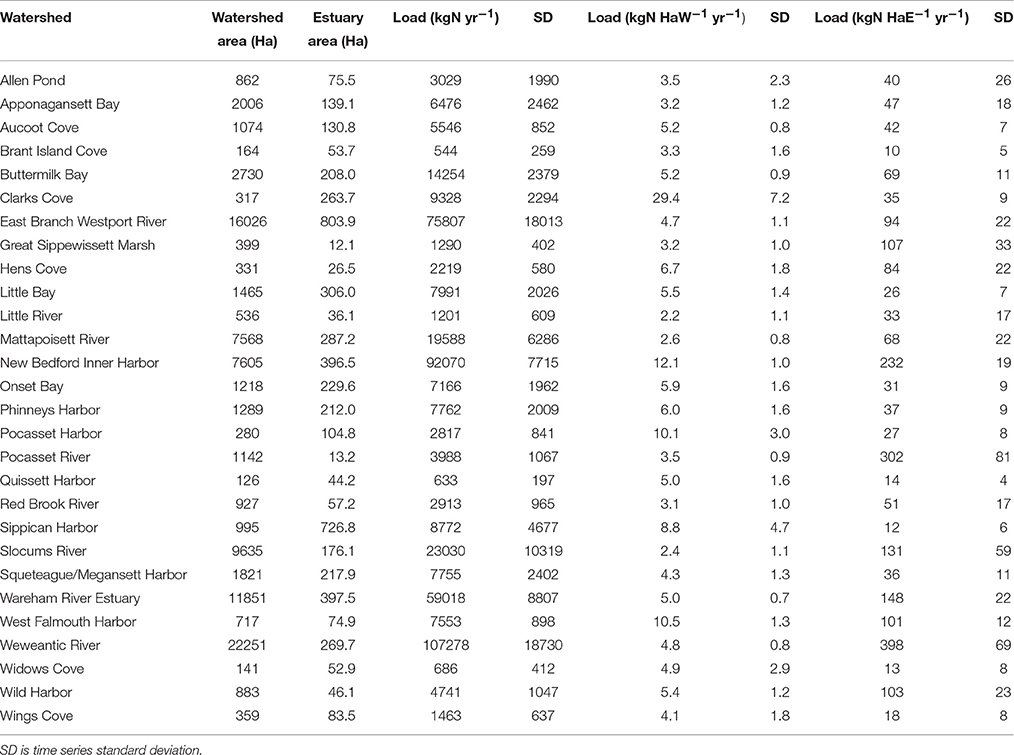
Table 3. Time series mean nitrogen loads from 1985 to 2013 normalized by watershed area (HaW), and estuary area (HaE).
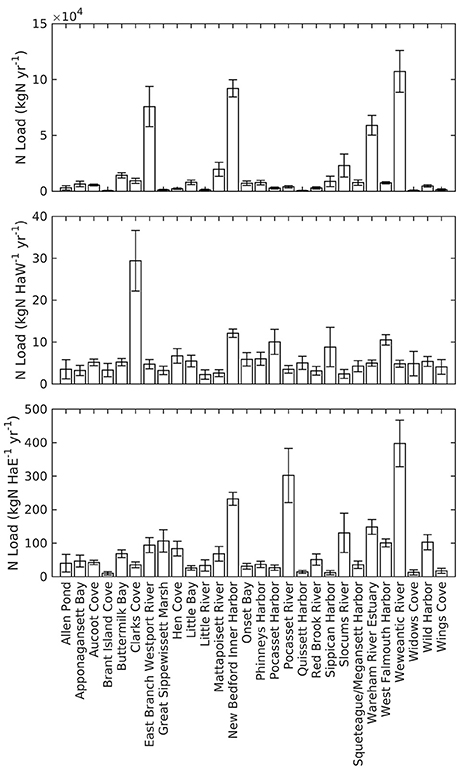
Figure 5. Mean annual nitrogen loads from 1985 to 2013. The top panel shows mean annual nitrogen loads to the 28 subwatersheds. The middle panel shows mean nitrogen loads normalized by watershed area (HaW), and the bottom panel shows mean nitrogen loads normalized by estuary area (HaE). Error bars are temporal standard deviation.
Relative contributions from different nitrogen sources varied across watersheds reflecting differences in land cover types (Figure 6). Direct and indirect atmospheric nitrogen were together often the largest nitrogen source for watersheds with land-cover dominated by natural vegetation or large estuarine areas. Atmospheric deposition was a smaller component of total nitrogen load for watersheds with substantial wastewater influence and a high number of residential units. Direct wastewater effluent discharge was the largest source of nitrogen to four of the five coastal embayments where it was applicable. Fertilizer nitrogen was often the largest source for watersheds with substantial land cover from golf or agricultural land (Figure 6).
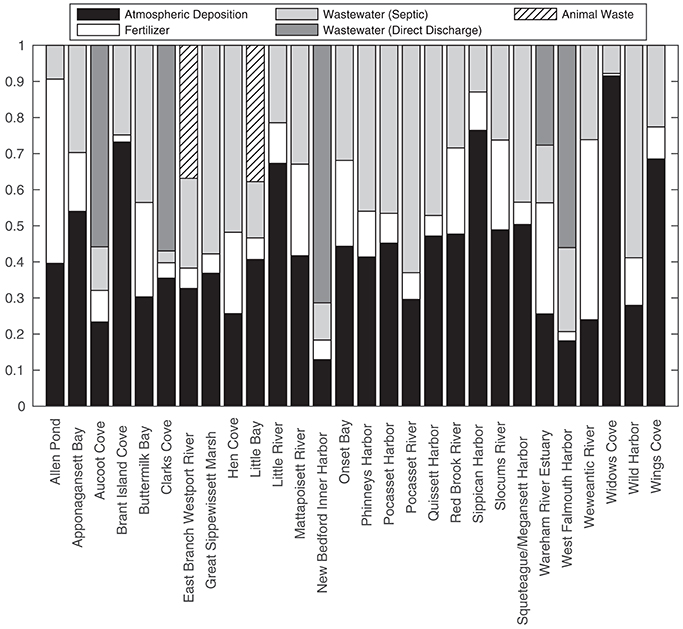
Figure 6. Average fractional contribution of the five sources of nitrogen by individual sub-watershed.
Nitrogen Load Trends
Time-series (1985–2013) are shown in Figure 4 for the integrated total nitrogen loads to the subembayments analyzed here across the Buzzards Bay watershed. Nitrogen from all sources except animal waste were roughly equal for the first half of this analysis, after which both atmospheric deposition and direct wastewater discharge declined considerably while fertilizer and wastewater from septic systems increased. Although there was an increase in housing development and sewered homes (Figure 3), wastewater sourced from combined sewer overflows and treatment facilities declined following efforts to eliminate overflow systems or upgrade treatment plants to tertiary, nitrogen removing systems (Figure 4). However, despite overall consistent nitrogen loading across the land areas analyzed here, at the individual subwatershed level, trends in nitrogen loads were variable.
Estimated nitrogen loads for the subwatersheds around Buzzards Bay increased over time in 4, were stable for 9, and decreased in the remaining 15 subwatersheds (Figure 7). Trends in wastewater derived nitrogen reflect changes in sewering and wastewater treatment, CSO discharge, or increases in housing units. Wastewater sourced nitrogen increased for all 11 watersheds without sewering or direct effluent discharge as a result of housing development with onsite wastewater disposal. Of the 17 watersheds that were influenced by sewering or direct effluent discharge, there were varied trends. Strong regional efforts to control nitrogen pollution have led to expanded sewer networks across a number of towns that has reduced the overall septic load from urban sub-watersheds.
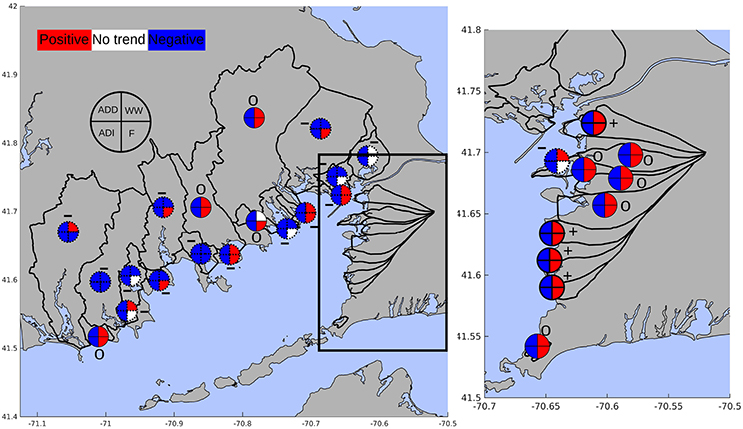
Figure 7. Trends in nitrogen load for direct atmospheric deposition to the estuary (ADD), wastewater (both point and non-point, WW), fertilizer and animal waste (F), and indirect atmospheric deposition (ADI). Red colors indicate significantly increasing trends, blue indicates significantly decreasing trends, and white indicates no trend in nitrogen load. Dotted outlines of the pie charts indicate an overall decline in nitrogen load, bolded outlines indicate an overall increase in nitrogen load, and solid outlines indicate no overall trend in nitrogen load. Overall trends are also indicated by pluses (increasing), minuses (decreasing), and zeros (no trend).
Of the 5 watersheds with direct wastewater or CSO effluent discharge, trends in wastewater nitrogen were dependent on changes to wastewater treatment processes (e.g., upgrades to tertiary, nitrogen removing, treatment) and the relative contribution of effluent discharges to the total wastewater input. For example, over the past several decades, the City of New Bedford has systematically eliminated 14 of the 41 CSO discharge points, reducing the contribution of combined sewer overflows to the wastewater discharge into New Bedford Harbor and Clarks Cove.
The expansion of sewer networks and housing development in the town of Fairhaven increased the wastewater load to the Fairhaven treatment plant that discharges into New Bedford Harbor. However, the estimated declines in CSO discharges led to reduced overall wastewater loads despite the increase in the wastewater effluent nitrogen discharged into New Bedford Harbor.
Trends in nitrogen inputs sourced from fertilizer aggregate fertilizer trends for agricultural land, lawns, golf courses, and sourced from animal waste. Out of the 28 sub-watersheds, 19 displayed an increase in fertilizer load, 6 displayed no significant trend while 2 decreased principally reflecting reductions agricultural land or farm animals. Because the NLM assumes a constant fertilizer application rate, fertilizer use trends reflect changes in the frequency of use and not the intensity of fertilizer use.
Comparison with In situ Water Quality Data
In a companion study, Rheuban et al. (2016) conducted a space-time analysis of in situ estuarine water quality indicator variables, including summertime measurements of nutrients, temperature, and chlorophyll a (Chla) over a 22-year interval that falls within the time frame of this study. Regressing in situ Chla and total nitrogen (TN) for subembayments against nitrogen load normalized by embayment volume (Figure 8) revealed that across the sub-watersheds both TN (r2 = 0.22, p < 0.0001, n = 396) and Chla (r2 = 0.09, p < 0.0001, n = 390) were positively correlated to nitrogen load, with Chla displaying a high degree of interannual variability. The multiple linear regression (MLR) analysis showed that nitrogen load, temperature, and precipitation were equally important in predicting Chla, but nitrogen load had a nearly 4-fold larger effect on TN than temperature or precipitation (Table 4).
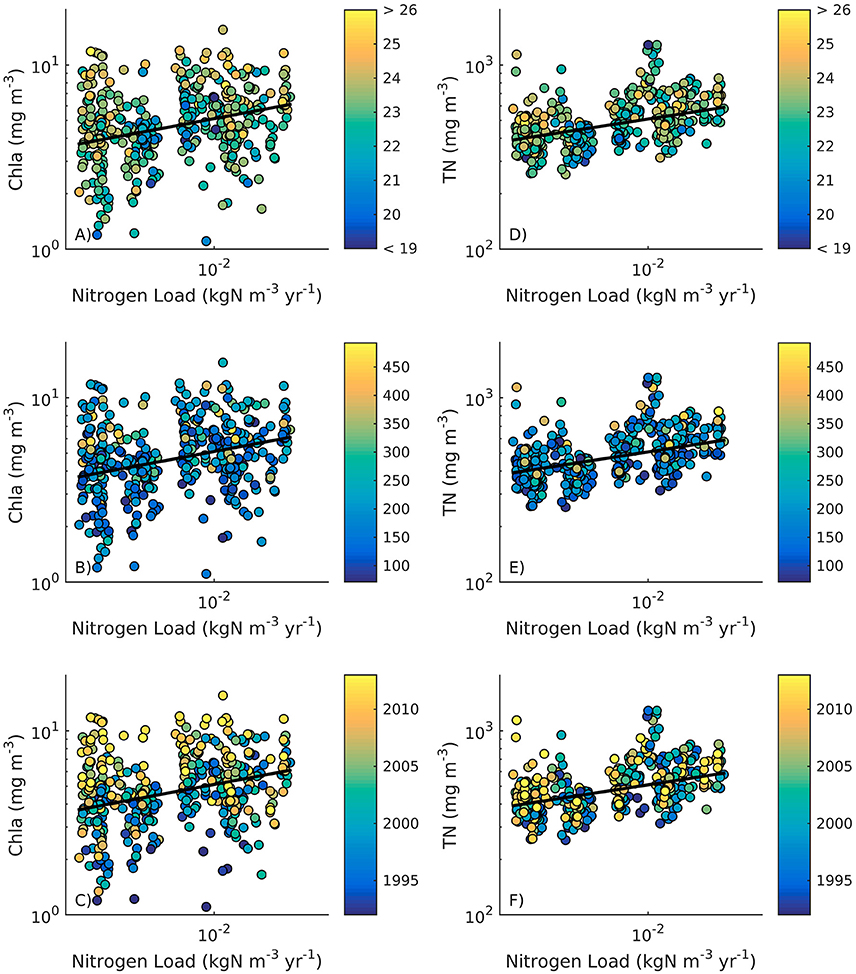
Figure 8. In situ water column chlorophyll a (Chla, left panels) and total nitrogen (TN, right panels) concentration regressed against nitrogen loads normalized by estuary volume across 20 of the 28 subwatersheds where water quality samples were available. Data points have been colored by (A,D) July/August water column temperatures, (B,E) April-June precipitation, and (C,F) year. Bold line is the linear regression across all data points.
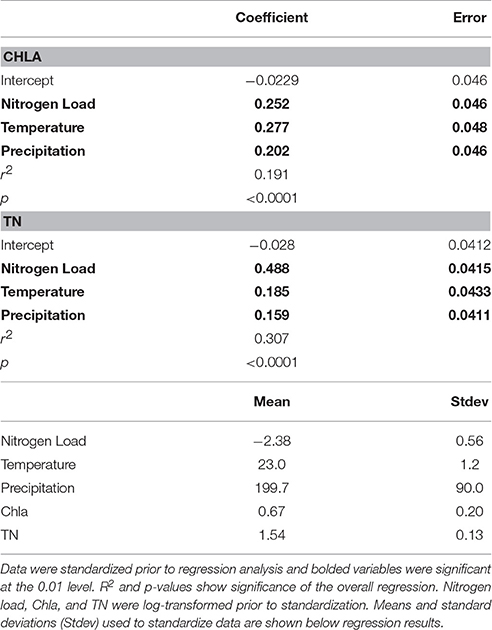
Table 4. Effect sizes from a multiple linear regression analysis of nitrogen load, temperature, and precipitation on chlorophyll A (Chla) and total nitrogen (TN) concentration.
Discussion
Overall Trends in Nitrogen Loads
Local changes in dominant land-use types coupled with regional changes in atmospheric nitrogen deposition across Buzzards Bay are primarily responsible for bay wide changes in nitrogen loads from coastal watersheds to adjoining estuaries. When broken down by individual subwatershed units, total average nitrogen loads to the estuaries reflect the combined influence of watershed size and degree of urbanization (Figure 5). Watersheds with the largest nitrogen load per watershed land area were mostly dominated by either CSO or wastewater treatment facility discharge (e.g., Clarks Cove, New Bedford Inner Harbor, and West Falmouth Harbor). Total nitrogen loads to many of these same watersheds have decreased over time as a result of improvements to wastewater treatment facilities or discontinuation of CSO outfalls. For example, due to improvements in the wastewater treatment process during the early 1990s, nitrogen concentration declined at the New Bedford outfall, located near the mouth of New Bedford Harbor and Clarks Cove, which may have contributed to water quality improvements in these systems (Turner et al., 2009).
In the watershed of the Wareham River Estuary, which receives the wastewater effluent from the Wareham Treatment Facility, there has been major infrastructure development including expanding sewer networks and upgrades to the wastewater treatment plant to reduce nitrogen inputs to the estuary from the watershed. Although development in the watershed has increased the total number of residential units by 894 units over the timeframe of our analysis, expanding sewer networks have reduced the number of homes using onsite wastewater disposal by 460 units from 1985 to 2013. In addition to reducing the number of septic units discharging into the groundwater, the Wareham Treatment Facility upgraded in 2005 to seasonal tertiary treatment to lower discharge nitrogen concentration to below 4 mg L−1 for 8 months of the year. This upgrade has successfully reduced the direct discharge of wastewater nitrogen into the Wareham River Estuary by more than 65%, or from nearly 40% to less than 20% of the overall nitrogen load to the embayment.
Because infrastructure for wastewater treatment is limited by treatment plant locations and capacity, wastewater is often exported from one subwatershed to another and can increase the localized impact. This was true for the West Falmouth Harbor watershed, whose treatment facility discharges wastewater from homes connected to sewer lines outside of the watershed delineation, resulting in a large additional nitrogen source, and dramatic declines in water quality (Howarth et al., 2014; Hayn et al., 2014; Rheuban et al., 2016).
Nitrogen load patterns across the entire Buzzards Bay region reflected a tradeoff between declining atmospheric nitrogen deposition and variable positive and negative trends from local sources. Trends in fertilizer use, wastewater, and fossil fuel combustion are major contributors of nitrogen oxides and ammonia that directly influence regional trends in atmospheric nitrogen deposition (Bouwman et al., 1997; Galloway et al., 2004; Doney et al., 2007). Implementation of both local and federal air quality programs has successfully reduced NOx and NH4 emissions in New England and these trends are reflected in declining atmospheric nitrogen deposition to Buzzards Bay. Most of this decline has occurred since the year 2000 and is consistent with dramatic declines in atmospheric NOx concentration attributed to improvements in energy and transportation technology (Krotkov et al., 2015).
Both direct and indirect atmospherically sourced nitrogen largely followed the same pattern as atmospheric deposition (Figure 7) suggesting that modulation of atmospheric deposition by land use is a second order term. In most subwatersheds, trends in deposition rates caused more than 90% of the total change in indirect atmospherically sourced nitrogen with the exception of Phinneys Harbor, where land use change, specifically increased impervious surfaces, led to 27% of the total change. This result agrees well with a recent analysis of nitrogen loads to nearby Waquoit Bay, MA where declining atmospheric nitrogen deposition along with increased development with onsite wastewater disposal has led to approximately constant nitrogen loads between 1990 and 2014 (Valiela et al., 2016). Atmospheric deposition presents a challenge for the development of effective local management strategies because it is impacted by regional nitrogen emissions from airsheds that are often much larger than watersheds (Dennis and Mathur, 2001) and may span across multiple town or state boarders.
Comparison with In situ Water Quality Data
From in situ water quality monitoring, Rheuban et al. (2016) found that during summertime, Buzzards Bay had a low DIN/DIP ratio (<7) (Rheuban et al., 2016), suggesting that Buzzards Bay is a nitrogen limited system. Although TN and Chla were positively correlated to nitrogen load, these regressions were rather weak, explaining only 22 and 9% of the variance in the data across all watersheds. This weak relationship was due in part to the high degree of interannual variability that may be driven by other factors and the predominantly opposite trends in nitrogen load and water quality observed over this period. With the exception of four embayments on the eastern side of Buzzards Bay, most sub-embayments have had declining or flat trends in nitrogen loads (Figure 7) with strongly increasing trends in Chla from 1992 to 2013 (Rheuban et al., 2016). Individual species of nitrogen can also have different influences on estuarine biogeochemistry, e.g., inorganic nitrogen is more bioavailable than organic forms, but many harmful algae can still utilize organic forms (Glibert et al., 2001). The NLM estimates total nitrogen loads from watersheds to receiving estuaries but does not distinguish the chemical form of the nitrogen. Therefore, some of the scatter in the water quality-nitrogen loading relationships may be due to changes in nitrogen species-specific loading rates that we did not account for in this analysis.
The apparent enhancement of the offset of the Chla—nitrogen load relationship over time (Figure 8E) likely is a reflection, in part, of the positive Chla response to warming and enhanced precipitation (Table 4). Water quality-climate impacts may occur as a combination of direct physical changes to the environment and indirect effects through changes to the dominant ecosystem state from benthic to pelagic primary producers. Buzzards Bay's estuaries were historically vegetated with the seagrass Zostera marina (eelgrass) that has declined over the last several decades attributed largely to eutrophication (Costello and Kenworthy, 2010). Declines in eelgrass may increase the availability of labile nitrogen sources to the water column due to the loss of the coastal filter (McGlathery et al., 2007).
Long-term changes to physical drivers such as temperature and precipitation may also explain patterns in the relationship between nitrogen loads and in situ TN and Chla (Table 4). The MLR suggests that nitrogen load, water column temperature, and seasonal precipitation all have an equal effect size for determining water quality in Buzzards Bay each summer. Further, the coefficients were all positive, suggesting warming temperatures and increased precipitation will manifest in the biological response as an increase in Chla concentration. Similarly, the—MLR predicting TN concentration reveals increases in TN with both temperature and precipitation (Table 4) but nitrogen load had a 4-fold larger effect size than environmental variables. The positive effect sizes between temperature and precipitation and water quality suggests that the widespread increase in Chla concentration observed in Rheuban et al. (2016) is partly a response to elevated summertime temperatures.
Increased water column temperatures can alter the estuarine response to nitrogen loads in several ways. Warmer summertime temperatures in Buzzards Bay (Rheuban et al., 2016) may enhance phytoplankton growth rates (Eppley, 1972) and increase primary productivity (Lewandowska et al., 2012). Temperature can also influence the rate at which inorganic nitrogen is released from sediment back into the water column (Nixon et al., 1976; Fisher et al., 1982) and recycling of organic matter within water column (Sampou and Kemp, 1994) as a result of enhanced microbial metabolic activity. Increased temperatures may also alter food web dynamics in marine systems. Regional warming has been correlated to increased abundance of the ctenophore Mnemiopsis leidyi in Narragansett Bay, RI (Costello et al., 2006; Sullivan et al., 2007) that can alter pelagic food webs dynamics by decreasing zooplankton abundance and thus reducing grazing pressure on phytoplankton (Purcell, 2012; Kimmel et al., 2015). Reduced grazing pressure would be consistent with increases in Chla for a given nitrogen load but little change in bulk organic matter in Buzzards Bay's estuaries (Rheuban et al., 2016). Decreases in particulate organic matter caused by lower zooplankton abundance would be offset by increased organic matter as a result of higher phytoplankton abundance leading to an enhanced response of Chla compared to TN. This result would be consistent with our observations that the effect size of nitrogen load on TN was nearly 4-fold larger than temperature (Table 4) combined with declining or flat nitrogen loads in most embyaments. In situ trends in TN (Rheuban et al., 2016) in many estuaries did not often agree with the trends in nitrogen load (Figure 6). The significant, positive effect size of mean annual spring precipitation and summer water quality suggests wetter years led to higher delivery of nitrogen from the watershed to the estuaries.
Loading Assumptions and Differences between Literature Reported Nitrogen Loads
Overall nitrogen loads will be strongly dependent on the watershed loading model chosen. For several of the subwatersheds analyzed here, there have been estimates of nitrogen loads for single points in time reported in both peer-reviewed literature and as white papers. Here, we compare our NLM derived nitrogen loads to estimates from the Massachusetts Estuary Project (MEP). The MEP was developed for estuaries across the state during the past decade in an effort to quantify total maximum daily loads for impaired coastal waters. The MEP uses a Linked Watershed-Embayment model, which is largely similar in form to NLM but differs in the choice of net loading coefficients and areas of additional watershed attenuation. Nitrogen loads from this study were less than half those reported in MEP reports (specifically Wild, Quissett, West Falmouth, and Phinneys Harbors, Howes et al., 2005, 2006b, 2011a,b). While these differences are substantial, our total loads correlated well with MEP estimates (r2 = 0.99), and this result is consistent with differences between the NLM and MEP reported nitrogen loads to Waquoit Bay, MA. Valiela et al. (2016) report an update comparing the 1990 and 2014 nitrogen loads for the 6 sub-watersheds of Waquoit Bay. These loads were smaller on average by 46% from those reported in Howes et al. (2013) through the MEP process for the same sub-watersheds. While our loads are proportionally smaller than the MEP estimates the relative contributions by source are fairly consistent with estimates from the MEP process, suggesting the underlying land use, housing, and sewering datasets are comparable and both models have similar net relative loading rates to receiving waters.
The differences between results from MEP's Linked Watershed-Embayment model and the NLM largely reflect different watershed specific atmospheric deposition rates, different rates of nitrogen attenuation during transmission through the landscape, and MEP's “water-use” approach to wastewater rather than an average per-unit loading rate. The water-use approach may overestimate nitrogen sourced from septic systems, because, although the MEP accounts for “external” water use as 10% of the total, town water records do not distinguish between household water use and water used for outdoor purposes such as irrigation or filling swimming pools. Using average rates reported for the 5 overlapping watersheds with published MEP reports, the effective loading rates from septic systems may be up to a factor of 3 larger than those used in the NLM because of the different assumptions. Additionally, the NLM and the MEP approach differ in estimates of nitrogen loads from impervious surfaces. When estimating nitrogen from impervious surfaces, the NLM only accounts for atmospheric deposition, while the MEP approach assumes a constant nitrogen concentration and recharge rate from impervious surfaces that may include both atmospheric deposition and nitrogen from other sources laterally transported onto the impervious surfaces. This leads to larger effective loading rates from impervious surfaces (e.g., 15.2 vs. 1–3 kgN ha−1 yr−1, MEP vs. NLM). Finally, the approach in this analysis is limited because, with the exception of the West Falmouth Harbor wastewater treatment discharge, we do not account for groundwater transit time that may effect when a source of nitrogen actually reaches the estuary. However, a detailed analysis of groundwater flows is beyond the scope of this study.
Conclusion
The NLM serves as a useful tool in estimating nitrogen inputs into Buzzards Bay and highlighting which nitrogen sources contribute the most to total estuarine nitrogen loads. Across all watersheds, there was a general shift from natural landscapes to increased urbanized and impervious surface areas to accommodate increased coastal populations. Despite relatively consistent trends in nitrogen sources over the total area analyzed in this study, at the subwatershed level, localized impacts of land use change were more pronounced. For watersheds predominately located on the eastern side of Buzzards Bay, increased residency coupled with onsite septic systems resulted in increased or flat overall nitrogen loads that reflected dominant contributions from wastewater. Increased residency within most western watersheds however did not always result in increased loads to adjoining estuaries as a result of expansion of sewer networks and improvements to wastewater treatment facilities. Estimated nitrogen load trends for most western watersheds reflect the positive influence that local management strategies can have on mitigating anthropogenic influences on coastal ecosystems. Interestingly, the results from this analysis also highlight the importance of incorporating regional and global change into nutrient mitigation strategies. A changing climate can both directly and indirectly influence ecosystem responses to nitrogen load, manifested here as increased water column chlorophyll a for a given nitrogen load as water temperatures warmed over the past several decades. As our understanding of the influence of climate on coastal ecosystems expands, we can anticipate complex ecosystem responses to nutrient inputs and develop management strategies that incorporate influences from the local to the global scale.
Author Contributions
SW—Contributed substantially to the conception of the work; acquired, analyzed and interpreted data, wrote the initial draft from which edits/revisions would be based off of and continued to edit written manuscript until final draft was approved by all coauthors. JR—Contributed substantially to the conception of the work; acquired, analyzed and interpreted data, provided significant edits/revisions to all working drafts, contributed significantly to statistical analyses and data interpretation. JC—Made significant contributions to research concept; helped with data acquisition (a large fraction of the data that was used in this analysis was provided by the affiliated organization), statistical analyses and data interpretation. Provided significant edits/revisions to all working drafts. DG—Made significant contributions to research concept, statistical analyses and data interpretation. Provided significant edits/revisions to all working drafts. SD—Made significant contributions to research concept, statistical analyses and data interpretation. Provided significant edits/revisions to all working drafts.
Conflict of Interest Statement
The authors declare that the research was conducted in the absence of any commercial or financial relationships that could be construed as a potential conflict of interest.
Acknowledgments
This work was supported by the John D. and Catherine T. MacArthur Foundation (grant number 14-106159-000-CFP) and the MIT Sea Grant (subaward number 5710004045). This work was also supported by the United States Environmental Protection Agency under assistance agreement CE-96185701 to the Massachusetts Executive Office of Energy and Environmental Affairs to the Buzzards Bay National Estuary Program. We thank the Buzzards Bay Coalition for sharing their long-term water quality data that has been gathered since 1992 with the help of over 1000 volunteer Baywatchers. We also thank Dr. Gregory Berman at the Woods Hole Sea Grant for his assistance with data processing using ArcMap software.
Supplementary Material
The Supplementary Material for this article can be found online at: https://www.frontiersin.org/article/10.3389/fmars.2016.00279/full#supplementary-material
References
Alexander, L. V., Zhang, X., Peterson, T. C., Caesar, J., Gleason, B., Tank, A. M., et al. (2006). Global observed changes in daily climate extremes of temperature and precipitation. J. Geophys. Res. 111, 1–22. doi: 10.1029/2005JD006290
Anderson, D. M., Glibert, P. M., and Burkholder, J. M. (2002). Harmful algal blooms and eutrophication: nutrient sources, composition and consequences. Estuaries 25, 562–584. doi: 10.1007/BF02804901
Bolstad, P. V., and Swank, W. T. (1997). Cumulative Impacts of Landuse on water quality in a southern Appalachian watershed. J. Am. Water Res. Assoc. 33, 519–533. doi: 10.1111/j.1752-1688.1997.tb03529.x
Bouwman, A. F., Lee, D. S., Asman, W. A. H., Dentener, F. J., Van Der Hoek, K. W., and Olivier, G. J. (1997). A global high-resolution emission inventory for ammonia. Global Biogeochem. Cycles 11, 561–587. doi: 10.1029/97GB02266
Boyer, J. N., Christian, R. R., and Stanley, D. W. (1993). Pattern of Phytoplankton primary productivity in the Neuse River estuary, North Carolina. Mar. Ecol. Press Ser. 97, 287–297. doi: 10.3354/meps097287
Bricker, S. B., Longstaff, B., Dennison, W., Jones, A., Boicourt, K., Wicks, C., et al. (2008). Effects of nutrient enrichment in the nation's estuaries: a decade of change. Harmf. Algae 8, 21–32. doi: 10.1016/j.hal.2008.08.028
Collins, G., Kremer, J. N., and Valiela, I. I. (2000). Assessing uncertainty in estimates of nitrogen loading to estuaries for research, planning, and risk assessment. Environ. Manage. 25, 635–645 doi: 10.1007/s002670010050
Costa, J. E. (1988). Eelgrass in Buzzards Bay: Distribution, Production and Historical Changes in Abundance of Eelgrass (Zostera marine L.) in Southeastern, M. A. Ph.D Thesis, Boston University.
Costello, C. T., and Kenworthy, W. J. (2010). Twelve-Year Mapping and Change Analysis of Eelgrass (Zostera marina) Areal abundance in Massachusetts (USA) Identifies Statewide Declines. Estuar. Coasts 34, 232–242. doi: 10.1007/s12237-010-9371-5
Costello, J. H., Sullivan, B. K., Gifford, D. J., Keuren, D. V., and Sullivan, L. J. (2006). Seasonal refugia, shoreward thermal amplification, and metapopulation dynamics of the ctenophore Mnemiopsis leidyi in Narragansett Bay, Rhode Island. Limnol. Oceanogr. 51, 1819–1831. doi: 10.4319/lo.2006.51.4.1819
Daly, C. M., Halbleib, J. I., Smith, W. P., Gibson, M. K., Doggett, G. H., and Taylor, J. (2008). Physiographically sensitive mapping of climatological temperature and precipitation across the conterminous United States. Int. J. Climatol. 28, 2031–2064. doi: 10.1002/joc.1688
Dennis, R. L., and Mathur, R. (2001). Airshed domains for modeling atmospheric deposition of oxidized and reduced nitrogen to the Neuse/Pamlico system. Hydrol. Sci. Technol. 17, 107–117.
Doney, S. C., Mahowald, N., Lima, I., Feely, R. A., Mackenzie, F. T., Lamarque, J. F., et al. (2007). Impact of anthropogenic atmospheric nitrogen and sulfur deposition on ocean acidification and the inorganic carbon system. Proc. Natl. Acad. Sci. U.S.A. 104, 14580–14585. doi: 10.1073/pnas.0702218104
Dore, M. H. (2005). Climate change and changes in global precipitation patterns: what do we know? Environ. Int. 31, 1167–1181. doi: 10.1016/j.envint.2005.03.004
Fisher, T. R., Carlson, P. R., and Barber, R. T. (1982). Sediment nutrient regeneration in three North Carolina Estuaries. Estuar. Coast. Shelf Sci. 14, 101–116. doi: 10.1016/S0302-3524(82)80069-8
Fry, J., Xian, G., Jin, S., Dewitz, J., Homer, C., Yang, L., et al. (2011). Completion of the 2006 National Land Cover Database for the Conterminous United States. Photogramm. Eng. Remote Sensing 77, 858–864.
Galloway, J. N., Dentener, F. J., Capone, D. G., Boyer, E. W., Howarth, R. W., Seitzinger, S. P., et al. (2004). Nitrogen cycles: past, present and future. Biogeochemistry 70, 153–226. doi: 10.1007/s10533-004-0370-0
Glibert, P. M., Magnien, R., Lomas, C., Alexander, E., Fan, E., Haramoto, M., et al. (2001). Harmful algal blooms in the Chesapeake and coastal bays of Maryland, USA: Comparison of 1997, 1998, and 1999 events. Estuaries 24, 875–883 doi: 10.2307/1353178
Glibert, P. M., Magnien, R., Lomas, M. W., Alexander, J., Tan, C., Haramoto, E., et al. (2005). The role of eutrophication in the global proliferation of Harmful Algal Blooms. Oceanography 18, 198–209. doi: 10.5670/oceanog.2005.54
Hayn, M., Howarth, R., Marino, R., Ganju, N., Berg, P., Foreman, K. H., et al. (2014). Exchange of nitrogen and phosphorous between a shallow lagoon and Coastal Waters. Estuar. Coasts 37, 63–73. doi: 10.1007/s12237-013-9699-8
Homer, C., Dewitz, J., Fry, J., Coan, M., Hossain, N., Larson, C., et al. (2007). Completion of the 2001 National Land Cover Database for the Conterminous United States. Photogramm. Eng. Remote Sensing 73, 337–341.
Homer, C. G., Dewitz, J. A., Yang, L., Jin, S., Danielson, P., Xian, G., et al. (2015). Completion of the 2011 National Land Cover Database for the conterminous United States-Representing a decade of land cover change information. Photogramm. Eng. Remote Sensing 81, 345–354. doi: 10.14358/PERS.81.5.345
Howarth, R. W., Hayn, M., Marino, R. M., Ganju, N., Foreman, K., McGlathery, K., et al. (2014). Metabolism of a nitrogen-enriched coastal marine lagoon during the summertime. Biogeochemistry 118, 1–20. doi: 10.1007/s10533-013-9901-x
Howarth, R. W., and Marino, R. (2006). Nitrogen as the limiting nutrient for eutrophication in coastal marine ecosystems: evolving views over three decades. Limnol. Oceanogr. 51, 364–376. doi: 10.4319/lo.2006.51.1_part_2.0364
Howarth, R. W., Swaney, D. P., Butler, T. J., and Marino, R. (2000). Climatic Control on Eutrophication of the Hudson River Estuary, Ecosystems 3, 210–215. doi: 10.1007/s100210000020
Howes, B., Eichner, E., Acker, R., Ramsey, J., and Schlezinger, D. (2012). Massachusetts Estuaries Project Linked Watershed-Embayment Approach to Determine Critical Nitrogen Loading Thresholds for the Westport River Embayment System. Town of Westport, MA; Boston, MA: Massachusetts Department of Environmental Protection.
Howes, B., Eichner, E. M., Kelley, S., Samimy, R. I., Ramsey, J. S., Schlezinger, D. R., et al. (2011b). Massachusetts Estuaries Project Linked Watershed-Embayment Modeling Approach to Determine Critical Nitrogen Loading Thresholds for the Wild Harbor Embayment Systems. Town of Falmouth, MA; Boston, MA: Massachusetts Department of Environmental Protection.
Howes, B., Kelley, S. W., Ramsey, J. S., Eichner, E., Samimy, R., Schlezinger, D., et al. (2011a). Massachusetts Estuaries Project Linked Watershed-Embayment Model to Determine Critical Nitrogen Loading Thresholds for the Quissett Harbor Embayment Systems. Town of Falmouth, MA; Boston, MA: Massachusetts Department of Environmental Protection.
Howes, B., Kelley, S. W., Ramsey, J. S., Samimy, R., Schlezinger, D., and Eichner, E. (2005). Linked Watershed-Embayment Model to Determine Critical Nitrogen Loading Thresholds for West Falmouth Harbor. Falmouth, MA; Boston, MA: Massachusetts Estuaries Project, Massachusetts Department of Environmental Protection.
Howes, B., Kelley, S. W., Ramsey, J. S., Samimy, R., Schlezinger, D., and Eichner, E. (2006a). Linked Watershed-Embayment Model to Determine Critical Nitrogen Loading Thresholds for Three Bays. Barnstable, MA: Massachusetts Estuaries Project, Massachusetts Department of Environmental Protection.
Howes, B., Samimy, R., Schlezinger, D., Eichner, E., Kelley, S., Ramsey, J., et al. (2013). Massachusetts Estuaries Project Linked Watershed-Embayment Approach to Determine Critical Nitrogen Loading Thresholds for the Waquoit Bay and Eel Pond Embayment Systems Towns of Falmouth and Mashpee, Massachusetts. Boston, MA: Massachusetts Department of Environmental Protection.
Howes, B., Kelley, S. W., Ramsey, J. S., Samimy, R., Schlezinger, D., and Eichner, E. (2006b). Linked Watershed-Embayment Model to Determine Critical Nitrogen Loading Thresholds for the Phinneys Harbor – Eel Pond – Back River System. Bourne, MA; Boston, MA: Massachusetts Estuaries Project, Massachusetts Department of Environmental Protection.
Huang, J., Li, Q., Tu, Z., Pan, C., Zhang, L., Ndokoye, P., et al. (2013). Quantifying land-based pollutant loads into coastal area with sparse data: methodology and application in China. Ocean Coast. Manag. 14–28. doi: 10.1016/j.ocecoaman.2012.07.011
Hughes, J. E., Deegan, L. A., Wyda, J. C., Weaver, M. J., and Wright, A. (2002). The effects of eelgrass habitat loss on Estuarine Fish Communities of Southern New England. Estuaries 25, 235–249. doi: 10.1007/BF02691311
Kimmel, D. G., McGlaughon, B. D., Leonard, J., Paerl, H. W., Taylor, J. C., Cira, E. K., et al. (2015). Mesozooplankton abundance in relation to the chlorophyll maximum in the Neuse River Estuary, North Carolina, USA: implications for trophic dynamics. Estuar. Coast. Shelf Sci. 157, 59–68. doi: 10.1016/j.ecss.2015.02.014
Krotkov, N. A., McLinden, C. A., Li, C., Lamsal, L. M., Celarier, E. A., Marchenko, S. V., et al. (2015). Aura OMI observations of regional SO2 and NO2 pollution change from 2005 to 2014, Atmos. Chem. Phys. Discuss. 15, 26555–26607. doi: 10.5194/acpd-15-26555-2015
Latimer, J. S., and Charpentier, M. (2010). Nitrogen inputs into seventy-four southern New England estuaries: application of a watershed nitrogen-loading model. Estuar. Coast. Shelf Sci. 89, 125–136. doi: 10.1016/j.ecss.2010.06.006
Lee, S. W., Hwang, S. J., Lee, S.-B., Hwang, H.-S., and Sung, H.-C. (2009). Landscape ecological approach to the relationships of land use patterns in watersheds to water quality characteristics. Landsc. Urban Plan. 92, 80–89. doi: 10.1016/j.landurbplan.2009.02.008
Lehmann, C. M. B., Bowersox, V. C., and Larson, S. M. (2005). Spatial and temporal trends of precipitation chemistry in the United States, 1985-2002. Environ. Pollut. 135, 347–361. doi: 10.1016/j.envpol.2004.11.016
Lewandowska, A. M., Breithaupt, P., Hillebrand, H., Hoppe, H.-G., Jurgens, K., and Sommer, U. (2012). Responses of primary productivity to increased temperature and phytoplankton diversity. J. Sea Res. 72, 87–93. doi: 10.1016/j.seares.2011.10.003
MassGIS (2002). MassGIS Data – Land Use (1951-1999). Available online at: http://www.mass.gov/anf/research-and-tech/it-serv-and-support/application-serv/office-of-geographic-information-massgis/datalayers/lus.html (Accessed 01, 2015).
MassGIS (2009). MassGIS Data – Land Use (2005). Available online at: http://www.mass.gov/anf/research-and-tech/it-serv-and-support/application-serv/office-of-geographic-information-massgis/datalayers/lus2005.html (Accessed 01, 2015).
McGlathery, K. J., Sundbäck, K., and Anderson, I. C. (2007). Eutrophication in shallow coastal bays and lagoons: the role of plants in the coastal filter. Mar. Ecol. Prog. Ser. 348, 1–18. doi: 10.3354/meps07132
National Oceanic Atmospheric Administration, Office for Coastal Management-a. (1996). Coastal Change Analysis Program (C-CAP) Regional Land Cover. Charleston, SC: NOAA Office for Coastal Management (Accessed 01, 2015).
National Oceanic Atmospheric Administration, Office for Coastal Management-b. (2001). Coastal Change Analysis Program (C-CAP) Regional Land Cover. Charleston, SC: NOAA Office for Coastal Management (Accessed 01, 2015).
National Oceanic Atmospheric Administration, Office for Coastal Management-c. (2006). Coastal Change Analysis Program (C-CAP) Regional Land Cover. Charleston, SC: NOAA Office for Coastal Management (Accessed 01, 2015).
National Oceanic Atmospheric Administration, Office for Coastal Management-d. (2010). Coastal Change Analysis Program (C-CAP) Regional Land Cover. Charleston, SC: NOAA Office for Coastal Management (Accessed 01, 2015).
National Oceanic Atmospheric Administration Office for Coastal Management-e (2015). Frequent Questions. Coastal Change Analysis Program (C-CAP) Regional Land Cover. Charleston, SC: NOAA Office for Coastal Management (Accessed 01, 2015).
Nixon, S. W. (1995). Coastal marine eutrophication: a definition, social causes, and future concerns. Ophelia 41, 199–219. doi: 10.1080/00785236.1995.10422044
Nixon, S. W., Oviatt, C. A., and Hale, S. S. (1976). “Nitrogen regeneration and the metabolism of coastal marine bottom communities,” in The Role of Terrestrial and Aquatic Organisms in Decomposition Processes. 17th Symposium of the British Ecological Society, eds J. M. Anderson and A. MacFadyen (Oxford: Blackwell Scientific Publications), 269–283.
Orth, R. J., Carruthers, T. J. B., Dennison, W. C., Duarte, C. M., Fourqurean, J. W., Heck, J. R., et al. (2006). A global crisis for seagrass ecosystems. Bioscience 56, 987–996. doi: 10.1641/0006-3568(2006)56[987:AGCFSE]2.0.CO;2
Paerl, H. W., Pinckney, J. L., Fear, J. M., and Peierls, B. L. (1998). Ecosystem responses to internal and watershed organic matter loading: consequences for hypoxia in the eutrophying Neuse River Estuary, North Carolina, U. S. A. Mar. Ecol. Progr. Series 166, 17–25. doi: 10.3354/meps166017
Pitter, A. A., and Cronin, S. R (2015). Property Type Classification Codes-Non-arm's Length Codes and Sales Report Spreadsheet Specifications, Prepared by the Bureau of Local Assessment. Available online at: http://www.mass.gov/dor/docs/dls/bla/classificationcodebook.pdf
Purcell, J. E. (2012). Jellyfish and ctenophore blooms coincide with human proliferations and environmental perturbations. Ann. Rev. Mar. Sci. 4, 209–235 doi: 10.1146/annurev-marine-120709-142751
Rabalais, N. N., Turner, R. E., and Wiseman, W. J. (2001). Hypoxia in the Gulf of Mexico. J. Environ. Qual. 30, 320–329. doi: 10.2134/jeq2001.302320x
Randall, J. M., and Day, J. W. Jr. (1997). Effects of River Discharge and vertical circulation on aquatic primary production in a turbid Louisiana estuary, Netherlands. J. Sea Res. 21, 231–242. doi: 10.1016/0077-7579(87)90015-9
Rheuban, J. E., Williamson, S., Costa, J. E., Glover, D. M., Jakuba, R. W., McCorkle, D. C., et al. (2016). Spatial and temporal trends in summertime climate and water quality indicators in the coastal embayments of Buzzards Bay, Massachusetts. Biogeosciences 13, 253–265. doi: 10.5194/bg-13-253-2016
Rothenberger, M. B., Burkholder, J. M., and Brownie, C. (2009). Long-term effects of changing land use practices on surface water quality in a coastal river and lagoonal estuary. Environ. Manag. 44, 505–523. doi: 10.1007/s00267-009-9330-8
Sampou, P. A., and Kemp, W. M. (1994). Factors regulating plankton community respiration in the Chesapeake Bay. Mar. Ecol. Prog. Ser. 110, 249–258. doi: 10.3354/meps110249
Schoonover, J. E., Lockaby, B. G., and Pan, S. (2005). Changes in chemical and physical properties of stream water across an urban–rural gradient in western Georgia. Urban Ecosys. 8, 107–124. doi: 10.1007/s11252-005-1422-5
Schwede, D. B., and Lear, G. G. (2014). “A novel hybrid approach for estimating total deposition in the United States,” in US Environmental Protection Agency Papers. Paper 219. Available online at: http://digitalcommons.unl.edu/usepapapers/219
Selman, M., Greenhalgh, S., Diaz, R., and Sugg, Z. (2008). “Eutrophication and Hypoxia in Coastal Areas: a global assessment of the state of knowledge, in WRI Policy Note Water Quality: Eutrophication and Hypoxia No.1 (Washington, DC: World Resources Institute). Available online at: http://www.wri.org/publication/eutrophication-and-hypoxia-coastal-areas
Short, F. T., and Burdick, D. M. (1996). Quantifying eelgrass habitat loss in relation to housing development and nitrogen loading in Waquoit Bay, Massachusetts. Estuaries 19, 730–739. doi: 10.2307/1352532
Shumway, S. E. (1990). A review of the Effects of Algal Blooms on Shellfish and Aquaculture. J. World Aquacult. Soc. 21, 65–104. doi: 10.1111/j.1749-7345.1990.tb00529.x
Smith, K. (1999). Salt Marsh Uptake of Watershed Nitrate, Mashapaquit Creek Marsh, West Falmouth Harbor, Falmouth, Cape Cod, Massachusetts. Masters Thesis, Boston University Department of Earth Sciences, Boston, MA.
Smith, S., Pisaturo, T., and Tedesco, R. G. (1989). Land use changes in the Buzzards Bay Drainage Area-1951-1984. Technical Report, Taunton, MA.
Sullivan, B. K., Costello, J. H., and Van Keuren, D. (2007). Seasonality of the copepods Acartia hudsonica and Acartia tonsa in Narragansett Bay, R. I., USA during a period of climate change. Estuar. Coast. Shelf Sci. 73, 259–267 doi: 10.1016/j.ecss.2007.01.018
Tong, S. T. Y., and Chen, W. (2002). Modeling the relationship between land use and surface water quality. J. Environ. Manag. 66, 377–393. doi: 10.1006/jema.2002.0593
Turner, J. T., Borkman, D. G., Lincoln, J. A., Gauthier, D. A., and Petitpas, C. M. (2009). Phytoplankton studies in Buzzards Bay, Massachusetts, U. S. A., VI., Phytoplankton and water quality, 1987 to 1998. Mar. Ecol.-Prog. Ser. 376, 103–122. doi: 10.3354/meps.07783
US Department of Agriculture (1994). 1992 Census of Agriculture. Available online at: www.agcensus.usda.gov
US Department of Agriculture (2004). 2002 Census of Agriculture. Available online at: www.agcensus.usda.gov
US Department of Agriculture (2014). 2012 Census of Agriculture. Available online at: www.agcensus.usda.gov
US Environmental Protection Agency (1988). NWQEP 1987 Annual Report Status of Agricultural Nonpoint Source Projects: National Water Quality Evaluation Project. Vol. 217. Washington, DC.
Valiela, I., and Bowen, J. L. (2002). Nitrogen sources to watersheds and estuaries: the role of land cover mosaics and losses with watersheds. Environ. Pollut. 118, 239–248. doi: 10.1016/S0269-7491(01)00316-5
Valiela, I., Collins, G., Lajtha, K., Geist, M., Seely, B., Brawley, J., et al. (1997). Nitrogen loading from coastal watersheds to receiving estuaries: new method and application. Ecol. Applicat. 7, 358–380. doi: 10.1890/1051-0761(1997)007[0358:NLFCWT]2.0.CO;2
Valiela, I., Owens, C., Elmstrom, E., and Loret, J. (2016). Eutrophication of Cape Cod estuaries: effect of decadal changes in global-driven atmospheric and local-scale wastewater nutrient loads. Mar. Pollut. Bull. 110, 309–315. doi: 10.1016/S0269-7491(01)00316-5
Waycott, M., Duarte, C. M., Carruthers, T. J., Orth, R. J., Dennison, W. C., Olyarnik, S., et al. (2009). Accelerating loss of seagrasses across the globe threatens coastal ecosystems. Proc. Natl. Acad. Sci. U.S.A. 106, 12377–12381. doi: 10.1073/pnas.0905620106
Keywords: nitrogen loading, eutrophication, climate change, water quality
Citation: Williamson SC, Rheuban JE, Costa JE, Glover DM and Doney SC (2017) Assessing the Impact of Local and Regional Influences on Nitrogen Loads to Buzzards Bay, MA. Front. Mar. Sci. 3:279. doi: 10.3389/fmars.2016.00279
Received: 17 August 2016; Accepted: 13 December 2016;
Published: 06 January 2017.
Edited by:
Mario Barletta, Federal University of Pernambuco, BrazilReviewed by:
Bernardo Duarte, Marine and Environmental Sciences Centre (MARE), PortugalJia-Jang Hung, National Sun Yat-sen University, Taiwan
Perran Cook, Monash University, Australia
Copyright © 2017 Williamson, Rheuban, Costa, Glover and Doney. This is an open-access article distributed under the terms of the Creative Commons Attribution License (CC BY). The use, distribution or reproduction in other forums is permitted, provided the original author(s) or licensor are credited and that the original publication in this journal is cited, in accordance with accepted academic practice. No use, distribution or reproduction is permitted which does not comply with these terms.
*Correspondence: Jennie E. Rheuban, jrheuban@whoi.edu