Influence of Natural Oxygenation of Baltic Proper Deep Water on Benthic Recycling and Removal of Phosphorus, Nitrogen, Silicon and Carbon
 Per O. J. Hall1*
  Elin Almroth Rosell2
  Stefano Bonaglia3†
  Andrew W. Dale4
  Astrid Hylén1
  Mikhail Kononets1
  Madeleine Nilsson1
  Stefan Sommer4
  Sebastiaan van de Velde5 Lena Viktorsson2
- 1Department of Marine Sciences, University of Gothenburg, Gothenburg, Sweden
- 2Swedish Meteorological and Hydrological Institute, Oceanographic Research, Västra Frölunda, Sweden
- 3Department of Geology, Lund University, Lund, Sweden
- 4GEOMAR Helmholtz-Zentrum für Ozeanforschung Kiel, Kiel, Germany
- 5Department of Analytical, Environmental and Geo-Chemistry, Vrije Universiteit Brussel, Brussels, Belgium
At the end of 2014, a Major Baltic Inflow (MBI) brought oxygenated, salty water into the Baltic proper and reached the long-term anoxic Eastern Gotland Basin (EGB) by March 2015. In July 2015, we measured benthic fluxes of phosphorus (P), nitrogen (N) and silicon (Si) nutrients and dissolved inorganic carbon (DIC) in situ using an autonomous benthic lander at deep sites (170–210 m) in the EGB, where the bottom water oxygen concentration was 30–45 μM. The same in situ methodology was used to measure benthic fluxes at the same sites in 2008–2010, but then under anoxic conditions. The high efflux of phosphate under anoxic conditions became lower upon oxygenation, and turned into an influx in about 50% of the flux measurements. The C:P and N:P ratios of the benthic solute flux changed from clearly below the Redfield ratio (on average about 70 and 3–4, respectively) under anoxia to approaching or being well above the Redfield ratio upon oxygenation. These observations demonstrate retention of P in newly oxygenated sediments. We found no significant effect of oxygenation on the benthic ammonium, silicate and DIC flux. We also measured benthic denitrification, anammox, and dissimilatory nitrate reduction to ammonium (DNRA) rates at the same sites using isotope-pairing techniques. The bottom water of the long-term anoxic EGB contained less than 0.5 μM nitrate in 2008–2010, but the oxygenation event created bottom water nitrate concentrations of about 10 μM in July 2015 and the benthic flux of nitrate was consistently directed into the sediment. Nitrate reduction to both dinitrogen gas (denitrification) and ammonium (DNRA) was initiated in the newly oxygenated sediments, while anammox activity was negligible. We estimated the influence of this oxygenation event on the magnitudes of the integrated benthic P flux (the internal P load) and the fixed N removal through benthic and pelagic denitrification by comparing with a hypothetical scenario without the MBI. Our calculations suggest that the oxygenation triggered by the MBI in July 2015, extrapolated to the basin-wide scale of the Baltic proper, decreased the internal P load by 23% and increased the total (benthic plus pelagic) denitrification by 18%.
Introduction
Biogeochemical and early diagenetic processes (recently reviewed by Aller, 2014) make sediments act as both sources and sinks for N, P, Si, and C. Sediments supply dissolved inorganic N (DIN; in the form of ammonium and often nitrate), P (phosphate), Si (silicate), and C (DIC) to overlying waters, and act in this way as a source to the water column of these dissolved inorganic forms of the elements. Mineralization of organic matter containing N, P, and C, and dissolution of biogenic Si, in sediment produces nutrients and DIC, which are dissolved in the sediment pore water and then released to the water column as a benthic flux. Degradation of organic matter in sediments also produces dissolved organic N (DON), P (DOP), and C (DOC), which may be released to the water column and contribute to the benthic flux (Ståhl et al., 2004; Ekeroth et al., 2012, 2016a,b). A fraction (in some sediments significant) of the particulate organic matter containing N, P, and C, and of biogenic Si, which is deposited from overlying waters on the sea-floor, is not mineralized and recycled, but will undergo burial in the sediment (reviewed by Burdige, 2007). The elements are hereby removed from the oceanic-atmospheric biogeochemical cycles for very long time-scales. The sediment in this way acts as a sink for the elements. Another sink for fixed N in sediments is the transformation of bioavailable dissolved inorganic N to dinitrogen gas, N2, via denitrification and anammox (e.g., Thamdrup and Dalsgaard, 2002; Dalsgaard et al., 2005).
The Baltic Sea is the second largest brackish water basin in the world after the Black Sea. There is a strong stratification of the water column with a permanent halocline at around 60–80 m depth. Since the residence time of the water in the Baltic is as long as 25–35 years, and the average depth is not more than about 60 m, sediments here play an essential role in the biogeochemical cycles of nutrient elements and carbon. The semi-permanent anoxic conditions in the Baltic are due to the limited water exchange with the Kattegat and the strong vertical stratification (e.g., Kullenberg and Jacobsen, 1981; Stigebrandt, 2001). These physical characteristics in combination with an increased nutrient supply have led to an increased frequency of cyanobacteria blooms in the Baltic proper since the 1960s (e.g. Finni et al., 2001; Wasmund et al., 2001). The frequent, sometimes toxic, cyanobacteria blooms and high P concentrations in the basin water have been explained by a positive feedback between increased bottom hypoxia and release of P from iron oxyhydroxides (e.g., Conley et al., 2002; Gustafsson and Stigebrandt, 2007; Vahtera et al., 2007). Roughly 0.5 million tons N is imported to the Baltic Sea annually through N2 fixation by pelagic cyanobacteria (Vahtera et al., 2007; Nausch et al., 2012, and references therein). Nitrogen-fixing cyanobacteria are limited by P, and the blooms are triggered by low N:P ratios in the nutrient pool (e.g., Nausch et al., 2012). The low N:P ratios are caused by removal of fixed nitrogen (denitrification and anammox) at both the oxycline/nitracline in water column (Dalsgaard et al., 2013) and in sediments underlying oxygenated or at least nitrate containing bottom water (Tuominen et al., 1998; Deutsch et al., 2010) together with enhanced benthic P regeneration due to oxygen depletion in deep waters (Jilbert et al., 2011; Viktorsson et al., 2013a). The change in the bottom area covered by hypoxic water in the Baltic Sea, but not the external P load, has been found to correlate well with variations in the dissolved water column P pool size (Conley et al., 2002; Stigebrandt et al., 2014). This correlation indirectly indicates the importance of oxygen in regulating the capacity of sediments to release/retain P in the Baltic Sea. In addition, it was recently shown that the rate of sedimentary deposition and degradation of organic matter controls the benthic P flux under long term anoxic conditions in Baltic Sea basins and in west-Swedish fjords (Viktorsson et al., 2012, 2013a,b). Furthermore, the benthic solute flux under anoxic conditions in these basins was found to be very P rich in relation to both C and N. Hence, oxygen does not only control the magnitude of the dissolved bioavailable N, P (e.g., Bonaglia et al., 2013) and sometimes even Si flux (Ekeroth et al., 2016a), but may also have a strong influence on the N:P, C:P, and Si:P ratios in benthic fluxes, and thus indirectly on abundance and composition of phytoplankton and cyanobacteria communities in surface waters.
An intrusion of oxygenated salty water into the Baltic proper started at the end of 2014. This is the largest Major Baltic Inflow (MBI) since 1951, and the third largest since oceanographic measurements in the Baltic Sea began in 1880 (Mohrholz et al., 2015). MBIs are episodic and unpredictable, and on short time-scales the most effective way to ventilate and oxygenate the deep water of the Baltic proper. A majority of these inflows can be explained from variations in the atmospheric sea-level pressure fields, and the stagnation periods in the deep water are caused by the lack of atmospheric forcing (Schimanke et al., 2012). Causes and effects of MBIs were reviewed by Matthäus et al. (2008) and Reissmann et al. (2009) reviewed the physical dynamics and mixing processes of the inflowing waters.
We made repeated in situ measurements of benthic nutrient and DIC fluxes in the EGB during 2008–2010. In this time period the water column below about 100 m depth was anoxic, and these measurements comprised stations with fully anoxic bottom water conditions. The MBI of oxygenated salty water, which started at the end of 2014, reached the EGB in March 2015 (IOW Baltic Sea Research Institute Warnemünde, 2015). Nature thus gave us a unique opportunity to repeat the same type of measurements we previously did at fully anoxic stations, but under oxygenated conditions generated by the recent MBI. This paper presents novel results on the effect of this natural oxygenation of previously long-term anoxic Baltic bottoms on rates and extent of recycling and removal of nutrient elements and carbon in sediments including denitrification, anammox and DNRA.
Materials and Methods
Study Area
The Eastern Gotland Basin (EGB) is among the most well studied basins of the Baltic proper. The EGB comprises the water body between the island of Gotland (Sweden) and Latvia. The maximum depth is about 250 m.
We visited two stations in the EGB during an expedition with R/V “Skagerak” in early July 2015; station E and F at depths of about 170 and 210 m, respectively. We made two autonomous benthic lander (see below) deployments and collected sediment with a box-corer at each station. The study area and locations of the stations are shown in Figure 1, and exact dates of visits, coordinates and bottom water characteristics for the two lander deployments at each station are given in Table 1.
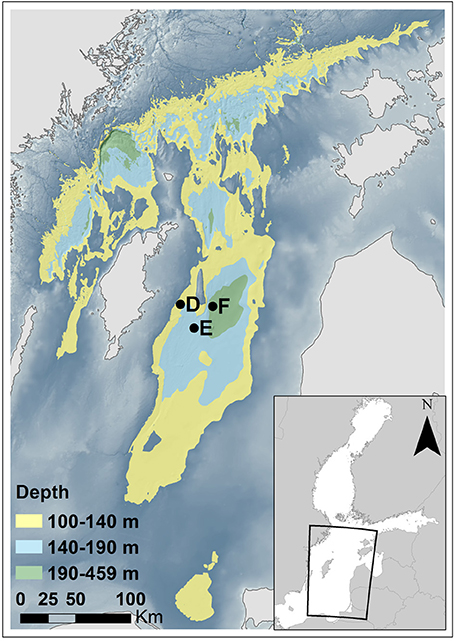
Figure 1. Map of the northern and central Baltic proper. Stations E and F were visited in July 2015 (this study); at this time the water at these sites was oxygenated below 140 m depth due to the MBI. The coordinates and water depths of these stations are presented in Table 1. Stations D, E, and F were visited by Viktorsson et al. (2013a) in 2008 and 2010 under anoxic bottom water conditions. Bottom areas at water depths of 100–140, 140–190, and 190–459 m are indicated in yellow, light blue, and green color, respectively. The background color indicates bottom areas at water depths shallower than 100 m. Depth data from the Baltic Sea Hydrographic Commission (2013), Baltic Sea Bathymetry Database verstion 0.9.3, downloaded from http://data.bshc.pro/ on 2016-09-22. The figure was created using the software ArcGIS 10.3.1 for Desktop [Environmental Systems Research Institute (ESRI, 2015), Redlands, CA].
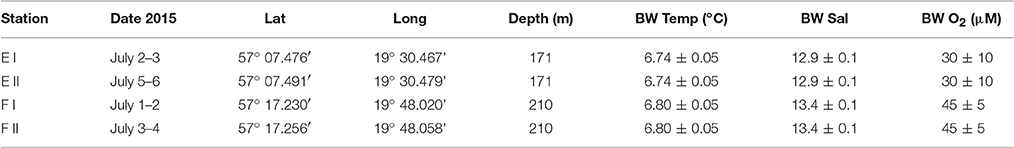
Table 1. Dates, coordinates, water depths and bottom water (BW) characteristics (average and STD for temperature, salinity and oxygen concentration measured 0.5 m above the seafloor in situ by sensors on the benthic lander) for the two lander deployments (I and II) at each of stations E and F.
Benthic In Situ Flux Measurements
Benthic fluxes of nutrients, DIC and oxygen were measured in situ using chambers of the autonomous big Gothenburg benthic lander (e.g., Brunnegård et al., 2004; Almroth et al., 2009; Viktorsson et al., 2013a). This lander carries four square (20 × 20 cm) benthic chambers with rounded corners. Prior to the chamber incubations, and just after the lander had reached the seafloor, the chambers were ventilated in the bottom water just above seafloor for about 2 h with stirring on, and for 2–4 additional hours inserted into sediment with lid open and stirring on. This procedure was undertaken to allow oxygen dissolved in the material of the chamber (polycarbonate) to diffuse out into the low oxygen bottom water, and to ascertain that the chambers were completely filled with ambient bottom water. Sediment and overlying water were then incubated in the four chambers (with lids closed) for about 20 h during which nine samples were taken autonomously with syringes from each chamber. The lander was then recovered and water samples were collected from the syringes. Nutrient and DIC samples were filtered through pre-cleaned 0.45 μm pore size cellulose acetate filters on-board immediately after sampling. The nutrient samples were then stored at 4 to 6°C until analysis on land immediately after the expedition. Nutrients were determined with a standard colorimetric method (modified after Koroleff, 1983) applied in segmented-flow analysis (SFA). The measurement uncertainty was 0.5 μg L−1 for ammonium, 0.3 μg L−1 for nitrate + nitrite, 0.2 μg L−1 for nitrite, 0.5 μg L−1 for phosphate and 2.5% for silicate for the actual concentration ranges obtained.
Determination of DIC in chamber samples was performed on-board ship immediately after lander recovery using an automated system based on non-dispersive infrared detection of CO2 (Goyet and Snover, 1993; O'Sullivan and Millero, 1998). Prior to detection, all of the dissolved carbonate species in the samples were driven to CO2 gas by acidification with phosphoric acid followed by nitrogen gas stripping. Running replicate measurements (n = 10) of certified reference material (CRM, Dickson Laboratories, Scripps Inst. of Oceanography, California), using a sample loop of 4 ml, an analytical precision of 0.2% RSD (SD × 100/mean) was obtained. The instrument was furthermore calibrated and corrected for drift with this CRM.
Salinity, temperature, and oxygen sensors that continuously measured ambient conditions in the bottom water during the deployments were mounted on the lander. Each chamber was also equipped with oxygen (optodes), salinity and temperature sensors for calculation of chamber volume (salinity), detection of possible leakage (salinity and oxygen) and measurement of total oxygen uptake rates. Chamber volume, a necessary parameter when calculating the benthic flux, was calculated by injection of a known volume of MQ water (around 56 to 59 mL, which normally is 0.5 to 1% of the chamber volume), and the chamber volume was then calculated from the measured salinity decrease and the MQ volume injected. Using data from sensors inside and outside chambers, occasional leakage of chambers could easily be detected. Flux data from leaking chambers were discarded. A more detailed description of the landers is given in e.g., Ståhl et al. (2004), and of the chambers and their hydrodynamics in e.g., Tengberg et al. (2004).
Benthic fluxes for each solute were calculated from the concentration change per unit of area and time in every chamber. First, the measured concentrations were corrected for the small dilution that occurred every time ambient bottom water, through a metal loop, entered the chamber when a sample was taken. A linear least squares regression (LLSR) was subsequently used to find the slope of the concentrations in the syringe samples vs. time. The model was applied using the function “lm” (CRAN:stats) in the open-source software R (https://www.r-project.org/), which implements the equations from Chambers (1992) and Wilkinson and Rogers (1973). Benthic fluxes were ultimately calculated by multiplying the slope value of the regression with the chamber height, which was obtained from chamber volume (see above) and the known sediment surface area incubated by the chambers (400 cm2).
Prior to the LLSR, two different types of outliers were identified. The first type is based on the studentized deleted residual index (SDRI), which indicates if a data point is unusual for the fitted model. Since the increase or decrease of nutrient and DIC concentration over time in a benthic chamber is expected to be linear, observations with SDRIs higher than 2 were assumed to be outliers. The second type is called a leverage point and is based on the Cook's distance, which is a statistical value that indicates whether one observation strongly influences the estimated model parameters (i.e., slope and intercept). A Cook's distance value higher than 1 was assumed to be a leverage point. Both these outliers were identified using the functions “rstudent” and “cooks.distance” (CRAN:stats) from Fox and Weisberg (2011), based on well accepted outlier diagnostics described by e.g., Belsley et al. (1980), Cook and Weisberg (1982), and Williams (1987). If a point was identified as an outlier by either method, it was excluded from the calculations. We identified, at each station, 0–2 outliers for each solute in each chamber, i.e., 7–9 data points were used to determine each flux of each solute.
Fluxes were considered to be significant when the p-value of the LLSR was lower than 0.05. When the concentration change in a chamber was small and the regression slope was close to zero, minor scatter around the slope line could cause the p-value to rise above 0.05. In these cases, two more conditions were used in order to avoid systematically discarding low fluxes, following Ekeroth et al. (2016b) with minor modifications. First, the regression slope was multiplied with the total incubation time to calculate the expected concentration change. If this expected change was smaller than the analytical uncertainty, it was assumed that the incubation time had been too short to produce a change that was large enough to capture analytically. The second condition was the goodness-of-fit. In order to select only the high quality fits, fluxes with an R2 value smaller than 0.3 were discarded, while fluxes with a higher R2 value were retained. Since the identified low fluxes were not statistically different from 0, they were retained in the data set as zero fluxes.
Benthic solute fluxes from the anoxic (2008 and 2010; Viktorsson et al., 2013a; Nilsson et al., in prep; Hall et al., unpublished results) and newly oxygenated (2015; this study) bottoms were compared using t-tests. This was followed by a post-hoc power analysis performed with the software G*Power 3.1 (Faul et al., 2007).
Sediment Core Incubations Using 15N
In order to determine rates of denitrification and DNRA a set of sediment cores was incubated after addition of 15 to the overlying water (De Brabandere et al., 2015). Briefly, plastic liners (n = 15, 3.6 cm inner diameter, 25 cm length) were used to subsample a sediment box-core, and half sediment and half water were collected. The sediment cores were transferred into a 25 L incubation tank that had been filled with ambient bottom water, situated in a temperature-controlled room kept at bottom water temperature. The oxygen concentration in the tank was adjusted to the bottom water oxygen concentration by bubbling with the appropriate mixture of N2 and air. Subsequently, 7 mL of a 200 mM 15 solution - prepared by dissolving Na15NO3 (99.4 atom%, Sigma-Aldrich) in distilled water—was added to the water tank in order to reach a 15 concentration of ~70 μM. The incubation started after a lag time of ~2 h, which was necessary to homogeneously mix the added nitrate with the endogenous nitrate and to establish a linear production of 15N2 within the sediment. At the beginning of the incubation the cores were capped with rubber stoppers, and the water phase was stirred by externally driven magnetic bars. The O2 concentration was constantly monitored in one of the cores to make sure it did not decrease below 30–35% of the initial value. Triplicate cores were sampled directly after the addition of the 15 and at regular intervals (~3 h) during the incubation, which lasted 12 h. The incubation was terminated by mixing the water phase with the sediment. Slurry samples (15N2 analysis) were collected in 12 mL Exetainers to which 200 μL of a 37% formaldehyde solution was added. An additional sample of the slurry (15 analysis) was taken from each core, the pore water extracted with a Rhizon sampler (Rhizon SMS, Rhizosphere), transferred into a plastic vial and immediately frozen.
Anoxic Slurry Incubations Using 15N
Anoxic slurry incubations amended with 15 and 15 were performed in order to estimate the anammox contribution to total N2 production (Thamdrup and Dalsgaard, 2002; Risgaard-Petersen et al., 2003). Our experiments followed the procedure described in Bonaglia et al. (2014). Briefly, the top 2 cm of two sediment cores (9 cm inner diameter) were extruded, homogenized and 100 ml of this sediment was transferred to a glass bottle filled with 900 mL filtered and anoxic bottom water. All operations were carried out in a temperature-controlled room kept at bottom water temperature. The bottle with the sediment slurry was purged with N2 for 10 min to remove any oxygen entering during previous operations, and it was dispensed through a Viton™ tubing into a series of 12 mL Exetainers, each containing a 4 mm glass bead. Vigorous shaking of the bottle while filling the Exetainers maintained the slurry homogenous throughout dispensation. The Exetainers (n = 35) were filled to the top and capped right after avoiding bubbles. The samples were pre-incubated for ~10 h on a rotating stirrer to remove any residual oxygen and nitrate. After that 15 Exetainers received 150 μL of an anoxic 9 mM 15 solution (final 15 concentration 113 μM); 15 Exetainers received 150 μL of an anoxic 9 mM 15 + 14 solution (final 15 and 14 concentrations 113 μM); and 5 Exetainers were left unamended and served as control. Triplicate vials from each treatment plus one control (n = 7) were sampled right after the addition by injecting 200 μL of a 37% formaldehyde solution into the Exetainers. The rest of the Exetainers (n = 28) were incubated on the rotating stirrer for 8 h. Triplicate vials plus one control were sampled at regular intervals of ~2 h.
An illustration of the various steps in the sediment core and anoxic slurry incubations using 15N is given in Figure 2.
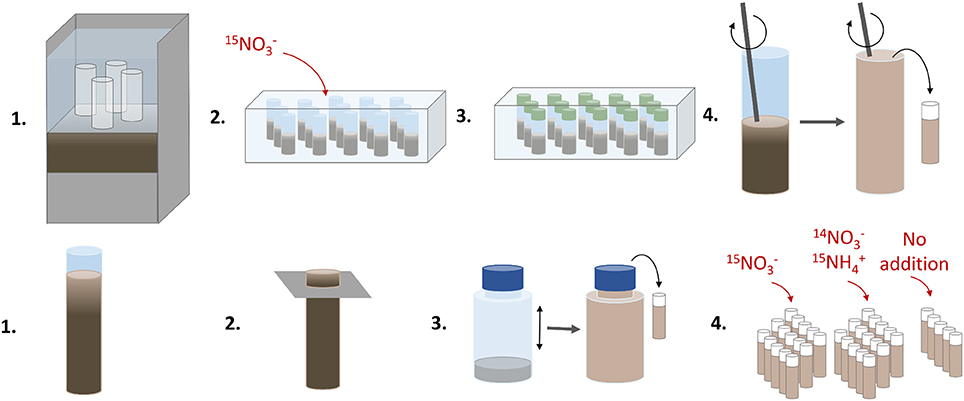
Figure 2. An illustration of the various handling steps in the sediment core (upper panel) and anoxic slurry (lower panel) incubations using 15N. The sediment core incubations were run to determine denitrification and DNRA rates, and the anoxic slurry incubations to estimate the anammox contribution to total N2 production.
15N Incubations: Laboratory Analysis and Calculations
The isotopic composition of the N2 samples from the denitrification and anammox experiments were determined by headspace analysis using gas chromatography-isotope ratio mass spectrometry (GC-IRMS, DeltaV plus, Thermo). Slopes of the linear regression of 29N2 and 30N2 concentration against time were used to calculate production rates of labeled N2 (p29N2 and p30N2, respectively). Rates of N2 production (= denitrification) were calculated based on Nielsen (1992) canonical isotope pairing technique (IPT) as the contribution of anammox to the N2 production was found to be negligible. Denitrification rate was split into: (1) denitrification fuelled by water column nitrate (Dw), and (2) denitrification coupled to nitrification (Dn), using the equations described in Nielsen (1992).
Concentrations of labeled ammonium (15) were quantified after oxidation of to N2 with alkaline hypobromite (Warembourg, 1993). Samples were analyzed by headspace technique at the GC-IRMS as for labeled N2 analysis as described above. Slopes of the linear regression of 15 concentration against time were used to calculate production rates of labeled ammonium (p15). DNRA rates were calculated according to Christensen et al. (2000). Since part of the 15 produced during incubation is adsorbed by sediment particles (Laima, 1994), the measured DNRA rate was further multiplied by a factor two (De Brabandere et al., 2015).
Results
Water Column Oxygen Conditions
Several casts with a CTD, on which a Seabird 43 oxygen sensor was mounted, were made at each station. The obtained vertical profiles of oxygen distributions in the water column are displayed in Figure 3. It is obvious from these profiles that the water column below a depth of about 140 m was oxygenated in early July 2015. In 2008 and 2010, the water column was anoxic below about 100 m depth (Viktorsson et al., 2013a). The bottom water oxygen concentration, measured in situ with O2 optodes mounted on the benthic lander in 2015, was 30 ± 10 μM at station E and 45 ± 5 μM at station F. Since the lander mounted sensors measured oxygen in the bottom water closer to the seafloor than the sensors on the CTD, the former recorded somewhat lower concentrations than the latter (Table 1, Figure 3).
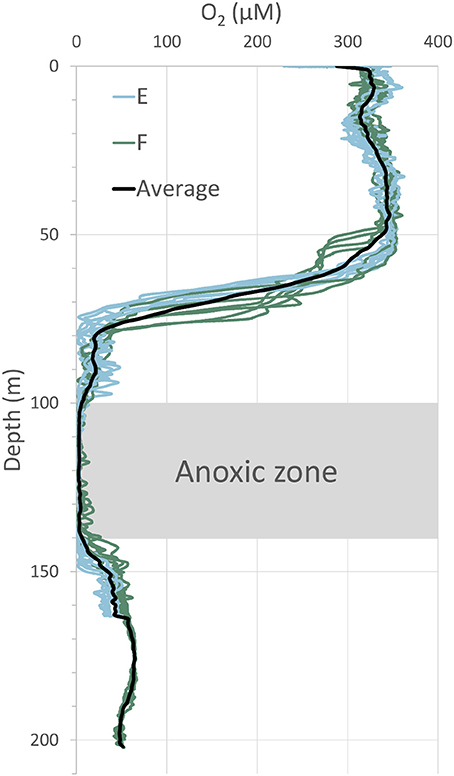
Figure 3. Distribution of dissolved oxygen in the water column at stations E and F in July 2015. A Seabird 43 oxygen sensor, mounted on the CTD of the ship, was used for these measurements. The average of several profiles is indicated by the black line. Note the anoxic zone at 100–140 m depth and the oxygenated zone below; these zones were separated by a “second” oxycline at around 140 m depth.
Benthic Fluxes in the Newly Oxygenated Deep EGB
Examples of the evolution of nutrient concentrations during the in situ chamber incubations are shown in Figure 4. The evolution of each solute concentration during all chamber incubations at both stations is displayed in Supplementary Material (SM). The benthic fluxes of nutrients, DIC and oxygen, measured in situ with the benthic lander in July 2015, are presented in Table 2. Ammonium fluxes were consistently directed out of the sediment, whereas nitrate fluxes consistently were directed into the sediment. The flux of DIN (the sum of ammonium, nitrite and nitrate) was dominated by ammonium, whereas nitrite made the smallest contribution to the DIN flux. The average flux of each inorganic N component was higher at the deeper station F than at station E. The average oxygen uptake and DIC flux showed the same pattern with higher fluxes at station F than at station E (Table 2). The bottom water oxygen concentration was also higher at station F than E as mentioned above. The average phosphate (or DIP) flux was similar at the two stations (0.11 and 0.12 mmol m−2 d−1 at station E and F, respectively). The average silicate efflux was 5.5 and 6.2 mmol m−2 d−1 at station E and F, respectively. The results from the t-test are shown in Table 3. Since the bottom water was anoxic in 2008 and 2010, oxygen uptake rates could only be measured in 2015. The only flux that showed a statistically significant (p < 0.05) difference was the DIP flux at station F, which was significantly lower in 2015 than in 2008–2010.
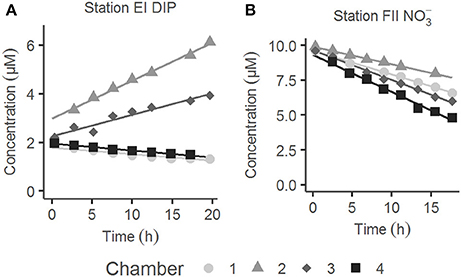
Figure 4. Typical examples of the evolution of solute concentrations with time during benthic chamber incubations in situ. (A) Dissolved inorganic phosphorus (DIP) at station E during lander deployment I. (B) at station F during lander deployment II. The four chambers of each lander deployment are indicated in white and different tones of gray.
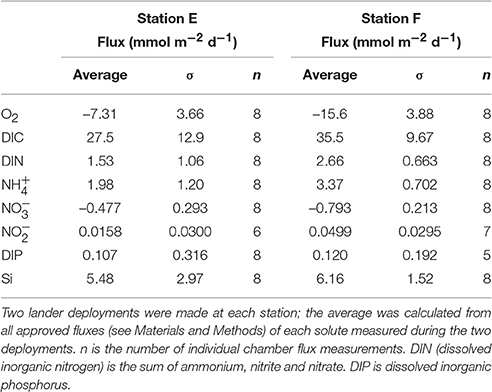
Table 2. Average benthic fluxes with standard deviations at the two stations in July 2015.
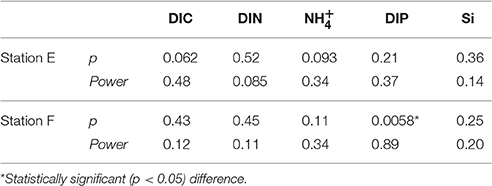
Table 3. P-value and power of Students t-test performed for fluxes from anoxic (2008 + 2010) and oxygenated (2015) bottoms.
Denitrification and DNRA Rates in Newly Oxygenated EGB Sediments
Rates of nitrate reduction (= denitrification + DNRA since the contribution of anammox was found to be negligible) were detectable at both station E and F and were 0.32 mmol N m−2 d−1 and 0.58 mmol N m−2 d−1, respectively (Table 4; Figure 5). The nitrate reduction rate, as well as the DNRA rate, was significantly higher at the deep station F than at the shallower station E (ANOVA, p < 0.01). On the other hand, denitrification rate was significantly higher at E than at F. DNRA rates were significantly higher than denitrification rates (ANOVA, p < 0.001) only at station F (Figure 5).
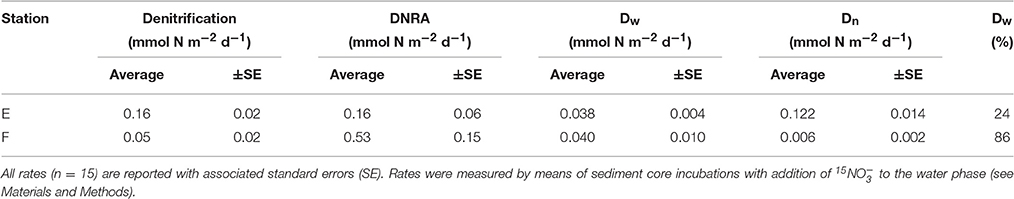
Table 4. Average rates of denitrification, DNRA, denitrification fueled by water column nitrate (Dw), denitrification coupled to nitrification (Dn), and average contribution of Dw to total denitrification (Dw %).
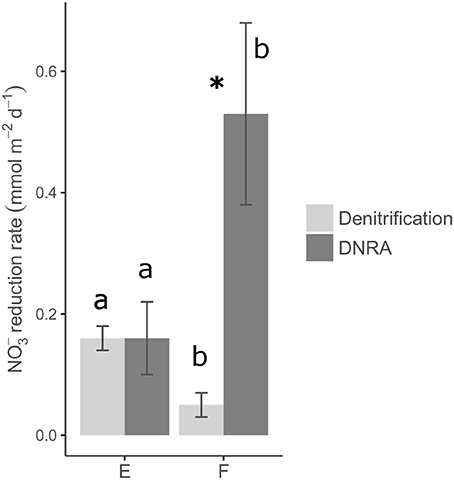
Figure 5. Average rates of denitrification and DNRA and associated error bars (standard errors, n = 15). Rates were measured by means of sediment core incubations with addition of 15 to the water phase (see Materials and Methods). Different letters (i.e., a vs. b) represent statistically significant differences in denitrification rates and DNRA rates between the two stations (ANOVA, p < 0.05). Asterisk depicts statistically significant differences between denitrification and DNRA rates at station F (ANOVA, p < 0.05).
At the two investigated stations, significant differences (ANOVA, p <0.001) in rates of coupled nitrification–denitrification (Dn) explained the conspicuous variation in total denitrification rates (Table 4). In other words, excluding the contribution of nitrification, rates of denitrification would be comparable at the two oxygenated sites. As a result of this, denitrification fuelled by nitrate diffusing from the overlying water (Dw) contributed very differently to total denitrification at the two stations (86% at F vs. 24% at E; Table 4).
Discussion
Effect of Natural Oxygenation of Long-term Anoxic Baltic Bottoms on Benthic Solute Fluxes
The influence of oxygenation of long-term anoxic benthic systems on biogeochemical processes in sediments and solute exchange at the sediment-water interface is a function of duration of oxygenation and the actual bottom water oxygen concentration level (e.g., De Brabandere et al., 2015; Ekeroth et al., 2016a). The present study investigated the situation in the EGB in early July 2015, i.e., when the EGB had been oxygenated for 3–4 months by the 2014–2015 MBI. The observed bottom water oxygen concentration level (Figure 3, Table 1) is consistent with other observations in the EGB at about the same time (e.g., Sommer et al., 2017). Strong evidence of oxidized conditions in surficial sediments in the deep EGB in early July 2015 was obtained by sediment profile imagery (SPI) and reported by Rosenberg et al. (2016). These authors found the sediment surface at water depths below 140 m close to stations E and F to be orange colored, and suggested that this was due to newly formed iron and manganese oxides.
The post-hoc power analysis showed that the statistical power of the t-tests was generally low, meaning that the risk of making a type II error and failing to detect an actual difference was relatively large. Most of the measured fluxes varied considerably on each station each year (Figure 6), suggesting spatial heterogeneity of the seafloor. One clear example of this is the DIP fluxes at station E in 2015, which at one lander deployment were directed out of the sediment in two of the chambers and into the sediment in the other two (Figure 4). A plausible explanation for this observation is that the oxygen containing bottom water had oxygenated the sediment to a different extent even on the local scale in July 2015, e.g., due to a heterogeneous distribution of reactive organic matter in the sediment. Given the relatively low number of flux measurements in combination with the high natural variability, it is unlikely that we would have been able to find actual differences in fluxes, as indicated by the low power. For the significant difference in the DIP flux at station F, power was high (>0.80; Table 3). The risk that this difference was falsely found to be significant is therefore low.
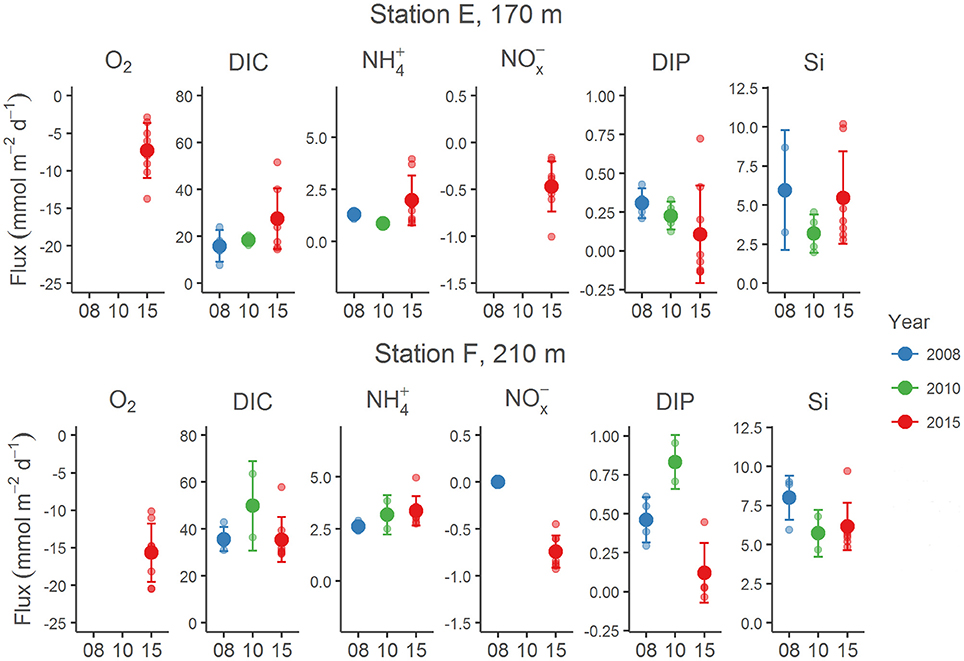
Figure 6. Benthic fluxes of O2, DIC, , NOx ( + ), DIP and Si at stations E and F in 2008 (blue), 2010 (green), and 2015 (red). The years are given on the x-axis. The bottom water at these stations was anoxic in 2008 and 2010 (with essentially no present), but oxygenated in 2015 (this study). The fluxes from 2008 and 2010 are from Viktorsson et al. (2013a), Nilsson et al. (in prep.) and Hall et al. (unpublished results). Each individual chamber flux is indicated with a small circle, the average flux with a big circle, and the standard deviation with a bar.
Another clear effect of the oxygenation event in 2015 is that the DIP flux was directed into the sediment in about 50% of the flux measurements (Figures 6, 7). An uptake of DIP by the sediment was never observed under anoxic conditions in 2008 and 2010 (Viktorsson et al., 2013a). The DIP uptake by EGB sediments in 2015 is consistent with the presence of iron and manganese oxides in these sediments as suggested by Rosenberg et al. (2016). Change of direction of the benthic DIP flux as a result of an altered oxygen regime has been observed previously in the Baltic Sea. An episodic oxygenation event of deep long-term anoxic accumulation bottoms in the western Gulf of Finland turned the high DIP efflux in 2003 into an influx in 2004. When the bottom water had returned to anoxia in 2005, the high DIP efflux was resumed (Viktorsson et al., 2012).
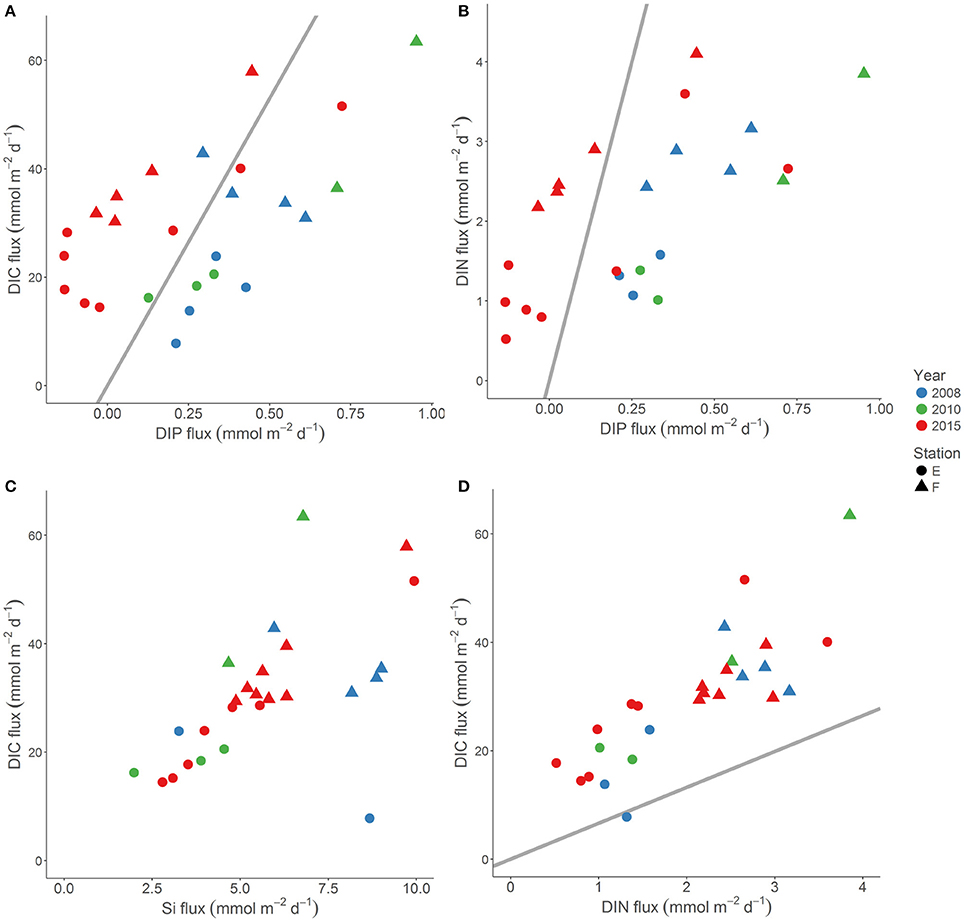
Figure 7. The DIC flux vs. the DIP flux (A), the DIC flux vs. the DIN flux (B), the DIC flux vs. the Si flux (C), and the DIN flux vs. the DIP flux (D) at stations E (circles) and F (triangles) in 2008 (blue), 2010 (green), and 2015 (red). The bottom water was anoxic in 2008 and 2010, and oxygenated in 2015. The Redfield elemental ratio is indicated with a straight line.
We suggest that the high spatial variability of the sediment caused the fluxes measured each year to be variable, and especially in 2015 when the oxygenated bottom water likely increased sediment heterogeneity as discussed above. Because of this, the statistical power to detect an actual difference between the anoxic years and 2015 became low. The risk of failing to detect an actual difference was therefore relatively large as mentioned above. Hence, we used the average DIP fluxes from stations E and F in 2015 to estimate the decrease of the internal DIP load due to the oxygenation event caused by the 2014–2015 MBI (see below; Table 5).
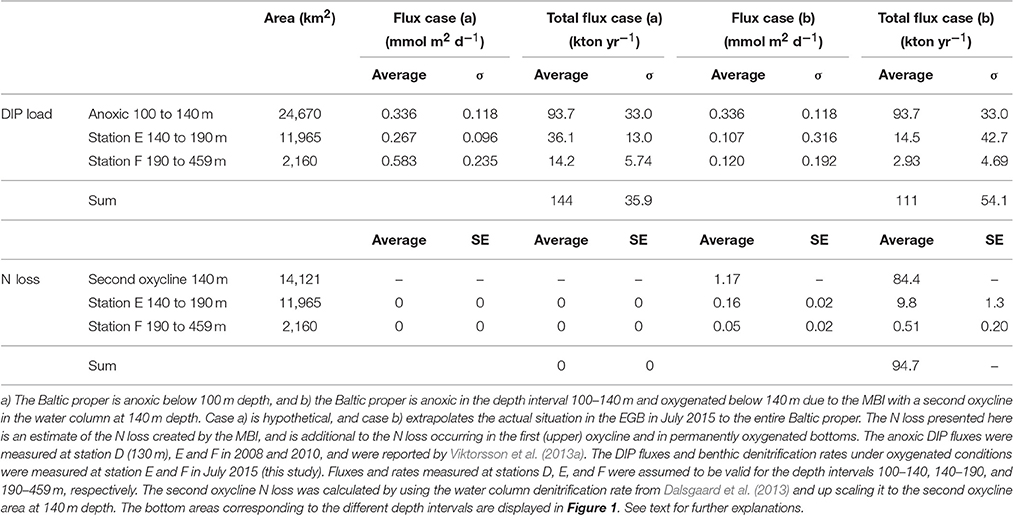
Table 5. Internal loading of DIP (DIP load) and fixed N removal by pelagic and benthic denitrification (N loss) scaled up to the Baltic proper basin for two cases in July 2015.
Yet another clear effect of the MBI oxygenation event is that bottom water nitrate concentrations of about 10 μM were observed in July 2015, and the flux of nitrate was consistently directed into the sediment (Figure 4, Table 2). In 2008 and 2010, the bottom water contained no or very little nitrate, and the nitrate flux was not measurable or zero (Figure 6). The average nitrate flux in 2015 (Table 2) was on each station not significantly different (ANOVA, p = 0.254 for station E and p = 0.365 for station F) from the sum of the average denitrification and DNRA rates (Table 4). Since anammox rates were insignificant, this finding indicates that other nitrate removal processes, such as bacterial intracellular storage, did not play a major role in newly oxygenated Baltic proper sediments in July 2015.
Effect of Oxygenation on Composition of the Benthic Solute Flux
Oxygenation of surficial sediments effects transformation, retention and removal of various elements differently (e.g., Sundby et al., 1986; Ekeroth et al., 2016a). The composition and elemental ratios of benthic solute fluxes under anoxic conditions thus change upon oxygenation as suggested by several studies. Ekeroth et al. (2016a) found a very low DIN:DIP molar ratio (2.8) of the benthic flux measured under anoxia, but when these reduced Baltic proper sediments were experimentally oxygenated, the DIN:DIP ratio of the flux increased to about 12, which was due to a retention of DIP in the oxygenated azoic sediment rather than to a stimulation of the DIN flux. Viktorsson et al. (2012, 2013a,b) reported average DIC:DIP molar ratios of anoxic benthic fluxes of about 30 in the Gulf of Finland, and about 70 in the EGB and in west-Swedish fjords. The DIC:DIP molar ratio of fluxes measured in permanently oxygenated areas of the same basins was several fold higher and approached often a value of about 1000. N:P and C:P ratios of benthic solute fluxes in anoxic settings are thus well below the Redfield ratios of 16:1 and 106:1, respectively, due to preferential regeneration of P under anoxic conditions (e.g., Viktorsson et al., 2013b; Ekeroth et al., 2016a, and references therein).
We compared the composition of the benthic nutrient and DIC fluxes at stations E and F in the EGB under anoxic conditions in 2008 and 2010 (Viktorsson et al., 2013a; Nilsson et al., in prep; Hall et al., unpublished results) with those under newly oxygenated conditions in 2015 (this study; Figure 7). The DIC and DIN flux, as well as the DIC and Si flux, showed positive correlations both under anoxic and oxygenated conditions, and both the C:N and the C:Si molar ratios of fluxes were unaffected by the oxygenation event. The C:N molar ratio of fluxes was above the Redfield ratio all years (Figure 7). It was previously suggested that the benthic Si flux from reduced Baltic sediments slows down upon oxygenation (Ekeroth et al., 2016a; Tallberg et al., in press). We did not observe any such effect in the EGB (see above; Figure 6), and that would likely have made the C:Si ratio of the flux higher—contrary to our findings.
However, the oxygenation triggered by the MBI drastically changed the C:P and the N:P composition of the flux. While both the C:P (on average about 70) and the N:P (on average 3–4) molar ratio of the flux was much below the Redfield ratio under anoxia in 2008 and 2010 (Viktorsson et al., 2013a), these ratios became much higher and in most cases well above Redfield as a result of oxygenation in 2015 (Figure 7). The very P rich (in relation to both C and N) benthic flux under anoxia thus turned into a P poor flux under oxygenated conditions due to sedimentary P retention. A natural bottom water oxygenation event may thus increase the DIN:DIP ratio of the water column nutrient pool, and thus indirectly influence eutrophication status, and the abundance and composition of phytoplankton and cyanobacteria communities in surface waters.
Our aim with this study was not to explore the detailed mechanisms of P retention in the sediment upon oxygenation, but rather to show the existence and determine the magnitude of P retention. However, it is very likely that phosphate adsorption to metal (Fe) oxyhydroxides was an important mechanism as indicated above. Also polyphosphate storage by bacteria (e.g., sulfur bacteria) is likely. Our inorganic P concentrations (data not shown) for the solid phase of the sediment indicate enrichment close to the sediment-water interface and thus P adsorption to metal oxyhydroxides. However, these data are not comprehensive enough to rule out other P retention mechanisms.
Change of the Internal P Load as a Result of Oxygenation: An Estimate on the Baltic Proper Scale
The statistical analysis showed that the benthic DIP flux was significantly lower in the oxygenated 2015 than in the anoxic 2008 and 2010 only at station F (Table 3). The statistical power of this significant difference was high (see above). However, the statistical power to detect an actual decrease of the DIP flux at station E between 2008–2010 and 2015 was low due to sediment heterogeneity. The risk of failing to detect an actual difference was therefore large as mentioned above. To this end, we used the average DIP fluxes from stations E and F in 2015 to estimate the decrease, up scaled to the Baltic proper basin, of the integrated benthic DIP flux (the internal DIP load) due to the oxygenation triggered by the 2014–2015 MBI.
To accomplish this we outlined two cases in July 2015: (a) The Baltic proper is anoxic below 100 m depth, and (b) the Baltic proper is anoxic in the depth interval 100–140 m and oxygenated below 140 m due to the MBI with a second oxycline in the water column at 140 m depth. Case (a) is hypothetical, and case (b) extrapolates the actual oxygenated situation in the EGB in July 2015 to the entire Baltic proper.
The bottom surface areas were calculated with the ‘Surface Volume’ tool in the software ArcGIS 10.3.1 (ESRI, 2015), using bathymetry data from the Baltic Sea Bathymetry Database (Baltic Sea Hydrographic Commission, 2013). Bottoms were divided into three groups: anoxic, type E and type F. Anoxic bottoms were situated at 100–140 m depth, where CTD measurements showed that the O2 concentration was <5 μM, whereas bottoms below 140 m were oxygenated by the MBI in 2015. All bottoms below 100 m depth were anoxic in 2008 and 2010. Type E (140–190 m) and type F (190–459 m) bottoms were situated around the depths of station E (170 m) and F (210 m), respectively. Each bottom area was multiplied with the average DIP flux for that bottom type and time period. For the anoxic bottoms, the average flux from station D (at a depth of 130 m), E and F in 2008–2010 was used (Viktorsson et al., 2013a). It was assumed that the flux from the anoxic bottoms was the same in 2015 as in 2008 and 2010. Bottoms shallower than 100 m depth were assumed to give a negligible contribution to the internal DIP load (Viktorsson et al., 2013a).
The internal DIP load for the fully anoxic case a) was 144 ± 35.9 kton P yr−1 and for the MBI oxygenated case b) 111 ± 54.1 kton P yr−1 (Table 5). The internal DIP load had thus been lowered with 23% if the 2014–2015 MBI had oxygenated all of the Baltic proper below 140 m depth.
The reason the anoxic internal DIP load presented here is almost 10 kton yr−1 lower than that estimated by Viktorsson et al. (2013a) is that the latter study used an average DIP flux for the entire anoxic Baltic proper area, whereas we specified the anoxic flux for the different anoxic depth intervals (Table 5).
Sommer et al. (2017) reported a much lower influence of deep-water renewal, such as the MBI, on the Baltic proper internal DIP load. They reported a reduction of the DIP load with only 5%, which is much less the 23% we report. This discrepancy is most likely due to the presence of massive benthic microbial mats in the hypoxic transition zone at 80–120 m depth in the eastern part of the EGB (Noffke et al., 2016). These microbial mats were found to be very active in releasing DIP, but they exist at water depths above the influence of the MBI, and were thus not influenced by it. However, benthic microbial mats have not been found in the western part of the EGB despite attempts to find them (U. Marzocchi, pers. comm.). It thus appears that there are regional differences within the EGB indicating that extrapolations from stations in the eastern part of the basin may differ from those made from stations in the western and central parts of the basin.
Benthic DNRA Rates and Ammonium Effluxes
The DNRA rate was significantly higher at the deep station F than at the shallower station E (ANOVA, p < 0.01) as mentioned above. It is plausible that the H2S pool in the sediment was higher at station F than at station E, since it is likely that sulfate reduction rates were higher at station F than at station E because of higher salinity (i.e., higher sulfate concentration) and plausibly higher content of labile sedimentary organic matter at the deeper station F (210 m) than at station E (170 m). Highly sulfidic conditions favor chemolithoautotrophic DNRA over heterotrophic denitrification and DNRA; Beggiatoa and other sulfide oxidizers can couple the reduction of to with sulfide oxidation (Brunet and Garcia-Gil, 1996; Jørgensen and Nelson, 2004), whereas sulfide can inhibit denitrification (Sørensen et al., 1980). We thus speculate that the higher DNRA rates at station F than at E are linked to higher pore water sulfide concentration at station F than at E.
The ammonium effluxes measured in situ in the chambers were statistically significantly higher than the DNRA rates at both stations, and DNRA supported only 16 and 8% of the ammonium efflux at stations F and E, respectively. It is clear that the rate of ammonium regeneration via ammonification of organic matter and subsequent efflux from the sediment was much higher than the rate of ammonium regeneration via DNRA.
Influence of Bottom Water Oxygenation on Benthic and Pelagic Fixed N Removal through Denitrification: An Estimate on the Baltic Proper Scale
Our results clearly show that the natural major oxygenation event initiated benthic nitrogen removal (through denitrification) and recycling (through DNRA) in the formerly anoxic sediments. These two microbial processes were initially driven by the appearance of nitrate in the bottom water (De Brabandere et al., 2015). With time, a vast portion of these newly oxygenated sediments switched the nitrate source from the overlying water to benthic nitrification, as suggested by the significant discrepancy in Dn rates between station E and F.
Here we propose an integrated denitrification budget by up scaling the rates to the oxygenated, nitrate-containing areas of the Baltic proper, which are to be considered as new active sites of N loss. We estimated the annual sedimentary N loss from these newly oxygenated sites to be 10.3 kton N yr−1 (Table 5). Recently, Deutsch et al. (2010) estimated the integrated benthic denitrification in permanently oxygenated bottoms of the Baltic proper being 191 kton N yr−1. This thus suggests that sedimentary N loss associated to the newly oxygenated sites is minimal compared to the total basin-wide benthic N loss.
However, recent up scaling of water column denitrification rates to the whole Baltic proper anoxic surface area indicated that water column N loss exceeds sediment denitrification by up to a factor of three (Dalsgaard et al., 2013). It is important to note that the newly oxygenated sediments were lying underneath a double oxycline (cf Figure 3), as the MBI was constituted of dense water masses circulating on the bottom of the basins. Assuming that the upper and lower water column oxyclines would have the same denitrification rate (Dalsgaard et al., 2013), the estimated annual N loss associated to the second newly-established oxycline is 84.4 kton N yr−1 (Table 5), which is 44% of the total sedimentary Baltic proper N loss estimated by Deutsch et al. (2010). We suggest that, although the horizontal area of the second oxycline in the water column at 140 m depth and the bottom area below 140 m oxygenated by the MBI is limited (Table 5), the impact of these newly oxygenated areas on the total (pelagic plus benthic) N removal in the Baltic proper is remarkable (95 kton N yr−1 vs. 531 kton N yr−1), where the total N removal rate (531 kton N yr−1) is the average of the water column N removal range (132–547 kton N yr−1, Dalsgaard et al., 2013) added to the average sedimentary N removal (191 kton N yr−1, Deutsch et al., 2010). The natural oxygenation event may thus have increased the total Baltic proper fixed N removal by denitrification by 18%.
Concluding Remarks
In the scenario that the 2014–2015 MBI oxygenated all of the Baltic proper below 140 m depth, we estimated that this natural oxygenation event would decrease the internal DIP load with 23% and enhance total (pelagic plus benthic) denitrification by 18%. Although there are several uncertainties and assumptions associated with our estimates, they indicate that MBIs may have a considerable influence on the Baltic proper P and N budgets.
Author Contributions
PH, EA, SB, AH, and MK designed the study, and coordinated the ship operation and sediment sampling. MK coordinated the lander deployments. AH ran incubations on-board. EA, SB, AH, MK, MN and LV processed samples. AH and Sv made statistical analyses. All authors contributed to the evaluation of data and to writing the manuscript.
Funding
This work was supported financially by the Swedish Research Council (VR), the BIO-C3 project funded jointly by BONUS (Art 185) and the Swedish Research Council for Environment, Agricultural Sciences and Spatial Planning (FORMAS), the Helmholtz Alliance “ROBEX-Robotic Exploration of Extreme Environments”, the Sonderforschungsbereich 754 “Climate-Biogeochemistry Interactions in the Tropical Ocean” supported by the Deutsche Forschungsgemeinschaft, and the Research Foundation Flanders (Ph.D. fellowship to Sv).
Conflict of Interest Statement
The authors declare that the research was conducted in the absence of any commercial or financial relationships that could be construed as a potential conflict of interest.
Acknowledgments
We thank Nils Ekeroth for assistance with statistical analyses, Bo Thamdrup for making analytical instrumentation available at Southern Denmark University, and the captain and crew on University of Gothenburg R/V “Skagerak” for support at sea.
Supplementary Material
The Supplementary Material for this article can be found online at: https://www.frontiersin.org/article/10.3389/fmars.2017.00027/full#supplementary-material
References
Aller, R. C. (2014). “Sedimentary diagenesis, depositional environments, and benthic fluxes,” in Treatise on Geochemistry (2nd Edn), eds H. D. Holland and K. K. Turekian (Oxford: Elsevier), 293–334.
Almroth, E., Tengberg, A., Andersson, J. H., Pakhomova, S. V., and Hall, P. O. J. (2009). Effects of resuspension on benthic fluxes of oxygen, nutrients, dissolved inorganic carbon, iron and manganese in the Gulf of Finland, Baltic Sea. Cont. Shelf Res. 29, 807–818. doi: 10.1016/j.csr.2008.12.011
Baltic Sea Hydrographic Commission (2013). Baltic Sea Bathymetry Database version 0.9.3. Available online at: http://data.bshc.pro/ 2015-09-22
Belsley, D. A., Kuh, E., and Welsch, R. E. (1980). Regression Diagnostics: Identifying Influential Data and Sources of Collinearity. New York, NY: Wiley.
Bonaglia, S., Bartoli, M., Gunnarsson, J. S., Rahm, L., Raymond, C., Svensson, O., et al. (2013). Effect of reoxygenation and Marenzelleria spp. bioturbation on Baltic Sea sediment metabolism. Mar. Ecol. Prog. Ser. 482, 43–55. doi: 10.3354/meps10232
Bonaglia, S., Nascimento, F. A., Bartoli, M., Klawonn, I., and Brüchert, V. (2014). Meiofauna increases bacterial denitrification in marine sediments. Nat. Commun. 5:5133. doi: 10.1038/ncomms6133
Brunet, R. C., and Garcia-Gil, L. J. (1996). Sulfide-induced dissimilatory nitrate reduction to ammonia in anaerobic freshwater sediments. FEMS Microbiol. Ecol. 21, 131–138.
Brunnegård, J., Grandel, S., Ståhl, H., Tengberg, A., and Hall, P. O. J. (2004). Nitrogen cycling in deep-sea sediments of the Porcupine Abyssal Plain, NE Atlantic. Prog. Oceanogr. 63, 159–181. doi: 10.1016/j.pocean.2004.09.004
Burdige, D. J. (2007). Preservation of organic matter in marine sediments: controls, mechanisms, and an imbalance in sediment organic carbon budgets? Chem. Rev. 107, 467–485. doi: 10.1021/cr050347q
Chambers, J. M. (1992). “Linear models” in Statistical Models in S, eds J. M. Chambers and T. J. Hastie (Pacific Grove, CL: Wadsworth & Brooks/Cole). 95–144.
Christensen, P. B., Rysgaard, S., Sloth, N. P., Dalsgaard, T., and Schwærter, S. (2000). Sediment mineralization, nutrient fluxes, denitrification and dissimilatory nitrate reduction to ammonium in an estuarine fjord with sea cage trout farms. Aquat. Microb. Ecol. 21, 73–84. doi: 10.3354/ame021073
Conley, D. J., Humborg, C., Rahm, L., Savchuk, O. P., and Wulff, F. (2002). Hypoxia in the Baltic Sea and basin-scale changes in phosphorus biogeochemistry. Environ. Sci. Tech. 36, 5315–5320. doi: 10.1021/es025763w
Cook, R. D., and Weisberg, S. (1982). Residuals and Influence in Regression. London: Chapman and Hall.
Dalsgaard, T., De Brabandere, L., and Hall, P. O. J. (2013). Denitrification in the water column of the central Baltic Sea. Geochim. Cosmochim. Acta 106, 247–260. doi: 10.1016/j.gca.2012.12.038
Dalsgaard, T., Thamdrup, B., and Canfield, D. E. (2005). Anaerobic ammonium oxidation (anammox) in the marine environment. Res. Microbiol. 156, 457–464. doi: 10.1016/j.resmic.2005.01.011
De Brabandere, L., Bonaglia, S., Kononets, M. Y., Viktorsson, L., Stigebrandt, A., Thamdrup, B., et al. (2015). Oxygenation of an anoxic fjord basin strongly stimulates benthic denitrification and DNRA. Biogeochemistry 126, 131–152. doi: 10.1007/s10533-015-0148-6
Deutsch, B., Forster, S., Wilhelm, M., Dippner, J., and Voss, M. (2010). Denitrification in sediments as a major nitrogen sink in the Baltic Sea: an extrapolation using sediment characteristics. Biogeosciences 7, 3259–3271. doi: 10.5194/bg-7-3259-2010
Ekeroth, N., Blomqvist, S., and Hall, P. O. J. (2016a). Nutrient fluxes from reduced Baltic Sea sediment: effects of oxygenation and macrobenthos. Mar. Ecol. Prog. Ser. 544, 77–92. doi: 10.3354/meps11592
Ekeroth, N., Kononets, M., Walve, J., Blomqvist, S., and Hall, P. O. J. (2016b). Effects of oxygen on recycling of biogenic elements from sediments of a stratified coastal Baltic Sea basin. J. Mar. Syst. 154, 206–219. doi: 10.1016/j.jmarsys.2015.10.005
Ekeroth, N., Lindström, M., Blomqvist, S., and Hall, P. O. J. (2012). Recolonisation by macrobenthos mobilises organic phosphorus from reoxidised Baltic Sea sediments. Aquatic Geochemistry 18, 499–513. doi: 10.1007/s10498-012-9172-5
Faul, F., Erdfelder, E., Lang, A.-G., and Buchner, A. (2007). G* Power 3: a flexible statistical power analysis program for the social, behavioral, and biomedical sciences. Behav. Res. Methods 39, 175–191. doi: 10.3758/BF03193146
Finni, T., Kononen, K., Olsonen, R., and Wallström, K. (2001). The history of cyanobacterial blooms in the Baltic Sea. Ambio 30, 172–178. doi: 10.1579/0044-7447-30.4.172
Fox, J., and Weisberg, S. (2011). An R Companion to Applied Regression. Thousand Oaks, CA: SAGE Publications.
Goyet, C., and Snover, A. K. (1993). High-accuracy measurements of total dissolved inorganic carbon in the ocean - Comparison of alternate detection methods. Mar. Chem. 44, 235–242.
Gustafsson, B. G., and Stigebrandt, A. (2007). Dynamics of nutrients and oxygen/hydrogen sulfide in the Baltic Sea deep water. J. Geophys. Res. Biogeosci. 112. doi: 10.1029/2006JG000304
IOW Baltic Sea Research Institute Warnemünde (2015). Oxygen Arrived at the Bottom of the Central Baltic Sea. Available at: http://www.io-warnemuende.de/tl_files/news/presse/2015/20150304_presse_Salzwassereinbruch2_engl.pdf
Jilbert, T., Slomp, C., Gustafsson, B. G., and Boer, W. (2011). Beyond the Fe-P-redox connection: preferential regeneration of phosphorus from organic matter as a key control on Baltic Sea nutrient cycles. Biogeosciences 8, 1699–1720. doi: 10.5194/bg-8-1699-2011
Jørgensen, B. B., and Nelson, D. C. (2004). Sulfide oxidation in marine sediments: geochemistry meets microbiology. Geol. Soc. Am. Special Papers 379, 63–81. doi: 10.1130/0-8137-2379-5.63
Kullenberg, G., and Jacobsen, T. (1981). The Baltic Sea: an outline of its physical oceanography. Mar. Pollut. Bull. 12, 183–186.
Laima, M. (1994). Is KCl a reliable extractant of 15 added to coastal marine sediments? Biogeochemistry 27, 83–95.
Matthäus, W., Nehring, D., Feistel, R., Nausch, G., Mohrholz, V., and Lass, H.-U. (2008). “The inflow of highly saline water into the Baltic Sea,” in State and Evolution of the Baltic Sea, 1952–2005 (John Wiley & Sons, Inc.), 265–309. doi: 10.1002/9780470283134.ch10
Mohrholz, V., Naumann, M., Nausch, G., Krüger, S., and Gräwe, U. (2015). Fresh oxygen for the Baltic Sea—An exceptional saline inflow after a decade of stagnation. J. Mar. Syst. 148, 152–166. doi: 10.1016/j.jmarsys.2015.03.005
Nausch, M., Nausch, G., Mohrholz, V., Siegel, H., and Wasmund, N. (2012). Is growth of filamentous cyanobacteria supported by phosphate uptake below the thermocline? Estuar. Coast. Shelf Sci. 99, 50–60. doi: 10.1016/j.ecss.2011.12.011
Nielsen, L. P. (1992). Denitrification in sediment determined from nitrogen isotope pairing. FEMS Microbiol. Lett. 86, 357. doi: 10.1111/j.1574-6968.1992.tb04828.x
Noffke, A., Sommer, S., Dale, A. W., Hall, P. O. J., and Pfannkuche, O. (2016). Benthic nutrient fluxes in the Eastern Gotland Basin (Baltic Sea) with particular focus on microbial mat ecosystems. J. Mar. Syst. 158, 1–12. doi: 10.1016/j.jmarsys.2016.01.007
O'Sullivan, D. W., and Millero, F. J. (1998). Continual measurement of the total inorganic carbon in surface seawater. Mar. Chem. 60, 75–83.
Reissmann, J. H., Burchard, H., Feistel, R., Hagen, E., Lass, H. U., Mohrholz, V., et al. (2009). Vertical mixing in the Baltic Sea and consequences for eutrophication – A review. Prog. Oceanogr. 82, 47–80. doi: 10.1016/j.pocean.2007.10.004
Risgaard-Petersen, N., Nielsen, L. P., Rysgaard, S., Dalsgaard, T., and Meyer, R. L. (2003). Application of the isotope pairing technique in sediments where anammox and denitrification coexist. Limnol. Oceanogr. Methods 1, 63–73. doi: 10.4319/lom.2003.1.63
Rosenberg, R., Magnusson, M., and Stigebrandt, A. (2016). Rapid re-oxygenation of Baltic Sea sediments following a large inflow event. Ambio 45, 130–132. doi: 10.1007/s13280-015-0736-7
Schimanke, S., Meier, M., Kjellström, E., Strandberg, G., and Hordoir, R. (2012). The climate in the Baltic Sea region during the last millennium simulated with a regional climate model. Clim. Past 8, 1419–1433. doi: 10.5194/cp-8-1419-2012
Sommer, S., Clemens, D., Yücel, M., Pfannkuche, O., Hall, P. O. J., Almroth Rosell, E., et al. (2017). Major bottom water ventilation events do not significantly reduce basin-wide benthic N and P release in the Eastern Gotland Basin. Front. Mar. Sci. 4:18. doi: 10.3389/fmars.2017.00018
Sørensen, J., Tiedje, J. M., and Firestone, R. B. (1980). Inhibition by sulfide of nitric and nitrous oxide reduction by denitrifying Pseudomonas fluorescens. Appl. Environ. Microbiol. 39, 105–108.
Ståhl, H., Tengberg, A., Brunnegård, J., Bjørnbom, E., Forbes, T. L., Josefson, A. B., et al. (2004). Factors influencing organic carbon recycling and burial in Skagerrak sediments. J. Mar. Res. 62, 867–907. doi: 10.1357/0022240042880873
Stigebrandt, A. (2001). “Physical oceanography of the Baltic sea,” in A System Analysis of the Baltic Sea, eds F. Wulff, L. Rahm and P. Larsson (Berlin-Heidelberg: Springer-Verlag), 19–74.
Stigebrandt, A., Rahm, L., Viktorsson, L., Ödalen, M., Hall, P. O. J., and Liljebladh, B. (2014). A new phosphorus paradigm for the Baltic proper. Ambio 43, 634–643. doi: 10.1007/s13280-013-0441-3
Sundby, B., Anderson, L., Hall, P. O. J., Iverfeldt, Å., Rutgers van der Loeff, M. M., and Westerlund, S. (1986). The effect of oxygen on release and uptake of cobalt, manganese, iron and phosphate at the sediment-water interface. Geochim. Cosmochim. Acta 50, 1281–1288.
Tallberg, P., Heiskanen, A.-S., Niemistö, J., Hall, P. O. J., and Lehtoranta, J. (in press). Are benthic fluxes important for the availability of Si in the Gulf of Finland? J. Mar. Syst. doi: 10.1016/j.jmarsys.2017.01.010
Tengberg, A., Stahl, H., Gust, G., Muller, V., Arning, U., Andersson, H., et al. (2004). Intercalibration of benthic flux chambers I. Accuracy of flux measurements and influence of chamber hydrodynamics. Prog. Oceanogr. 60, 1–28. doi: 10.1016/j.pocean.2003.12.001
Thamdrup, B., and Dalsgaard, T. (2002). Production of N2 through anaerobic ammonium oxidation coupled to nitrate reduction in marine sediments. Appl. Environ. Microbiol. 68, 1312–1318. doi: 10.1128/aem.68.3.1312-1318.2002
Tuominen, L., Heinänen, A., Kuparinen, J., and Nielsen, L. P. (1998). Spatial and temporal variability of denitrification in the sediments of the northern Baltic Proper. Mar. Ecol. Prog. Ser. 172, 13–24.
Vahtera, E., Conley, D. J., Gustafsson, B. G., Kuosa, H., Pitkänen, H., Savchuk, O. P., et al. (2007). Internal ecosystem feedbacks enhance nitrogen-fixing cyanobacteria blooms and complicate management in the Baltic Sea. Ambio 36, 186–194. doi: 10.1579/0044-7447(2007)36[186:IEFENC]2.0.CO;2
Viktorsson, L., Almroth-Rosell, E., Tengberg, A., Vankevich, R., Neelov, I., Isaev, A., et al. (2012). Benthic phosphorus dynamics in the Gulf of Finland, Baltic Sea. Aquat. Geochem. 18, 543–564. doi: 10.1007/s10498-011-9155-y
Viktorsson, L., Ekeroth, N., Nilsson, M., Kononets, M., and Hall, P. O. J. (2013a). Phosphorus recycling in sediments of the central Baltic Sea. Biogeosciences 10, 3901–3916. doi: 10.5194/bg-10-3901-2013
Viktorsson, L., Kononets, M., Roos, P., and Hall, P. O. J. (2013b). Recycling and burial of phosphorus in sediments of an anoxic fjord—the By Fjord, western Sweden. J. Mar. Res. 71, 351–374. doi: 10.1357/002224013810921636
Warembourg, F. R. (1993). “Nitrogen Fixation in Soil and Plant Systems,” in Nitrogen Isotope Techniques, eds R. Knowles and T. H. Blackburn (San Diego, CA: Academic Press), 127–156.
Wasmund, N., Voss, M., and Lochte, K. (2001). Evidence of nitrogen fixation by non-heterocystous cyanobacteria in the Baltic Sea and re-calculation of a budget of nitrogen fixation. Mar. Ecol. Prog. Ser. 214, 1–14. doi: 10.3354/meps214001
Wilkinson, G. N., and Rogers, C. E. (1973). Symbolic description of factorial models for analysis of variance. J. R. Stat. Soc. C 22, 392–399. doi: 10.2307/2346786
Keywords: major baltic inflow, benthic nutrient and DIC fluxes, internal P load, denitrification, DNRA
Citation: Hall POJ, Almroth Rosell E, Bonaglia S, Dale AW, Hylén A, Kononets M, Nilsson M, Sommer S, van de Velde S and Viktorsson L (2017) Influence of Natural Oxygenation of Baltic Proper Deep Water on Benthic Recycling and Removal of Phosphorus, Nitrogen, Silicon and Carbon. Front. Mar. Sci. 4:27. doi: 10.3389/fmars.2017.00027
Received: 31 October 2016; Accepted: 24 January 2017;
Published: 08 February 2017.
Edited by:
Osvaldo Ulloa, University of Concepción, ChileReviewed by:
Jake Bailey, University of Minnesota, USAWilliam Berelson, University of Southern California, USA
Copyright © 2017 Hall, Almroth Rosell, Bonaglia, Dale, Hylén, Kononets, Nilsson, Sommer, van de Velde and Viktorsson. This is an open-access article distributed under the terms of the Creative Commons Attribution License (CC BY). The use, distribution or reproduction in other forums is permitted, provided the original author(s) or licensor are credited and that the original publication in this journal is cited, in accordance with accepted academic practice. No use, distribution or reproduction is permitted which does not comply with these terms.
*Correspondence: Per O. J. Hall, per.hall@marine.gu.se
†Present Address: Stefano Bonaglia, Department of Ecology, Environment and Plant Sciences, Stockholm University, Stockholm, Sweden