Electrogenic Sulfur Oxidation by Cable Bacteria in Bivalve Reef Sediments
 Sairah Y. Malkin1*†
  Dorina Seitaj2
  Laurine D. W. Burdorf2 Sil Nieuwhof2 Silvia Hidalgo-Martinez2 Anton Tramper2
  Naomi Geeraert3 Henko De Stigter2
  Filip J. R. Meysman1,2
- 1Department of Analytical, Environmental and Geo-Chemistry, Vrije Universiteit Brussel, Brussels, Belgium
- 2Royal Netherlands Institute for Sea Research, Yerseke, Netherlands
- 3Department of Earth and Environmental Sciences, KU Leuven, Leuven, Belgium
Cable bacteria induce long-distance electron transport in the seafloor and can exert a powerful control on the elemental cycling in marine sediments by creating extreme excursions in porewater pH. Yet, the natural distribution of cable bacteria is still largely unknown, and so their role in coastal biogeochemical cycling remains poorly quantified. Here we show that cable bacteria can be abundant in the sediments of intertidal bivalve reefs, where they strongly influence the pore water geochemistry, resulting in a potentially beneficial interaction between the sulfur oxidizing microbes and biodepositing fauna. Cable bacteria occurred in sediments accumulating within mussel and oyster reefs in the Wadden Sea (The Netherlands), at cumulative filament densities up to 1038 m cm−2. Additionally, cable bacteria were found at moderately high cumulative filament densities (up to 56 m cm−2) in a heavily bioturbated sandy sediment adjacent to the muddy reefs. Microsensor profiling revealed strong sulfide removal and intense acid generation associated with the electrogenic sulfide oxidation metabolism of the cable bacteria. Strongly elevated concentrations of dissolved calcium (up to 35 mM), manganese (up to 250 μM), and iron (up to 700 μM) were observed in the pore waters, consistent with acidity-driven dissolution of calcium carbonates and iron sulfides. This field study provides substantive evidence that cable bacteria exert a decisive control on the cycling of sulfur and carbonate minerals in cohesive coastal sediments, and identifies that the distribution and influence of cable bacteria covers a greater range of natural habitats than previously believed.
Introduction
Intertidal epibenthic suspension-feeding bivalves are considered model ecosystem engineers because they strongly shape and modify their surrounding environment, as witnessed by the formation of elevated mussel and oyster reefs (Dame, 2012). By increasing bed roughness, reducing local current velocity, and by depositing large quantities of fine particles as pseudofeces and feces, bivalves strongly enhance sediment accumulation in their local surroundings (Bergfeld, 1999; van der Zee et al., 2012). Such sediment accumulation lifts reef structures above the surrounding sediment level, which in turn further enhances sediment accretion, and intertidal bivalve reefs in particular can grow rapidly (Rodriguez et al., 2014). Relative to surrounding tidal flats where permeable sands dominate, the material that accumulates at bivalve reefs is highly enriched in organics and fine particles, and as a result, reef sediments generally support high rates of microbial mineralization (Kröncke, 1996). Sulfate reduction is the dominant pathway of organic matter mineralization in such organic rich sediments, ultimately leading to the accumulation of a large pool of solid metal sulfides and/or high levels of free sulfide in the pore waters (Dahlback and Gunnarsson, 1981; Jørgensen, 1982). Thus, through their influence on sedimentation, reef-building bivalves are capable of creating hotspots of sulfur cycling in the coastal ocean.
Free sulfide is a reactive compound with two faces. On the one hand, free sulfide is a respiratory poison which is highly toxic to metazoan life (Vaquer-Sunyer and Duarte, 2010), and consequently, marine sediments with high levels of free sulfide typically support a depauperate faunal community of low diversity (Kröncke, 1996; Bergfeld, 1999). Yet, sulfide is also a compound rich in stored chemical energy, which can be exploited by a variety of microorganisms to fuel their growth. When coupled to the reduction of oxygen or nitrate, the oxidation of sulfide is energetically favorable and a number of phylogenetically diverse microbes have evolved the ability to harness this energy source (Jørgensen and Nelson, 2004). Microbes capable of harvesting energy from the oxidation of sulfide include symbiotic and free living single-celled bacteria and archaea, as well as the large Gammaproteobacteria including Beggiatoa and Thioploca (Friedrich et al., 2005; Teske and Salman, 2014). Among the microbes that may profit from the sulfide-rich environment present within bivalve reefs, the recently discovered “cable bacteria” are of particular interest. These sulfur oxidizing bacteria, which are members of the family Desulfobulbaceae (class Deltaproteobacteria), possess a novel metabolic lifestyle based on long-distance electron transport (Nielsen et al., 2010; Pfeffer et al., 2012). They have recently been assigned the candidate genus-level names Electrothrix and Electronema (Trojan et al., 2016). These filamentous bacteria, which can grow in excess of 2 cm, oxidize sulfide in deeper sediments, and conduct the resulting electrons along their longitudinal axis up to the oxic zone, where the electrons are used in the reduction of oxygen (reviewed in Nielsen and Risgaard-Petersen, 2015). Cable bacteria were recently documented in a number of natural settings, including in organic-rich coastal sediments with steep sulfide gradients in the southern North Sea (Malkin et al., 2014; Seitaj et al., 2015), in a mangrove sediment (Burdorf et al., 2016), and in a riverine sediment in Denmark (Risgaard-Petersen et al., 2015). By contrast, they were not observed in coastal bioturbated sandy sediments, possibly due to an inability to sustain mechanical disruption associated with sediment overturning by infauna (Malkin et al., 2014). Field observations are still few, though gene sequence archives suggest a cosmopolitan distribution, leading to the hypothesis that cable bacteria are likely active in many sedimentary habitats, where bottom waters are oxygenated and the sediment sustains a sufficiently high sulfide production (Malkin et al., 2014). Overall however, the basic ecology of cable bacteria, including their life history, distribution, and the biogeochemical consequences of their metabolism, is only beginning to be unraveled.
Recent laboratory experiments have demonstrated that the influence of cable bacteria on sediment geochemistry can be profound (Risgaard-Petersen et al., 2012; Rao et al., 2016). Even in organic-rich sediments sustaining high rates of sulfate reduction, cable bacteria are capable of removing free sulfide to below detection limits (~1 μM) from the sediment surface down to depths of nearly 2 cm (Nielsen et al., 2010; Risgaard-Petersen et al., 2012), due to their high affinity for sulfide (Meysman et al., 2015). The electrogenic metabolism of cable bacteria also imparts a strong geochemical effect on the elemental cycling by affecting the distribution of acidity in the pore water. In deeper sediment layers, cable bacteria harvest electrons from sulfide by anodic half-reactions (e.g., ½H2S + 2H2O → ½ + 4e− + 5H+), which generate protons and thereby causes an acidic dissolution of both iron sulfides and calcium carbonates (Risgaard-Petersen et al., 2012; Rao et al., 2016). Near the sediment-water interface, electrons are transferred to oxygen or nitrate by cathodic half-reactions, which consume protons (e.g., O2 + 4e− + 4H+ → H2O; Nielsen et al., 2010; Marzocchi et al., 2014), and hence elevate the pH. The interplay of anodic and cathodic reactions generates a characteristic pH depth profile which is a useful diagnostic indicator of cable bacteria activity (Nielsen et al., 2010; Meysman et al., 2015; Seitaj et al., 2015).
The objective of the present field study was to examine whether the strong geochemical impact of cable bacteria on sedimentary cycling, previously observed in laboratory experiments, also occurs in the natural environment. Based on previous observations of cable bacteria abundance in other highly reducing coastal sediments (Malkin et al., 2014), we hypothesized that the organic-rich sediments within bivalve reefs may be a natural habitat for cable bacteria. Our first goal was to assess whether sediments within intertidal bivalve reefs in the Wadden Sea support the presence and activity of cable bacteria. Our subsequent goal was to investigate whether the strong geochemical effects (i.e., sulfide removal and acid-mediated cation production) that has been observed in laboratory time course studies (Risgaard-Petersen et al., 2012; Rao et al., 2016) and predicted by model simulations (Meysman et al., 2015) are also observed in a natural habitat where cable bacteria are abundant.
Materials and Methods
Study Site and Sampling Strategy
The field study was conducted on intertidal bivalve reefs located on the northeast shore of the barrier island of Texel (Wadden Sea, The Netherlands; Figure 1A). Sampling was conducted twice, in June and September 2013. The study area mainly consists of sandy intertidal flats, upon which elevated bivalve reefs emerge, consisting of organic-rich mud and patches of bivalve aggregates. Inshore of these reefs, the sediment consists of permeable sands with high densities of burrowing fauna, especially the lugworm Arenicola marina (~50 m−2), and a patchy distribution of other burrowing fauna, including the capitellid (polychaete) worm, Heteromastus filiformis. The bivalve colonization history in the Wadden Sea is complex and is still undergoing rapid change (Donker et al., 2015). The bivalve communities investigated here formed mature, elevated beds, composed of a mix of Blue Mussels (Mytilus edulis) and Pacific Oysters (Crassotrea gigas) at varying proportions.
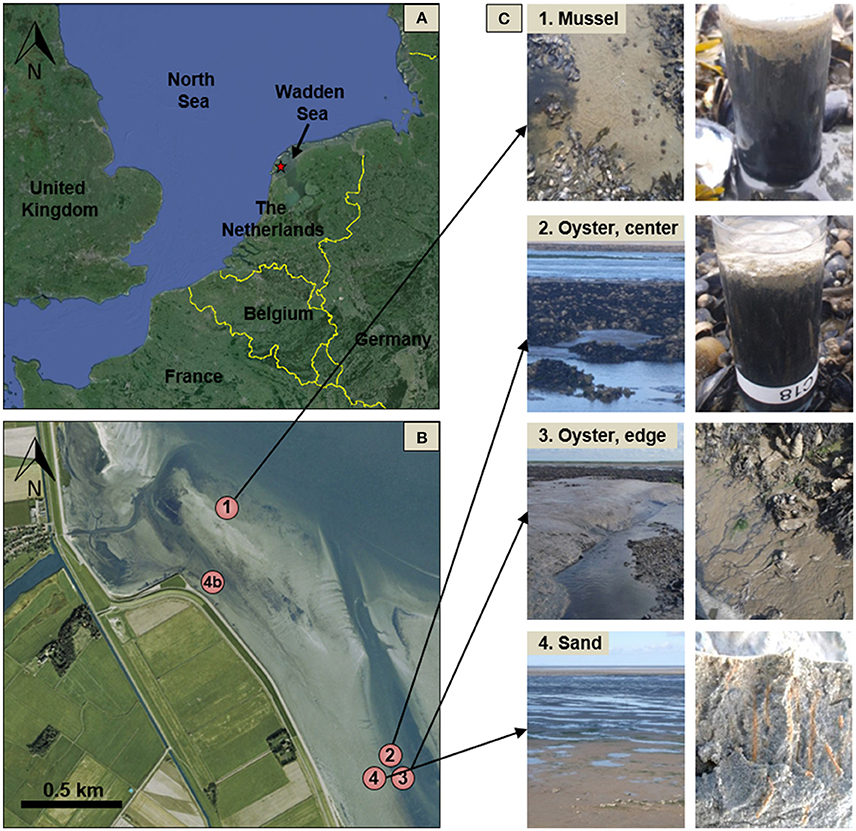
Figure 1. Maps and illustrative photographs of study sites and sediments. Overview of region where bivalve reef study was located (A). The study took place just off the shore of the Wadden Sea barrier island of Texel (The Netherlands; marked by a red star). Detail overview of intertidal reef site locations (B), and photographs of sites and sediment for each site (C). Site 1 is located within a mussel reef (“Mussel”); surface sediment between Blue Mussels prior to core removal is shown. Core liners (C) are 10 cm in height. Sediment retrieved from the mussel reef has an oxidized brown surface with a sharp transition to sulfidic sediment. Site 2 is located in a high relief mature Pacific Oyster reef (“Oyster, center”) and exhibits a similar appearance to the sediment from Site 1. Site 3 is located on the edge of the oyster reef, adjacent a tidal channel (“Oyster, edge”) where there is a higher sediment accumulation. Sulfidic porewater is seen to seep from the tidal channel walls during ebb tide. Site 4 is located on the permeable sands inshore of the oyster reef (“Sand”). A sediment cross-section (~15 cm height) reveals Heteromastis burrows, and the area has a high density (~50 m−2) of Arenicola burrows. An additional sediment core was retrieved from Site 4b, which was highly similar Site 4, for core scanning and 210Pb analysis. Maps were created from Google Earth with available imagery dates of April 2013 (A) and 2004 (B).
Sediment sampling was conducted at three sites within the bivalve reefs, chosen to represent a range of different bivalve community compositions, and one site on the sandy intertidal flat outside the reefs (Figure 1B). Site 1 (“mussel reef”; 53.159° N, 4.890° E) was located on a reef where over 80% of the bivalves were M. edulis. The reef consisted of clumps of mussels attached to each other by byssal threads and separated by patches of muddy sediment, and was elevated to between 20 and 40 cm above the sand (Nieuwhof, unpub. data). Sediment was collected from the muddy patches between mussels, where mud had accumulated to about 10 cm above a layer of bivalve shell fragments. Sites 2 and 3 were located in an adjacent reef where C. gigas were dominant and sediment was collected between patches of oysters. Site 2 (“oyster reef center”; 53.147° N, 4.903° E) was located on top of the C. gigas reef while Site 3 (“oyster reef edge”; 53.147° N, 4.904° E) was located at the edge of the reef, where the reef bed was cut by a tidal channel and the depth of accumulated muddy sediment was greatest (>70 cm). Site 4 (“Sandy”; 53.147° N, 4.902° E) was located shoreward of the oyster bed, and consisted of permeable sandy sediment heavily colonized by A. marina and H. filiformis. Additionally, a core was retrieved from Site 4b, which was a heavily bioturbated sandy sediment similar to Site 4, and this sediment core was used for core scanning and 210Pb analysis (Figure 1).
At each sampling site, six sediment cores were retrieved during each of the two campaigns and used for various analyses, as subsequently described. Sediment was collected at low tide by manual core insertion using Plexiglas core tubes (Ø = 36 mm, height = 10 cm). Sediment cores were kept in the dark in a cooler and maintained at the ambient water temperature during transport (~6 h). Upon return to the laboratory, sediment cores were transferred to an aquarium with seawater collected from the study site during the previous high tide and allowed to rest overnight before microsensor profiling. Sediment microsensor profiling always began within 18 h of sampling. This period of dark incubation prior to analysis was critical to allow any pH elevation associated with photosynthesis to relax prior to microsensor profiling (Malkin and Meysman, 2015).
Fluorescence In situ Hybridization (FISH)
To quantify the filament density of cable bacteria through depth, we employed fluorescence in situ hybridization (FISH) techniques. Sediment cores were sliced at 0.25 cm intervals from the sediment surface down to 1.0 cm depth, then at 0.5 cm intervals down to 3.0 cm. A sediment aliquot (0.5 cm3 wet volume) was preserved in 50% ethanol (final volume) in a microcentrifuge tube and stored at −20°C until analysis. The oligonucleotide probe DSB706 with a 5′ fluorescent reporter was used with a 45% formamide concentration in the hybridization buffer (Manz et al., 1992; Daims et al., 2005), which effectively targets cable bacteria (Pfeffer et al., 2012; Schauer et al., 2014; Malkin et al., 2014). Slide preparation and FISH hybridization were performed using methods previously described in Malkin et al. (2014). Briefly, an aliquot (10 μL) of slurried sediment was applied to a filter (pore size 3 μm), which served to reduce the abundance of very fine sediment particles associated with cable bacteria filaments. Cells were hybridized on slides using standard procedures (hybridization buffer at 46°C for 3 h; washing buffer at 48°C for 15 min), then rinsed and counterstained with 1 μg mL−1 4,6-diamidino-2-phenylindole (DAPI). FISH probes EUB338-I and non-EUB were used as positive and negative controls, respectively. In the bivalve reef sediments (Sites 1–3), a minimum of 100 (June) or 200 (September) randomly chosen fields at 1000X magnification were evaluated for the presence of cable bacteria. In fields where probe-stained filaments were present, the length and diameter of each filament was measured within that field, and these values were used to quantify the density of filaments per sediment volume. We report cable bacterial density as the sum of lengths of filaments per bulk volume of sediment, consistent with previous reports (Schauer et al., 2014; van de Velde et al., 2016). Areal filament density is calculated by integrating the volumetric density down to the deepest depth where filaments were observed. In the sandy sediment (Site 4) in the June samples, no probe-stained filaments were observed in the first 100 random fields samples, and so the entire filter was additionally scanned at 400X magnification. One randomly sampled core from each site was examined.
Microsensor Profiling
High-resolution microsensor profiling of O2, pH, and H2S was performed on 3 sediment cores retrieved from each site (one set of profiles per sediment core). Microsensor profiling was performed using commercial microsensors operated with a motorized micromanipulator (Unisense A.S., Denmark), as described previously (Malkin et al., 2014). Briefly, sediment was brought up to level with the core liner edge, and cores were placed in an aquarium containing water collected during high tide from the field site (salinity ~29). The temperature was held at the mid-day average water temperature on the sampling dates, which was 16 ± 1°C in both June and September. An airstream was provided at the water surface to create continuous water flow over the sediment, creating a diffusive boundary layer of ~200 μm in height. The O2 and H2S microelectrodes each had tip diameters of 50 μm and pH microsensors had a tip diameter of 200 μm. O2 depth profiles were recorded at 50 or 100 μm vertical increments and H2S and pH depth profiles were made at 200 μm increments in the oxic zone, and at 200 or 400 μm below the oxygen penetration depth. Calibration procedures were conducted as previously described (Malkin et al., 2014). pH is reported on the total scale (calibrated with both NBS and TRIS buffers) and total dissolved sulfide was calculated from the H2S and pH measured at the same depth. The oxygen penetration depth (OPD) was operationally defined as the sediment depth where the O2 concentration drops below 1 μM. The suboxic zone was operationally defined as the space between the oxic zone and the zone where sulfide was detectable.
Porewater Analyses
Porewater was extracted and analyzed from duplicate sediment cores taken from each site during both campaigns. Sediment cores were sectioned anaerobically in a glove bag (Coy Chambers, Grass Lake, Michigan, USA) filled with a nitrogen atmosphere at 0.5 cm increments over the top 5 cm and at 1.0 cm increments below. The sediment from the sandy site (Site 4) yielded less porewater than did the muddy sediments, so the porewater extracted from 2 cores was pooled for the various analyses. Porewater was extracted from the muddy sediment by centrifugation (2500 rpm for 10 min in 50 mL Falcon™ tubes). Porewater recovery from the sandy sediment (Site 4) required a modified procedure. The bottom half of a 50 cm3 syringe was used as a sediment cup to which an in-line syringe filter containing a 25 mm GF/C glass fiber filter was attached via a Luer lock. The filter and modified syringe were placed inside a centrifuge tube, and sediment was added to the syringe cup. During centrifugation, the porewater is expressed through the filter and collects at the bottom of the centrifuge tube.
Following centrifugation, filtered porewater (0.2 μm) was distributed and preserved as follows: 1 mL was acidified with 6N HCl (10% final concentration) and kept at 5°C until further analysis; 2 mL was transferred to headspace vials and preserved with mercuric chloride (HgCl2; 1% final concentration) for dissolved inorganic carbon (DIC) analysis; the remaining volume was transferred to microfuge tubes and frozen at −20°C for analysis. In June, the acidified samples were analyzed for sulfate () by ion chromatography (Dionex AS-14 analytical column, Thermo Scientific). In September, these samples were analyzed for calcium (Ca2+), total dissolved iron [Fed = Σ(Fe2+ + Fe3+)], total dissolved manganese [Mnd = Σ(Mn2+ + Mn3+ + Mn4+)], and by inductively coupled plasma-optical emission spectrometry (ICP-OES; Perkin-Elmer). DIC was measured with an AS-C3 analyser (Apollo Scitech, Newark, Delaware, USA), immediately after sample acidification. Porewater was measured with a Seal QuAAtro autoanalyser, using standard colorimetric techniques (Aminot et al., 2009). All sediment handling was conducted under nitrogen atmosphere, except for acid and HgCl2 additions, which were conducted under normal atmosphere. Acid additions were conducted immediately following exposure to air to minimize oxygen exposure.
Solid Phase Analyses
Porosity was calculated from the water content and solid phase density using one core collected from each site during each campaign. Water content was measured as the change in weight following drying in an oven at 60°C to constant weight and solid phase density was measured by volume displacement of dried and pulverized sediment.
The solid phase sediment portion that remained following centrifugation was analyzed for carbon content with a Flash 2000 elemental analyser (Thermo Scientific). Sediment samples were lyophilized and ground to a fine powder. Total carbon (Ctot) content was first analyzed, and organic carbon (Corg) content was subsequently analyzed following sample acidification with 0.1N HCl. Inorganic carbon (Cinorg) content was calculated as the difference between Ctot and Corg and is interpreted here to fully consist of calcium carbonate (CaCO3).
Grain size and chlorophyll a (Chla) content of the surface sediment (top 0.5 cm) were quantified from duplicate cores. Sediment grain size was measured by laser diffraction using a Malvern Mastersizer 2000. Pigments were extracted with 90% (v/v) acetone from lyophilized sediment fractions, which were mechanically disrupted with 1 mm beads and a BeadBeater for 20 s and kept cooled with dry ice. Extracted Chla concentration was then measured by high performance liquid chromatography (Dionex).
To better characterize the sediment deposition regime at the different sites investigated, we subjected a subset of longer cores to core scanning and 210Pb analyses. The activity of 210Pb was determined from a sediment core collected from the Oyster Reef Edge (Site 3) and the bioturbated sandy sediment inshore of the bivalve reefs in May 2013 (Site 4b). After splitting the core liners, high-resolution color images of the sediments were made with a scanning camera mounted on an X-ray fluorescence (XRF) core scanner (AVAATECH; Alkmaar, The Netherlands). X-ray images of internal structure of the sediment were obtained with a cabinet X-ray system (Hewlett-Packard Faxitron, Tucson, AZ, USA). Sediment subsamples were then collected at 5 cm intervals. For determination of 210Pb activity the activity of its granddaughter isotope, 210Po (half-life 138.4 days), was measured by alpha-spectrometry using a Passivated Implanted Planar Silicon (PIPS) detector (Canberra, Meriden, CT, USA), following the methods of Boer et al. (2006). Rates of sediment deposition were estimated by applying a model of constant flux/constant sedimentation and accounting for sediment diffusion by bioturbation in the upper sediment layer (Boer et al., 2006).
To investigate rapid sediment accretion at the mussel reef (Site 1), the activity of Beryllium-7 was measured in one sediment core collected in June. The core was sliced at 0.5 cm increments from the surface to 3 cm depth and 7Be activity was measured by gamma counting for 48 h with a high purity germanium (HPGe) Well Detector (Canberra) and determined by integrating the counts under the peak located at 477.6 keV.
Diffusive Oxygen Uptake
Dissolved oxygen uptake (DOU) was calculated from the oxygen depth profile using Fick's First law of diffusion as: JO2 = −ϕ Ds·∂CO2/∂x, where porosity (ϕ) from the uppermost sediment slice was used and Ds is the tortuosity-corrected diffusion coefficient. The diffusion coefficient was corrected for the tortuosity as Ds = Do/Θ2; where Ds is the effective diffusion coefficient, Θ2 is the tortuosity, and Do is the diffusion coefficient at infinite dilution. Do was obtained from the R package marelac v. 2.1.4 (Soetaert et al., 2012), based on observed salinity and temperature values. Tortuosity was calculated as Θ2 = 1 − 2ln(ϕ) (Boudreau, 1996). The concentration gradient (∂CO2/∂x) was calculated by linear regression of the oxygen depth profile just below the sediment water interface.
Current Density
The combination of microsensors used (i.e., O2, H2S, and pH) enabled the detection of the metabolic activity of cable bacteria (Nielsen et al., 2010; Pfeffer et al., 2012). Electrogenic sulfur oxidation (e-SOx) by cable bacteria creates a pH profile in surface sediments which provides a characteristic geochemical signature (Meysman et al., 2015). Specifically, the cathodic oxygen reduction consumes protons, creating a pH maximum in the oxic zone (i.e., O2 + 4e− + 4H+ → H2O). Deeper in the sediment, protons released through the anodic sulfur oxidation creates a broad pH minimum near the sulfide horizon (H2S + 4H2O → + 8e− + 10H+). The spatial decoupling of these two redox half-reactions involved in e-SOx is sustained by a transport of electrons within the sediment from deeper sulfidic layers to the oxic zone. Although the cycling of the electrons itself cannot be directly measured, the disappearance/appearance of reagents/reaction products in the pore water due to the half-reactions can be quantified.
The current density (Je−) associated with this electron transport (i.e., the electrical current per unit of sediment area) can be estimated in a number of ways from the stoichiometry of the e-SOx process. Here we calculated current density using two different methods. First, we calculated a minimum current density estimate using an alkalinity balance method, as described previously (Nielsen et al., 2010; Malkin et al., 2014). Cathodic proton consumption associated with e-SOx was calculated as the sum of the upward and downward alkalinity fluxes away from the shallow subsurface pH maximum:
This expression assumes that all alkalinity generation is due to e-SOx and the consumption of one proton accompanies the removal of one electron, following the stoichiometry of Equation 1. Alkalinity fluxes were calculated as described in detail in Malkin et al. (2014) and Rao et al. (2014). These expressions assume that electrons are transferred to oxygen, though in reality a smaller proportion may be transferred to nitrate, which would result in a somewhat lower current density (Marzocchi et al., 2014; see also Discussion).
Secondly, we calculated current density from the sulfate production associated with anodic sulfide oxidation by quantifying the sulfate production over the suboxic zone (see Appendix 1 for details and underlying assumptions).
The stoichiometry of the anodic reaction shows that 8 moles of electrons are generated for each mole of sulfate that appears in the pore water. The resulting current density is expressed as an electron flux (mol e− m−2 s−1) and subsequently converted to mA m−2 using the conversion 1 mA = 1.036 × 10⁻⁸ mol e− s−1. In principle, both methods (cathode-based alkalinity balance and anode-based sulfate balance) should yield the same current density, as no electrons accumulate in the sediment.
Solute Fluxes and Production Rate Estimations
The apparent production and consumption rates of porewater solutes (, Ca2+, Fed, Mnd, DIC) were estimated from concentration depth profiles of the muddy bivalve reef sediments (Sites 1–3). The software program PROFILE was used, which enables a robust estimate of fluxes and production rates in sediments where molecular diffusion and bio-irrigation are the dominant transport processes (Berg et al., 1998). Upper and lower concentration boundary conditions were set to observed concentrations in the overlying water and at the bottom of the modeled zone (6.5 or 7.5 cm depth), respectively. Biodiffusion and non-local bioirrigation were assumed negligible. Molecular diffusion coefficients for each solute were obtained from the R package marelac and corrected for tortuosity, following the same procedure as for oxygen.
In the presence of cable bacteria, the distribution of ions is additionally affected by ionic drift associated with e-SOx (Risgaard-Petersen et al., 2012). That is, the electrical currents induced by cable bacteria generates an electrical field over the zone where cable bacteria are active. This electrical field drives a countercurrent of ions in the interstitial waters of the sediment known as ionic drift (Risgaard-Petersen et al., 2012, 2014). Consequently, in the oxic zone and suboxic zone, the production and consumption estimates of charged porewater solutes should account for the transport via ionic drift in addition to molecular diffusion.
As ionic drift is an advective term, the effects of the electric field on porewater ion distribution cannot be computed using the PROFILE software (which does not account for advective terms in the underlying diagenetic Equation; Berg et al., 1998). Specifically, e-SOx drives an upward transport of cations (e.g., Ca2+, Fe2+, Mn2+, and ) and so ignoring the effect of ionic drift may lead to an underestimation of their production rates. Electrogenic sulfur oxidation also drives a downward transport of anions (e.g., , ), potentially leading to a substantial overestimate of their production rates (Risgaard-Petersen et al., 2012, 2014). Accordingly, in this study, all fluxes of ions were first calculated using PROFILE, and then suitably corrected for ionic drift. To implement this correction, we calculated fluxes according to the Nernst-Planck Equation, which accounts for the combined effect of molecular diffusion and ionic drift:
Here, J is the flux of a solute, ϕ is sediment porosity, Ds is the tortuosity-corrected diffusion coefficient, and dC/dz is the concentration gradient (Risgaard-Petersen et al., 2012; Damgaard et al., 2014). The second term within the parentheses describes the ionic drift induced by e-SOx, where z is the charge of the ion of interest (where a positive charge drives a drift toward the oxic zone, and a negative charge drives a drift toward the sulfidic zone), C is the concentration of the ion (taken as the mean over the top 1.5 cm), F is the Faraday constant (96485.34 C mol−1), R is the universal gas constant (8.31 J K−1 mol−1), T is absolute temperature (K), and E is the electrical field generated by the e-SOx. The electrical field was calculated as the quotient of the current density (as estimated above) divided by the effective sediment conductivity (σsed), i.e., E = Je−/ σsed. The sediment conductivity was further calculated as σsed = ϕ/Θ2·σPW, where σPW is the conductivity in the porewater, which was calculated as a function of local salinity and temperature using the R package marelac (Soetaert et al., 2012). The ionic drift term was calculated for each ionic porewater constituent, and these were added to the diffusive fluxes derived from PROFILE, to finally arrive at the effective fluxes at the upper and lower boundaries of the suboxic zone.
Statistics
Geochemical rates were compared across sites with ANOVAs, followed by post-hoc Tukey tests, using a significance cut-off of 0.05. DOU was additionally compared between dates (within sites) with a Student t-test. All statistics were performed with in the software environment R using the standard statistics package.
Results
Sediment Deposition and Granulometry
At the intertidal bivalve reef sites, evidence of large burrowing infauna, such as fecal casts of the lugworm Arenicola marina, were not observed (Figure 1). Furthermore, at the time of sampling, a sulfur oxidizing bacterial mat (e.g., Beggiatoa), which can sometimes be seen on top of organic rich sediments, was not observed at any site. The near absence of Beggiatoa-like filaments was confirmed by microscopy. Sediment surface chlorophyll concentrations were between 36 and 87 μg Chla g−1 DW at the mussel site (Site 1), and 766 and 198 μg Chla g−1 DW at the oyster reef edge site (Site 3) (Table 1). The sandy permeable sediment inshore of the bivalve reefs (Site 4), by contrast, supported an abundance of infauna with Arenicola marina density estimated at 50 m−2 (survey of fecal casts at low tide). Numerous red burrow linings from Heteromastis filifomis were also visible in this sediment in June (Figure 1). Chla concentrations were lower here than the bivalve reef sediments, with concentrations of 7 and 3 μg Chla g−1 DW in June and September, respectively (Table 1).
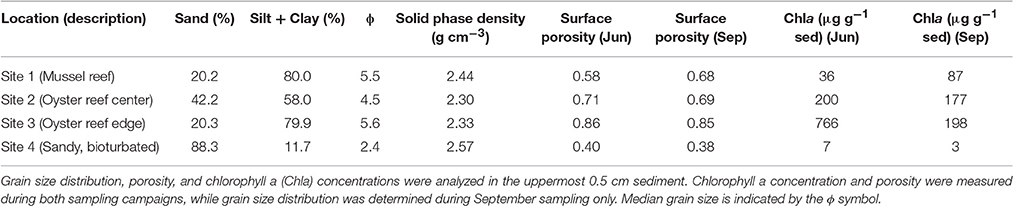
Table 1. Characteristics of sediment obtained from study sites.
Sediment collected from the bivalve reefs (Sites 1–3) was predominantly composed of silt and clay sized particles, but all exhibited high variability in downcore organic matter content and porosity, highlighting a dynamic deposition regime (Table 1, Figure 2). Below a light colored surface sediment layer (~0.5–1.5 cm), the sediment was dark brown-black (Figure 1) and median grain size varied between 21 μm (ϕ = 5.6) and 44 μm (ϕ = 4.5). Downcore porosity was also highly variable, ranging between 0.78 and 0.42 across all cores, highlighting a variable and episodic sediment deposition and erosion history. The sediment cores retrieved from the oyster reef edge (Site 3; 67 cm long) consisted of muddy sediment in the upper 45 cm with fine irregularly spaced laminae (~2–18 mm; Figure 3A). Such laminations indicate that sediment mixing by infauna is negligible (La Croix et al., 2015). Sedimentation rate estimated by 210Pb analysis was 13.8 cm yr−1 in the uppermost 45 cm of sediment, suggesting that the laminated sediment represents deposition between the years 2010 and 2013.
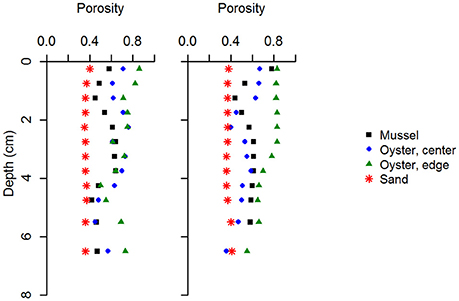
Figure 2. Sediment porosity at the four study sites on and near the bivalve reefs, shown for samples collected in June and September. Site names as before.
Figure 3. Activity of 7Be in surface sediment retrieved from the mussel reef (Site 1) (A). The two low values correspond to higher sand deposition rates. An exponential decline of best fit is shown and yields an estimate of sediment accumulation rate of 6.7 cm yr−1. Depth profiles of excess 210Pb (top), light photograph (bottom left), and x-ray fluorescence core scanning images (bottom right), at the oyster reef edge (Site 3; panel B). Excess 210Pb is plotted against cumulative mass depth (CMD; g cm−2) to estimate the sediment accumulation rate. The oyster reef core is 67 cm and is distinctly laminated in the upper 40 cm (B). Sediment accumulation rate is estimated at 13.8 cm yr−1 between 2010 and 2013. The same variables are shown for a permeable sand located inshore of the reefs (Site 4b; panel C). The permeable sand core is 38 cm (B) and appears well mixed by diffusive mixing in upper 20 cm, which prevents determination of sediment accumulation rate in this zone. Sediment accumulation rate below the zone of intensive mixing is estimated at 0.3 cm yr−1.
At the sandy site inshore of the bivalve reefs (Site 4), the sediment was mostly composed of fine and medium grained sand. Median grain size was 191 μm (ϕ = 2.4) and downcore porosity varied only slightly, between 0.35 and 0.41 (Table 1). The sediment core from the sandy site (Site 4b; 38 cm long) consisted of relatively homogeneous sediment in the upper 20 cm, with vertical burrows visible in X-ray images, consistent with strong sediment mixing by the bioturbating infauna observed at this site (Figure 3B). Below this sandy unit, a shell layer was present. Accounting for a mixed depth layer of 20 cm resulting from bioturbation, the average sedimentation rate was 0.29 cm yr−1 based on the 210Pb profile.
In addition to 210Pb at the oyster reef, the 7Be activity in the surface sediment was measured at the mussel reef (Site 1). 7Be activity decreased from 42 Bq kg−1 sediment at the surface to 2 Bq kg−1 by 1.0–1.5 cm depth, but increased again to higher values below (up to 29 Bq kg−1 at 1.5–2.0 cm; Figure 3C), with a depth-integrated inventory of 7Be was 168 Bq m−2. Such a high inventory indicates a recent deposition of fresh material. We interpret the subsurface minimum in 7Be activity as the deposition of a resuspended sand layer in between two biodeposited muddy layers, signifying a highly dynamic sedimentation history. To calculate the sedimentation rate, we excluded the data points of the intermediate sand layer, which resulted in the relationship: A(z) = 32.6 exp[−0.113] * z; with r2 = 0.94, yielding a sedimentation velocity estimate of 6.7 cm yr−1. Therefore, similar to the oyster site, the mussel reef site shows a high sedimentation velocity.
Carbon Cycling and Organic Matter Diagenesis
Sediment cores from the bivalve reefs generally had a high organic matter content, with Corg values between 0.4 and 4.4% (Figure 4). The bivalve reefs were also rich in calcium carbonate (CaCO3) content with values between 11.1 and 17.0% CaCO3 at the sediment surface, declining to 6.1–9.7% at 7.5 cm depth (Figure 4). Relative to the bivalve reef sediments, the sandy sediment at Site 4 had a low Corg content (mean 0.10 and 0.18 %, in June and September, respectively) and low CaCO3 (range: 0.95–2.1%), with no apparent increase toward the sediment surface.
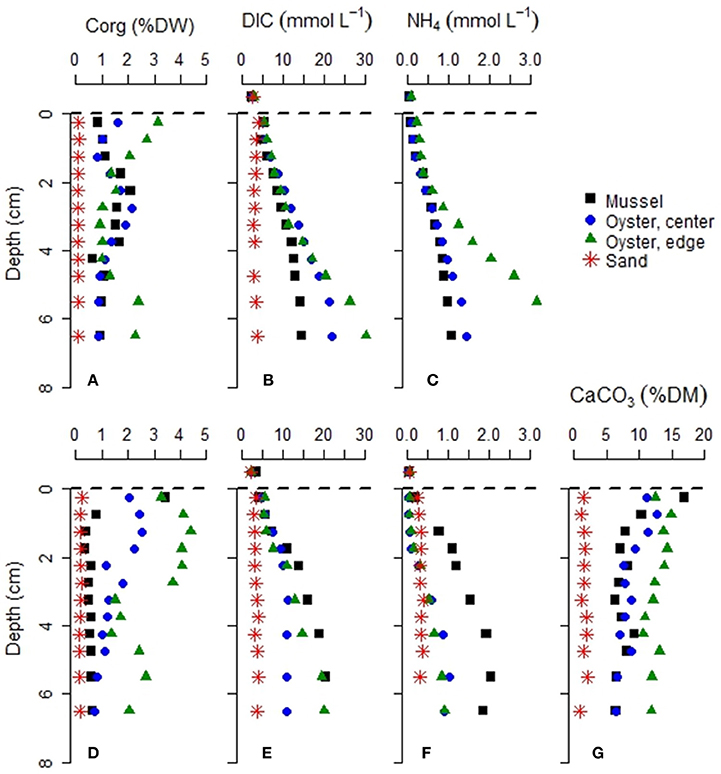
Figure 4. Characteristics associated with sediment diagenesis at the four study sites. Sediment samples were collected in June (A–C) and September (D–G). NH4 concentrations were not available for Site 4 (sandy permeable sediment) in June, and CaCO3 was estimated only in September.
Porewater DIC and concentrations at the bivalve reefs (Sites 1–3) increased rapidly with depth. For example, in June, DIC concentrations at the Oyster Reef Edge (Site 3) increased from 2.6 mM in the overlying water to 30.3 mM by 6 cm depth while concentrations increased from 0.05 mM in the overlying water to 3.5 mM (Figure 4). By contrast, porewater DIC at the sandy site (Site 4) remained below 4.1 mM at all depths in both seasons, and was usually lower than in the bivalve reefs sediments. concentrations at the sandy site were also lower, ranging between 0.24 and 0.35 mM.
The depth distribution of DIC concentration in the bivalve reef sediments (Sites 1–3), typically followed a sigmoidal curve with an inflection point near or below the depth of the pH minimum, indicating an apparent DIC consumption in the upper 3 cm, and a net DIC production at deeper depths, as expected from organic matter mineralization (Figure 4). The maximum DIC production rates at depth varied between 305 ± 2 μmol L−1 d−1 (mussel reef site in June) and 2507 ± 373 μmol L−1 d−1 (oyster reef edge site, September). Together with the depth profiles of NH4+, and O2 (detailed below), these data are indicative of very high respiration rates on intertidal bivalve reefs.
Cable Bacteria Density
Cable bacteria were detected by FISH in all sediment samples examined, with high densities of filaments observed in all bivalve reef sediments, and lower densities at the sandy site (Table 2) (Supplementary Material). Integrated through depth, the filament densities on the bivalve reefs (Sites 1–3) were 248–1038 m cm−2 in June, and 59–280 m cm−2 in September. The areal density at the sandy bioturbated sediment (Site 4) was near the threshold of our detection limits in June (<0.2 m cm−2), but a higher density was observed in September (56 m cm−2). In all cases, the filament density was greatest near the sediment surface and declined quickly with depth, with few filaments observed below 1.5 cm in any core (Figures 6, 7). In the uppermost sediment slice of the bivalve reef sites (0–2.5 mm), volumetric densities were 452–2859 and 141–791 m cm−3 in June and September, respectively. The filament density observed in the uppermost 0.5 cm represented between 59 and 93% of the total areal density. The deepest filaments were observed at the Oyster Reef Edge (Site 3) in September, where the sulfide appearance depth was deepest. Based on average bacterial cell length of 3 μm, cable bacteria cell density ranged between 6.0 × 10⁸ and 9.5 × 10⁸ cells cm−3. Using microbial cell densities of 4.4 × 10⁹ cells cm−3 typical of surface muddy sediment in the intertidal zones of the Wadden Sea (reviewed in Musat et al., 2006), densities of cable bacteria in the top 0.5 cm represent between 1.1 and 21.7% of the total microbial community. This upper estimate is similar to the estimated proportion of cable bacteria (25%) in the microbial community of a laboratory incubation study (Schauer et al., 2014).
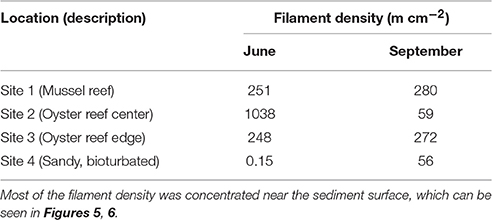
Table 2. Density of cable bacteria filaments as determined by microscopy using FISH probes during the two sampling campaigns.
Microsensor Profiles and Current Density
In all bivalve reef sediments examined, microsensor profiling revealed a shallow oxygen penetration depth (OPD < 1 mm), which corresponded to high rates of diffusive oxygen uptake (Table 3, Figures 5, 6). Among bivalve reefs sediments (Sites 1–3), the OPD was between 0.52 ± 0.03 and 0.80 ± 0.13 mm (mean ± SD), in June and decreased to between 0.34 ± 0.06 and 0.56 ± 0.12 mm in September. Diffusive oxygen uptake (DOU) rates in bivalve reefs sediments were very high, with rates between 37.5 ± 8.1 and 108 ± 37 mmol m−2 d−1 in June and between 41.5 ± 14.4 and 126 ± 32 mmol m−2 d−1 in September. Oxygen penetration was deeper at the sandy site (Site 4: 1.67 ± 0.23 mm in June and 0.93 ± 0.14 mm in September). Here, DOU values were an order of magnitude lower, ranging between 5.3 ± 0.8 and 9.4 ± 2.4 mmol m−2 d−1 in both campaigns. DOU was significantly different between sites (ANOVA, F3, 30 = 59.00, p < 0.001), and post-hoc tests identified that DOU was lowest at the bioturbated site (Site 4), highest at the oyster reef edge (Site 3), and not different between the mussel and oyster reef center sites (Sites 1 and 2) (Tukey's HSD, p < 0.001). DOU was significantly lower in June than in September at the mussel site (Site 1: t = −10.702, df = 7, p < 0.001) and at the sandy bioturbated site (Site 4: t = −3.578, df = 6, p = 0.014).
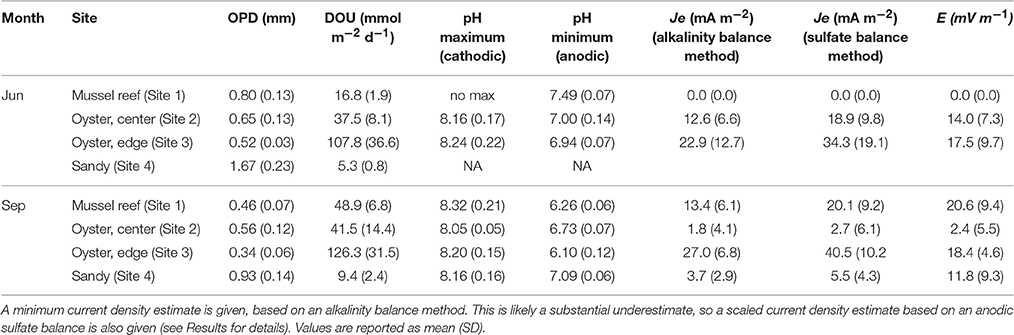
Table 3. Oxygen penetration depths (OPD), diffusive oxygen uptake (DOU) rates, pH profile parameters, current density (Je), and electric field (E), measured at the four sampling sites during two sampling campaigns (June and September).
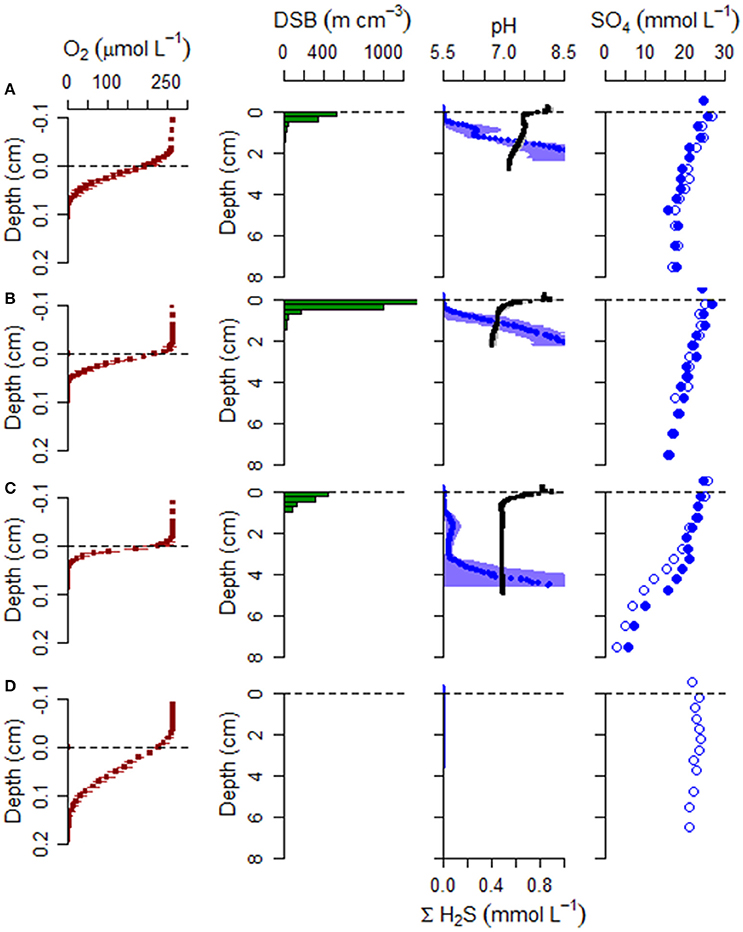
Figure 5. Geochemical and microbiology data collected during June campaign from (A) the mussel reef (Site 1), (B) the oyster reef center (Site 2), (C) the oyster reef edge (Site 3), and (D) the bioturbated sandy sediment (Site 4). Sediment samples were analyzed for cable bacteria density using DNA specific fluorescent probes, microsensor profiles (O2, pH, H2S), and analysis of extracted porewater for sulfate concentration. DSB: Desulfobulbaceae filament density. Triplicates cores were profiled for O2, pH, and H2S. For these microsensor profiles, the mean is shown with horizontal error bars for standard deviation. pH is shown in black and ΣH2S is shown in blue. Two of the cores were selected at random for slicing and porewater extraction. Sulfate data from both replicate cores are shown (filled and open symbols).
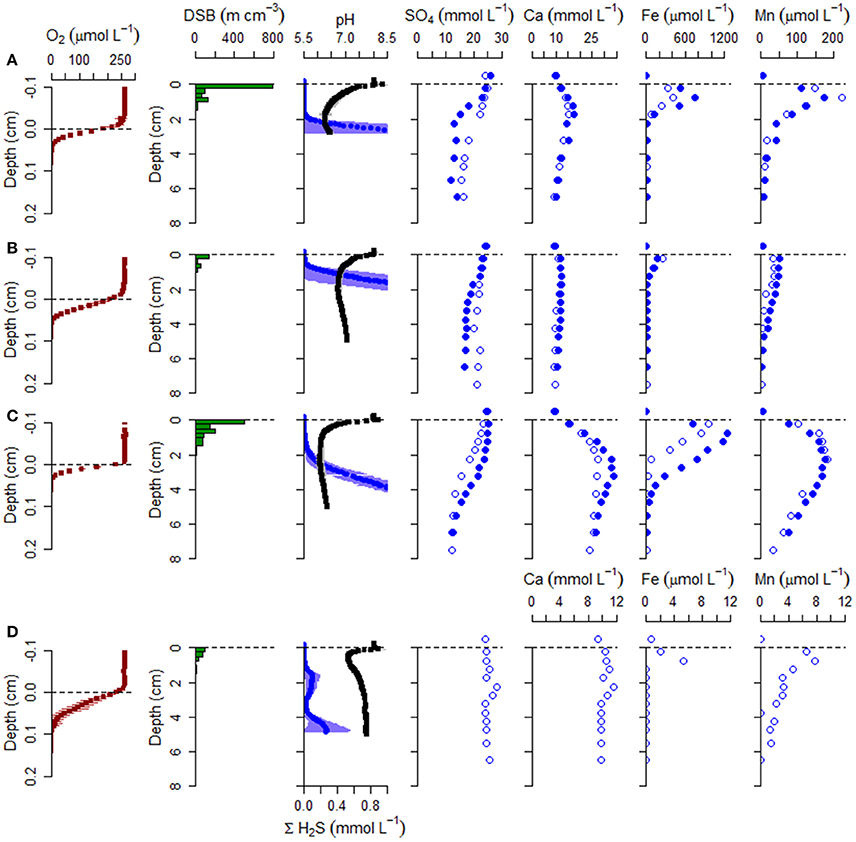
Figure 6. Geochemical and microbiology data collected during September campaign. As before, samples were collected from (A) the mussel reef (Site 1), (B) the oyster reef center (Site 2), (C) the oyster reef edge (Site 3), and (D) the bioturbated sandy sediment (Site 4). Sediment cores were analyzed for cable bacteria density (DSB), microsensor profiles (O2, pH, H2S), and porewater was extracted for analysis of , Ca2+, Fe2+, Mn2+, 4+. Oxygen is shown on its own depth axis. For microsensor profiles, the mean is shown with horizontal error bars for standard deviation, where pH is in black and ΣH2S is in blue. Note the change of scale for metal cations at the sandy site (Site 4).
Free sulfide profiles exhibited steep gradients in all cores from the bivalve reefs (Sites 1–3; Figures 5, 6), with sulfide appearance depths ranging between 4.3 ± 0.7 and 8.3 ± 1.4 mm in June and between 2.3 ± 0.8 and 18.4 ± 3.0 mm in September. At the bioturbated site (Site 4), free sulfide was not detectable at any depth (measured down to 35 mm) in June, but was observed by 5.0 ± 0.9 mm depth in September.
pH profiles retrieved from the bivalve reef sediments (Sites 1–3) were variable between sites and dates, but within-site replicates were highly similar. In June, a pH maximum was observed in the oxic zone at the oyster reefs sites, indicative of cathodic oxygen consumption by e-SOx, reaching pH maxima of 8.18 ± 0.16 and 8.26 ± 0.21, at Sites 2 and 3 respectively (Figure 5). Local pH minima (range: 6.79 ± 0.10 to 7.46 ± 0.04) were observed at all bivalve reef sites in June, in proximity to the sulfide appearance depth. In September, pH minima were present between 0.5 and 2.0 cm depth in all cores retrieved from bivalve reefs (Figure 6). At the mussel reef (Site 1) a pH maximum was observed in the oxic zone (8.32 ± 0.21) declining to 6.26 ± 0.23 in the suboxic zone and the shape of the profile was diagnostic of proton production by anodic sulfide oxidation by cable bacteria. At the oyster reef edge (Site 3), there was also a pH maximum in the oxic zone (8.24 ± 0.14), and a broad pH minimum (6.09 ± 0.10) extending to more than 3 cm depth, and the sulfide appearance depth emerged within the pH minimum, again indicative of anodic sulfide oxidation. At Site 2, there was no pH maximum in the oxic zone, but there was a broad pH minimum in the suboxic zone, which was less acidic than at the other sites (6.73 ± 0.10). At the Sandy Site (Site 4), pH profiles were not available in June, due to sensor breakage. In September, a pH maximum was observed in the oxic zone (8.22 ± 0.19), and a pH minimum was observed deeper in the sediment (pH 7.11 ± 0.11). The pH minimum was notably less acidic at the sandy site than at the bivalve bed sites.
The pH maximum within the oxic zone suggests e-SOx by cable bacteria. Cathodic oxygen reduction and minimum current density were therefore calculated for sites where there was a pH maximum in the oxic zone based on an alkalinity balance (Table 3). Current density was also calculated using the sulfate balance approach for Site 3 in September (27.0 mA m−2) and was found to be 49.7% higher than the value calculated by alkalinity balance (i.e., 40.5 mA m−2). This result is in line with current density calculations at other coastal sites in the North Sea, where the alkalinity balance method has also been shown to substantially underestimate the current density (Risgaard-Petersen et al., 2015; Vasquez-Cardenas et al., 2015; van de Velde et al., 2016). Since previously published values of the current density are based on the alkalinity balance method, this suggests that cable bacteria activity could be underestimated at the sites previously investigated. Because of the uncertainty, we report two values for Je−: the value obtained by alkalinity balance method, which we consider a minimum estimate, and a corrected value, in which we have assumed that the underestimation at Site 3 is also representative for Sites 1 and 2, and have scaled the values accordingly. Only the latter corrected values will be further used in the discussion. Current density (Je−) ranged from 2.7 ± 6.1 mA m−2 at the Oyster Reef Center (Site 2) in September, up to 40.5 ± 10.2 mA m−2 at the Oyster Reef Edge (Site 3), also in September. Cathodic oxygen reduction (COR) was strongly positively correlated with DOU (Pearson correlation, r = 0.988, n = 5), and could be described by the linear relationship: COR = 0.0605 * DOU + 1.299 (R2 = 0.976); where DOU and COR are expressed as mmol O2 m−2 d−1.
Porewater Geochemistry Profiles and Net Production Rates
In the sediment cores examined in September, porewater Ca2+, total dissolved iron (Fed), and total dissolved manganese (Mnd) exhibited a strong accumulation in the suboxic zone (Figure 6) and fluxes (corrected for ionic drift) were directed upward toward the oxic zone in all sediment cores measured. In all cases, fluxes were highest at the oyster reef edge (Site 3) and lowest at the oyster reef center (Site 2; Table 4). In the bivalve reef sediments, concentrations of Ca2+ in the overlying water were 9.5–9.8 mM and increased to maxima of 16.4, 12.2, and 30.4 mM within the suboxic zones at Sites 1–3, respectively (Figure 6). ANOVA testing revealed porewater Ca2+ were significantly different between sites (F = 20.3; df = 3,3; p = 0.017), and post-hoc Tukey's test identified that the oyster reef edge had significantly higher porewater Ca2+ concentrations than the other sites. Volumetric Ca2+ production rates in the suboxic zone were 126 – 982 mmol m−3 d−1, and were found to be significantly different between sites (ANOVA; F = 26.43; df = 2,3; p = 0.0124). The production of Ca2+ was particularly notable at the oyster reef edge (Site 3), where a broad peak was observed to span the entire measured zone. Ca2+ fluxes were between −2.5 and −29.3 mmol m−2 d−1 (where the negative sign indicates fluxes directed toward the oxic zone), and were significantly different between sites (ANOVA; F = 33.69; df = 2,3; p = 0.0088), with a significantly higher flux at the oyster reef edge (Site 3; Tukey post-hoc test). The ionic drift acted to enhance the flux toward the oxic zone by up to 5.3%. The sandy bioturbated sediment (Site 4) exhibited a weak Ca2+ maximum in the suboxic zone, reaching 11.0 mM, coinciding with the presence of cable bacteria.
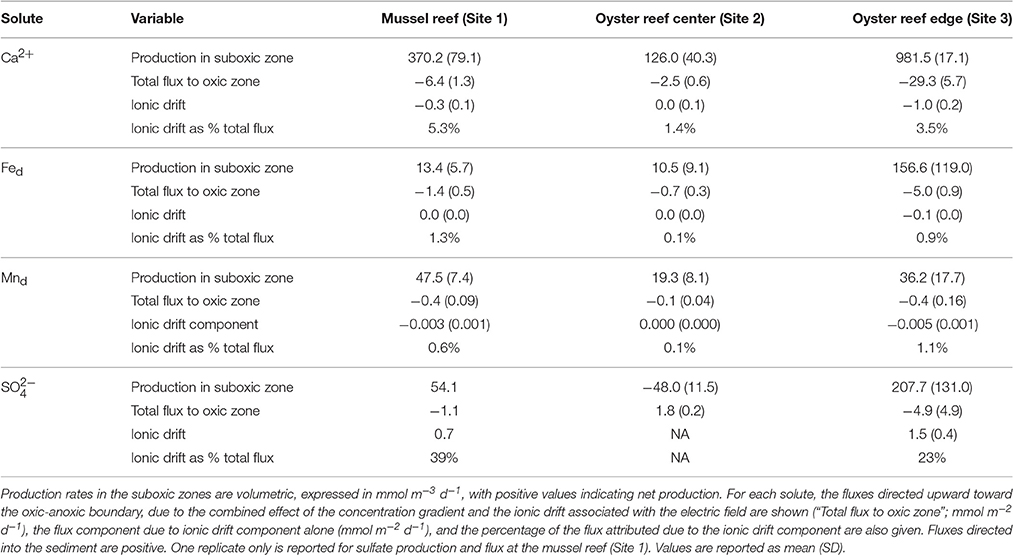
Table 4. Porewater production rate estimates and porewater fluxes extracted from concentration profiles measured in September.
Fed concentration profiles in bivalve reef sediments also indicated strong accumulation within the suboxic zone (Figure 6), while Fed concentrations were below detection in the overlying water. Maximum Fed concentrations were located within the suboxic zone with concentrations of 0.57, 0.21, and 1.0 mM at Sites 1–3, respectively. As with all the solutes, the oyster reef edge site (Site 3) had the highest solute concentrations and highest estimated production rates. The concentrations were significantly different between sites (ANOVA, F = 11.27; df = 3,3; p = 0.039), with the oyster edge (Site 3) and the mussel bed (Site 1) have significantly higher maximum concentrations than the other sites (Tukey's test). At this site, the two replicate cores exhibited similar profile shapes, but with different depth offsets, likely indicating gravity-driven lateral transport associated with an ebbing tide. The estimated volumetric production rates were 10.5–157 mmol m−3 d−1 in the suboxic zone across the three bivalve reef sites (Table 4). Fluxes of dissolved iron were between −0.7 and −5.0 mmol m−2 d−1, though differences between sites were not significantly different. Ionic drift had only a minor effect on the flux, responsible for enhancing the flux by up to 1.3%. At the sandy bioturbated Site 4, porewater Fed concentrations were close to detection limits at all depths, but with a detectable peak of 5.3 μM observed at 0.75 cm depth.
Mnd concentration profiles in bivalve reef sediments indicated high rates of production in the suboxic zone. The subsurface peak in Mnd was generally broader and extended to greater depths than Fed (Figure 6). Dissolved manganese concentrations reached 0.197, 0.043, and 0.180 mM at Sites 1–3, respectively. These maximum concentrations were significantly different between sites (ANOVA, F = 34.67; df = 3,3; p = 0.0079), with significantly higher concentrations at the oyster edge (Site 3) and the mussel bed (Site 1), based on Tukey post-hoc test. The depth-integrated production rates were 19.3–36.2 mmol m−3 d−1, though differences were not significant between sites. Fluxes were between −0.1 and −0.4 mmol m−2 d−1 and again the ionic drift enhanced the flux toward the oxic zone by only a marginal amount (up to 1.1%). At the sandy site (Site 4), Mnd concentrations were low and exhibited a maximum of 7.8 μM at 0.75 cm.
Porewater sulfate was measured during June and September campaigns. In June, sulfate declined from overlying water concentrations of about 25 mM to mean concentrations of 17.4, 15.9, and 4.4 mM, by 7.5 cm at Sites 1–3, respectively (Figure 6). During this month, net sulfate production in the suboxic zone was not detected. In September, net sulfate production was estimated in the upper sediment layer at the oyster reef edge (Site 3), with mean production rates of 208 mmol m−3 d−1. Sulfate flux was directed toward the oxic zone with a net flux of −4.9 mmol m−2 d−1. The effect of ionic drift by e-SOx on anions is to direct ions into the anoxic sediment. Ionic drift was 1.5 mmol m−2 d−1, representing a decrease of 23% of the total flux. Net sulfate production was also detected in one of the two cores collected from the mussel reef (Site 1), with a net production of 54 mmol m−3 d−1. Sulfate flux estimates were −1.1 mmol m−2 d−1 and ionic drift was 0.7 mmol m−2 d−1, which countered the total flux by up to 39%. No net production was detected at the oyster reef center (Site 2), and the net flux of sulfate was directed into the anoxic sediment at 1.8 mmol m−2 d−1. At the sandy site (Site 4), sulfate declined to 20.9 mM by 5.5 cm in June, but there was no apparent decline observed in September.
Discussion
Cable Bacteria Thrive in Muddy Sediments on Bivalve Reef
Intertidal bivalve reef sediments are a highly dynamic environment, characterized by large daily and seasonal oscillations in sediment deposition and erosional forces, and where sediment disturbance events occur frequently (Kröncke, 1996; Bergfeld, 1999; Aller, 2013). The sediments investigated in this study were mature intertidal bivalve beds, with high rates of sediment accumulation, enabling the development of muddy reefs with a high relief. Our 210Pb dating on the oyster reef edge (Site 3) showed sediment accumulation rates of 13.8 cm yr−1 over the preceding 3 years, and analysis of the short-lived cosmogenic radionuclide 7Be in mussel reef sediment revealed a sediment accumulation rate of 6.7 cm yr−1 (Site 1). These sedimentation velocities are high relative to subtidal depositional zones, but fit well within the expected range for bivalve reefs (i.e., between 5 and 20 cm yr−1; ten Brinke et al., 1995). One of the consequences of high sediment accumulation on these reefs is a large input of organic matter leading to intense generation of free sulfide (often exceeding mM concentrations in the upper 1–3 cm), leading to a diminished biomass and biodiversity of infauna (Kröncke, 1996; Bergfeld, 1999). X-ray imaging of the core collected at the oyster reef edge (Site 3) revealed a highly laminated sediment composition confirming a negligible role for mixing by fauna in these sediments. Downcore profiles of organic carbon (Corg) and porosity additionally point to a highly dynamic depositional setting, with a highly heterogeneous layering of muddy and sandy material.
This study reveals that cable bacteria can be highly successful in bivalve reef sediments, demonstrating that these microbes are capable of thriving in a dynamic environment that exhibits intense and episodic sediment accumulation. They were able colonize uppermost sediment layers despite rapid burial, potentially enabled by motility (Malkin and Meysman, 2015; Bjerg et al., 2016). Cable bacteria were observed in all sediment cores retrieved from the bivalve beds, and reached high biomass, with maximum volumetric densities in the uppermost sediment layer (median of 521 m cm−3 across all surface samples, maximum density of 2.8 km cm−3) and depth-integrated filament densities between 59 and 1038 m cm−2 (median: 262 m cm−2). Our densities of cable bacteria filaments are similar or higher than those recently reported as in situ densities from organic-rich coastal sediments (402–480 m cm−2 reported in Seitaj et al., 2015; 166–352 m cm−2 reported in van de Velde et al., 2016; 77 m cm−2 reported in Burdorf et al., 2016). Similarly high (or higher) depth-integrated densities have been observed in laboratory incubations of sediment retrieved from organic carbon and iron sulfide-rich coastal sediments (e.g., 2380 m cm−2 reported in Schauer et al., 2014; and 1095–1131 m cm−2 reported in Vasquez-Cardenas et al., 2015). Somewhat lower depth-integrated densities have been reported from a freshwater streambank (40 m cm−2, Risgaard-Petersen et al., 2015). It is noteworthy that even within a single site (e.g., oyster reef center; Site 2), the density of cable bacteria varied by more than an order of magnitude between the two sampling campaigns (Table 2). This observation reinforces that a better understanding of the factors regulating the population density of these bacteria is needed. The energy requirements of cable bacteria are thought to be fuelled in two ways: by sulfide generated from microbial sulfate reduction within and below the suboxic sediment zone (which is a function of labile carbon content), and from FeS dissolution within the suboxic zone. The release of sulfide by these two pathways likely sets an upper limit to the metabolic activity of cable bacteria (Risgaard-Petersen et al., 2012; Meysman et al., 2015; Nielsen and Risgaard-Petersen, 2015), but other factors, such as oxygen supply can additionally modulate cable bacteria activity and growth under natural conditions (Malkin and Meysman, 2015).
The Biogeochemical Fingerprint of Long Distance Electron Transport
The geochemical fingerprint of electrogenic sulfur oxidation (e-SOx) by cable bacteria, as defined in Nielsen et al. (2010), is described by two redox half-reactions, spatially separated in the sediment and connected by cable bacteria which act as electron conductors. In the bivalve reef sediments, the presence of high densities of cable bacteria co-occurred with a clear presence of the geochemical fingerprint of e-SOx. That is, in cores where cable bacteria were found at high density, there was also a pH maximum in the oxic zone, indicative of cathodic oxygen reduction, and a pH minimum near the depth where sulfide first emerged, indicative of anodic sulfide oxidation. There were some deviations in the microsensor profiles from this canonical geochemical fingerprint, however, particularly in June. In this month, the profiles of sulfide below 1 cm could not be ascribed to steady-state geochemical cycling, and instead likely reflected a recent depositional event that had not yet reached a stable depth profile. Because of the episodic nature of sediment deposition, the porewater geochemistry in these sediments may frequently depart from steady-state conditions. Nevertheless, the geochemical signature of e-SOx activity by cable bacteria was clearly evident in the uppermost centimeter of sediment, where cable bacteria were observed at high abundance, suggesting rapid growth and a rapid recovery of activity following disturbance. In contrast to June, microsensor profiles obtained during the September campaign were highly similar to expected pH distributions of e-SOx by cable bacteria under undisturbed sediment conditions (Nielsen et al., 2010; Schauer et al., 2014; Meysman et al., 2015). The differences we observed between sites may reflect both differences in stages of cable bacteria development from early growth to senescence, in addition to potential site to site differences in electron donor availability (Malkin et al., 2014; Schauer et al., 2014; Vasquez-Cardenas et al., 2015; Rao et al., 2016).
Electrical Currents in Bivalve Reef Sediments
The current density Je− associated with the electron transport by cable bacteria (i.e., the electrical current per unit of sediment area) can be estimated in a number of ways based on the stoichiometry of the e-SOx process. Specifically, (1) the proton consumption in cathodic oxygen consumption can be calculated by an alkalinity balance over the oxic zone (Nielsen et al., 2010; Malkin et al., 2014); (2) the O2 consumption due to cathodic reduction can be estimated by measuring the change in O2 consumption before and after inhibiting e-SOx (Vasquez-Cardenas et al., 2015); or (3) net production of calcium, iron, or sulfate due to anodic sulfide oxidation can be calculated by a substrate balance over the suboxic zone (Risgaard-Petersen et al., 2012).
To estimate the e-SOx activity of cable bacteria in these sediments, we first applied an alkalinity balance approach, following the methods of Nielsen et al. (2010) and Malkin et al. (2014), and then scaled these rates to those obtained by net sulfate production. Current density on the bivalve reefs was up to 40.5 mA m−2, which is similar to the minimum estimates previously reported in Malkin et al. (2014) from coastal sediments (4.6–29.9 mA m−2), using the cathodic alkalinity balance approach. However, these rates are lower than those obtained in previous incubation studies: 232 mA m−2 reported in Vasquez-Cardenas et al. (2015) and 89 mA m−2 reported in Rao et al. (2016), both of which estimated current density from changes in sedimentary oxygen uptake during growth of cable bacteria. In an incubation experiment using coastal sediments from Denmark, the current density was measured more directly using newly developed electric field sensors (95 mA m−2; Risgaard-Petersen et al., 2012). Such sensors are now enabling measurement of electrogenic activity as electric potential (Damgaard et al., 2014; Risgaard-Petersen et al., 2014), which will help resolve variability and drivers of differences in current density across systems, but were not part of the current study.
Cable Bacteria Influence Porewater Geochemistry
In time series experiments, it has been shown that cable bacteria grow downward in a sediment from the oxic zone, thus progressively clearing a zone of sulfide, and increasing the depth of the suboxic zone (Nielsen et al., 2010; Schauer et al., 2014; Rao et al., 2016). This sulfide removal cannot be explained by single celled sulfur oxidizing bacteria because the spatial separation of oxidizing and sulfidic fronts can exceed centimeter distances–scales that are too large to be spanned by single cells operating independently. Single celled sulfur oxidizing bacteria need both the electron acceptors and electron donors to be present in the same location. In the absence of physical mixing (which can re-supply solid phase iron oxides), sulfide removal over these spatial scales requires bacteria that couple spatially separated oxic and sulfidic zones. Before the discovery of cable bacteria, such distant redox coupling was thought to be solely carried out by Beggiatoa, and other related large nitrate storing bacteria with motility (Jørgensen and Nelson, 2004). The electron transport mediated by cable bacteria provides an alternative mechanism to couple redox reactions across centimeter scales. Our study demonstrates that in addition to Beggiatoa, cable bacteria need to also be considered as important sulfur oxidizers in sulfide-generating coastal sediments.
Laboratory studies have previously shown that e-SOx is associated with intense acid generation (via anodic reactions) that consequently drive calcium carbonate (CaCO3) and iron sulfide (FeS) dissolution in the anodic zone, leading to mobilization and accumulation of Ca2+ and Fe2+ in the porewater (Risgaard-Petersen et al., 2012; Rao et al., 2016). Our observations here confirm that strong dissolution of FeS and CaCO3 is observed in bivalve reef sediments, consistent with predicted activity of anodic acid generation by cable bacteria. High densities of cable bacteria were always associated with a zone of sulfide removal with a suboxic zone that varied between 2 and 18 mm. pH minima were observed in the suboxic zone (e.g., between 6.73 and 6.10 in September), illustrating the acidification of the pore water. The most acidic porewaters were found at the sites where the greatest density of cable bacteria were found. The pH minima were associated with peaks in Ca2+ and Fed, with the greatest accumulations of these cations were consistently found in the sediments with highest acidity in the suboxic zone [i.e., in September, highest at the oyster reef edge (Site 3), and lowest at the oyster reef center (Site 2)]. Maximum fluxes of Ca2+ (RCa = −29.3 mmol m−2 d−1; measured at Site 3) are similar to those observed in studies that have incubated coastal sediment with cable bacteria (i.e., −26 mmol m−2 d−1 in Risgaard-Petersen et al., 2012; and −71.5 mmol m−2 d−1 Rao et al., 2016), and greater than a recent field study in coastal sediments with cable bacteria (−15.2 mmol m−2 d−1 in van de Velde et al., 2016). Likewise, maximum fluxes of Fed (RFe = −5.0 mmol m−2 d−1) are similar to those observed in studies that have incubated coastal sediment with cable bacteria (i.e., −4 mmol m−2 d−1 in Risgaard-Petersen et al., 2012; and −2.2 mmol m−2 d−1 Rao et al., 2016) and greater than a field study in coastal sediments with cable bacteria (−1.0 mmol m−2 d−1 in van de Velde et al., 2016).
In addition to the mobilization of Ca2+ and Fed, porewater, Mnd also accumulated in the anodic sediment zones. This has also been observed in a recent laboratory incubation experiment (Rao et al., 2016), and in a hypoxic basin supporting high densities of cable bacteria (Sulu-Gambari et al., 2016). The maximum flux estimated in this study was −0.4 mmol m−2 d−1 which is higher than the maximum flux estimated by Rao et al. (2016) (RMn = −0.03 mmol m−2 d−1), but similar to a recent field study in coastal sediments with cable bacteria (RMn = −0.22 mmol m−2 d−1; van de Velde et al., 2016). The provenance of this dissolved manganese is not certain, but it has recently been proposed that acid generation may liberate soluble Mn from the surfaces of FeS and/or CaCO3, where this metal is commonly adsorbed within coastal sediments (Rao et al., 2016). The depth profiles of Mnd seen here are consistent with this hypothesis.
Previous laboratory work demonstrated that sulfide oxidation by cable bacteria was associated with large net sulfate generation, and that sulfate regeneration associated with cable bacteria may be important for stimulating sulfate reduction (Risgaard-Petersen et al., 2015). At the bivalve reefs in June, net sulfate production within the anodic zone was not observed. At this time, the geochemical legacy of a recent depositional event was still apparent and cable bacteria re-growth was likely occurring. Thus, a clear development of net sulfate production may take a longer time to develop than, for example, evidence of Fed or Ca2+ production. In September, net sulfate production in the anodic zone was revealed at the oyster reef edge (Site 3), where the greatest density of cable bacteria was observed and signals of e-SOx were highest. The flux of sulfate here was directed toward the oxic zone at 4.9 mmol m−2 d−1, which is somewhat lower than net maximum sulfate production rates of 7.3 mmol m−2 d−1 (Risgaard-Petersen et al., 2012) and 10.3 mmol m−2 d−1 (Rao et al., 2016) previously observed in laboratory studies, but larger than a previous field study coastal sediments with cable bacteria (3.6 mmol m−2 d−1; van de Velde et al., 2016).
Cable bacteria also have the capability of using nitrate and nitrite as electron acceptors rather than oxygen (Marzocchi et al., 2014; Risgaard-Petersen et al., 2014). Although pore water nitrate/nitrite depth profiles were not recorded, nitrate and nitrite are likely not of major importance in the sediments that we studied. Sediment was sampled in summer (June and August), and at this time, the concentration of in the overlying water of the Wadden Sea is low (< 5 μM) as is depleted due to phytoplankton production in spring. Moreover, studies that have employed nitrate microbiosensors in sulfide generating coastal sediments, similar to the ones we studied, have found that nitrate penetration depths that exceed that of O2. Llobet-Brossa et al. (2002) reported nitrate penetration depth of 3.6 mm (vs. 3.1 mm oxygen penetration depth) and Marzocchi et al. (2014) reported nitrate penetration depths of 3.8 mm (vs. 1.8 mm oxygen penetration depth). A lower concentration at the interface that is 50x lower (< 5 μM for compared to 250 μM for O2) combined with a similar or 2-fold deeper penetration depth, suggests that the flux is about 50–100x times lower than the O2 flux into the sediment. Cathodic reduction consumes either of 5 or 8 electrons, depending on whether N2 or is produced, while O2 reduction consumes 4 electrons. Assuming that electron acceptor use is proportional to the overall flux into the sediment, we estimate that cathodic reduction will only be responsible for 1–4% of the electron flux generated by anodic sulfide oxidation. Accordingly, oxygen is by far the dominant electron acceptors for electrogenic sulfur oxidation in our sediments.
Two-Way Interactions between Bivalves and Cable Bacteria
Overall, cable bacteria exert a decisive control on the sediment geochemistry of coastal bivalve beds, and we hypothesize this could facilitate mutually beneficial interactions between the bacteria and the macrofauna (Figure 7). First, reef building bivalves enrich their local environment with organic rich sediment, promoting an environment with high rates of sulfate reduction. Such highly reducing sediments provide the electrons necessary to fuel rapid and dense growth of cable bacteria. Cable bacteria, in return, efficiently remove sulfide from the sediment surface, preventing the diffusive efflux of this toxic compound from the sediment during periods of inundation. In the bivalve reefs studied here, cable bacteria may be responsible for a majority of the sulfide removal, though a full accounting will require additional measurements of competing chemical sulfide oxidation reactions, which was not possible to calculate with the data collected here. Although the gills of some bivalves support communities of sulfide oxidizing bacteria or are capable of mitochondrial sulfide oxidation (Doeller et al., 2001; Duperron et al., 2013), this is not known to occur in Blue Mussels and Pacific Oysters, which appear to rely on external microbial sulfide oxidation to prevent diffusive uptake of sulfide across the gill surface. High densities of cable bacteria may thereby be critical in sediment detoxification for bivalve reef sustainability.
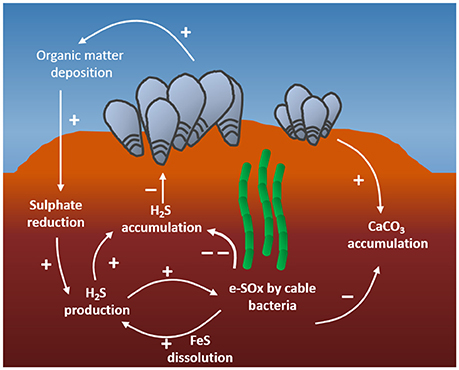
Figure 7. Proposed interactions between reef-building bivalves and cable bacteria. First, bivalve reefs enhance organic matter deposition, which stimulates high rates of sulfide production by sulfate reducing bacteria. This sulfide fuels initial electrogenic sulfide oxidation (e-SOx) by cable bacteria, keeping the sulfide concentration below detection limits, which is beneficial for the bivalves. Secondly, calcium carbonate associated with shell material of the bivalve reefs drives calcium carbonate accumulation in reef sediments. The acidity generated by cable bacteria dissolves CaCO3, decreasing its rate of sequestration in the sediment, and leading to an enhanced efflux of calcium and alkalinity to the coastal waters.
A second mechanism by which bivalve reefs and cable bacteria may interact involves carbonate cycling. Bivalve reefs are major sites for CaCO3 sequestration in temperate coastal oceans (Waldbusser et al., 2013). Cable bacteria, through their anodic sulfide oxidation activity accelerate the dissolution of part of this CaCO3, thereby counteracting sequestration (Rao et al., 2016). Sediment sequestration rates for Corg and CaCO3 can be calculated as: J = ρ·(1 − ϕ)·ω·C; where ρ is the dry sediment density, ϕ is the porosity, C is the concentration of either Corg or CaCO3 in the surface sediment fraction, and ω is sedimentation rate that was calculated for the mussel site (Site 1) and the oyster reef edge (Site 3). Using this Equation, Corg sequestration was 51 and 195 mmol C m−2 d−1 at Sites 1 and 3, respectively. Assuming a respiration quotient of unity, based on DOU, the sediment respiration at these sites is 49 and 126 mmolC m−2 d−1, indicating that 51–61% of the receiving Corg is retained in these sediments by 7 cm depth, which is within the burial efficiency range of 33–100% reviewed in Berner (1982) for continental shelves. CaCO3 sequestration was estimated to be 163 and 252 mmolC m−2 d−1. Given previously calculated Ca2+ flux estimates of 2.5 and 29.3 mmol Ca2+ m−2 d−1 at these sites, we calculate that between 1.5 and 10.4% of the CaCO3 input to the sediment is redissolved. The mean CaCO3 production rate of a temperate bivalve reef has been estimated at 6 mmol m−2 d−1 (Chauvaud et al., 2003), suggesting that the rates of alkalinity and Ca2+ resupplied by cable bacteria, when there is high e-SOx activity, would be sufficient to meet the production demands of a mature reef system. Carbonate dissolution also releases alkalinity from the sediment to the overlying water, and as a result, cable bacteria may thereby provide an important, but as yet overlooked, contribution to the alkalinity balance of coastal waters (Rao et al., 2014, 2016).
Cable Bacteria Presence in Bioturbated Sands
Adjacent to the bivalve reefs, the intertidal zone of the barrier islands on the Wadden Sea is dominated by sandy sediments which was heavily colonized by large bioturbating infauna, with notably high densities of Arenicola, among others. Because sediment characteristics, such as grain size and sorting play an important role in shaping the local microbial community composition and structure (Dang et al., 2008, 2013), we anticipated differences in the sulfur oxidizing microbial community. In a previous study, we observed that cable bacteria were not typically found in a similarly bioturbated sandy sediment, and hypothesized that bioturbation may inhibit their growth by overturning the sediment, and thereby mechanically disrupting the cable filament network (Malkin et al., 2014). Contrary to our expectations, we found cable bacteria present in the heavily bioturbated habitat inshore of the bivalve reefs during both campaigns. In June, the density was near our limit of detection, with a density of 0.15 m cm−2, but in September, the density was 56 m cm−2. Furthermore, porewater profiles in September were consistent with a distinct influence of e-SOx by cable bacteria, including the typical pH signature, and porewater accumulation of calcium, iron, and manganese ions. These results are noteworthy because they demonstrate that cable bacteria exist in permeable sandy habitats. Such habitats cover 70% of the global continental shelf (Huettel et al., 2014), and so this observation greatly expands the range of habitats in which cable bacteria may be important members of the microbial community.
In contrast to muddy sediment, permeable sands contain lower levels of FeS, and whereas sulfate reduction occurs throughout a muddy sediment, sulfate reduction typically occurs much deeper in permeable sands as a result of a continuous replenishment by irrigation of other more energetically favorable electron acceptors (i.e., O2 and NO3). Yet, there is a strong seasonality to the depth of sulfate reduction, and this depth tends to shoal toward the sediment surface as temperatures increase through the seasons (Moeslund et al., 1994; Thamdrup et al., 1994; Koretsky et al., 2005). Thus, we propose that cable bacteria are likely more abundant in bioturbated sediments during the warmer summer and fall seasons, when sulfate reduction likely occurs at higher rates and at depths closer to the sediment surface. Under such conditions, cable bacteria that are connected to oxic sediment can access electrons derived from sulfide generated by sulfate reduction in proximity to the oxic zone. Sulfide was not detectable in the surface sediment in June when cable bacteria were barely detectable. In September, when cable bacteria were comparatively abundant, sulfide concentrations were higher, supporting a possible relationship between sulfide accumulation and cable bacteria proliferation. The lower density of cable bacteria observed in the sandy sediment, relative to the bivalve reefs, also likely reflects the supply rate of sulfide. In the bivalve reefs sediments, cable bacteria growth is likely sustained to a considerable extent by the dissolution of FeS (Risgaard-Petersen et al., 2012; Larsen et al., 2014; Meysman et al., 2015; Rao et al., 2016). In permeable sediments poor in FeS, cable bacteria have a greater reliance on the sulfide produced via sulfate reduction which likely sustains lower growth rates (Nielsen and Risgaard-Petersen, 2015).
Conclusions
This study shows that cable bacteria are widespread and abundant in muddy bivalve reefs sediments, which has important repercussions for the ecosystem functioning in these environments. Cable bacteria substantially affect microbial community structure (Vasquez-Cardenas et al., 2015) and modulate sediment geochemistry and material fluxes to the water column (Risgaard-Petersen et al., 2012; Rao et al., 2016). Our porewater profile data are consistent with these previous laboratory experiments that documented a profound influence of cable bacteria metabolism (e-SOx) on the cycling of sulfur, calcium, iron, and manganese in coastal sediments. In the system investigated here, which was characterized by irregular episodic sediment deposition, cable bacteria populations may experience rapid turnover. The growth and development of cable bacteria can be extremely rapid, and this strategy may be key to their ability to apparently outcompete other thiotrophs under similar conditions.
Author Contributions
SM and FM designed the study, performed data analyses, and SM drafted the manuscript. SM, DS, LB, SN, SH, and HD conducted field work and collected sediment samples and SM, SH, and AT performed core sectioning and porewater extractions. SH performed FISH analyses, NG performed 7Be analyses, and HD coordinated and performed core scanning analyses. All authors contributed to and reviewed the manuscript.
Funding
This research was supported by funding from the European Research Council under the European Union's Seventh Framework Programme (FP/2007-2013) through ERC Grant 306933 (FM) and by Research Foundation Flanders (Odysseus project to FM).
Conflict of Interest Statement
The authors declare that the research was conducted in the absence of any commercial or financial relationships that could be construed as a potential conflict of interest.
Acknowledgments
We thank Marco Houtekamer, Jan Sinke, Jurian Brasser, Peter Van Breugel and Yvonne Maas at the analytical lab within NIOZ-Yerseke for the analysis of the pore water and solid phase sediment samples, and Piet van Gaever for 210Pb analysis at the radionuclide lab of NIOZ-Texel.
Supplementary Material
The Supplementary Material for this article can be found online at: https://www.frontiersin.org/article/10.3389/fmars.2017.00028/full#supplementary-material
References
Aller, R. C. (2013). “Sedimentary diagenesis, depositional environments, and benthic fluxes,” in Treatise on Geochemistry, Vol 8, 2nd Edn., eds H. D. Holland and K. K. Turekian (Oxford; Waltham, MA: Elsevier), 293–334.
Aminot, A., Kérouel, R., and Coverly, S. C. (2009). “Nutrients in seawater using segmented flow analysis,” in Practical Guidelines for the Analysis of Seawater, ed O. Wurl (Boca Raton, FL: CRC Press), 143–178.
Berg, P., Risgaard-Petersen, N., and Rysgaard, S. (1998). Interpretation of measured concentration profiles in the sediment porewater. Limnol. Oceanogr. 43, 1500–1510. doi: 10.4319/lo.1998.43.7.1500
Bergfeld, C. (1999). Macrofaunal community pattern in an intertidal sandflat: effects of organic enrichment via biodeposition by mussel beds. Senckenb. Maritima 29, 23–27. doi: 10.1007/BF03043114
Berner, R. A. (1982). Burial of organic carbon and pyrite sulfur in the modern ocean: its geochemical and environmental significance. Am. J. Sci. 282, 451–473. doi: 10.2475/ajs.282.4.451
Bjerg, J. T., Damgaard, L. R., Holm, S. A., Schramm, A., and Nielsen, L. P. (2016). Motility of electric cable bacteria. Appl. Environ. Microbiol. 82, 3816–3821. doi: 10.1128/AEM.01038-16
Boer, W., Van den Bergh, G. D., De Haas, H., De Stigter, H. C., Gieles, R., and Van Weering Tj, C. E. (2006). Validation of accumulation rates in Teluk Banten (Indonesia) from commonly applied 210Pb models, using the 1883 Krakatau tephra as time marker. Mar. Geol. 227, 263–277. doi: 10.1016/j.margeo.2005.12.002
Boudreau, B. P. (1996). The diffusive tortuosity of fine-grained unlithified sediments. Geochim. Cosmochim. Acta 60, 3139–3142. doi: 10.1016/0016-7037(96)00158-5
Burdorf, L. D. W., Hidalgo Martinez, S., Cook, P. L. M., and Meysman, F. J. R. (2016). Long-distance electron transport by cable bacteria in mangrove sediments. Mar. Ecol. Prog. Ser. 545, 1–8. doi: 10.3354/meps11635
Chauvaud, L., Thompson, J. K., Cloern, J. E., and Thouzeau, G. (2003). Clams as CO2 generators: the Potamocorbula amurensis example in San Francisco Bay. Limnol. Oceanogr. 48, 2086–2092. doi: 10.4319/lo.2003.48.6.2086
Dahlback, B., and Gunnarsson, L. H. (1981). Sedimentation and sulfate reduction under a mussel culture. Mar. Biol. 63, 269–275. doi: 10.1007/BF00395996
Daims, H., Stoecker, K., and Wagner, M. (2005). “Fluorescence in situ hybridization for the detection of prokaryotes,” in Molecular Microbial Ecology, eds A. M. Osborn and C. J. Smith (New York, NY: Taylor & Francis Group), 213–239.
Dame, R. F. (2012). Ecology of Marine Bivalves: An Ecosystem Approach, 2nd Edn. Boca Raton, FL: CRC Press.
Damgaard, L. R., Risgaard-Petersen, N., and Nielsen, L. P. (2014). Electric potential microelectrode for studies of electrobiogeophysics. J. Geophys. Res. Biogeosci. 119, 1906–1917. doi: 10.1002/2014JG002665
Dang, H., Zhang, X., Sun, J., Li, T., Zhang, Z., and Yang, G. (2008). Diversity and spatial distribution of sediment ammonia-oxidizing crenarchaeota in response to estuarine and environmental gradients in the Changjiang Estuary and East China Sea. Microbiology 154, 2084–2095 doi: 10.1099/mic.0.2007/013581-0
Dang, H., Zhou, H., Zhang, Z., Yu, Z., Hua, E., Liu, X., et al. (2013). Molecular detection of Candidatus Scalindua pacifica and environmental responses of sediment anammox bacterial community in the Bohai Sea, China. PLoS ONE 8:e61330. doi: 10.1371/journal.pone.0061330
Doeller, J. E., Grieshaber, M. K., and Kraus, D. W. (2001). Chemolithoheterotrophy in a metazoan tissue: thiosulfate production matches ATP demand in ciliated mussel gills. J. Exp. Biol. 204, 3755–3764.
Donker, J. J. A., van der Vegt, M., and Hoekstra, P. (2015). Erosion of an intertidal mussel bed by ice- and wave-action. Cont. Shelf Res. 106, 60–69. doi: 10.1016/j.csr.2015.07.007
Duperron, S., Gaudron, S. M., Rodrigues, C. F., Cunha, M. R., Decker, C., and Olu, K. (2013). An overview of chemosynthetic symbioses in bivalves from the North Atlantic and Mediterranean Sea. Biogeosciences 10, 3241–3267. doi: 10.5194/bg-10-3241-2013
Friedrich, C. G., Bardischewsky, F., Rother, D., Quentmeier, A., and Fischer, J. (2005). Prokaryotic sulfur oxidation. Curr. Opinion Microbiol. 8, 253–259. doi: 10.1016/j.mib.2005.04.005
Huettel, M., Berg, P., and Kostka, J. E. (2014). Benthic exchange and biogeochemical cycling in permeable sediments. Ann. Rev. Mar. Sci. 6, 23–51. doi: 10.1146/annurev-marine-051413-012706
Jørgensen, B. B. (1982). Mineralization of organic matter in the sea bed—the role of sulfate reduction. Nature 296, 643–645. doi: 10.1038/296643a0
Jørgensen, B. B., and Nelson, D. C. (2004). “Sulfide oxidation in marine sediments: geochemistry meets microbiology,” in Sulfur Biogeochemistry—Past and Present, eds J. P. Amend, K. J. Edwards, and T. W. Lyons (Boulder, CO: Geological Society of America), 63–81.
Koretsky, C. M., Van Cappellen, P., Di Christina, T. J., Kostka, J. E., Lowe, K. L., Moore, C. M., et al. (2005). Salt marsh pore water geochemistry does not correlate with microbial community structure. Estuarine Coast Shelf Sci. 62, 233–251. doi: 10.1016/j.ecss.2004.09.001
Kröncke, I. (1996). Impact of biodeposition on macrofaunal communities in intertidal sandflats. Mar. Ecol. 17, 159–174. doi: 10.1111/j.1439-0485.1996.tb00497.x
La Croix, A. D., Dashtgard, S. E., Gingras, M. K., Hauck, T. E., and MacEachern, J. A. (2015). Bioturbation trends across the freshwater to brackish-water transition in rivers. Palaeogeog. Palaeoclim. Palaeoecol. 440, 66–77. doi: 10.1016/j.palaeo.2015.08.030
Larsen, S., Nielsen, L. P., and Schramm, A. (2014). Cable bacteria associated with long-distance electron transport in New England salt marsh sediment. Environ. Microbiol. Rep. 7, 175–179. doi: 10.1111/1758-2229.12216
Llobet-Brossa, E. R., Rabus, M. E., Böttcher, M., Könneke, N., Finke, A., Amann, R., et al. (2002). Community structure and activity of sulfate-reducing bacteria in an intertidal surface sediment: a multi-method approach. Aquat. Microb. Ecol. 29, 211–226. doi: 10.3354/ame029211
Malkin, S. Y., and Meysman, F. J. (2015). Rapid redox signal transmission by cable bacteria beneath a photosynthetic biofilm. Appl. Environ. Microbiol. 81, 948–956. doi: 10.1128/AEM.02682-14
Malkin, S. Y., Seitaj, D., Vasquez-Cardenas, D., Zetsche, E.-M., Hidalgo-Martinez, S., Boschker, H. T. S., et al. (2014). Natural occurrence of microbial sulfur oxidation by long-distance electron transport in the seafloor. ISME J 8, 1843–1854. doi: 10.1038/ismej.2014.41
Manz, W., Amann, R., Ludwig, W., Wagner, M., and Schleife, K. H. (1992). Phylogenetic oligodeoxynucleotide probes for the major subclasses of proteobacteria: problems and solutions. Syst. Appl. Microbiol. 15, 593–600. doi: 10.1016/S0723-2020(11)80121-9
Marzocchi, U., Trojan, D., Larsen, S., Meyer, R. L., Revsbech, N. P., Schramm, A., et al. (2014). Electric coupling between distant nitrate reduction and sulfide oxidation in marine sediment. ISME J. 8, 1682–1690. doi: 10.1038/ismej.2014.19
Meysman, F. J. R., Risgaard-Petersen, N., Malkin, S. Y., and Nielsen, L. P. (2015). The geochemical fingerprint of microbial long-distance electron transport in the seafloor. Geochem. Cosmochim. Acta 152, 122–142. doi: 10.1016/j.gca.2014.12.014
Moeslund, L., Thamdrup, B., and Jørgensen, B. B. (1994). Sulfur and iron cycling in a coastal sediment: radiotracer studies and seasonal dynamics. Biogeochemistry 27, 129–152.
Musat, N. U., Werner, K., Knittel, S., Kolb, T., Dodenhof, J. E. E., Amann, R., et al. (2006). Microbial community structure of sandy intertidal sediments in the North Sea, Sylt-Rømø Basin, Wadden Sea. Syst. Appl. Microbiol. 29, 333–348. doi: 10.1016/j.syapm.2005.12.006
Nielsen, L. P., and Risgaard-Petersen, N. (2015). Rethinking sediment biogeochemistry after the discovery of electric currents. Annu. Rev. Mar. Sci. 7, 425–442. doi: 10.1146/annurev-marine-010814-015708
Nielsen, L. P., Risgaard-Petersen, N., Fossing, H., Chrinstensen, P. B., and Sayama, M. (2010). Electric currents couple spatially separated biogeochemical processes in marine sediment. Nature 463, 1071–1074. doi: 10.1038/nature08790
Pfeffer, C., Larsen, S., Song, J., Dong, M., Besenbacher, F., Meyer, R. L., et al. (2012). Filamentous bacteria transport electrons over centimeter distances. Nature 491, 218–221. doi: 10.1038/nature11586
Rao, A. M. F., Malkin, S. Y., Montserrat, F., and Meysman, F. J. R. (2014). Alkalinity production in intertidal sands intensified by lugworm bioirrigation. Estuar. Coast Shelf Sci. 148, 36–47. doi: 10.1016/j.ecss.2014.06.006
Rao, A. M. F., Malkin, S. Y., Hidalgo-Martinez, S., and Meysman, F. J. R. (2016). The impact of electrogenic sulfide oxidation on elemental cycling and solute fluxes in coastal sediment. Geochim. Cosmochim. Acta 172, 265–286. doi: 10.1016/j.gca.2015.09.014
Risgaard-Petersen, N., Kristiansen, M., Frederiksen, R. B., Dittmer, A. L., Bjerg, J. T., Trojan, D., et al. (2015). Cable bacteria in freshwater sediment. Appl. Environ. Microbiol. 81, 6003–6011. doi: 10.1128/AEM.01064-15
Risgaard-Petersen, N., Damgaard, L. R., Revil, A., and Nielsen, L. P. (2014). Mapping electron sources and sinks in a marine biogeobattery. J. Geophys. Res. Biogeosci. 119, 1475–1486. doi: 10.1002/2014JG002673
Risgaard-Petersen, N., Revil, A., Meister, P., and Nielsen, L. P. (2012). Sulfur, iron and calcium cycling associated with natural electric currents running through marine sediments. Geochim. Cosmochim. Acta 92, 1–13. doi: 10.1016/j.gca.2012.05.036
Rodriguez, A. B., Fodrie, F. J., Ridge, J. T., Lindquist, N. L., Theuerkauf, E. J., Coleman, S. E., et al. (2014). Oyster reefs can outpace sea-level rise. Nat. Clim. Change 4, 493–497. doi: 10.1038/nclimate2216
Schauer, R., Risgaard-Petersen, N., Kjeldsen, K. U., Bjerg, J. J. T., Jørgensen, B. B., Schramm, A., et al. (2014). Succession of cable bacteria and electric currents in marine sediment. ISME J. 8, 1314–1322. doi: 10.1038/ismej.2013.239
Seitaj, D., Schauer, R., Sulu-Gambari, F., Hidalgo-Martinez, S., Malkin, S. Y., Burdorf, L. D., et al. (2015). Cable bacteria generate a firewater against euxinia in seasonally hypoxic basins. Proc. Nat. Acad. Sci. U.S.A. 112, 13278–13283. doi: 10.1073/pnas.1510152112
Soetaert, K., Petzoldt, T., and Meysman, F. J. R. (2012). Package ‘Marelac’: Tools for Aquatic Sciences. R: CRAN library.
Sulu-Gambari, F., Seitaj, D., Behrends, T., Banerjee, D., Meysman, F. J. R., and Slomp, C. P. (2016). Impact of cable bacteria on sedimentary iron and manganese dynamics in a seasonally-hypoxic marine basin. Geochem. Cosmochim. Acta 192, 49–69. doi: 10.1016/j.gca.2016.07.028
ten Brinke, W. B. M., Augustinus, P. G. E. F., and Berger, G. W. (1995). Fine-grained sediment deposition on mussel beds in the Oosterschelde (The Netherlands), determined from echo soundings, radio-isotopes and biodeposition field experiments. Estuar. Coast. Shelf Sci. 40, 195–217. doi: 10.1016/S0272-7714(05)80005-8
Teske, A., and Salman, V. (2014). “The family Beggiatoaceae,” in The Prokaryotes–Gammaproteobacteria, 4th Edn., eds E. Rosenberg, E. F. DeLong, S. Lory, E. Stackebrandt, and F. Thompson (Berlin: Springer-Verlag), 93–134.
Thamdrup, B., Fossing, H., and Jørgensen, B. B. (1994). Manganese, iron, and sulfur cycling in a coastal marine sediment (Aarhus Bay). Geochim. Cosmochim. Acta 58, 5115–5129.
Trojan, D., Schreiber, L., Bjerg, J. T., Bøggild, A., Yang, T., Kjeldsen, K. U., et al. (2016). A taxonomic framework for cable bacteria and proposal of the candidate genera Electrothrix and Electronema. Syst. Appl. Microbiol. 39, 297–306. doi: 10.1016/j.syapm.2016.05.006
van der Zee, E. M., van der Heide, T., Donadi, S., Eklöf, J. S., Eriksson, B. K., Olff, H., et al. (2012). Spatially extended habitat modification by intertidal reef- building bivalves has implications for consumer-resource interactions. Ecosystems 15, 664–673. doi: 10.1007/s10021-012-9538-y
van de Velde, S., Lesven, L., Burdorf, L. D., Hidalgo-Martinez, S., Geelhoed, J. S., Van Rijswijk, P., et al. (2016). The impact of electrogenic sulfur oxidation on the biogeochemistry of coastal sediments: a field study. Geochim. Cosmochim. Acta 194, 211–232 doi: 10.1016/j.gca.2016.08.038
Vasquez-Cardenas, D., van de Vossenberg, J., Polerecky, L., Malkin, S. Y., Schauer, R., Hidalgo-Martinez, S., et al. (2015). Microbial carbon metabolism associated with electrogenic sulfide oxidation in coastal sediments. ISME J. 9, 1966–1978. doi: 10.1038/ismej.2015.10
Vaquer-Sunyer, R., and Duarte, C. M. (2010). Sulfide exposure accelerates hypoxia-driven mortality. Limnol. Oceanogr. 55, 1075–1082. doi: 10.4319/lo.2010.55.3.1075
Keywords: bivalves, cable bacteria, electrochemistry, electrogenic sulfur oxidation, long-distance electron transport, sediment biogeochemistry, Desulfobulbaceae
Citation: Malkin SY, Seitaj D, Burdorf LDW, Nieuwhof S, Hidalgo-Martinez S, Tramper A, Geeraert N, De Stigter H and Meysman FJR (2017) Electrogenic Sulfur Oxidation by Cable Bacteria in Bivalve Reef Sediments. Front. Mar. Sci. 4:28. doi: 10.3389/fmars.2017.00028
Received: 29 October 2016; Accepted: 24 January 2017;
Published: 09 February 2017.
Edited by:
Hongyue Dang, Xiamen University, ChinaReviewed by:
Kathleen Scott, University of South Florida, USAZongze Shao, State Oceanic Administration, China
Copyright © 2017 Malkin, Seitaj, Burdorf, Nieuwhof, Hidalgo-Martinez, Tramper, Geeraert, De Stigter and Meysman. This is an open-access article distributed under the terms of the Creative Commons Attribution License (CC BY). The use, distribution or reproduction in other forums is permitted, provided the original author(s) or licensor are credited and that the original publication in this journal is cited, in accordance with accepted academic practice. No use, distribution or reproduction is permitted which does not comply with these terms.
*Correspondence: Sairah Y. Malkin, smalkin@umces.edu
†Present Address: Sairah Y. Malkin, Horn Point Laboratory, University of Maryland Center for Environmental Science, Cambridge, MD, USA