Twenty Years of Marine Carbon Cycle Observations at Devils Hole Bermuda Provide Insights into Seasonal Hypoxia, Coral Reef Calcification, and Ocean Acidification
 Nicholas R. Bates
- 1Bermuda Institute of Ocean Sciences, St. George's, Bermuda
- 2Department of Ocean and Earth Science, National Oceanography Centre Southampton, University of Southampton, Southampton, UK
Open–ocean observations have revealed gradual changes in seawater carbon dioxide (CO2) chemistry resulting from uptake of atmospheric CO2 and ocean acidification (OA), but, with few long–term records (>5 years) of the coastal ocean that can reveal the pace and direction of environmental change. In this paper, observations collected from 1996 to 2016 at Harrington Sound, Bermuda, constitute one of the longest time–series of coastal ocean inorganic carbon chemistry. Uniquely, such changes can be placed into the context of contemporaneous offshore changes observed at the nearby Bermuda Atlantic Time-series Study (BATS) site. Onshore, surface dissolved inorganic carbon (DIC) and partial pressure of CO2 (pCO2; >10% change per decade) have increased and OA indicators such as pH and calcium carbonate (CaCO3) saturation state (Ω) decreased from 1996 to 2016 at a rate of two to three times that observed offshore at BATS. Such changes, combined with reduction of total alkalinity over time, reveal a complex interplay of biogeochemical processes influencing Bermuda reef metabolism, including net ecosystem production (NEP = gross primary production–autotrophic and heterotrophic respiration) and net ecosystem calcification (NEC = gross calcification–gross CaCO3 dissolution). These long–term data show a seasonal shift between wintertime net heterotrophy and summertime net autotrophy for the entire Bermuda reef system. Over annual time-scales, the Bermuda reef system does not appear to be in trophic balance, but rather slightly net heterotrophic. In addition, the reef system is net accretive (i.e., gross calcification > gross CaCO3 dissolution), but there were occasional periods when the entire reef system appears to transiently shift to net dissolution. A previous 5–year study of the Bermuda reef suggested that net calcification and net heterotrophy have both increased. Over the past 20 years, rates of net calcification and net heterotrophy determined for the Bermuda reef system have increased by ~30%, most likely due to increased coral nutrition occurring in concert with increased offshore productivity in the surrounding subtropical North Atlantic Ocean. Importantly, this long–term study reveals that other environmental factors (such as coral feeding) can mitigate against the effects of ocean acidification on coral reef calcification, at least over the past couple of decades.
Introduction
The human–mediated increase in atmospheric carbon dioxide (CO2) and its uptake by the global ocean (Sabine et al., 2004; Khatiwala et al., 2013) has resulted in substantive changes in ocean chemistry and the marine CO2–carbonate system over the past few decades (e.g., Dore et al., 2009; Bates, 2012; Bates et al., 2014). The observed gradual decline in ocean pH and saturation states of calcium carbonate (CaCO3) minerals (i.e., Ω) that results from ocean acidification (i.e., OA; Broecker et al., 1971, 1979; Caldeira and Wickett, 2003) and future end–of–century projections of ocean chemistry (e.g., Orr et al., 2005), constrained by emission scenarios of anthropogenic CO2, raise profound concerns about the potential consequences for marine calcifiers and ecosystems, in particular (e.g., Kleypas et al., 1999; Royal Society, 2005; Doney, 2006; Fabry et al., 2008; Doney et al., 2009). As awareness of OA has grown over the recent decade and a half, increased research capacity has been directed toward improving our scientific understanding of the problem. There is a growing appreciation of the complex synergies, interactions and feedbacks that exist between ocean biogeochemistry and individual species/entire ecosystem response and resilience across multiple time—and spatial scales (e.g., Ries et al., 2009; Andersson et al., 2014; Breitburg et al., 2015; Gaylord et al., 2015). This includes the interaction and interplay between warming, deoxygenation and OA, and other environmental changes such as nutrient pollution (e.g., Anthony et al., 2008; Reid et al., 2009; Atewerbehan et al., 2013; Bijma et al., 2013; Bozec and Mumby, 2015; Malone et al., 2016).
Coral reefs, as highly productive and biologically diverse ecosystems, show multiple signs of deterioration or community structure changes due to a host of anthropogenic and natural factors, such as bleaching, resource depletion, eutrophication, changing sedimentation and turbidity, cyclone and human damage (e.g., Hoegh–Guldberg, 1999; Hoegh–Guldberg et al., 2007). Across the tropics and subtropics, the decline of coral reefs continues from early observations in the 1970's to present–day (e.g., Hughes, 1994; Wilkinson, 2000; Edmunds, 2007, 2013; Cooper et al., 2008; De'ath et al., 2009; Silverman et al., 2009; Cantin et al., 2010; Manzello, 2010; Hughes et al., 2013; Tanzil et al., 2013). In the milieu of environmental issues that beset coral reef health and future viability, ocean acidification comingles with variability of natural conditions to influence coral reef biogeochemical processes such as calcification, photosynthesis, respiration and CaCO3 dissolution. A suite of in situ, in vitro, experimental and model studies have shown decreases in both mature colony and juvenile coral calcification with reduced carbonate ion concentration [] or aragonite saturation state (i.e., Ωaragonite) under natural and/or perturbed conditions (e.g., Gattuso et al., 1996, 1998; Langdon et al., 2000; Langdon and Atkinson, 2005; Schneider and Erez, 2006; Anthony et al., 2008; Bates et al., 2010; Kroeker et al., 2010; Erez et al., 2011; Pandolfi et al., 2011; de Putron et al., 2011; Chan and Connolly, 2013; Kroeker et al., 2013a; Venn et al., 2013; Evenhuis et al., 2015). In other studies, bicarbonate ion concentration [] has been shown to be the primary modifier of coral calcification (e.g., Jury et al., 2010). The simplification of relationships between coral calcification and CO2–carbonate chemistry has many predictive uses and value for OA research (e.g., Kleypas et al., 1999; Orr et al., 2005; Dove et al., 2013; Evenhuis et al., 2015), but as Jokiel and others have pointed out (e.g., Jokiel et al., 2008; Jokiel, 2011a,b, 2016; Comeau et al., 2013; Andersson et al., 2014; Bach, 2015), there may not be simple relationships or thresholds in ocean chemistry that are insightful for future projections.
Complicating our understanding are the interactions and feedbacks between coral biogeochemical processes (i.e., calcification, production, respiration, dissolution) and CO2–carbonate chemistry over different spatial (e.g., patch reef, reef tract, whole reef) and temporal time–scales (e.g., diurnal, seasonal to decadal; Bates et al., 2010; Andersson et al., 2014; Cyronak et al., 2014). These factors include the following: (1) water circulation of the reef system (e.g., Falter et al., 2012, 2013; Comeau et al., 2014c); (2) habitat complexity, community dynamics and variable responses between coral species (e.g., Bates et al., 2010; Kroeker et al., 2013a,b,c; Fabricius et al., 2014; Comeau et al., 2014b; Hendricks et al., 2015) (3) corals modifying internal and external CO2–carbonate chemistry (e.g., Anthony et al., 2011; Jokiel, 2011a,b, 2013; Kleypas et al., 2011); (4) variability of reef CO2 from diurnal time-scales (e.g., Ohde and van Woesik, 1999; Jokiel et al., 2014; Comeau et al., 2014a; Koweek et al., 2015) to longer time-scales (e.g., Shamberger et al., 2011; Edmunds et al., 2012; Gray et al., 2012; Shamberger et al., 2011; Shaw et al., 2012; Albright et al., 2013); and, (5) coral reef environments with naturally lower pH such as CO2 seeps (Crook et al., 2011, 2013; Shamberger et al., 2014).
While many of the above studies have focused on coral calcification, there is a growing awareness of the importance of coral reef CaCO3 dissolution for CO2–carbonate chemistry variability, buffering capacity of reef systems and coral reef responses to OA (e.g., Silverman et al., 2009; Andersson and Gledhill, 2013; Andersson et al., 2014; Eyre et al., 2014; Andersson, 2015). Studies of processes such as dissolution of reef CaCO3 sediments (e.g., Yates and Halley, 2006; Andersson et al., 2007, 2009; Tribollet et al., 2009; Rao et al., 2012; Comeau et al., 2015; Rodolfo–Metalpa et al., 2015; Yamamoto et al., 2015), pore water and alkalinity fluxes from the sediment (e.g., Falter and Sansone, 2000; Santos et al., 2011, 2012a,b; Cyronak et al., 2013a,b), and coral bioerosion (e.g., Wisshak et al., 2012; Crook et al., 2013; Enochs et al., 2015; Kline et al., 2015) all contribute to elucidating the complex controls and responses of coral reefs to changes in ocean chemistry.
The challenges of understanding complex coral reef biochemistry and ecological interactions require both experimental and observational approaches. For the latter, sustained observations of contemporaneous chemical and ecological conditions in reef and coastal environments provide important data sets to test our understanding of variability and response over time (e.g., Juranek et al., 2009; Alin et al., 2012, 2015; Breitburg et al., 2015; Kline et al., 2015), but most time-series datasets do not extend beyond 5 years. Longer–term studies of reef chemistry and ecology are few in number (e.g., Silverman et al., 2012, 2014) and often characterized by large gaps in time between repeat sampling.
In this paper, 20 years (1996–2016) of CO2–carbonate chemistry data collected from the Bermuda coral reef are reported for the first time. These data provide one of the longest semi–continuous time–series to assess decadal variability of reef biogeochemical processes and the status of this reef system. One of the unique aspects for understanding coral reef biogeochemical processes is the contemporaneous collection of offshore ocean CO2–carbonate chemistry at two long–term time–series sites (Hydrostation S; Bermuda Atlantic Time–series Study, BATS) since 1983 (e.g., Bates et al., 1996a; Bates, 2001, 2012; Bates et al., 2014). Previous studies of Bermuda reef biogeochemistry have included observations of CO2–carbonate chemistry (Bates et al., 2001; Bates, 2002), reef biogeochemical processes (Bates et al., 2010; Andersson et al., 2013; Courtney et al., 2016) and longer-term proxy assessments of pH (Goodkin et al., 2015). For example, Bates et al. (2010) reported a seasonal reduction in coral calcification (i.e., coral skeletal growth rates) with reduced carbonate ion [] and Ωaragonite, contributing further evidence to linkage of OA to declining coral calcification. They also highlighted the strong seasonal coupling and feedback between rates of coral calcification (i.e., coral skeletal growth and water assessment of net ecosystem calcification, NEC), other ecological components of the reef system (i.e., macroalgae) and reef chemistry. However, in a recent paper, Yeakel et al. (2015) showed that coral calcification for the Bermuda reef has increased over the past 5 years, despite long-term declines in [] and Ωaragonite. They proposed that this recent change was due to increased coral nutrition in response to offshore, regional changes in North Atlantic Ocean conditions associated with variability of the North Atlantic Oscillation (NAO). The important inference of this finding is that other environmental factors may mitigate the impact of OA on coral reef ecosystems.
Here, the 20–year record of CO2–carbonate chemistry data collected from the Bermuda platform is used to examine longer–term changes in the net metabolism of the reef system and test the overarching hypothesis that environmental factors can potentially offset the impact of OA. The paper is broken down into the following sections:
1. First, a composite 20–year record of CO2–carbonate chemistry and supporting observations from Harrington Sound and other locations across Bermuda's inshore waters are reported for the first time.
2. Secondly, seasonal changes in CO2–carbonate chemistry of surface and deeper waters (25 m) are determined as a pre–requisite for examining longer–term changes. The deeper waters of Harrington Sound typically become seasonally anoxic in summertime at the water-sediment interface (e.g., Coull, 1969; Beers and Herman, 1969; Thorstenson and Mackenzie, 1974; Andersson et al., 2007; Parsons et al., 2015), thereby providing insights into the synergies between deoxygenation and OA forcing.
3. The time–series record at Harrington Sound is non–regular in time, with a sampling bias toward summertime. As with other time-series assessments of ocean chemistry (e.g., Bates et al., 2014), monthly averages over the 20–year period are used to determine anomalies over time. This approach provides trends of temperature, salinity and CO2–carbonate chemistry over the past 20 years (1996–2016). These trends constitute one of the longest global coastal ocean time–series of inorganic carbon and OA indicators, and can be compared to open–ocean changes in seawater chemistry (Bates et al., 2014).
4. The source of all Bermuda inshore waters is the offshore Sargasso Sea surrounding the island and reefs of Bermuda. Any biogeochemical modification of CO2–carbonate chemistry of Bermuda waters reflects reef biogeochemical processes (e.g., Bates, 2002; Bates et al., 2010; Courtney et al., 2016). Differences in onshore (i.e., Harrington Sound and other sites) and offshore (i.e., BATS) ocean chemistry are used to determine rates of net community calcification (NEC) and net ecosystem production (NEP) for the period 1996–2016.
5. Seasonal changes in NEC are used to show that the Bermuda reef is predominantly net CaCO3 accretive (i.e., calcification > dissolution) with occasional period of net dissolution. The seasonal shifts in NEP between net heterotrophy and net autotrophy are also used to test if the trophic status of the Bermuda reef is balanced (i.e., NEP = 0; Suzuki et al., 1995; Yamamoto et al., 2001; Atkinson, 2011) or not.
6. Mean seasonal reef metabolism data are used to determine anomalies and trends of NEC and NEP over time (1996–2016). The interannual trends in NEC and NEP strengthen the evidence that the Bermuda reef has experienced a period of increased calcification and respiration that appears to have mitigated OA–induced changes in ocean chemistry.
7. Lastly, CO2–carbonate chemistry (i.e., [] and Ωaragonite), NEC/NEP, and coral skeletal growth rates (Bates et al., 2010) are examined to test the relationships between calcification and ocean chemistry (e.g., Kleypas et al., 2011; Anthony et al., 2011; Albright et al., 2013, 2016; Andersson et al., 2014) and if there are potential chemical thresholds for reef transition from domination by calcifiers to non-calcifying macroalgae (Hoegh–Guldberg et al., 2007), and net coral reef accretion to dissolution indicators. A new CO2–carbonate chemistry indicator is proposed herein (i.e., carbonate ion* or CI*), and evaluated against coral skeletal growth rates and NEC rates. CI* is highly correlated with coral calcification and NEC, and thus, potentially more useful than [] or Ωaragonite for examining coral-OA relationships and thresholds.
Methods
Sampling Locations
The marine waters of Bermuda, both inshore and offshore in the surrounding Sargasso Sea have been the focus of numerous oceanographic studies since the 1950's. Herein, the primary sampling locations for the project were onshore at Harrington Sound (Figure 1A), the North Lagoon (Figure 1B), and offshore at Hydrostation S and BATS (Figure 1C).
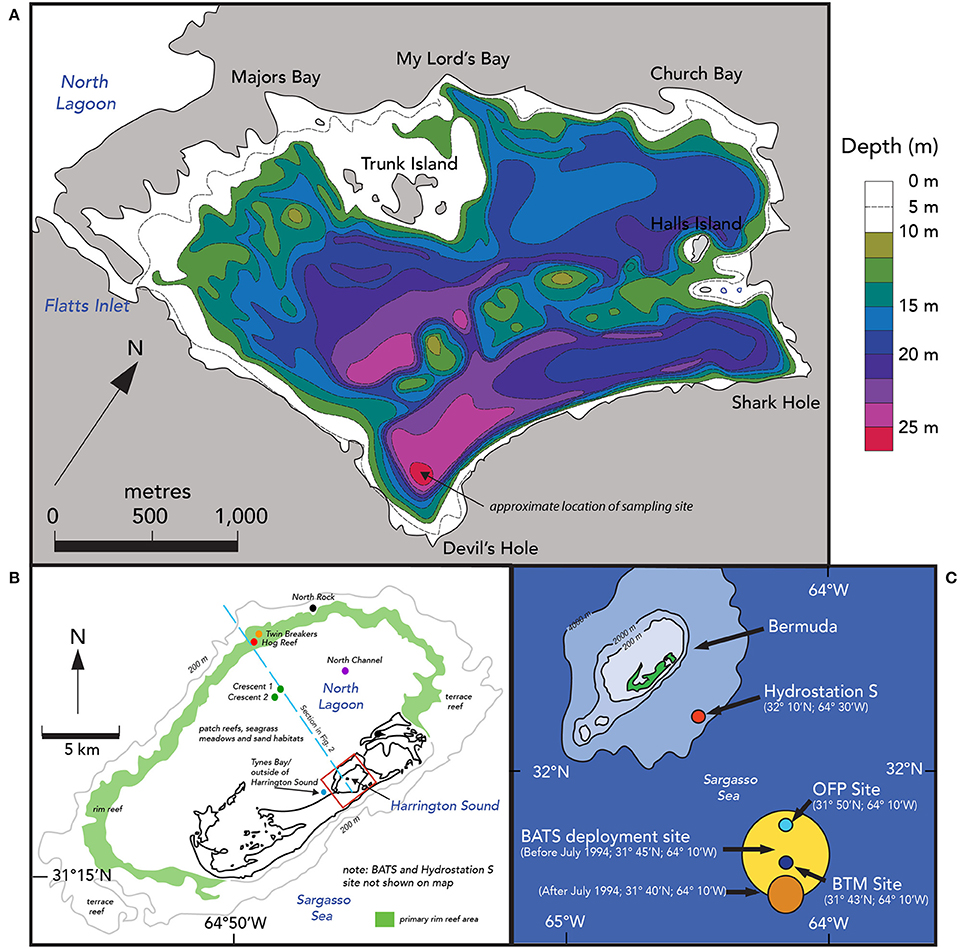
Figure 1. Location maps of Harrington Sound, Bermuda and offshore time–series sites. (A) Bathymetry map of Harrington Sound, Bermuda. Depth contours range from shallower than 10 m to the deepest depths of ~28 m in Devil's Hole. The map is adapted from Neumann (1965) and Andersson et al. (2007). The sediment and benthos of Harrington Sound exhibits zonation with a shallow sandy zone (0–10 m), a stony coral zone of Oculina sp. (~10–19 m) and a deeper, barren, subthermocline zone (~19–26 m) that is subject to seasonal hypoxia and occasional anoxia in the deepest part of Devil's Hole (C). (B) Comparative locations of Harrington Sound (red box), North Lagoon and offshore. North Lagoon has a mixture of patch coral reefs, seagrass meadows and sandy areas. The approximate location of the rim reef is shown in green with deeper terrace and mesophotic reefs offshore of this zone. The blue dashed line shows the locations of the schematic section given in Figure2. (C) The location of open-ocean time-series sites off Bermuda, including, Hydrostation S (1954–present), Bermuda Atlantic Time-series Study (BATS; 1988–present), Ocean Flux Site (OFP; 1978–present), and Bermuda Testbed Mooring (BTM; discontinued).
The shallow marine waters of the Bermuda platform overlie a series of mesophotic terrace coral reefs, shallow rim reefs, and adjacent patch reefs, seagrass meadows and calcareous sand areas of the North Lagoon (Figure 1B). The North Lagoon comprises an area of ~665.4 km2, volume of 5,498 × 106 m3 (vNL), and mean depth of 8.5 m. The source of all Bermuda platform waters is offshore, Sargasso Sea waters, with very minor contributions from groundwater/rainwater delivery (Figure 2; Table 2). Given the volume of the North Lagoon and an average tidal volume (vTIDE) of 1,330 × 106 m3 d−1, the mean residence time (r) for North Lagoon is 4.2 days (Table 1; Morris et al., 1977; i.e., r = vNL/vTIDE). Connected to the North Lagoon are several sounds (e.g., Great Sound, Castle Harbor) including Harrington Sound (Figure 1A). Harrington Sound has an area of ~4.8 km2, volume of 69.4 × 10⁶ m3, and mean depth of 14.5 m (Morris et al., 1977) with the deepest depths at the remnant sinkhole of Devil's Hole (~26 m). Strong tidal flow in and out of Harrington Sound, through Flatts Inlet, of 1.2 × 10⁶ m3 (~2.4 × 10⁶ m3 d−1) results in a mean residence time of 29.4 days for the entire sound, and ~6 day for the mixed layer (Table 1). Summertime water column stratification typically results in seasonal hypoxia and anoxia in the bottommost 2–m depth of Devil's Hole (e.g., Coull, 1969; Beers and Herman, 1969; Thorstenson and Mackenzie, 1974; Brown, 1978, 1980; Andersson et al., 2007; Parsons et al., 2015). As such, Devil's Hole has been the focus of studies of CaCO3 sediment dissolution (e.g., Berner, 1966; Lyons et al., 1974; Balzer and Wefer, 1981; Hines and Lyons, 1982; Andersson et al., 2007), nitrogen cycling (Brown, 1981), trace–element cycling (Jickells and Knap, 1984), and microbial community changes (Coull, 1969; Parsons et al., 2015). The sediment and benthos of Harrington Sound exhibits zonation (Neumann, 1965) with a shallow sandy zone (0–10 m), a stony coral zone of Oculina sp. (~10–19 m) that, still to this day, sharply bounds a deeper, barren, subthermocline zone (~19–26 m) which is subject to hypoxia and occasional anoxia in the deepest part of Devil's Hole (Figure 1A).
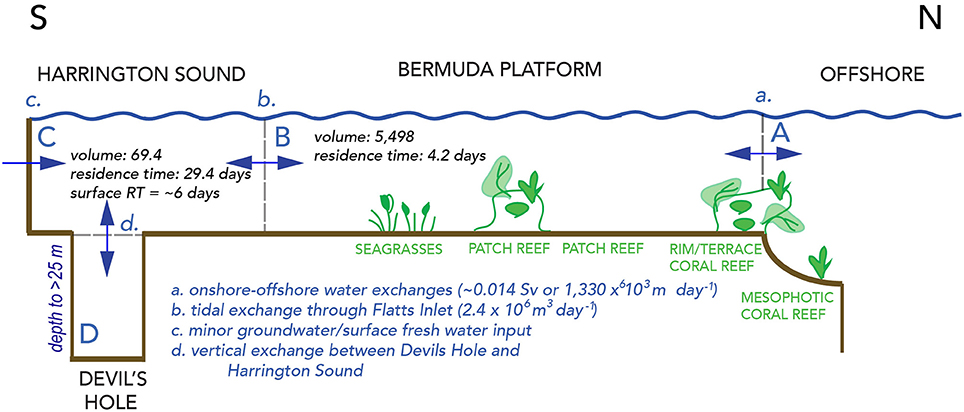
Figure 2. Schematic cross–section across the Bermuda reef system, showing waters of the Sargasso Sea offshore, and onshore waters of the North Lagoon, Harrington Sound and Devils Hole, Bermuda. The units for volumes shown in Figure are 106 m3, and also given in Table 1. One Sv (Sverdrup) is equal to water transport of 106 m3 s−1. The volume of Harrington Sound is about 1.3% of the entire volume of North Lagoon. The volume of deep Devils Hole water (>24 m deep) is about 0.06% of the entire volume of Harrington Sound.
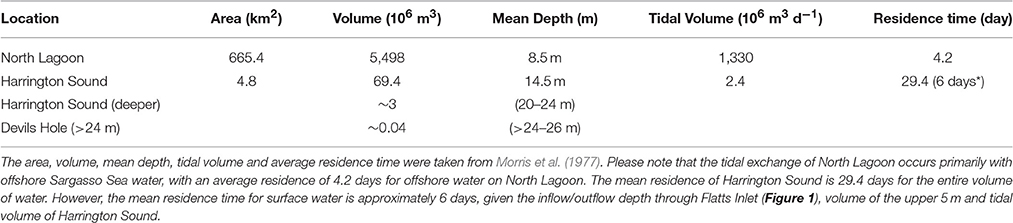
Table 1. Physiography of North Lagoon and Harrington Sound, Bermuda.
The absence of river inputs to the Bermuda platform (Morris et al., 1977), and continual exchange with offshore waters predetermines that North Lagoon water reflect the biogeochemistry of the surrounding Sargasso Sea with secondary modification by reef biogeochemical processes. In turn, Harrington Sound water properties are dominated by the exchange with the North Lagoon, and thus reflect an integrated, end–member state of biogeochemically–modified reef waters (Figure 2). Mean rainfall and groundwater contributions to daily exchanges between Harrington Sound and North Lagoon are very minor at ~1% (~0.024 × 10⁶ m3 d−1; Table 2).
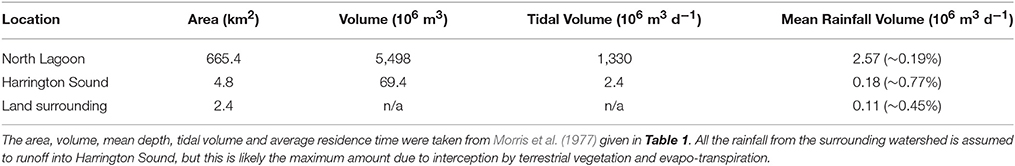
Table 2. Mean rainfall contributions to water volumes and residence times of North Lagoon and Harrington Sound, Bermuda.
Sampling History and Locations across the Bermuda Platform
The semi–continuous and intermittent sampling of Bermuda platform waters has occurred at several sites since the 1990's, but with sampling of surface waters at Devil's Hole, Harrington Sound constituting the most continuous of all sites. The ebb and flow of opportunities for sampling reflects the realities and vagaries of field sampling support.
Monthly collection of water column samples for temperature, salinity, dissolved oxygen (DO), inorganic nutrients (nitrate, phosphate), dissolved inorganic carbon (DIC) and total alkalinity (TA), began in 1996 at Devil's Hole and Hall's Island in Harrington Sound and in the North Lagoon (outside of Flatts Inlet near Tynes Bay) as part of the Bermuda Inshore Waters Investigation (BIWI) project. After 1998, only surface and deep Harrington Sound waters were intermittently sampled (primarily in summertime) until mid–2005, when sampling was switched to North Channel. With the initiation of the Water Quality and Monitoring Project (WQMP) in 2007, surface and deep sampling resumed at Devil's Hole, Hall's Island, and surface sampling at Tynes Bay, North Channel, Great Sound and several reef sites across Bermuda. This included several periods of profile sampling at Devil's Hole. In early 2013, WQMP sampling ceased, with opportunities to sample in Harrington Sound arising again in 2016.
Analytical Measurements of Temperature, Salinity, Dissolved Oxygen, and Inorganic Nutrients
Temperature and salinity were determined for all sampling opportunities at Devil's Hole, Harrington Sound, but not always at other sites. In situ temperature was measured with a platinum thermister (±0.05°C). Salinity samples were analyzed using a Guildline autosal salinometer as part of routine measurements for BATS (Knap et al., 1994), and calibrated with IAPSO standard seawater (Ocean Scientific, UK). Unfortunately, dissolved oxygen and inorganic nutrient sampling and analyses were less frequent at many of the Bermuda platform sites, but with sampling at Devil's Hole, Harrington Sound, being most frequent (especially 1996–1998; 2005–2011). Dissolved oxygen (DO) measurements were made primarily with Winkler titrations (Knap et al., 1994; precision of ~0.5%), but occasionally supplemented by YSI DO sensor measurements in later years. Inorganic nutrients were analyzed using auto–analyzer techniques used for similar measurements at the BATS site. However, although comprehensive inorganic nutrient sampling was undertaken in the 1990's, intermittent sampling since then does not provide sufficient data to evaluate changes over time.
Analytical Determination of Seawater Dissolved Inorganic Carbon and Total Alkalinity
Surface samples at Devil's Hole (~2 m deep) for DIC and TA were drawn from Niskin samplers into clean 500 ml size Pyrex glass reagent bottles, using established gas sampling protocols (Bates et al., 1996a; Dickson et al., 2007). A headspace of <1% of the bottle volume was left to allow for water expansion and all samples were poisoned with 100 μl of saturated HgCl2 solution to prevent biological alteration. Bottles were sealed with ground-glass stoppers and Apiezon silicon vacuum grease. Rubber bands were placed around the lip of the bottle and stopper to provide positive closure. Samples were returned to the Bermuda Institute of Ocean Sciences (BIOS) for analysis.
DIC was measured by a gas extraction/coulometric technique (see Bates et al., 1996a,b for details), using a SOMMA (Single-Operator Multi-Metabolic Analyzer) to control the pipetting and extraction of seawater samples and a UIC CO2 coulometer detector. From 2006, DIC samples were analyzed using a VINDTA 3C (Marianda Com). Both analytical systems use identical chemical approaches for the measurement of DIC in seawater, with the VINDTA 3C providing an updated instrument for use over the last decade. The precision of DIC analyses of this system is typically better than 0.025% (~0.4 μmoles kg−1) based on duplicate and triplicate analyses of >4,000 seawater samples analyzed at BIOS from 1992 to present. Seawater certified reference materials (CRM's; prepared by A.G. Dickson, Scripps Institution of Oceanography) were analyzed to ensure that the accuracy of DIC was within 0.03% (~0.5 μmoles kg−1).
Total alkalinity (TA) was determined by potentiometric titration with HCl (see Bates et al., 1996a,b, 2012 for details). CRM samples were also analyzed for TA and these values were within 0.15% (~1–2 μmoles kg−1) of certified TA values reported by A.G. Dickson (http://www.dickson.ucsd.edu).
The use of CRM samples for ocean time–series observations is very important for assessment of data comparability over time and subsequent calculation of pCO2 and pH for example (Bates and Peters, 2007; Bates et al., 2012). At Harrington Sound, the routine measurement and calibration of DIC and TA measurements since 1996 ensured that the data are comparable over time with error estimated at less than ~1–2 μmoles kg−1.
Seawater CO2–Carbonate Chemistry Computations
The complete seawater carbonic acid system (i.e., [CO2], [H2CO3], [], [], [H+]) can be calculated from a combination of two carbonate system parameters DIC, TA, pCO2 and pH, along with temperature and salinity. Here, pCO2, pH [], [], and Ωaragonite were calculated from DIC, TA, temperature and salinity data (Robbins et al., 2010).
DIC is defined as Butler (1978), Zeebe and Wolf-Gladrow (2001) and Dickson et al. (2007):
where [] represents the concentration of all unionized carbon dioxide, whether present as H2CO3 or as CO2. The alkalinity of seawater (TA) is defined as:
where [] + 2[] + are the major components of seawater total alkalinity and other species are minor constituents (Dickson et al., 2007) having negligible impact on TA. DIC and TA are expressed as μmoles kg−1. Seawater pCO2 is the partial pressure of CO2 in equilibrium with seawater, while pH is expressed on the total seawater scale (Dickson et al., 2007). Nitrate data was not used in the computation due to insufficient data over time, with the qualifier that this approach introduced insignificant uncertainty for the calculation of pCO2, pH, [], [], and Ωaragonite and computed trends herein.
CaCO3 mineral production and dissolution is governed by the following chemical reaction:
CaCO3 production and dissolution rates vary as a function of saturation state (Ω). For corals and other calcifying marine organisms whose carbonate mineralogy is aragonite, the saturation state is defined as the ion concentration product of calcium and carbonate ions, thus:
where the solubility product, , depends on temperature, salinity and pressure. Thermodynamically, aragonite dissolution is favored when Ωaragonite values are <1, while aragonite formation generally occurs at Ωaragonite values of >1.
Occasionally, hydrogen sulfide (H2S) was smelled in a few of the deepest Devil's Hole samples during seasonal anoxia. Andersson et al. (2007) measured H2S concentrations of 2–46 μM, potentially contributing to alkalinity (Dickson et al., 2007). However, poisoning of samples with Hg2Cl removes H2S and its contribution to total alkalinity. Herein, the potential contribution of H2S to total alkalinity was not used to correct deep Devil's Hole TA data. The minor contribution of H2S to total alkalinity means that the high pCO2 (~1,000 to +3,000 μatm) in deep Devil's Hole samples during anoxia would be higher by an uncertain ~5–100 μatm.
Long–Term Trend Analysis
The identification of statistical significant trends in hydrography, ocean biogeochemistry and rate measurements such as in situ primary production (Henson, 2014; Henson et al., 2016) is complicated by data variability and non-uniform intervals and gaps between sampling/data points. However, meaningful trends have been established with open–ocean time-series data, including seawater CO2-carbonate chemistry, that span more than 10 years (e.g., Bates et al., 2012, 2014). Here, monthly mean climatologies for all hydrographic and chemical parameters were determined for all data spanning the 1996–2016 period. These climatologies were then compared to actual data to determine anomalies (i.e., difference between data value and monthly climatology) over the span of the time–series (e.g., Bates et al., 2012; Leinweber and Gruber, 2013; Bates et al., 2014). This approach accounts for variability in data frequency and helps remove seasonal sampling biases. Linear regression analyses were then conducted using StatPlus to determine statistical significance (e.g., p–value; slope and error; r and r2 value) with n–numbers in the range of 110–120. Trends with of <0.01 (i.e., 99% level) were deemed statistically significant.
The trends determined for onshore data from Harrington Sound were compared to offshore data collected at BATS (Bates et al., 2012, 2014) using the identical approach for trend analysis. The caveat for this approach is that there could be slight biases imparted to trend analysis if a bias existed in sampling (e.g., early or late in the month) during the year. Fortunately, the median sampling fell in mid-month without any clear bias between months of year or across the time–series span.
An alternative approach would be to interpolate between data to achieve temporal uniformity in frequency for time–series analysis. However, this approach does not improve the statistical significance of trends (i.e., as p–value), and use of actual data rather than interpolated data is the preferred approach used herein.
Assessment of Whole Platform NEC and NEP
The calculation of rate of net ecosystem calcification (i.e., NECREEF) is based on the alkalinity anomaly–water residence time technique (e.g., Smith and Key, 1975; Kinsey, 1978; Chisholm and Gattuso, 1991; Bates et al., 2010; Langdon et al., 2010; Albright et al., 2013; Courtney et al., 2016) that has been used previously for estimating in situ rates of calcification for reef systems (Gattuso et al., 1996; Silverman et al., 2007). In the method differences between offshore and onshore nTA are assumed to result from the balance of reef calcification and dissolution (i.e., NEC) that changes the TA content of waters overlying the reef (i.e., ΔTANEC).
Here, seasonal values for ΔTANEC are determined using the observed difference in salinity normalized TA (i.e., nTA) between offshore and onshore (nTAoffshore-nTAharringtonsound) using data from BATS and Harrington Sound (Table 3). Sampling at BATS and Harrington Sound were not typically conducted on the same day but as close as possible in time. For each onshore–offshore couplet of data, BATS data was typically sampled up to 10 days to 2 weeks before sampling at Devil's Hole. This offset in time represents the median time of 1–2 weeks for waters to transit from offshore to Harrington Sound. The NECreef rate is then calculated by scaling the values of ΔTANEC to an appropriate water depth (Z) and water residence time (τ) for the reef. Thus, following the method of Langdon et al. (2010):
where r is the density of seawater. Here, an average water depth of 8.5 m and water residence time of 4.2 days for North Lagoon, and 14.5 m and water residence time of 10 days for Harrington Sound (Table 1) is used in the calculations of NECreef and NEPreef rates with a few scaling issues, caveats and uncertainties that are discussed further. Rates of NECreef are expressed in units of mmoles CaCO3 m−2 d−1 (or expressed as g CaCO3 m−2 d−1 using a molecular weight of 100.09).
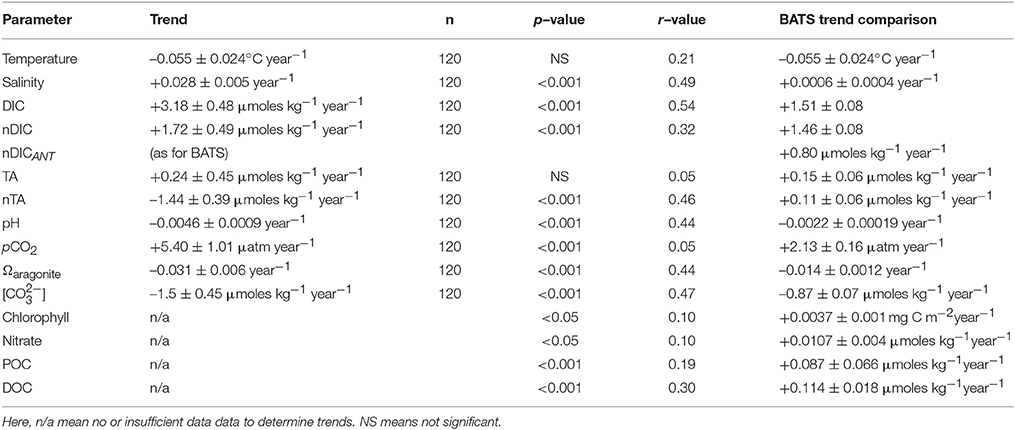
Table 3. Long–term trends (1996–2016) of seawater CO2-carbonate chemistry observed in Harrington Sound and compared to offshore data at BATS.
Secondly, the change in DIC for waters overlying the reef due to NEC (i.e., ΔnDICNEC) is calculated using a TA:DIC ratio of 2:1). Thus:
The rate of net ecosystem production (i.e., NEPreef) for the reef is calculated by mass balance given that NEP imparts a change in the DIC content of waters overlying the reef (with photosynthesis and respiration causing no change in TA). The rate of NEPreef is thus calculated by mass balance using the observed differences in nDIC between onshore and offshore (i.e., ΔnDICoffshore− nDICharringtonsound; Table 3) and Δ nDICNEC:
In Equation (7), NEPreefis expressed in units of mmoles C m−2 d−1 (or expressed as g C m−2 d−1 using a molecular weight of 12).
Here, the contribution of air-sea CO2 gas exchange (using the details given in Bates, 2007) and freshwater inputs to ΔnDICNEC and NEPreef were estimated as minor (<1%) and thus negligible contributions to the computation of NEC and NEP.
In later sections, both DIC and TA were normalized to a constant salinity of 36.6 (to account for changes imparted by salinification/freshening or evaporation/precipitation), and represented by the terms nDIC and nTA, respectively.
Propagation of Uncertainty
Uncertainty for the bottle, NEC, and NEP rates was estimated using standard procedures for propagation of uncertainties summarized by Ku (1966). Uncertainty of measured DIC and TA (±1 μmoles kg−1) was obtained from replicate measures of CRMs, with uncertainty of NEC and NEP at 0.08 g CaCO3 m−2 d−1 and 0.008 mmoles C m−2 d−1, respectively.
Results
Twenty Years of Surface Variability at Harrington Sound
The time-series of hydrography and CO2–carbonate chemistry at Harrington Sound from 1996 to 2016 is shown in Figure 3, with a couple of notable sampling gaps in 2000 and 2013–2015, respectively. On several panels of Figure 3, data from the bottommost depth of Devil's Hole (~23–25 m) are shown in comparison.
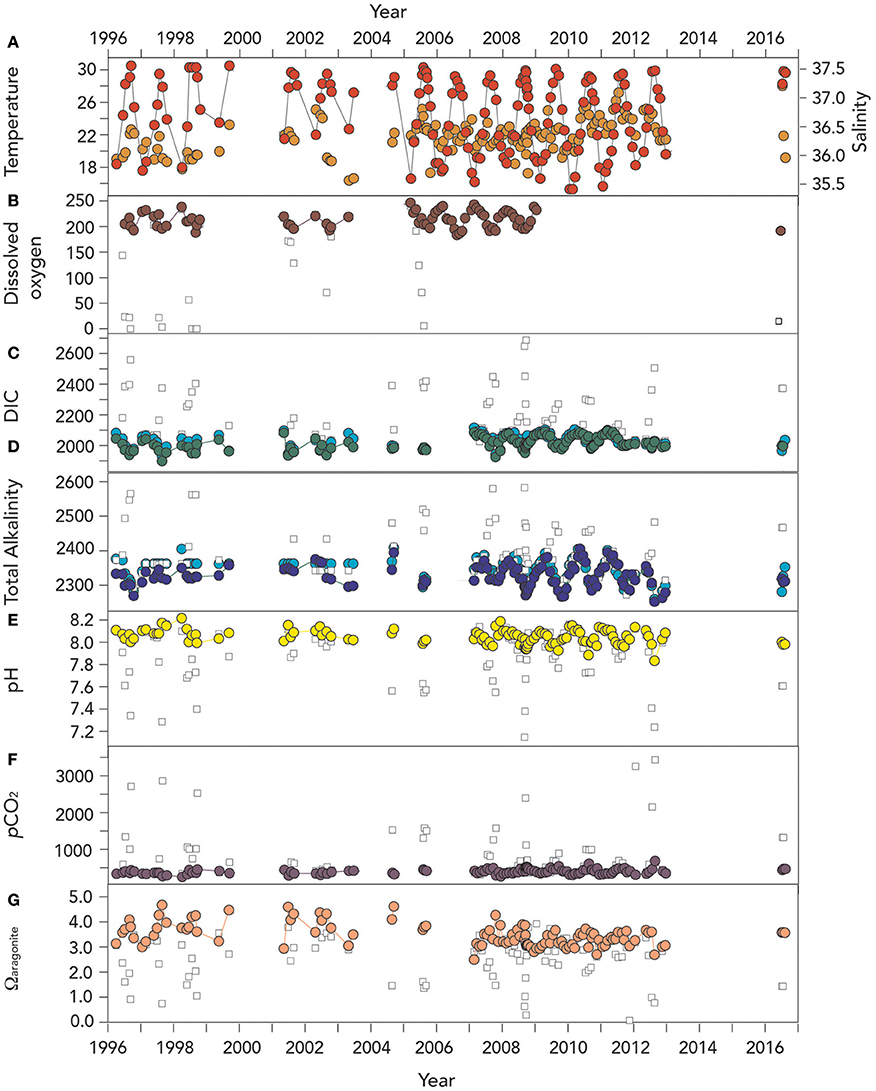
Figure 3. Time–series of surface (~1 m) hydrographic and seawater CO2–carbonate chemistry from Devils Hole, Harrington Sound, Bermuda (1996–2016). In (B–G), actual surface data are shown with open circle symbols, while deep (>24–26 m) data are shown as open square symbols in all the panels. (A) Temperature (°C; red circle) and salinity (orange circle); (B) Surface dissolved oxygen (μmoles kg−1; brown circle). Deep (i.e., 24–26 m) DO data in Devil's Hole is shown as open square; (C) Dissolved inorganic carbon (DIC; μmoles kg−1; green circle), and salinity normalized DIC (nDIC; μmoles kg−1; blue circle); (D) Total alkalinity (TA; μmoles kg−1; deep blue circle), and salinity normalized TA (nTA; μmoles kg−1; cyan circle); (E) pH (yellow circle); (F) pCO2 (μatm; purple circle); and (G) Ωaragonite (salmon circle).
Assessment of Surface Seasonal Variability at Harrington Sound
The non–uniform frequency of sampling at Harrington Sound requires different approaches to elucidate meaningful assessment of physical and chemical changes over time. As described in the methods, monthly mean physical and chemical properties were determined using the 20–year record (Figure 4) and compared to similar, mean monthly surface ocean climatology observed offshore at BATS (1996–2012; Bates et al., 2012, 2014). The rationale for this approach is to determine underlying trends and account for episodic sampling and potential seasonal biases in sampling.
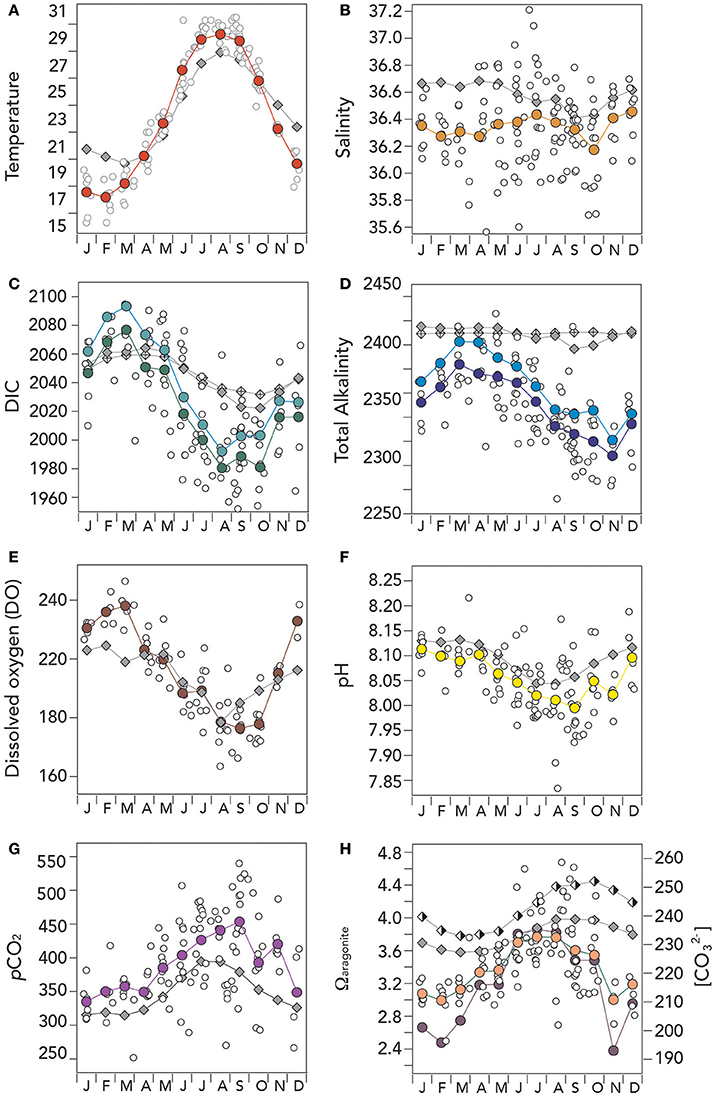
Figure 4. Mean seasonal climatology of surface (~1 m) hydrographic and seawater CO2–carbonate chemistry from Devils Hole, Harrington Sound, Bermuda (1996–2016) compared against mean seasonal changes observed at BATS. In (A–H), actual surface data are shown with open circle symbols, while BATS data is shown as gray diamond symbols. (A) Temperature (°C; red circle); (B) salinity (orange circle); (C) Dissolved inorganic carbon (DIC; μmoles kg−1; green circle), and salinity normalized DIC (nDIC; μmoles kg−1; blue circle); (D) Total alkalinity (TA; μmoles kg−1; deep blue circle), and salinity normalized TA (nTA; μmoles kg−1; cyan circle); (E) Dissolved oxygen (μmoles kg−1; brown circle); (F) pH (yellow circle); (G) pCO2 (μatm; purple circle); and (G) Ωaragonite (salmon circle) and [] (μmoles kg−1; purple circle). Offshore values at BATS for Ωaragonite (half-filled diamond) and [] (filled diamond) are also shown on the figure. The low Ωaragonite and [] values shown in November reflects lower mean alkalinity conditions in Harrington Sound compared to the proceeding and succeeding months (which acts to increase pCO2 and decrease pH).
Temperature and Salinity Seasonal Variability
The range of mean seasonal temperature at Harrington Sound was higher (~12°C; mean of 23.09 ± 4.61°C) than observed at BATS (~7°C; 23.49 ± 3.06°C). Relative to the open–ocean, surface temperatures at Harrington Sound were warmer in summertime and cooler in winter by a couple of degrees (Figure 4A). Surface salinity at Harrington Sound had a similar seasonal range to offshore at BATS with relatively small seasonal ranges (~0.2; Figure 4B). The mean monthly salinity of 36.34 ± 0.08 was lower than offshore (36.58 ± 0.09), but with large variability in actual data (Figure 4B). Such variability reflects day–to–day variation in rainfall to the North Lagoon and Harrington Sound. The lower mean salinity of ~0.24 in Harrington Sound is a similar value to the freshening of onshore waters expected by mean rainfall (1.41 m year−1) in the region over the past 25 years. Given rainfall amounts, mean depth and residence time for the Bermuda platform waters, a mean decrease in offshore salinity of 0.28 is estimated.
DIC, TA, and Dissolved Oxygen Variability
The seasonal ranges of DIC, TA, and dissolved oxygen (DO) at Harrington Sound were higher than observed offshore at BATS (Figures 4C–E). At Harrington Sound, DIC and nDIC values were higher in winter by ~20–30 μmoles kg−1 (January to May) and substantially lower by up to 50–60 μmoles kg−1 in summertime (June to October; Figure 4C). The mean DIC and nDIC values at Harrington Sound was 2,024.3 ± 33.5 and 2,039.1 ± 34.9 μmoles kg−1, respectively, compared to 2,046.5 ± 15.1 and 2,047.0 ± 10.4 μmoles kg−1 offshore. Similarly, mean TA and nTA values at Harrington Sound were much lower by ~40–50 μmoles kg−1 (i.e., mean values of 2,329.5 ± 24.7 and 2,346.2 ± 26.5 μmoles kg−1, respectively) when compared to offshore values (i.e., mean values of 2,388.7 ± 5.9 μmoles kg−1 and 2,389.6 ± 0.7 μmoles kg−1, respectively; Figure 4D).
Freshening of the surface layer accounts for ~65% and 27% of the lowered DIC and TA observed at Harrington Sound. However, compared to offshore data, the remaining loss of DIC and TA by a mean of ~35 and 73% respectively, reflects chemical modification of inshore waters by reef biogeochemical processes. Mean values of nDIC and nTA in the North Lagoon (a few years of contemporaneous observations) were very similar to Harrington Sound values (DIC and nTA higher by ~1 and 7 μmoles kg−1, respectively). This finding indicates that Harrington Sound observations are a good indicator of Bermuda inshore water changes relative to offshore conditions.
The seasonal climatology of dissolved oxygen contents at Harrington Sound showed higher DO values in winter by up to 15–20 μmoles kg−1 compared to offshore, but similar values onshore and offshore in summertime (Figure 4E). However, caution is advised here as only a few years of DO sampling were undertaken.
pH, pCO2, Ωaragonite and [] Variability
As with DIC and TA, other parameters of the CO2–carbonate system showed larger seasonal variation at Harrington Sound compared to offshore (Figures 4F–H). pH had a larger seasonal range of ~0.12 compared to ~0.08 (Figure 4F), and the same for pCO2 (i.e., ~120 μatm onshore compared to ~70 μatm offshore; Figure 4G). Similarly, seasonal ranges for Ωaragoniteand [] were about twice than that observed offshore (Figure 4H). The mean pCO2 of Harrington Sound was ~42 μatm higher than offshore, while pH, Ωaragonite and [] were lower by ~0.35, ~0.41 and ~26 μmoles kg−1, respectively.
Anoxia and Biogeochemistry of Devil's Hole, Harrington Sound
It is more than 60 years since seasonal summertime anoxia was first observed in the bottom depths of Devil's Hole, Bermuda (Beers and Herman, 1969; Figure 1A), and it reoccurred in 2016 again (Figure 3B). A composite climatology for the bottom depth of Devil's Hole (~23–25 m deep) shows an attenuated seasonal cycle for temperature relative to surface waters, with temperature typically ~4°C cooler (Figure 5A) while salinity (not shown in Figure) does not show significant difference between surface and deep. For much of the year (e.g., October to May), dissolved oxygen contents in deep Devil's Hole are similar to surface DO contents. However, in early summer, hypoxia typically develops in the bottom 1–3 m of the water column, with anoxia typically occurring in September (Figure 5B). In October, the water column typically mixes to the bottom depth of ~25 m due to seasonal cooling and mixing either through convection or wind event (i.e., hurricane passage or early winter storm front passage; Bates, 2007). Unfortunately, the time–series record of deep DO at Devil's Hole is not complete enough to demonstrate any long–term change in the deoxygenation of deep waters. There is also insufficient data to show if denitrification rates are significant in the bottom waters (Figure 5C).
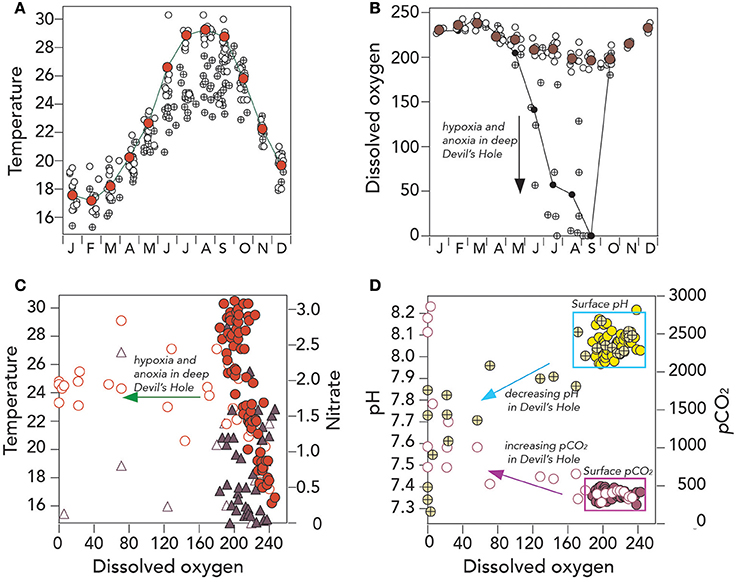
Figure 5. Hydrographic and seawater CO2–carbonate chemistry from surface and deep Devils Hole, Harrington Sound, Bermuda (1996–2016). (A) Mean seasonal changes in surface temperature (°C; red circle), all surface data (°C; open circles) and deep Devils Hole temperature (°C; cross circle); (B) Mean seasonal changes in dissolved oxygen (μmoles kg−1; brown circle), all surface data (μmoles kg−1; open circles) and deep Devils Hole dissolved oxygen (μmoles kg−1; cross circle); (C) Scatter plot of dissolved oxygen (μmoles kg−1) against temperature (surface data; red circle; Devils Hole, open red circles) and nitrate (surface data; purple triangle; Devils Hole, open purple triangle); and (D) Scatter plot of dissolved oxygen (μmoles kg−1) against pH (surface data; yellow circle; Devils Hole, open/cross yellow circles) and pCO2 (μatm; surface data; purple circle; Devils Hole, open purple circle).
The CO2-carbonate chemistry of the anoxic bottom water of Devil's Hole show large perturbation from surface and offshore values, with pCO2 as high as 3,500 μatm, pH as low as 7.2 (Figures 3E,F, 5D) and Ωaragonite values less than one (nearly always in September; Figure 3G). About a third of the years sampled, the bottom waters also had (i.e., Ωcalcite) values less than one, indicative that these waters were chemically conducive for dissolution of both aragonitic and calcitic components of Devil's Hole sediments. Seasonal dissolution of sediment CaCO3, observed more than 40 years ago (e.g., Berner, 1966; Thorstenson and Mackenzie, 1974; Balzer and Wefer, 1981), still appears to occur in the present day.
Despite the shortcomings of data collection at Devil's Hole, the CO2-carbonate chemistry of seasonally anoxic bottom waters may be changing, perhaps partly coupled to changes in surface water chemistry (discussed later in section Long–Term Trends (1996–2016) of Seawater CO2–carbonate Chemistry). In the late 1990's, bottom water pCO2 were reported at ~600–1,200 μatm (Balzer and Wefer, 1981), up to 1,800 in 2000/2005, and over 3,000 μatm in 2011/2012 and 2016 (Figure 3F). In these latter years, bottom water pH has dipped below 7.3, and Ωaragonite values to less than 0.5, with the caveat that large year–to–year variability will obscure determination of statistically significant long-term trends for at least the next decade or so. However, over the last decade, the persistence of anoxia/hypoxia appears longer in duration (e.g., 4 months) when compared to anecdotal evidence of shorter duration events in the 1960's and 1970's. The more important feature of Devil's Hole is the potential value of studying sedimentary dissolution and fluxes (e.g., Andersson et al., 2007) under a very wide range of chemical environments (oxic to anoxic conditions, pH range of <7.2–8.2 and Ωaragonite values from ~3 to <0.5.
Long–Term Trends (1996–2016) of Seawater CO2–Carbonate Chemistry
Temperature and Salinity Trends
The seasonal climatology of hydrography and seawater CO2–carbonate chemistry reported in section DIC, TA, and Dissolved Oxygen Variability earlier were used to determine physical and chemical anomalies relative to the 1996–2016 climatology (e.g., Bates et al., 2012, 2014). For this 20–year period, surface temperatures at Harrington Sound did not show statistically significant trends over time (trend of −0.06°C year−1; p > 0.01 was not significant; Table 3; Figure 6A). Offshore, surface temperatures observed at Hydrostation S have warmed by 0.11°C per decade since the mid-1950's (Bates et al., in review), but the trends were also non–significant over the past couple of decades.
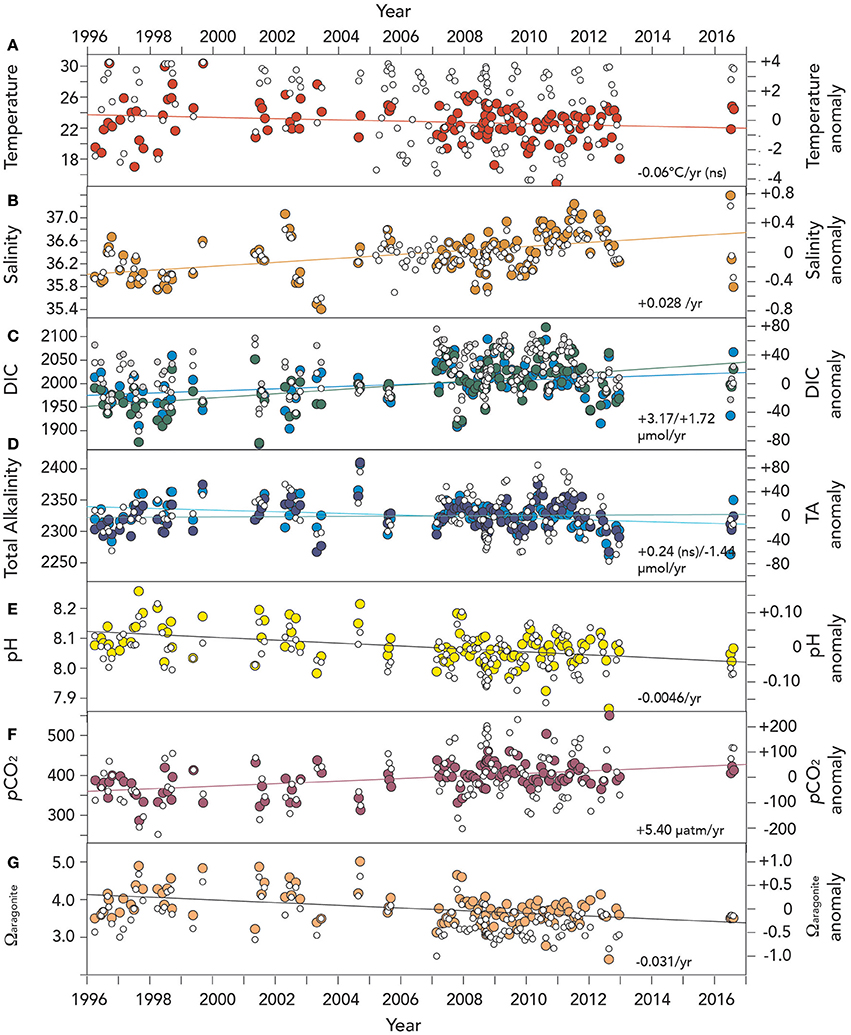
Figure 6. Time–series of surface (~1 m) hydrographic and seawater CO2–carbonate chemistry anomalies from Devils Hole, Harrington Sound, Bermuda (1996–2016). In (A–G), actual surface data are shown with open circle symbols. Please note that unlike earlier Figures, dissolved oxygen anomalies and trends are not shown due to insufficient data in the last decade. (A) Temperature (°C; red circle); NS means not statistically significant; (B) salinity (orange circle); (C) Dissolved inorganic carbon (DIC; μmoles kg−1; green circle), and salinity normalized DIC (nDIC; μmoles kg−1; blue circle); (D) Total alkalinity (TA; μmoles kg−1; deep blue circle), and salinity normalized TA (nTA; μmoles kg−1; cyan circle); (E) pH (yellow circle); (F) pCO2 (μatm; purple circle); and, (G) Ωaragonite (salmon circle).
In contrast to temperature, surface salinity has increased in Harrington Sound at a rate of +0.028 ± 0.005 year−1 (i.e., 0.28 decade−1; Table 3; Figure 6B). This salinification of surface waters compares to an increase in salinity at Hydrostation S of +0.015 year−1 since the mid–1950's (i.e., 0.15 decade−1; Table 3; p < 0.01; Bates et al., in review). The greater rate of salinity increase in Harrington Sound may reflect increased evaporative fluxes (relative to precipitation) from the shallow Bermuda platform waters due to increased wind speed over the last few decades (Bates, 2007; Young et al., 2011; COADS wind speed data, data access August 2016).
Seawater CO2–Carbonate Chemistry Trends
The long-term trends for surface seawater CO2-carbonate chemistry at Harrington Sound are given in Table 3, with all trends statistically significant except for total alkalinity (TA). Of the observed parameters, DIC and nDIC increased at a rate of +3.17 ± 0.48 μmoles kg−1 year−1, and +1.72 ± 0.49 μmoles kg−1 year−1, respectively (Figure 6C). In contrast, no trend for TA was determined, but rather, a significant decreasing trend for nTA at −1.44 ± 0.39 μmoles kg−1 year−1 (Figure 6D). For DIC, about 55% of the trend was due to increasing salinity (determined from the difference in nDIC and DIC trends), with the remainder due to other processes (e.g., anthropogenic uptake of CO2 and changes in net metabolism of the Bermuda reef. For TA, any increase due to salinification of Harrington Sound waters was counteracted by a substantial decrease in TA due to other causes (i.e., changes in net ecosystem calcification discussed later). Over 20 years (1996–2016), nDIC has increased by ~35 μmoles kg−1 while TA has decreased by ~29 μmoles kg−1.
Other parameters of the seawater CO2-carbonate system also substantially changed from 1996 to 2016. Seawater pH, Ωaragonite and [] values decreased at −0.0046 ± 0.0009, −0.031 ± 0.006 year−1, and –1.50 ± 0.6 μmoles kg−1 year−1, respectively (Table 3; Figures 6E,G). Over the past 20 years, such change in seawater pH is equivalent to a 30% increase in [H+] concentration. At the same time, pCO2 increased at a rate of +5.4 ± 1.0 μatm year−1, or almost 100 μatm (~25% increase) from 1996 to 2016 (Figure 6F).
Discussion
Comparison of Onshore and Offshore Trends in Seawater CO2–carbonate Chemistry
Several factors often confound the assessment of long–term changes in physical and biogeochemical properties of the marine environment, including seasonal variation; signal-to-noise problems and analytical approaches not sensitive or accurate enough. Large seasonal variation of biogeochemistry in shelf seas (e.g., Borges et al., 2010) can dominate longer-term, gradual changes of seawater CO2–carbonate chemistry and ocean acidification signal. Time-series of seawater CO2–carbonate chemistry in the coastal marine environment tend to be relatively short (i.e., less than 10 years) with observation over an annual cycle (e.g., Johnson et al., 2013), a few years of regular sampling (e.g., Oregon coast, Harris et al., 2013; Santa Monica Bay, Leinweber and Gruber, 2013; Bermuda, Yeakel et al., 2015) that extends to 8 years of sampling (Bay of Bengal, Sarma et al., 2015). Other approaches include assessments of change from repeat sampling multi–year intervals between sampling (e.g., North Sea, (Clargo et al., 2015); coastal margin of the USA, Wanninkhof et al., 2015), or model assessments of longer–term change (e.g., California Current, Hauri et al., 2013; Turi et al., 2016).
The signal–to–noise problem (Santer et al., 2011) complicates trend assessment and time of emergence (ToE) of trends. In the ocean, Keller et al. (2014) have demonstrated that the time of emergence for pCO2 and pH is about 12 years and ~10–30 years for DIC, with open-ocean time-series sufficiently long in duration to demonstrate long–term trends (e.g., Bates et al., 2014). Similarly, the Harrington Sound time-series of seawater CO2–carbonate chemistry and anomalies from 1996 to 2016 is thus of sufficient length to demonstrate trend emergence and it constitutes one of the longest, if not the longest, coastal ocean time–series in the global coastal ocean.
The Harrington Sound trends in seawater CO2–carbonate chemistry were notably different from those at existing open–ocean time–series (Bates et al., 2012, 2014), with higher annual/decadal rates of increase in DIC and pCO2, and decrease in pH, Ωaragonite and [] (Table 3). As the lengthiest coastal ocean time-series, Harrington Sound is difficult to compare to other shorter time-series, especially given the absence of contemporaneous observations in subtropical/tropical marine environments, in particular. In temperate environmental, seawater CO2–carbonate chemistry trends are mixed, with no surface trends detectable in Santa Monica Bay, for example (Leinweber and Gruber, 2013). In contrast, pH and CaCO3 saturation states have declined at higher rates than the open ocean in the North Sea (Thomas et al., 2007; Clargo et al., 2015) and Washington state, USA (Wootton et al., 2008) in response to a combination of ocean uptake of anthropogenic CO2 (e.g., ocean acidification) and marine ecosystem and land–ocean flux changes.
As discussed, about one third of the increasing DIC trend of +3.18 ± 0.48 μmoles kg−1 year−1 was due to salinification of surface waters. The residual trend of +1.72 ± 0.49 μmoles kg−1 year−1 (i.e., nDIC, Table 3) reflects changes associated with ocean uptake of anthropogenic CO2 (i.e., nDICANT), air-sea CO2 gas exchange and biogeochemical changes. An ocean uptake of anthropogenic CO2 of ~+0.8 μmoles kg−1 year−1 for Bermuda onshore waters is assumed (~25% of the DIC trend; i.e., nDICANT), given long-term rates established at BATS and other open–ocean time–series sites (Bates et al., 2012, 2014). Previous studies have also shown that air–to–sea flux of CO2 from gas exchange is increasing due to an increase in windspeed (+0.042 m s−1 year−1) over the subtropical North Atlantic Ocean and the island of Bermuda (Bates, 2007). However, given the seasonality and annual increase of seawater pCO2 at Harrington Sound, changing air-sea CO2 gas exchange would only contribute +0.04 μmoles kg−1 year−1 to the DIC trend (~1% of the DIC trend). The residual component of the DIC trend (i.e., +0.86 μmoles kg−1 year−1 or ~28%) likely reflects changes in the balance of reef biogeochemical processes.
The other substantial change in seawater CO2–carbonate chemistry at Harrington Sound relates to the decrease in nTA (i.e., –1.44 μmoles kg−1 year−1) that also reflects changes in the balance of reef biogeochemical processes. Thus, the combination of increasing DIC and decreasing alkalinity observed over time at Harrington Sound is the dominant driving force behind the notably higher increase in pCO2 and decrease in pH, Ωaragonite and [] when compared to contemporaneous open–ocean, offshore trends.
Insights into reef Rates of NEP and NEC and reef Metabolism
The time-series of Harrington Sound seawater CO2–carbonate chemistry offer insights about the changing status of the Bermuda reef biogeochemical processes. As described earlier (Section Long–term Trend Analysis), comparison of contemporaneous onshore and offshore DIC and TA differences provides estimates of net community calcification (NEC) and net ecosystem production (NEP). This approach has been used before for the Bermuda reef system (e.g., Bates, 2002; Bates et al., 2010; Andersson et al., 2014; Yeakel et al., 2015; Courtney et al., 2016) and many other reefs (e.g., Chisholm and Gattuso, 1991; Suzuki et al., 1995; Gattuso et al., 1998; Suzuki and Kawahata, 2003; Anthony et al., 2011; Kleypas et al., 2011; Albright et al., 2013; Inoue et al., 2013; Lantz et al., 2014; Koweek et al., 2015). Only a few of these studies extend to 5 years, and thus, the Harrington Sound data provides the first long–term assessment of reef metabolism and reef NEC and NEP.
As in Section Assessment of Surface Seasonal Variability at Harrington Sound, mean monthly climatology of Bermuda reef NEC and NEP was determined first before interannual anomalies. These data allow the following interlinked questions to be tested: (1) Does the Bermuda reef exhibit seasonal changes in biogeochemical processes such as calcification, dissolution, production and respiration? (2) Is the Bermuda reef net accretive with respect to CaCO3; (3) Is the trophic status of the Bermuda reef in balance (i.e., NEP = 0) or net heterotrophic or net autotrophic on an annual basis?
In a recent study, Yeakel et al. (2015) proposed that the Bermuda reef exhibited increased calcification and increased respiration over the past 5 years due to increased coral nutrition. The Harrington Sound data can be used to test this hypothesis over a longer time period and the following questions: (4) Does the Bermuda reef ecosystem exhibit increased calcification and respiration over the past two decades offsetting ocean acidification? (5) Does this change in reef metabolism relate to other external factors?
Does the Bermuda Reef Exhibit Seasonal Changes in Biogeochemical Processes?
The Bermuda reef exhibits seasonal changes in NEC and NEP (Figure 7). For most of the year, rates of NEC are positive indicative of net calcification. The highest rates of calcification occurred in late summer (September to October) of up to ~1.5 g CaCO3 m−2 d−1 (Figure 7A), later than the seasonal peak in Ωaragonite and [] (Figure 4H). These rates of NEC were similar to previously reported calcification rates of ~1.3–3.2 g CaCO3 m−2 d−1 scaled up from in situ skeletal growth rates (measured over 50–70 days of growth) observed at Hog Reef, Bermuda from 2002 to 2003 using the dominant coral species, Diploria labyrinthiformis (Amat and Bates, 2004; Bates et al., 2010).
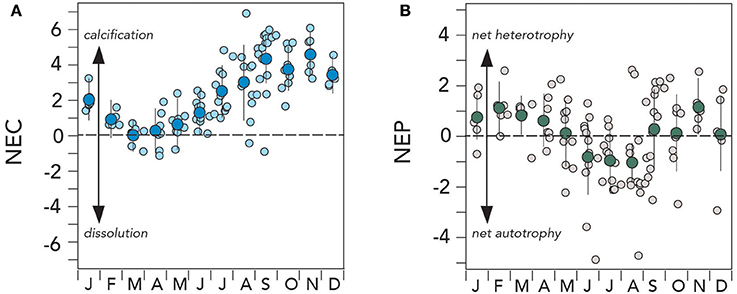
Figure 7. Mean seasonal climatology of surface (~1 m) net ecosystem calcification (NEC; g CaCO3 m−2 d−1) and net ecosystem production (NEP; 0.71 ± 0.3 g C m−2 d−1) from Devils Hole, Harrington Sound, Bermuda (1996–2016). (A) NEC (larger deep blue circles denote mean monthly value); (B) NEC (larger green circles denote mean monthly value).
Surprisingly the seasonal rates of NEC decreased to near zero in the March to May period (Figure 7A). During the 1996–2016 period, NEC became negative on occasion in winter and exceptionally in summertime, indicative of net dissolution on the reef system of up to ~6 g CaCO3 m−2 d−1. In an early study of Bermuda reef NEC and NEP, there were hints of a seasonal transition in winter to net dissolution, but assumptions about skeletal growth rates underlay this synthesis (Bates, 2002). Here, it appears that although the Bermuda reef system is dominated by net calcification, the reef system can switch to net dissolution seasonally. Similar seasonal net dissolution has been recently observed on the Florida Reef tract (Muehllehner et al., 2016).
Does the Bermuda Reef Experience Net Accumulation of CaCO3?
The mean annual NEC estimated for the Bermuda reef system over the 1996–2016 period was ~2.2 ± 1.6 g CaCO3 m−2 d−1 which is on the lower end of typical calcification ranges observed for other reefs (<2–40 g CaCO3 m−2 d−1; e.g., Kinsey, 1985; Barnes and Lazar, 1987; Gattuso et al., 1993, 1996, 1999; Yates and Halley, 2006; Silverman et al., 2007). Despite occasional episodes of net dissolution, the growing evidence presented here indicates that the Bermuda reef system experiences a net accumulation of CaCO3. The mean annual rate of net calcification for the Bermuda reef is estimated at 0.8 ± 0.6 g CaCO3 m−2 year−1. If scaled to the entire Bermuda reef system, this is equivalent to an annual CaCO3 production rates of ~4.4 ± 3.6 Tg CaCO3 year−1.
Is the Trophic Status of the Bermuda Reef in Balance?
The NEP of the Bermuda reef had a different mean seasonal pattern to NEC (Figure 7B). The May to September period had negative NEP values of up to −0.5 g C m−2 d−1 and indicative of net autotrophy (i.e., photosynthesis > respiration). However, surprisingly, the October to April period had positive NEP values of up to +0.3 g C m−2 d−1 and, thus indicative of net heterotrophy (i.e., respiration > photosynthesis). On diurnal timescales for other reef systems, many studies have shown shifts between net autotrophy and net heterotrophy (i.e., balance of photosynthesis and respiration during the day/night cycle; e.g., Gattuso et al., 1996; Ohde and van Woesik, 1999), but not on seasonal time-scales. While there was much variability in NEP rates, this finding indicates that the Bermuda reef system does seasonally alternate between net autotrophy and net heterotrophy.
In other reef systems, studies have shown that organic carbon production and remineralization are roughly balanced, with no or little organic material accumulation in sediments of reef systems (e.g., Yamamoto et al., 2001; Atkinson, 2011). In such circumstances, the trophic status of the reef is balanced and NEP is close to zero. The Harrington Sound data indicates that the mean NEP value for the Bermuda reef is +0.02 ± 0.09 g C m−2 d−1, and thus, the trophic status may not be in balance. Although the mean NEP is close to zero, positive values suggest that the Bermuda reef is slightly net heterotrophic, with a net delivery of offshore sourced organic matter that is respired onshore throughout the reef system (Yeakel et al., 2015).
Does the Bermuda Reef System Exhibit Increased Calcification and Respiration over the Past Two Decades Offsetting Ocean Acidification?
As with anomalies of seawater CO2–carbonate chemistry discussed in Section Long–term Trends (1996–2016) of Seawater CO2 –carbonate Chemistry, anomalies of NEC and NEP show significant changes over the past two decades (Figure 8). For example, NEC has increased from 1996 to 2016 at a rate of ~0.07 ± 0.03 g CaCO3 m−2 d−1 or about 3% per year. This represent an increase in calcification of ~0.7 ± 0.3 g CaCO3 m−2 per decade or about a 31% increase per decade of Bermuda reef calcification (Table 4).
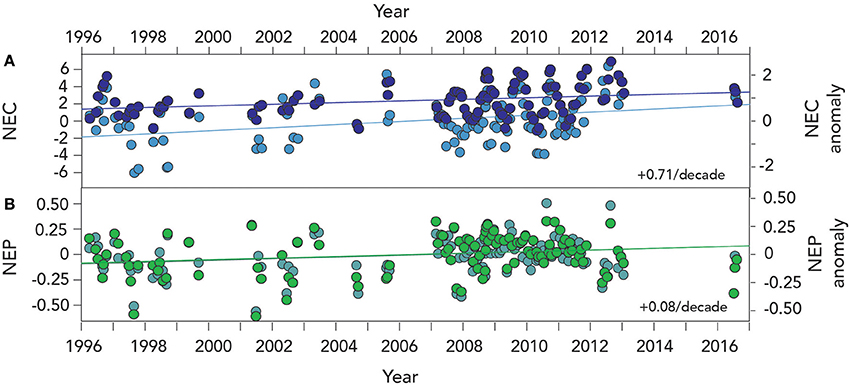
Figure 8. Time–series of NEC and NEP anomalies from Devils Hole, Harrington Sound, Bermuda (1996–2016). (A) NEC (larger deep blue circles denote anomalies while light blue show actual NEC data); (B) NEC (l bold green circles denote anomalies while light green-blue show actual NEC data).
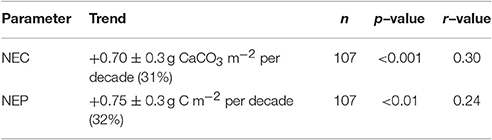
Table 4. Long–term trends (1996–2016) of net ecosystem calcification (NEC) and net ecosystem production (NEP) estimated for the Bermuda coral reef system using Harrington Sound data.
Contemporaneous with these changes in NEC, the rates of NEP have also increased at ~75 ± 32 mg C m−2 d−1 or a shift to stronger net heterotrophy. This rate of NEP increase represents an increase in respiration of ~0.7 ± 0.3 g C m−2 per decade or about a 32% increase per decade in Bermuda reef respiration. Twenty years of Harrington Sound data strongly indicate that the entire Bermuda reef system has exhibited an increase in both calcification and respiration as hypothesized by Yeakel et al. (2015).
In previous studies, strong seasonal relationships have been observed between coral calcification and decreasing Ωaragonite and [] for the Bermuda reef and many other reef systems. While this seasonal linkage of calcification and CO2–carbonate chemistry still holds for the Bermuda reef, the increase in NEC over the past two decades indicates that calcification has increased over time. This finding indicates that gradual reduction in Ωaragonite and [], and by inference reef calcification, due to ocean acidification has for the past two decades been counteracted by other reef processes.
Does this Change in Reef Metabolism Relate to External Factors?
Yeakel et al. (2015) posited that the 5–year increase in both calcification and respiration on the Bermuda reef resulted from increased coral nutrition augmenting coral calcification, thereby counteracting the impact of ocean acidification. The findings of this study indicate that this scenario may have been in place for the past 20 years or so for the Bermuda reef. It highlights the need to understand the combined synergistic impact of ocean acidification and other environmental forcing for coral reef and calcifying ecosystems.
Is an increase in food and nutrition augmenting coral calcification on the Bermuda reef and potentially other reefs? It is a difficult question to answer, but other supporting evidence give some clue to the potential for external, offshore factors to influence reef metabolism. From 1988 to 2008, open–ocean chlorophyll biomass and rates of in situ primary production observed offshore at BATS increased (Lomas et al., 2010, 2013) with coccolithophore (i.e., calcifying phytoplankton) biomass increasing at BATS (Krumhardt et al., 2016) and over the entire subtropical gyre of the North Atlantic Ocean. At the same time as the increase in calcification and respiration shown for the Bermuda reef, offshore chlorophyll a biomass has increased by ~22% per decade (Table 3). Furthermore, nitrate values in the mixed layer had almost doubled over the past two decades and suspended particulate organic carbon (POC) and dissolved organic carbon have increased by ~30 and 2% per decade, respectively. It is difficult to substantiate increased coral nutrition over the past two decades, but it is clear that the concentration of suspended particulate and dissolved organic carbon has increased over time in offshore waters surrounding Bermuda. The “wall” of coral feeders would thus likely take advantage of increased food availability from surrounding offshore waters. The proviso is that even though Bermuda coral might be feeding at a higher rate, only future experimental studies will confirm the linkage between increased nutrition and enhanced coral calcification.
Evaluating the Relationships between CO2-carbonate chemistry, Calcification, and net Ecosystem calcification
The relationships between seawater CO2–carbonate chemistry (i.e., [] and Ωaragonite), and coral calcification for in vitro and in situ conditions (e.g., Anthony et al., 2011; Kleypas et al., 2011; Albright et al., 2013; Andersson et al., 2014) have been used predict future reef transition from domination by calcifiers to non-calcifying macroalgae due to ocean acidification. Uncertainties of the thresholds of [] or Ωaragonite for when ocean chemistry suppresses coral calcification or transition from net reef calcification to dissolution of either [] and Ωaragonite pose a serious issue for prediction of future impact of OA, and especially given that other environmental factors such as temperature and light are important (e.g., Gattuso et al., 1996, 1998). Neither [] or Ωaragoniteare particularly suitable as potential chemical indicators of calcifier response to OA as Jokiel (2016) has pointed out previously.
In earlier studies of the Bermuda reef system, in situ coral calcification rates (i.e., skeletal growth rates (measured either as mg CaCO3 g d−1 or mg CaCO3 cm−2 d−1) measured in 2002 and 2003 for the major framework builder, D. labyrinthiformis, were well correlated with [] or Ωaragonite (r2 = 0.68; please note that r2-value come from the original source and has a p–value of <0.01), but less so with temperature or light (Bates et al., 2010). Coral calcification appears to reach their highest seasonal rates in September to November and after peak surface temperatures (in August) and light conditions (July). NEC rates computed for the Bermuda reef system in this study (Figure 7B) also show a peak in September to November, and they are poorly correlated with temperature (Figure 3). But, NEC rates are also poorly correlated with [] or Ωaragonite (Table 3). Coral calcification requires uptake of [] (and dissolved Ca2+), with an energetic cost of expelling H+ to enable alkalinization of fluids at the site of CaCO3 formation (Jokiel, 2016). Thus, it may be useful to assess the relationships between calcification or NEC and a ratio of [] to [H+] (e.g., [H+] rather than pH due to the log scale of the latter). A useful chemical tracer is thus CI*, where:
with the multiplier bringing both [] and [H+] to the same molar scale. If CI* increases, the proportion of [] to [H+] is greater in seawater. CI* thereby provides a useful indicator of the relative proportion of both chemical species, and the chemical gradient against which coral take up [] and expel [H+]. The annual NEC rate data from Harrington Sound is well correlated to CI* (r2 = 0.50) as well as individual colony skeletal growth rates measured at Hog Reef, Bermuda (Bates et al., 2010). However, the utility of using a tracer such as CI* needs to be evaluated in other reef settings. It may be that CO2–carbonate chemistry is not a good, singular, predictor of coral calcification, but instead, requires systemic knowledge of contemporaneous temperature and light responses, for example.
A question remains, however, as to why coral calcification and NEC are apparently higher in the late summer/early autumn (September to November). The chemical thermodynamics of the seawater CO2-carbonate system variably influence [] and [H+] depending on temperature, DIC and TA, primarily. The influence of DIC/TA and temperature can be tested independently by taking typical winter Bermuda reef chemistry and either changing DIC/TA according to observed seasonal changes (but keeping temperature constant) or changing temperature according to typical seasonal changes (but keeping DIC and TA at winter values). In the first scenario, the loss of DIC and TA in summertime increases [] and decreases [H+]. In the second scenario, increasing temperature primarily increases [H+]. In the Bermuda reef system, autumn [] remains similar to mid-summer values of ~225–235 μmoles kg−1. At the same time, however, surface–ocean cooling after August decreases [H+] values rapidly, thereby increasing the relative proportion of [] to [H+] during the September to November period. A hypothesis can be proposed that argues that the coincident highest rates of calcification and NEC, after mid-summer, reflect a seasonal reduction of energetic demands to expel intracellular [H+], thereby facilitating coral calcification (when [] values remain relatively high compared to winter and spring conditions). Such a hypothesis can be tested in vitro with different coral species, or from spatio–temporal sampling of other reef systems for seawater CO2–carbonate chemistry and NEC changes.
However, it should be noted that the rate of NEC reflects the balance of calcification and CaCO3 dissolution. Thus, NEC may not be directly coupled to coral calcification. An increase in NEC, as observed for the Bermuda reef system, might also reflect a seasonal reduction in CaCO3 dissolution or coral bioerosion, for example.
Conclusions
A few decades of open–ocean observations in the open–ocean have shown consistent and gradual changes in seawater CO2–carbonate chemistry over time (Bates et al., 2014). Such changes in ocean chemistry highlight the impact of the uptake of atmospheric CO2 by the ocean and ocean acidification. As Duarte et al. (2013, 2015) have argued, the signal and response of marine ecosystems to OA in the coastal ocean is not clear due to a limited number of time-series observations that extend beyond 5 years of sampling for inorganic carbon and supported measurements. There are few long–term records (>5 years) of the coastal ocean with which one can assess the pace and direction of environmental change, and response to OA.
In this paper, surface ocean observations collected from 1996 to 2016 at Harrington Sound, Bermuda, provide one of the longest time–series of coastal ocean inorganic chemistry. The continual exchange of offshore waters of the surrounding subtropical North Atlantic Ocean with Bermuda reef waters, the relatively short residence time of waters onshore, and long–term characterization of offshore water chemistry at the nearby Bermuda Atlantic Time-series Study (BATS) site provide a unique means of assessing reef metabolism over seasonal to multi–year periods. These data also reveal much about the changing dynamics of Bermuda reef system biogeochemical processes such as primary production, respiration, calcification and CaCO3 dissolution.
Onshore in surface waters of Harrington Sound, no significant warming or cooling was observed over the 1996–2016 period, but increases in surface salinity were observed. Dissolved inorganic carbon (DIC) and partial pressure of CO2 (pCO2) increased at a rate of ~1.5% and ~10% per decade, about two to three times the contemporaneous rates of change observed offshore at the BATS site. The increase of seawater inorganic carbon in onshore waters was primarily due to increased salinity (~45%), uptake of anthropogenic CO2 (~25%), and changes in Bermuda reef biogeochemical processes (~30%). At the same time, indicators such as pH, saturation state of calcium carbonate (Ω) and [] decreased at a rate of two to three times that observed offshore at BATS (e.g., Bates et al., 2012).
From 1996 to 2016, total alkalinity (i.e., nTA) decreased in contrast to the increase in DIC over time. The covariant changes in DIC and TA onshore and at the BATS site allowed assessments of net ecosystem production (NEP) and net ecosystem calcification (NEC) to be made for the Bermuda reef system. These data indicated that the entire Bermuda reef system appears to shift seasonally from wintertime net heterotrophy to summertime net autotrophy. Unlike other reefs, over annual time-scales, the Bermuda reef system does not appear to be in trophic balance (i.e., NEP = 0), but rather slightly net heterotrophic in its mean state. This suggests that there is an offshore supply of organic matter that is respired onshore within the reef system (presumably through coral nutrition of suspended particulate matter). The Bermuda coral reef system also appears to be net accretive (i.e., gross calcification > gross CaCO3 dissolution), but there were occasional periods when the reef appears to transiently shift to net dissolution between 1996 and 2016.
In an earlier study, Yeakel et al. (2015) suggested that net calcification and net heterotrophy have increased in the Bermuda reef system over a 5–year time–frame. From 1996 to 2016, the estimates of NEC and NEP determined for the Bermuda reef system show that the rates of net calcification and net heterotrophy have increased by ~30%, and this finding adds additional evidence and support for the hypothesis of Yeakel et al. (2015). While it is difficult to assert the cause of such changes over the past two decades, it may relate to increased coral nutrition occurring in concert with increased offshore productivity (chlorophyll, POC, DOC, and nitrate increasing over the past two decades) in the surrounding subtropical North Atlantic Ocean. Importantly, this long–term study reveals that other environmental factors may mitigate against the effects of ocean acidification on coral reef calcification. This is the finding for the Bermuda reef system over the past couple of decades, with the caveat that there remains considerable uncertainty about the future direction of the health of the Bermuda reef system.
Author Contributions
NB designed the 20–year study, analyzed the results, and wrote the manuscript.
Funding
NSF OCE 09-28406 (NB) provided funding for this work.
Conflict of Interest Statement
The author declares that the research was conducted in the absence of any commercial or financial relationships that could be construed as a potential conflict of interest.
Acknowledgments
The following are thanked for their contributions to sampling and analyses of samples from 1996 to 2016, including Frances Howse, Margaret H.P. Best, and Julian Mitchell, who were research technicians at BIOS and Rebecca Garley who is currently at BIOS. Dr. Doug Connolly, Dr. Richard J. Owens, Prof. Anthony H. Knap, and Tim Noyes are thanked for the opportunities to sample Bermuda inshore waters over the past 20 years. Dr. Andreas J. Andersson is thanked for the use of data sampled at Harrington Sound in September 2008 that were published in Parsons et al. (2015). These water samples were analyzed for DIC and TA in the laboratory of NB at BIOS.
References
Albright, R., Caldeira, L., Hosfelt, J., Kwiatkowski, L., McLaren, J. K., Mason, B. M., et al. (2016). Reversal of ocean acidification enhances coral calcification. Nature, 531, 362–365. doi: 10.1038/nature17155
Albright, R., Langdon, C., and Anthony, K. R. N. (2013). Dynamics of seawater carbonate chemistry, production and calcification of a coral reef flat, central Great Barrier Reef. Biogeosciences 10, 6747–6758. doi: 10.5194/bg-10-6747-2013
Alin, S. R., Brainard, R. E., Price, N. N., Newton, J. A., Cohen, A., Peterson, W. T., et al. (2015). Characterizing the natural system: toward sustained, integrated coastal ocean acidification observing networks to facilitate resource management and decision support. Oceanography 28, 92–107. doi: 10.5670/oceanog.2015.34
Alin, S. R., Feely, R. A., Dickson, A. G., Hernandez-Ayon, J. M., Juranek, L. W., Ohman, M. D., et al. (2012). Robust empirical relationships for estimating the carbonate system in the southern California Current System and application to CalCOFI hydrographic cruise data (2005–2011). J. Geophys. Res. 117, C05033. doi: 10.1029/2011JC007511
Amat, A., and Bates, N. R. (2004). “Concomitant impact of carbon dioxide and temperature on coral metabolism: from the seasonal to the global change scales. Case study of the high latitude reef of Bermuda,” in 10th International Coral Reefs Symposium (Okinawa).
Andersson, A. J. (2015). A fundamental paradigm for coral reef carbonate dissolution. Front. Mar. Sci. 2:52. doi: 10.3389/fmars.2015.00052
Andersson, A. J., Bates, N. R., Jeffries, M., Freeman, K., Davidson, C., Stringer, S., et al. (2013). Clues from current high CO2 environments on the effects of ocean acidification on CaCO3 preservation. Aquat. Geochem. 19, 353–369. doi: 10.1007/s10498-013-9210-y
Andersson, A. J., Bates, N. R., and Mackenzie, F. T. (2007). Dissolution of carbonate sediments under rising pCO2 and ocean acidification: Observations from Devil's Hole, Bermuda. Aquat. Geochem. 13, 237–264. doi: 10.1007/s10498-007-9018-8
Andersson, A. J., and Gledhill, D. (2013). Ocean acidification and coral reefs: effects on breakdown, dissolution, and net ecosystem calcification. Ann. Rev. Mar. Sci. 5, 321–348. doi: 10.1146/annurev-marine-121211-172241
Andersson, A. J., Kuffner, I. B., Mackenzie, F. T., Jokiel, P. L., Rodgers, K. S., and Tan, A. (2009). Net loss of CaCO3 from a subtropical calcifying community due to seawater acidification: mesocosm-scale experimental evidence. Biogeosciences 6, 1811–1823. doi: 10.5194/bg-6-1811-2009
Andersson, A. J., Yeakel, K., Bates, N. R., and de Putron, S. (2014). Partial offsets in ocean acidification from changing coral reef biogeochemistry. Nat. Clim. Chang. 4, 56–61. doi: 10.1038/nclimate2050
Anthony, K., Kleypas, J. A., and Gattuso, J.–P. (2011). Coral reefs modify their seawater carbon chemistry – implications for impacts of ocean acidification, Glob. Change Biol. 17, 3655–3666. doi: 10.1111/j.1365-2486.2011.02510.x
Anthony, K. R. N., Kline, D. I., Diaz–Pulido, G., Dove, S., and Hoegh–Guldberg, O. (2008). Ocean acidification causes bleaching and productivity loss in coral reef builders, Proc. Natl. Acad. Sci. U.S.A. 105, 17442–17446. doi: 10.1073/pnas.0804478105
Atewerbehan, M., Feary, D. A., Keshavmurthy, S., Chen, A., Schleyer, M. H., and Sheppard, C. R. C. (2013). Climate change impacts on coral reefs: synergies with local effects, possibilities for acclimation, and management implications. Mar. Pollut. Bull. 74, 526–539. doi: 10.1016/j.marpolbul.2013.06.011
Atkinson, M. (2011). “Carbon fluxes in coral reefs,” in Encyclopedia of Modern Coral Reefs: Structure, Form and Process, ed D. Hopley (Dordrecht:Springer), 181–185.
Bach, L. T. (2015). Reconsidering the role of carbonate ion concentration in calcification by marine organisms. Biogeosciences 12, 4939–4951. doi: 10.5194/bg-12-4939-2015
Balzer, W., and Wefer, G. (1981). Dissolution of carbonate minerals in a subtropical shallow marine environment. Mar. Chem. 10, 545–588. doi: 10.1016/0304-4203(81)90007-4
Barnes, D. J., and Lazar, B. (1987). Metabolic performance of a shallow reef patch near Eilat on the Red Sea. J. Exp. Mar. Biol. Ecol. 174, 1–13. doi: 10.1016/0022-0981(93)90248-M
Bates, N. R. (2001). Interannual variability of oceanic CO2 and biogeochemical properties in the Western North Atlantic subtropical gyre. Deep Sea Res. II 48, 1507–1528. doi: 10.1016/S0967-0645(00)00151-X
Bates, N. R. (2002). Seasonal variability of the effect of coral reefs on seawater CO2 and air–sea CO2 exchange. Limnol. Oceanogr. 47, 43–52. doi: 10.4319/lo.2002.47.1.0043
Bates, N. R. (2007). Interannual variability of the oceanic CO2 sink in the subtropical gyre of the North Atlantic Ocean over the last two decades. J. Geophys. Res. (Oceans) 112, C09013. doi: 10.1029/2006JC003759
Bates, N. R. (2012). Multi–decadal uptake of carbon dioxide into subtropical mode waters of the North Atlantic Ocean. Biogeosciences 9, 2649–2659. doi: 10.5194/bg-9-2649-2012
Bates, N. R., Amat, A., and Andersson, A. J. (2010). The interaction of carbonate chemistry and coral reef calcification: the carbonate chemistry coral reef ecosystem feedback (CREF) hypothesis. Biogeosciences 7, 2509–2530. doi: 10.5194/bg-7-2509-2010
Bates, N. R., Astor, Y. M., Church, M. J., Currie, K., Dore, J. E., Gonzalez–Davila, M., et al. (2014). Changing ocean chemistry: a time–series view of ocean uptake of anthropogenic CO2 and ocean acidification. Oceanography 27, 121–141. doi: 10.5670/oceanog.2014.16
Bates, N. R., Best, M. H., Neely, K., Garley, R., Dickson, A. G., and Johnson, R. J. (2012). Indicators of anthropogenic carbon dioxide uptake and ocean acidification in the North Atlantic Ocean. Biogeosciences 9, 2509–2522. doi: 10.5194/bg-9-2509-2012
Bates, N. R., Michaels, A. F., and Knap, A. H. (1996a). Seasonal and interannual variability of oceanic carbon dioxide species at the US JGOFS Bermuda Atlantic Time–series Study (BATS) site. Deep Sea Res. II 43, 347–383. Corrigendum: 43, 1435–1435.
Bates, N. R., Michaels, A. F., and Knap, A. H. (1996b). Alkalinity changes in the Sargasso Sea: geochemical evidence of calcification? Mar. Chem. 51, 347–358. doi: 10.1016/0304-4203(95)00068-2
Bates, N. R., and Peters, A. J. (2007). The contribution of atmospheric acid deposition to ocean acidification in the subtropical North Atlantic Ocean. Mar. Chem. 107, 547–558. doi: 10.1016/j.marchem.2007.08.002
Bates, N. R., Samuels, L., and Merlivat, L. (2001). Biogeochemical and physical factors influencing seawater fCO2 and air–sea CO2 exchange on the Bermuda coral reef. Limnol. Oceanogr. 46, 833–846. doi: 10.4319/lo.2001.46.4.0833
Beers, J. R., and Herman, S. S. (1969). The ecology of inshore plankton populations in Bermuda. Part 1. Seasonal variations in the hydrography and nutrient chemistry. Bull. Mar. Sci. 19, 253–278.
Berner, R. C. (1966). Chemical diagenesis of some modern carbonate sediments. Am. J. Sci. 264, 1–36. doi: 10.2475/ajs.264.1.1
Bijma, J., Pörtner, H.–O., Yesson, C., and Rogers, A. D. (2013). Climate change and the oceans – What does the future hold? Mar. Pollut. Bull. 74, 495–505. doi: 10.1016/j.marpolbul.2013.07.022
Borges, A. V., Alin, S. R., Chavez, F. P., Vlahos, P., Johnson, K. S., Holt, J. T., et al. (2010). “A global sea surface carbon observing system: inorganic and organic carbon dynamics in coastal oceans,” in Proceedings of OceanObs09: Sustained Ocean Observations and Information for Society, Vol. 2, eds J. Hall, D. E. Harrison, and D. Stammer (New York, NY: ESA Publications), 67–88.
Bozec, Y.–M., and Mumby, P. J. (2015). Synergistic impacts of global warming on the resilience of coral reefs. Phil. Trans. R. Soc. B 370:20130267. doi: 10.1098/rstb.2013.0267
Breitburg, D. L., Salisbury, J., Bernhard, J. M., Cai, W.-J., Dupont, S., Doney, S. C., et al. (2015). And on top of all that…Coping with ocean acidification in the midst of many stressors. Oceanography 28, 48–61. doi: 10.5670/oceanog.2015.31
Broecker, W. S., Li, Y. H., and Peng, T.-H. (1971). “Carbon dioxide – man's unseen artifact,” in Impingement of Man on the Oceans, ed D. W. Hood (New York, NY: John Wiley & Sons), 287–324.
Broecker, W. S., Takahashi, T., Simpson, H. J., and Peng, T.-H. (1979). Fate of fossil fuel carbon dioxide and the global carbon budget. Science 206, 409–418. doi: 10.1126/science.206.4417.409
Brown, F. (1978). “Mixing processes,” in The Bermuda Marine Environment, Vol. 2, eds J. A. Barnes and B. V. Bodungen (St. George's), 10–30.
Brown, F. (1980). The Nitrogen Cycle and Heat Budget of a Subtropical Lagoon, Devil's Hole, Harrington Sound, Bermuda: Implications for Nitrous Oxide Production and Consumption in Marine Environments. PhD Thesis, Northwestern University, Evanston, IL.
Brown, I. F. (1981). The Nitrogen Cycle and Heat Budget of a Subtropical Lagoon, Devils Hole, Harrington Sound, Bermuda: Implications for Nitrous Oxide Production and Consumption in Marine Environments. Ph.D thesis, Northwestern University.
Butler, J. N. (1978). Ionic Equilibrium: Solubility and pH Calculations. New York, NY: John Wiley and sons.
Caldeira, K., and Wickett, M. F. (2003). Anthropogenic carbon and ocean pH. Nature 425, 365. doi: 10.1038/425365a
Cantin, N. E., Cohen, A. L., Karnauskas, K. B., Tarrant, A. M., and McCorkle, D. C. (2010). Ocean warming slows coral growth in the central Red Sea. Science 329, 322–325. doi: 10.1126/science.1190182
Chan, N. C. S., and Connolly, S. R. (2013). Sensitivity of coral calcification to ocean acidification: a meta–analysis. Glob. Chang. Biol. 19, 282–290. doi: 10.1111/gcb.12011
Chisholm, J. R. M., and Gattuso, J.-P. (1991). Validation of the alkalinity anomaly technique for investigating calcification and photosynthesis in coral reef communities. Limnol. Oceanogr. 36, 1232–1239. doi: 10.4319/lo.1991.36.6.1232
Clargo, N. M., Salt, L. A., Thomas, H., and de Baar, H. J. W. (2015). Rapid increase of observed DIC and pCO2 in the surface waters of the North Sea in the 2001–2011 decade ascribed to climate change superimposed by biological processes. Mar. Chem. 177, 566–588. doi: 10.1016/j.marchem.2015.08.010
Comeau, S., Carpenter, R. C., Lantz, C. A., and Edmunds, P. J. (2015). Ocean acidification accelerates dissolution of experimental coral reef communities. Biogeosciences 12, 365–372. doi: 10.5194/bg-12-365-2015
Comeau, S., Edmunds, P. J., Lantz, C. A., and Carpenter, R. C. (2014c). Water flow modulates the response of coral reef communities to ocean acidification. Sci. Rep. 4:6681. doi: 10.1038/srep06681
Comeau, S., Edmunds, P. J., Spindel, N. B., and Carpenter, R. C. (2013). The responses of eight coral reef calcifiers to increasing partial pressure of CO2 do not exhibit a tipping point. Limnol. Oceanogr. 58, 388–398. doi: 10.4319/lo.2013.58.1.0388
Comeau, S., Edmunds, P. J., Spindel, N. B., and Carpenter, R. C. (2014a). Diel pCO2 oscillations modulate the response of the coral Acropora hyacinthus to ocean acidification. Mar. Ecol. Progr. Ser. 501, 99–111. doi: 10.3354/meps10690
Comeau, S., Edmunds, P. J., Spindel, N. B., and Carpenter, R. C. (2014b). Fast coral reef calcifiers are more sensitive to ocean acidification in short–term laboratory incubations. Limnol. Oceanogr. 59, 1081–1091. doi: 10.4319/lo.2014.59.3.1081
Cooper, T. F., De'Ath, G., Fabricius, K. E., and Lough, J. M. (2008). Declining coral calcification in massive Porites in two nearshore regions of the northern Great Barrier Reef. Glob. Change Biol. 14, 529–538. doi: 10.1111/j.1365-2486.2007.01520.x
Coull, B. C. (1969). Hydrographic control of meiobenthos in Bermuda. Limnol. Oceanogr. 14, 953–957. doi: 10.4319/lo.1969.14.6.0953
Courtney, T. A., Andersson, A. J., Bates, N. R., Collins, A., Cyronak, T., de Putron, S. J., et al. (2016). Comparing chemistry and census–based estimates of net ecosystem calcification on a rim reef in Bermuda. Front. Mar. Sci. 3:181. doi: 10.3389/fmars.2016.00181
Crook, E. D., Cohen, A. L., Rebolledo–Vieyra, M., Hernandez, L., and Paytan, A. (2013). Reduced calcification and lack of acclimatization by coral colonies growing in areas of persistent natural acidification. Proc. Natl. Acad. Sci. U.S.A. 110, 11044–11049. doi: 10.1073/pnas.1301589110
Crook, E. D., Potts, D., Rebolledo–Vieyra, M., Hernandez, L., and Paytan, A. (2011). Calcifying coral abundance near low pH springs: implications for future ocean acidification. Coral Reefs 31, 239–245. doi: 10.1007/s00338-011-0839-y
Cyronak, T., Santos, I. R., and Eyre, B. D. (2013a). Permeable coral reef sediment dissolution driven by elevated pCO2 and pore water advection. Geophys. Res. Lett. 40, 4876–4881. doi: 10.1002/grl.50948
Cyronak, T., Santos, I. R., McMahon, A., and Eyre, B. D. (2013b). Carbon cycling hysteresis in permeable carbonate sands over a diurnal cycle: implications for ocean acidification. Limnol. Oceanogr. 58, 131–143. doi: 10.4319/lo.2013.58.1.0131
Cyronak, T., Schulz, K. G., Santos, I. R., and Eyre, B. D. (2014). Enhanced acidification of global coral reefs driven by regional biogeochemical feedbacks. Geophys. Res. Lett. 41, 5538–5546. doi: 10.1002/2014GL060849
De'ath, G., Lough, J. M., and Fabricius, K. E. (2009). Declining coral calcification on the Great Barrier Reef. Science 323, 116–119. doi: 10.1126/science.1165283
de Putron, S. J., McCorkle, D. C., Cohen, A. L., and Dillon, A. B. (2011). The impact of seawater saturation state and bicarbonate ion concentration on calcification by new recruits of two Atlantic corals. Coral Reefs 30, 321–328. doi: 10.1007/s00338-010-0697-z
Dickson, A. G., Sabine, C. L., and Christian, J. R. (eds.). (2007). “Guide to best practices for ocean CO2 measurements,” in North Pacific Marine Science Organization, Vol. 3 (Sidney, BC: PICES Special Publication), 186.
Doney, S. C. (2006). The dangers of ocean acidification. Sci. Am. 294, 58–65. doi: 10.1038/scientificamerican0306-58
Doney, S. C., Fabry, V. J., Feely, R. A., and Kleypas, J. A. (2009). Ocean acidification: the other CO2 problem. Annu. Rev. Mar. Sci. 1, 169–192. doi: 10.1146/annurev.marine.010908.163834
Dore, J. E., Lukas, R., Sadler, D. W., Church, M. J., and Karl, D. M. (2009). Physical and biogeochemical modulation of ocean acidification in the central North Pacific. Proc. Natl. Acad. Sci. U.S.A. 106, 12235–12240. doi: 10.1073/pnas.0906044106
Dove, S. G., Kline, D. I., Pantos, O., Angly, F. E., Tyson, G. W., and Hoegh-Guldberg, O. (2013). Future reef decalcification under a business-as-usual CO2 emission scenario. Proc. Natl. Acad. Sci. U.S.A. 110, 15342–15347. doi: 10.1073/pnas.1302701110
Duarte, C. M., Fulweiler, R. W., Lovelock, C. E., Martinetto, P., Saunders, M. I., Pandolfi, J. M., et al. (2015). Reconsidering ocean calamities. Bioscience 65, 130–139. doi: 10.1093/biosci/biu198
Duarte, C. M., Hendriks, I. E., Moore, T. S., Olsen, Y. S., Steckbauer, A., Ramajo, L., et al. (2013). Is ocean acidification an open ocean syndrome? Understanding anthropogenic impacts on seawater pH. Estuar. Coasts 36, 221–236. doi: 10.1007/s12237-013-9594-3
Edmunds, P. J. (2007). Evidence for a decade-scale decline in the growth rates of juvenile scleractinian corals. Mar. Ecol. Prog. Ser. 341, 1–13. doi: 10.3354/meps341001
Edmunds, P. J. (2013). Decadal–scale changes in the community structure of coral reefs of St. John, US Virgin Islands. Mar. Ecol. Progr. Ser. 489, 107–123. doi: 10.3354/meps10424
Edmunds, P. J., Brown, D., and Moriarty, V. (2012). Interactive effects of ocean acidification and temperature on two scleractinian corals from Moorea, French Polynesia. Glob. Chang. Biol. 18, 2173–2183. doi: 10.1111/j.1365-2486.2012.02695.x
Enochs, I. C., Manzello, D. P., Carlton, R. D., Graham, D. M., Ruzicka, R., and Colella, M. A. (2015). Ocean acidification enhances the bioerosion of a common coral reef sponge: implications for the persistence of the Florida Reef Tract. Bull. Mar. Sci. 91, 271–290. doi: 10.5343/bms.2014.1045
Erez, J., Reynaud, S., Silverman, J., Schneider, K., and Allemand, D. (2011). “Coral calcification under ocean acidification and global change,” in Coral Reefs: An Ecosystem in Transition, eds Z. Dubinsky and N. Stambler (Springer Science Business Media B.V.), 151–176. doi: 10.1007/978-94-007-0114-4_10
Evenhuis, C., Lenton, A., Cantin, N. E., and Lough, J. M. (2015). Modelling coral calcification accounting for the impacts of coral bleaching and ocean acidification. Biogeosciences 12, 2607–2630. doi: 10.5194/bg-12-2607-2015
Eyre, B., Andersson, A. J., and Cyronak, T. (2014). Benthic coral reef calcium carbonate dissolution in an acidifying ocean. Nat. Clim. Chang. 4, 969–976. doi: 10.1038/nclimate2380
Fabricius, K. E., De'ath, G., Noonan, S., and Uthicke, S. (2014). Ecological effects of ocean acidification and habitat complexity on reef associated macro invertebrate communities. Proc. R. Soc. B Bio. Sci. 281:20132479. doi: 10.1098/rspb.2013.2479
Fabry, V. J., Seibel, B. A., Feely, R. A., and Orr, J. C. (2008). Impacts of ocean acidification on marine fauna and ecosystem processes. ICES J. Mar. Sci. 65, 414–432. doi: 10.1093/icesjms/fsn048
Falter, J. L., Lowe, R. J., Atkinson, M. J., and Cuet, P. (2012). Seasonal coupling and de-coupling of net calcification rates from coral reef metabolism and carbonate chemistry at Ningaloo Reef, Western Australia. J. Geophys. Res. 117, C05003. doi: 10.1029/2011JC007268
Falter, J. L., Lowe, R. J., Zhang, Z., and McCulloch, M. (2013). Physical and biological controls on the carbonate chemistry of coral reef waters: effects of metabolism, wave forcing, sea level, and geomorphology. PLoS ONE 8:e53303. doi: 10.1371/journal.pone.0053303
Falter, J. L., and Sansone, F. J. (2000). Shallow pore water sampling in reef sediments. Coral Reefs 19, 93–97. doi: 10.1007/s003380050233
Gattuso, J.-P., Allemand, P. D., and Frankignoulle, M. (1999). Interactions between the carbon and carbonate cycles at organism and community levels on coral reefs: a review of processes and control by carbonate chemistry. Am. Zool. 39, 160–188, 1999. doi: 10.1093/icb/39.1.160
Gattuso, J.–P., Frankignoulle, M., Bourge, I., Romaine, S., and Buddemeier, R. W. (1998). Effect of calcium carbonate saturation of seawater on coral calcification. Glob. Planet. Change 18, 37–46. doi: 10.1016/S0921-8181(98)00035-6
Gattuso, J.–P., Pichon, M., Delesalle, B., Canon, C., and Frankignoulle, M. (1996). Carbon fluxes in coral reefs. I. Lagrangian measurement of community metabolism and resulting air–sea CO2 disequilibrium. Mar. Ecol. Progr. Ser. 145, 109–121. doi: 10.3354/meps145109
Gattuso, J.-P., Pichon, M., Delesalle, B., and Frankignoulle, M. (1993). Community metabolism and air–sea CO2 fluxes in a coral reef ecosystem (Moorea, French Polynesia). Mar. Ecol. Prog. Ser. 96, 259–267. doi: 10.3354/meps096259
Gaylord, B., Kroeker, K. J., Sunday, J. M., Anderson, K. M., Barry, J. P., Brown, N. E., et al. (2015). Ocean acidification through the lens of ecological theory. Ecology 96, 3–15. doi: 10.1890/14-0802.1
Goodkin, N. F., Wang, B.-S., You, C.-F., Hughen, K. A., Grumet–Prouty, N., Bates, N. R., et al. (2015). Ocean circulation and biogeochemistry moderate interannual and decadal surface water pH changes in the Sargasso Sea. Geophys. Res. Lett. 42, 4931–4939. doi: 10.1002/2015GL064431
Gray, S. E. C., DeGrandpre, M. D., Langdon, C., and Corredor, J. E. (2012). Short-term and seasonal pH, pCO2 and saturation state variability in a coral–reef ecosystem. Glob. Biogeochem. Cycles 26, GB3012. doi: 10.1029/2011GB004114
Harris, K. E., DeGrandpre, M., and Hales, B. (2013). Aragonite saturation state dynamics in a coastal upwelling zone. Geophys. Res. Lett. 40, 2720–2725. doi: 10.1002/grl.50460
Hauri, C., Gruber, N., Vogt, M., Doney, S. C., Feely, R. A., Lachkar, Z., et al. (2013). Spatiotemporal variability and long–term trends of ocean acidification in the California Current system. Biogeosciences 10, 193–216. doi: 10.5194/bg-10-193-2013
Hendricks, I. E., Duarte, C. M., Olsen, Y. S., Steckbauer, A., Ramajo, L., Moore, T. S., et al. (2015). Biological mechanisms supporting adaptation to ocean acidification in coastal ecosystems. Estuar. Coast. Shelf Sci. 152, A1–A8. doi: 10.1016/j.ecss.2014.07.019
Henson, S. A. (2014). Slow science: the value of long ocean biogeochemistry records. Philos. Trans. R. Soc. A 372:20130334. doi: 10.1098/rsta.2013.0334
Henson, S. A., Beaulieu, C., and Lampitt, R. (2016). Observing climate change trends in ocean biogeochemistry: when and where. Glob. Chang. Biol. 22, 1561–1571. doi: 10.1111/gcb.13152
Hines, M. E., and Lyons, W. B. (1982). Biogeochemistry of nearshore Bermuda sediments. I. Sulphate reduction rates and nutrient regeneration. Mar. Ecol. Progr. Ser. 8, 87–94. doi: 10.3354/meps008087
Hoegh–Guldberg, O. (1999). Climate change, coral bleaching and the future of the world's coral reefs. Mar. Freshw. Res. 50, 839−866 doi: 10.1071/mf99078
Hoegh–Guldberg, O., Mumby, P. J., Hooten, A. J., Steneck, R. S., Greenfield, P., Gomez, E., et al. (2007). Coral reefs under rapid climate change and ocean acidification. Science 318, 1737–1742. doi: 10.1126/science.1152509
Hughes, T. P. (1994). Catastrophes, phase shifts, and large-scale degradation of a Caribbean coral reef. Science 271, 1298–1299. doi: 10.1126/science.265.5178.1547
Hughes, T. P., Linares, C., Dakos, V., van de Leemput, I. A., and van Nes, E. H. (2013). Living dangerously on borrowed time during slow, unrecognized regime shifts. Trends Evol. Ecol. 29, 149–155. doi: 10.1016/j.tree.2012.08.022
Inoue, S., Kayanne, H., Yamamoto, S., and Kurihara, H. (2013). Spatial community shift from hard to soft corals in acidified water. Nat. Clim. Chang. 3, 683–687. doi: 10.1038/nclimate1855
Jickells, T. D., and Knap, A. H. (1984). The distribution and geochemistry of some trace metals in the Bermuda marine environment. Estuar. Coast. Shelf Seas 18, 245–262. doi: 10.1016/0272-7714(84)90070-2
Johnson, Z. I., Wheeler, B. J., Blinebry, S. K., Carlson, C. A., Ward, C. S., and Hunt, D. E. (2013). Dramatic variability of the carbonate system at a temperate coastal ocean site (Beaufort, North Carolina, USA) is regulated by physical and biogeochemical processes on multiple timescales. PLoS ONE 8:e85117. doi: 10.1371/journal.pone.0085117
Jokiel, P. L. (2011a). Ocean acidification and control of reef coral calcification by boundary layer limitation of proton flux. Bull. Mar. Sci. 87, 639–657. doi: 10.5343/bms.2010.1107
Jokiel, P. L. (2011b). The reef coral two compartment proton flux model: a new approach relating tissue-level physiological processes to gross corallum morphology. J. Exp. Mar. Biol. Ecol. 409, 1–12. doi: 10.1016/j.jembe.2011.10.008
Jokiel, P. L. (2013). Coral reef calcification: carbonate, bicarbonate and proton flux under conditions of increasing ocean acidification. Proc. R. Soc. B 280:20130031. doi: 10.1098/rspb.2013.0031
Jokiel, P. L. (2016). Predicting the impact of ocean acidification on coral reefs: evaluating the assumptions involved. ICES J. Mar. Sci. 73, 550–557. doi: 10.1093/icesjms/fsv091
Jokiel, P. L., Jury, C. P., and Rodgers, K. S. (2014). Coral–algae metabolism and diurnal changes in the CO2-carbonate system of bulk seawater. Peer J. 2:e378. doi: 10.7717/peerj.378
Jokiel, P. L., Rodgers, K. S., Kuffner, I. B., Andersson, A. J., Cox, E. F., and Mackenzie, F. T. (2008). Ocean acidification and calcifying reef organisms: a mesocosm investigation. Coral Reefs 27, 473–483. doi: 10.1007/s00338-008-0380-9
Juranek, L. W., Feely, R. A., Peterson, W. T., Alin, S. R., Hales, B., Lee, K., et al. (2009). A novel method for determination of aragonite saturation state on the continental shelf of central Oregon using multi-parameter relationships with hydrographic data. Geophys. Res. Lett. 36, L24. doi: 10.1029/2009GL040778
Jury, C. P., Whitehead, R. F., and Szmant, A. M. (2010). Effects of variations in carbonate chemistry on the calcification rates of Madracis auretenra (D Madracis mirabilis sensu Wells, 1973): bicarbonate concentrations best predict calcification rates. Glob. Chang. Biol. 16, 1632–1644. doi: 10.1111/j.1365-2486.2009.02057.x
Keller, K. M., Joos, F., and Raible, C. C. (2014). Time of emergence of trends in ocean biogeochemistry. Biogeosciences 11, 3647–3659. doi: 10.5194/bg-11-3647-2014
Khatiwala, S., Tanhua, T., Mikaloff Fletcher, S., Gerber, M., Doney, S. C., Graven, H. D., et al. (2013). Global ocean storage of anthropogenic carbon. Biogeosciences 10, 2169–2191. doi: 10.5194/bg-10-2169-2013
Kinsey, D. W. (1978). Alkalinity changes and coral reef calcification. Limnol. Oceanogr. 23, 989–991. doi: 10.4319/lo.1978.23.5.0989
Kinsey, D. W. (1985). “Metabolism, calcification, and carbon production: system level studies,” in Proceedings of the 5th International Coral Reef Congress, Vol. 4 (Tahiti), 505–526.
Kleypas, J. A., Anthony, K. R. N., and Gattuso, J.–P. (2011). Coral reefs modify their seawater carbon chemistry–case study from a barrier reef (Moorea, French Polynesia). Glob. Chang. Biol. 17, 3667–3678. doi: 10.1111/j.1365-2486.2011.02530.x
Kleypas, J. A., Buddemeier, R. W., Archer, D., Gattuso, J.–P., Langdon, C., and Opdyke, B. N. (1999). Increased atmospheric carbon dioxide on coral reefs. Science 284, 118–120. doi: 10.1126/science.284.5411.118
Kline, D. I., Teneva, L., Hauri, C., Schneider, K., Miard, T., and Chai, A. (2015). Six month in situ high-resolution carbonate chemistry and temperature study on a coral reef flat reveals asynchronous pH and temperature anomalies. PLoS ONE 10:e0127648. doi: 10.1371/journal.pone.0127648
Knap, A. H., Michaels, A. F., Dow, R. L., Johnson, R. J., Gundersen, K., Sorensen, J. C., et al. (1994). BATS Methods Manual. Woods Hole, MA: U.S. JGOFS Planning and Coordination Office.
Koweek, D., Dunbar, R. B., Rogers, J. S., Williams, G. J., Price, N., Mucciarone, D., et al. (2015). Environmental and ecological controls of coral community metabolism on Palmyra Atoll. Coral Reefs 34, 339–351. doi: 10.1007/s00338-014-1217-3
Kroeker, K. J., Gambi, M. C., and Micheli, F. (2013b). Community dynamics and ecosystem simplification in a high–CO2 world. Proc. Natl. Acad. Sci. U.S.A. 110, 12721–12726. doi: 10.1073/pnas.1216464110
Kroeker, K. J., Kordas, R. L., Crim, R., Hendriks, I. E., Ramajo, L., Singh, G. S., et al. (2013c). Impacts of ocean acidification on marine organisms: quantifying sensitivities and interaction with warming. Glob. Chang. Biol. 19, 1884–1896. doi: 10.1111/gcb.12179
Kroeker, K. J., Kordas, R. L., Crim, R. N., and Singh, G. G. (2010). Meta–analysis reveals negative yet variable effects of ocean acidification on marine organisms. Ecol. Lett. 13, 1419−1434. doi: 10.1111/j.1461-0248.2010.01518.x
Kroeker, K. J., Micheli, F., and Gambi, M. C. (2013a). Ocean acidification causes ecosystem shifts via altered competitive interactions. Nat. Clim. Chang. 3, 156–159. doi: 10.1038/nclimate1680
Krumhardt, K. M., Lovenduski, N. S., Freeman, N. M., and Bates, N. R. (2016). Increasing coccolithophore abundance in the subtropical North Atlantic from 1994 to 2014. Biogeosciences 13, 1163–1177. doi: 10.5194/bg-13-1163-2016
Ku, H. H. (1966). Notes on the use of propagation of error formulas. J. Res. Natl. Bur. Stand. 70C, 263–273. doi: 10.6028/jres.070c.025
Langdon, C., and Atkinson, M. J. (2005). Effect of elevated pCO2 on photosynthesis and calcification of corals and interactions with seasonal change in temperature/irradiance and nutrient enrichment. J. Geophys. Res. 110, C09SC07. doi: 10.1029/2004JC002576
Langdon, C., Gattuso, J.-P., and Andersson, A. J. (2010). “Measurements of calcification and dissolution of benthic organisms and communities,” in Guide to Beast Practices in Ocean Acidification Research and Data Reporting, eds U. Riebesell, V. J. Fabry, L. Hansson, and J.-P. Gattuso (Brussels: Office for Official Publications of the European Communities), 155–174.
Langdon, C., Takahashi, T., Sweeney, C., Chipman, D., Goddard, J., Marubini, F., et al. (2000). Effect of calcium carbonate saturation state on the calcification rate of an experimental coral reef. Glob. Biogeochem. Cycles 14, 639–654. doi: 10.1029/1999GB001195
Lantz, C. A., Atkinson, M. J., Winn, C. W., and Kahng, S. E. (2014). Dissolved inorganic carbon and total alkalinity of a Hawaiian fringing reef: chemical techniques for monitoring the effects of ocean acidification on coral reefs. Coral Reefs 33, 105–115. doi: 10.1007/s00338-013-1082-5
Leinweber, A., and Gruber, N. (2013). Variability and trends of ocean acidification in the Southern California Current system: a time–series from Santa Monica Bay. J. Geophys. Res. 118, 3622–3633. doi: 10.1002/jgrc.20259
Lomas, M. W., Bates, N. R., Johnson, R. J., Knap, A. H., Steinberg, D. K., and Carlson, C. A. (2013). Two decades and counting: 23–years of sustained open ocean biogeochemical measurements in the Sargasso Sea. Deep Sea Res. II 93, 16–32. doi: 10.1016/j.dsr2.2013.01.008
Lomas, M. W., Steinberg, D. K., Dickey, T. D., Carlson, C. A., Nelson, N. B., Condon, R. H., et al. (2010). Increased ocean carbon export in the Sargasso Sea is countered by its enhanced mesopelagic attenuation. Biogeosciences 7, 57–70. doi: 10.5194/bg-7-57-2010
Lyons, W. B., Gaudette, H. E., and Hewitt, A. D. (1974). Dissolved organic matter in pore water of carbonate sediments from Bermuda. Geochim. Cosmochim. Acta 43, 433–437. doi: 10.1016/0016-7037(79)90209-6
Malone, T., Azzaro, M., Bode, A., Brown, E., Duce, R., Kamykowski, D., et al. (2016). “Primary Porduction, Cycling of Nutrients, Surface Layer and Phytoplankton,” in First Global Integrated Marine Assessment, Oceans and Law of the Sea (New York, NY: United Nations), 67.
Manzello, D. P. (2010). Coral growth with thermal stress and ocean acidification: lessons from the eastern tropical Pacific. Coral Reefs 29, 749–758. doi: 10.1007/s00338-010-0623-4
Muehllehner, N., Langdon, C., Venti, A., and Kadko, D. (2016). Dynamics of carbonate chemistry, production, and calcification of the Floria Reef Tract (2009-2010): Evidence for seasonal dissolution. Global Biogeochem. Cycles 30, 661–688, doi: 10.1002/2015GB005327
Morris, B., Barnes, J., Brown, F., and Markham, J. (1977). The Bermuda Marine Environment, Vol. 15. Hamilton: Bermuda Biological Station Special Publication.
Neumann, A. C. (1965). Processes of recent carbonate sedimentation in Harrington Sound, Bermuda. Bull. Mar. Sci. 15, 987–1035.
Ohde, S., and van Woesik, R. (1999). Carbon dioxide flux and metabolic processes of a coral reef, Okinawa. Bull. Mar. Sci. 65, 559–576.
Orr, J. C., Fabry, V. J., Aumont, O., Bopp, L., Doney, S. C., Feely, R. A., et al. (2005). Anthropogenic ocean acidification over the twenty-first century and its impacts on calcifying organisms. Nature 437, 681–686. doi: 10.1038/nature04095
Pandolfi, J. M., Connolly, S. R., Marshall, D. J., and Cohen, A. L. (2011). Projecting coral reef futures under global warming and ocean acidification. Science 333, 418–422. doi: 10.1126/science.1204794
Parsons, R. J., Nelson, C. E., Carlson, C. A., Denman, C. A., Andersson, A. J., Kledzik, A. L., et al. (2015). Marine bacterioplankton community turnover within seasonally hypoxic waters of a subtropical sound: Devil's Hole, Bermuda. Environ. Microbiol. 17, 3481–3499. doi: 10.1111/1462-2920.12445
Rao, A. M. F., Polerecky, L., Ionescu, D., Meysman, F. J. R., and de Beer, D. (2012). The influence of pore-water advection, benthic photosynthesis, and respiration on calcium carbonate dynamics in reef sands. Limnol. Oceanogr. 57, 809–825. doi: 10.4319/lo.2012.57.3.0809
Reid, P. C., Fischer, A., Lewis–Brown, E., Meredith, M., Sparrow, M., Andersson, A. J., et al. (2009). Impacts of the oceans on climate change. Adv. Mar. Biol. 56, 1–150. doi: 10.1016/S0065-2881(09)56001-4
Ries, J. B., Cohen, A. L., and McCorkle, D. C. (2009). Marine calcifiers exhibit mixed responses to CO2-induced ocean acidification. Geology 37, 1131–1134. doi: 10.1130/G30210A.1
Robbins, L. L., Hansen, M. E., Kleypas, J. A., and Meylan, S. C. (2010). CO2calc: A User-Friendly Seawater Carbon Calculator for Windows, Mac OS X, and iOS (iPhone). Report, US Geological Survey Open-File Report, 2010–1280. Available online at: http://pubs.usgs.gov/of/2010/1280
Rodolfo–Metalpa, R., Montagna, P., Aliani, S., Borghini, M., Canese, S., Hall-Spencer, J. M., et al. (2015). Calcification is not the Achilles' heel of cold-water corals in an acidifying ocean. Glob. Chang. Biol. 21, 2238–2248. doi: 10.1111/gcb.12867
Royal Society (2005). Ocean Acidification Due to Increasing Atmospheric Carbon Dioxide, the Clyvedon. Cardiff: Press, Ltd.
Sabine, C. L., Feely, R. A., Gruber, N., Key, R. M., Lee, K., Bullister, J. L., et al. (2004). The oceanic sink for anthropogenic CO2. Science 305, 367–371. doi: 10.1126/science.1097403
Santer, B. D., Mears, C., Doutriaux, C., Caldwell, P., Gleckler, P. J., Wigley, T. M. L., et al. (2011). Separating signal and noise in atmospheric temperature changes: the importance of timescale. J. Geophys. Res. Atmos. 116, D22105. doi: 10.1029/2011JD016263
Santos, I. R., Cook, P. L. M., Rogers, L., de Weys, J., and Eyre, B. D. (2012b). The “salt wedge pump”: convection-driven pore-water exchange as a source of dissolved organic and inorganic carbon and nitrogen to an estuary. Limnol. Oceanogr. 57, 1415–1426. doi: 10.4319/lo.2012.57.5.1415
Santos, I. R., Eyre, B. D., and Huettel, M. (2012a). The driving forces of porewater and groundwater flow in permeable coastal sediments: a review. Estuar. Coast. Shelf Sci. 98, 1–15. doi: 10.1016/j.ecss.2011.10.024
Santos, I. R., Glud, R. N., Maher, D., Erler, D., and Eyre, B. D. (2011). Diel coral reef acidification driven by porewater advection in permeable carbonate sands, Heron Island, Great Barrier Reef. Geophys. Res. Lett. 38, L03604. doi: 10.1029/2010GL046053
Sarma, V. V. S. S., Krishna, M. S., Paul, Y. S., and Murty, V. S. N. (2015). Observed changes in ocean acidity and carbon dioxide exchange in the coastal Bay of Bengal – A link to air pollution. Tellus 67, 24636. doi: 10.3402/tellusb.v67.24638
Schneider, K., and Erez, J. (2006). The effect of carbonate chemistry on calcification and photosynthesis in the hermatypic coral Acropora eurystom. Limnol. Oceanogr. 51, 1284–1293. doi: 10.4319/lo.2006.51.3.1284
Shamberger, K. E. F., Cohen, A. L., Golbuu, Y., McCorkle, D. C., Lentz, S. J., and Barkley, H. C. (2014). Diverse coral communities in naturally acidified waters of a Western Pacific reef. Geophys. Res. Lett. 41, 499–504. doi: 10.1002/2013gl058489
Shamberger, K. E. F., Feely, R. A., Sabine, C. L., Atkinson, M. J., DeCarlo, E. H., Mackenzie, F. T., et al. (2011). Calcification and organic production on a Hawaiian coral reef. Mar. Chem. 127, 64–75. doi: 10.1016/j.marchem.2011.08.003
Shaw, E. C., McNeil, B. I., and Tilbrook, B. (2012). Impacts of ocean acidification in naturally variable coral reef flat ecosystems. J. Geophys. Res. 117, C03038. doi: 10.1029/2011JC007655
Silverman, J., Kline, D. I., Johnson, L., Rivlin, T., Schneider, K., Erez, J., et al. (2012). Carbon turnover rates in the One Tree Island reef: a 40-year perspective. J. Geophys. Res. 117, G03023. doi: 10.1029/2012JG001974
Silverman, J., Lazar, B., Cao, L., Caldeira, K., and Erez, J. (2009). Coral reefs may start dissolving when atmospheric CO2 doubles. Geophys. Res. Lett. 36:L05606. doi: 10.1029/2008GL036282
Silverman, J., Lazar, B., and Erez, J. (2007). Effect of aragonite saturation, temperature, and nutrients on the community calcification rate of a coral reef. J. Geophys. Res. Oceans 112, C05004. doi: 10.1029/2006JC003770
Silverman, J., Schneider, K., Kline, D. I., Rivlin, T., Rivlin, A., Hamilton, S., et al. (2014). Community calcification in Lizard Island, Great Barrier Reef: a 33 year perspective. Geochim. Cosmochim. Acta 144, 72–81. doi: 10.1016/j.gca.2014.09.011
Smith, S. V., and Key, G. S. (1975). Carbon dioxide and metabolism in marine environments. Limnol. Oceanogr. 20, 493–495. doi: 10.4319/lo.1975.20.3.0493
Suzuki, A., and Kawahata, H. (2003). Carbon budget of coral reef systems: an overview of observations in fringing reefs, barrier reefs and atolls in the Indo-Pacific regions. Tellus B 55, 428–444. doi: 10.1034/j.1600-0889.2003.01442.x
Suzuki, A., Nakamori, T., and Kayanne, H. (1995). The mechanism of production enhancement in coral reef carbonate systems: model and empirical results. Sediment. Geol. 99, 259–280. doi: 10.1016/0037-0738(95)00048-D
Tanzil, J. T., Brown, B. E., Dunne, R. P., Lee, J. N., Kaandorp, J. A., and Todd, P. A. (2013). Regional decline in growth rates of massive Porites corals in Southeast Asia. Glob. Chang. Biol. 19, 3011–3023. doi: 10.1111/gcb.12279
Thomas, H., Prowe, A. E. F., van Heuven, S., Bozec, Y., de Baar, H. J. W., Schiettecatte, L.-S., et al. (2007). Rapid decline of the CO2 buffering capacity in the North Sea and implications for the North Atlantic Ocean. Glob. Biogeochem. Cycles 21, GB4001 doi: 10.1029/2006GB002825
Thorstenson, D. C., and Mackenzie, F. T. (1974). Time variability of pore water chemistry in carbonate sediments, Devil's Hole, Harrington Sound, Bermuda. Geochim. Cosmochim. Acta 38, 1–19. doi: 10.1016/0016-7037(74)90192-6
Tribollet, A., Godinot, C., Atkinson, M., and Langdon, C. (2009). Effects of elevated pCO2 on dissolution of coral carbonates by microbial euendoliths. Glob. Biogeochem. Cycles 23, GB3008. doi: 10.1029/2008GB003286
Turi, G., Lachkar, Z., Gruber, N., and Münnich, M. (2016). Climate modulation of recent trends in ocean acidification in the California Current system. Environ. Res. Lett. 11, 014007. doi: 10.1088/1748-9326/11/1/014007
Venn, A. A., Tambutté, E., Holcomb, M., Laurent, J., Allemand, D., and Tambutt,é, S. (2013). Impact of seawater acidification on pH at the tissue–skeleton interface and calcification in reef corals. Proc. Natl. Acad. Sci. U.S.A. 110, 1634–1639. doi: 10.1073/pnas.1216153110
Wanninkhof, R., Barbero, L., Byrne, R., Cai, W. J., Huang, W. J., Zhang, J. Z., et al. (2015). Ocean acidification along the Gulf Coast and East Coast of the USA. Cont. Shelf Res. 98, 54–71. doi: 10.1016/j.csr.2015.02.008
Wilkinson, C. (2000). Status of Coral Reefs of the World. Townsville, QLD: Australian Institute of Marine Science publication.
Wisshak, M., Schönberg, C. H. L., Form, A., and Freiwald, A. (2012). Ocean acidification accelerates reef bioerosion. PLoS ONE 7:e45124. doi: 10.1371/journal.pone.0045124
Wootton, J. T., Pfister, C. A., and Forester, J. D. (2008). Dynamic patterns and ecological impacts of declining ocean pH in a high-resolution multi-year dataset. Proc. Natl. Acad. Sci. U.S.A. 105, 18848–18853. doi: 10.1073/pnas.0810079105
Yamamoto, M., Kayanne, H., and Yamamuro, M. (2001). Characteristic of organic matter in lagoonal sediments from the Great Barrier Reef. Geochem. J. 35, 385–401. doi: 10.2343/geochemj.35.385
Yamamoto, S., Kayanne, H., Tokoro, T., Kuwae, T., and Watanabe, A. (2015). Total alkalinity flux in coral reefs estimated from eddy covariance and sediment pore–water profiles. Limnol. Oceanogr. 60, 229–241. doi: 10.1002/lno.10018
Yates, K. K., and Halley, R. B. (2006). concentration and pCO2 thresholds for calcification and dissolution on the Molokai reef flat, Hawaii. Biogeosciences 3, 357–369. doi: 10.5194/bg-3-357-2006
Yeakel, K., Andersson, A. J., Bates, N. R., Noyes, T., Collins, A., and Garley, R. (2015). Shifts in coral reef biogeochemistry and resulting ocean acidification linked to the North Atlantic Oscillation. Proc. Natl. Acad. Sci. U.S.A. 112, 14512–14517. doi: 10.1073/pnas.1507021112
Young, I. R., Zieger, S., and Babanin, A. V., (2011). Global trends in wind speed and wave height. Science 332, 451–455. doi: 10.1126/science.1197219
Keywords: coastal seas, coral reef, net ecosystem calcification, net ecosystem production, biogeochemistry
Citation: Bates NR (2017) Twenty Years of Marine Carbon Cycle Observations at Devils Hole Bermuda Provide Insights into Seasonal Hypoxia, Coral Reef Calcification, and Ocean Acidification. Front. Mar. Sci. 4:36. doi: 10.3389/fmars.2017.00036
Received: 02 September 2016; Accepted: 27 January 2017;
Published: 14 February 2017.
Edited by:
Marta Álvarez, Instituto Español de Oceanografía, SpainReviewed by:
Mariana Ribas Ribas, University of Oldenburg, GermanyMichele Giani, Istituto Nazionale di Oceanografia e di Geofisica Sperimentale, Italy
Copyright © 2017 Bates. This is an open-access article distributed under the terms of the Creative Commons Attribution License (CC BY). The use, distribution or reproduction in other forums is permitted, provided the original author(s) or licensor are credited and that the original publication in this journal is cited, in accordance with accepted academic practice. No use, distribution or reproduction is permitted which does not comply with these terms.
*Correspondence: Nicholas R. Bates, nick.bates@bios.edu