A Multiplatform Experiment to Unravel Meso- and Submesoscale Processes in an Intense Front (AlborEx)
 Ananda Pascual1*
  Simon Ruiz1
  Antonio Olita2
  Charles Troupin3
  Mariona Claret4,5
  Benjamin Casas1 Baptiste Mourre3 Pierre-Marie Poulain6
  Antonio Tovar-Sanchez7
  Arthur Capet8 Evan Mason1 John T. Allen3
  Amala Mahadevan9 Joaquín Tintoré1,3
- 1Instituto Mediterráneo de Estudios Avanzados, (CSIC-UIB), Esporles, Spain
- 2Institute for Coastal Marine Environment-National Research Council (IAMC-CNR) Oristano, Oristano, Italy
- 3Balearic Islands Coastal Observing and Forecasting System (SOCIB), Palma de Mallorca, Spain
- 4Joint Institute for the Study of the Atmosphere and Ocean, Seattle, WA, USA
- 5Department of Earth and Planetary Sciences, McGill University, Montréal, QC, Canada
- 6OGS, Trieste, Italy
- 7Instituto de Ciencias Marinas de Andalucía, (ICMAN – CSIC), Puerto Real, Spain
- 8Modelling for Aquatic Systems (MAST), University of Liège, Liège, Belgium
- 9Woods Hole Oceanographic Institution, Woods Hole, MA, USA
The challenges associated with meso- and submesoscale variability (between 1 and 100 km) require high-resolution observations and integrated approaches. Here we describe a major oceanographic experiment designed to capture the intense but transient vertical motions in an area characterized by strong fronts. Finescale processes were studied in the eastern Alboran Sea (Western Mediterranean) about 400 km east of the Strait of Gibraltar, a relatively sparsely sampled area. In-situ systems were coordinated with satellite data and numerical simulations to provide a full description of the physical and biogeochemical variability. Hydrographic data confirmed the presence of an intense salinity front formed by the confluence of Atlantic Waters, entering from Gibraltar, with the local Mediterranean waters. The drifters coherently followed the northeastern limb of an anticyclonic gyre. Near real time data from acoustic current meter data profiler showed consistent patterns with currents of up to 1 m/s in the southern part of the sampled domain. High-resolution glider data revealed submesoscale structures with tongues of chlorophyll-a and oxygen associated with the frontal zone. Numerical results show large vertical excursions of tracers that could explain the subducted tongues and filaments captured by ocean gliders. A unique aspect of AlborEx is the combination of high-resolution synoptic measurements of vessel-based measurements, autonomous sampling, remote sensing and modeling, enabling the evaluation of the underlying mechanisms responsible for the observed distributions and biogeochemical patchiness. The main findings point to the importance of fine-scale processes enhancing the vertical exchanges between the upper ocean and the ocean interior.
Introduction
Meso- and submesoscale features play a major role in the redistribution of properties such as heat, salt, and biogeochemical tracers, with a significant impact on the ocean's primary productivity. The dynamics associated with these features result in enhanced vertical velocities that may locally generate mixing or enforce stratification on time scales that range from a few days to several months and from a few km to 100 km (Mahadevan, 2016; McWilliams, 2016). Vertical motions drive the exchange of properties between the surface and the ocean interior (Klein and Lapeyre, 2009) by, for instance, bringing nutrients to the surface ocean, and thereby fuelling phytoplankton production and growth and/or permitting the downward export of organic matter, and thus increasing the export of carbon. Modeling studies of frontal regions suggest that vertical exchange is enhanced at density fronts (Lévy et al., 2001; Lapeyre and Klein, 2006; Mahadevan and Tandon, 2006; Capet et al., 2008; Omand et al., 2015).
A key problem that has to be overcome when trying to obtain accurate estimates of the vertical exchange from in-situ observations is related to the difficulty in collecting high-resolution, synoptic data (Allen et al., 2001; Gomis et al., 2005). Observing the associated fluxes of water properties has been notoriously difficult. The problem is that while the dominant mechanisms occur at small spatial and temporal scales, typically 1–10 km and a few days or less, respectively, they induce a net transport over large spatial scales such as those of an ocean basin. To account for the net impact of these mechanisms we need to observe and quantify them in-situ, and integrate them with satellite imagery and model simulations obtained using combinations of one- or two-way nesting (Penven et al., 2006; Mason et al., 2010) or adaptive resolution models.
Observationally, the mesoscale has received much attention, whereas the submesoscale has previously been difficult to resolve in situ. Satellite color imagery is relevant for biogeochemistry, and has been used to sample submesoscale features. In fact, La Violette (1984) reported submesoscale filaments (10–20 km) in the Western Mediterranean (WM) using Coastal Zone Color Scanner (CZCS) data. The drawback with ocean color is cloud masking and the obvious restriction to the ocean surface. The latter is particularly restrictive in the Mediterranean, where Macías et al. (2014) report that the deep Chlorophyll-a (Chl-a, hereinafter) maximum is found between 30 and 120 m. Satellite altimetry has revolutionized our view and understanding of surface ocean mesoscale circulation during the last two decades (e.g., Le Traon, 2013) leading to major breakthroughs such as, for example, eddy kinetic energy (EKE, hereinafter) quantification (Pascual et al., 2006), mesoscale eddy identification, and tracking (e.g., Isern-Fontanet et al., 2003; Mason et al., 2014), and the estimation of vertical velocities through the quasi-geostrophic approximation (Tintoré et al., 1991; Ruiz et al., 2009; Pascual et al., 2015). However, the ocean is a complex system with multiple processes interacting at a wide range of temporal and spatial scales. Contemporary altimetric fields still lack sufficient resolution to cover scales shorter than 200 km (Chelton et al., 2011) that correspond to ubiquitous mesoscale and submesoscale features (fronts, meanders, eddies, filaments, and gyres).
In anticipation of the high-resolution sea surface height fields that will be provided by the Surface Water and Ocean Topography satellite mission (SWOT; Fu and Ferrari, 2008), combining cutting-edge and well established observational techniques is crucial to observe the submesoscale and quantify its importance. In situ observing systems, when combined with satellite data and advanced numerical simulations can provide a full description of the physical and biogeochemical variability at the meso- and submesoscale (Bouffard et al., 2012; Pascual et al., 2013; Tintoré et al., 2013; Shcherbina et al., 2015; Troupin et al., 2015; Cotroneo et al., 2016; Onken et al., 2016; Krug et al., 2017; Morrow et al., 2017; Ohlmann et al., 2017).
Major global ocean systems such as the subtropical oligotrophic gyres of the Atlantic and Pacific are simply too large for the extrapolation of high-resolution observations. The chosen area of study in the southwestern Mediterranean Sea is a more manageable system. Further, the relevance of the Mediterranean Sea for the global ocean has long been documented (see Malanotte-Rizzoli et al., 2014, and references therein). First, the Mediterranean Sea has a direct impact on the Atlantic Ocean circulation due to the exchange through the Strait of Gibraltar and, subsequently, influencing the great ocean conveyor belt. Further, the Mediterranean Sea is a natural reduced-scale laboratory basin for the examination of processes of global importance; it is easily accessible for ocean monitoring due to its size and proximity to coastal observatories. Finally, intense mesoscale and submesoscale variability interacts with the sub-basin and basin scales. Three scales of motion are therefore overlaid, producing an amalgam of intricate processes that require high-resolution comprehensive observations in order to be fully understood.
This article describes the AlborEx major multi-disciplinary research experiment aimed at studying submesoscale dynamics and interactions at the mesoscale in the eastern Alboran Sea, an energetic sub-basin of the Mediterranean Sea relatively sparsely sampled. Previous studies, either based on in situ observations or numerical modeling, have mostly focused on the adjacent western area and shown that the Alboran Sea is characterized by sharp gradients that lead to the formation of the intense Western and Eastern Alborán Gyres (e.g., Allen et al., 2001; Rodríguez et al., 2001; Flexas et al., 2006; Oguz et al., 2014, 2016). Satellite altimetry has revealed that the highest levels of EKE in the entire Mediterranean Sea are found in this basin (Pujol and Larnicol, 2005; Pascual et al., 2007; Renault et al., 2012). It has also been demonstarted that the high kinetic energy increases primary production, and also negatively impacts the recruitment of anchovy (Ruiz et al., 2013). Transient fronts, such as the Almería-Orán front, separate recent Atlantic Water (AW) flowing into the Mediterranean Sea, and recirculating old AW that intrudes southwestward along the Spanish coast (Tintoré et al., 1991).
Further to the east at around 1°W, the area south of Cartagena located about 400 km east of the Strait of Gibraltar is a transitional region where very few studies have been carried out. To our knowledge, the first in-situ observations were collected by Ruiz et al. (2009) using an autonomous underwater glider. The cross-front section obtained by the glider showed filaments of Chl-a being subducted downward along sloping isopycnal surfaces at the strong front. Quasi-geostrophic vertical motions estimated from a combination of altimetry and glider observations were of the order ±1 m/day although higher velocities (up to ±20–25 m/day) can be assumed for smaller submesoscale structures embedded within the front. To better quantify this underestimate and to better understand frontal impacts on biogeochemistry, a complete 3D, high-resolution, and multidisciplinary data set is needed. This is the motivation of the AlborEx experiment presented in this study.
Here we provide an overview of the field experiment, complementary satellite data, and numerical simulations that lead to some preliminary findings. Further publications will provide more in depth analyses of this comprehensive, synoptic multidisciplinary process-oriented oceanographic experiment.
Methods
Field Experiment
The AlborEx multi-sensor experiment was carried out on board the SOCIB (Balearic Islands Coastal Observing and Forecasting System) coastal vessel between 25 and 31 May 2014 in the eastern Alboran Sea (Figure 1). In the following we present a description of the platforms used during the field experiment.
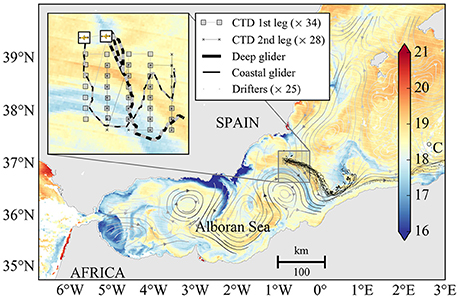
Figure 1. SST (MODIS-Aqua) for 29 May 2014 with CTD casts, glider and drifter tracks during AlborEx experiment. The gray lines correspond to streamlines computed from the Absolute Dynamic Topography from gridded altimeter fields (CMEMS-SLTAC).
CTD
Two high-resolution surveys covering an area of 40 × 40 km were sampled by the ship. The exact locations of the Conductivity-Temperature-Depth (CTD) stations were selected based on the presence of mesoscale and submesoscale features present in sea surface temperature data from remote sensing (see the next section). As stated above, synopticity is one of the major limitations of meso- submesoscale in situ experiments (Allen et al., 2001; Pascual et al., 2004; Gomis et al., 2005). Thus, with the aim of minimizing synopticity errors, each survey was completed very rapidly in only about 36 h. This implied also a trade-off between the area covered and resolution. The first CTD survey consisted of 34 casts distributed over 5 north/south legs, carried out between 26 and 27 May 2014. During survey 2, 28 casts were made between 29 and 30 May 2014 in almost the same positions as the CTDs from survey 1. The distance between CTD stations along the transects was 5 km, while between transects it was 10 km. The maximum depth reached in all the CTD casts was 600 m. Salinity samples were collected at different depths in one out of two stations. An additional sample at 350 m was collected at selected stations for salinity calibration. Hydrographic data were interpolated to 1 km resolution using an optimal interpolation scheme with a correlation length scale of 12 km. Structures larger than 20 km were filtered with a low-pass filter. Geostrophic velocity was computed from CTD data, using a reference level of 550 m depth, which is assumed as the level of no motion. This choice of reference level seems not to be very critical; previous authors have reported very small velocities (2–4 cm/s) at those depths (Gomis et al., 2001). For further details about the CTD data processing see the cruise report (Ruiz et al., 2015).
ADCP
Velocity profiles were recorded continuously using a 153 kHz Vessel Mounted-Acoustic Doppler Current Meter Profiler (VM-ADCP, RDI—Ocean Surveyor) with an accuracy of about 1 cm/s. The instrument was calibrated to correct the misalignment angle and scaling factor (see details in Ruiz et al., 2015). Unique profiles were collected every 2 min, which produce approximately 1 profile every 0.5 km. In the vertical, data were also averaged over 8 m depth bins. Velocity from the first bin (16 m depth) reached values near 1 m/s. At deeper levels, the quality of the ADCP data is usually low due to the weak intensity of the echo. The “percent-good” index represents the percentage of pings received with a noise-to-signal ratio below a defined threshold. During the AlborEx experiment, this index was high (>90%) in the upper 200 m, which gives confidence in the data quality. Surface temperature and salinity were measured continually during the cruise using a thermosalinograph, which also helped to detect the location of the front.
Nutrient Samples
Five-hundred samples were collected in triplicate from CTD Niskin bottles and immediately frozen for subsequent analysis in the laboratory. Samples were collected at each CTD station at the following depths: 5, 20, 40, 60, 90, 100, 120, 150 m. Concentrations of dissolved nutrients (Nitrate: and Phosphate: ) were determined with an autoanalyzer (Alliance Futura) using colorimetric techniques (Grasshoff et al, 1983). The accuracy of the analysis was established using Coastal Seawater Reference Material for Nutrients (MOOS-1, NRC-CNRC), resulting in recoveries of 95 and 100% for and , respectively.
Gliders
Autonomous underwater gliders have been demonstrated to be an important tool for process-oriented applications (Ruiz et al., 2012; Todd et al., 2013; Liblik et al., 2016; Rudnick, 2016). In the AlborEx experiment, two gliders (1 deep Slocum, 1 shallow Slocum) were deployed to sample the intense front. Glider profiles, extending to a depth of 200 m for the shallow unit and 500 m for the deep unit, provided temperature, salinity, oxygen and fluorescence at high vertical resolution. The sampling strategy was based on two parallel north-south transects of 50 km at a separation distance of 10 km. The coastal glider was configured to collect hydrographic and biogeochemical data at about 0.5 km intervals while the along track resolution of the deep glider was about 1 km. Due to the intense currents in the area, the gliders were advected eastwards and the sampling strategy was modified in real-time. The gliders performed several transects crossing the frontal zone along a saw-tooth trajectory (see Figure 1).
Drifters
Twenty-five surface drifters were deployed within the domain on the first day of the AlborEx experiment. These drifters were SVP designs with a drogue centered at 15 m depth. Surface currents derived from drifters can be used to study the temporal and spatial variability of fronts and filaments and, ideally, to detect convergence and divergence. In addition, drifter observations are useful for validation of altimetry, glider, models, and CTD derived geostrophic velocities. The deployment strategy addressed the goals to sample frontal areas and to detect convergence/divergence in the surface flow field. For this purpose, the drifters were deployed over an initial uniform array across the frontal areas and/or in convergence/divergence zones with drifter separation distance of 3 km, smaller than the major scale of variability. The exact positions of deployment were determined based on the frontal position determined from satellite imagery.
Argo Floats
Three profiling floats (Arvor-C, Arvor-A3, and Prov-bio) were deployed along the frontal zone (with a separation of a few kms) just after the deployment of the drifters. The Arvor-C was programmed with 3-h cycles down to 400 m. The Arvor-A3 was initially configured to have daily cycles. At the end of the campaign, it was left at sea and its cycle was changed to 5 days (MedArgo standard) using the Argos 3 telemetry downlink. Both the Arvor-C and Arvor-A3 measured temperature and conductivity (from which salinity is derived) in the water column. The Prov-bio float had synchronized initial daily cycles in order to sample near the local noontime. It was left at sea after the cruise and its cycle was changed to 5 days using the Iridium downlink. In addition to temperature and salinity, the Prov-bio measures dissolved oxygen, Chl-a concentration, colored dissolved organic matter, backscattering at 700 nm, downwelling irradiance at 380, 410, 490 nm, and photosynthetically active radiation (PAR).
Satellite Data
Sea surface temperature (SST), ocean color (OC) and sea surface height (SSH) from remote sensing provided a synoptic view of meso- and submesoscale activity at the study area, and helped to determine the positions of features of interest (meanders, eddies, and fronts) for sampling. Satellite data were essential for the design of the mission.
The SST images used in this study at 1-km spatial resolution correspond to Level-2 SST acquired by the Moderate-Resolution Imaging Spectroradiometer (MODIS) sensor onboard the Aqua and Terra satellites and were obtained from the Ocean Colour Level 1&2 server. The Ocean Colour data were processed from MODIS Level-2 single swaths.
Delayed time gridded altimeter products (sea level anomaly, SLA) specific for the Mediterranean Sea and delivered by the Copernicus Marine Service (CMEMS) were used to estimate surface currents in the area of study. During the AlborEx experiment, four altimeter missions were available (Jason-2, Cryosat-2, SARAL/AltiKa, HY-2) which together yield more accurate SLA (Pascual et al., 2006). A mean dynamic topography (Rio et al., 2014) was added to the SLA to obtain the absolute dynamic topography (ADT) and derive absolute geostrophic currents.
Numerical Models
New developments and integrated approaches using high-resolution autonomous, in-situ and remotely sensed observations can be usefully complemented by modeling and theoretical advances. In this study, a retrospective simulation was carried out using the hydrostatic Western Mediterranean sea Operational model (WMOP, Juza et al., 2016) at 2-km resolution over the cruise period using data assimilation. The aim was to simulate the small scale oceanic fields as realistically as possible so as to support the analysis and interpretation of the collected dataset. Additionally, a submesoscale-resolving Process Study Ocean Model, at higher resolution (0.5 km) than WMOP, was used to isolate the mechanisms of vertical transport at the front observed in the AlborEx multiplatform experiment.
WMOP Operational Model
The WMOP model is run operationally at SOCIB, producing a daily 72-h forecast of the ocean currents and eddies as well as surface and subsurface hydrographic properties over the Western Mediterranean Sea, covering both open ocean and coastal areas. The forecasting system comprises validation procedures based on the daily inter-comparison of model outputs against satellite and in-situ observations (http://www.socib.es/?section = modeling). A Local Ensemble Optimal Interpolation scheme has been implemented to assimilate AlborEx observations and satellite data into the model. The ensemble anomalies were sampled from three 5-year long simulations including modifications of the large-scale ocean model and internal model parameters. One single analysis was performed at 00:00 on 27 May, assimilating gridded SLA, satellite- derived interpolated SST (MUR-JPL), Argo temperature and salinity profiles over a 5-day window, and the dense AlborEx first-leg CTD data, which were considered to be synoptic over the 24-h sampling period.
Ocean Process Study Numerical Model
The Process Study Ocean Model (PSOM, https://github.com/PSOM) is a non-hydrostatic, free-surface numerical model (Mahadevan et al., 1996a,b) that has been used to investigate submesoscale processes (Mahadevan and Tandon, 2006; Mahadevan et al., 2010). Here, it is used to explain the dramatic vertical excursions of temperature, Chl-a, and oxygen captured by AlborEx gliders in the vicinity of the front between Atlantic and Mediterranean waters. Specific mechanisms that drive large vertical displacements of tracers at fronts include baroclinic instability, nonlinear Ekman pumping, and symmetric instability, amongst others (see Mahadevan and Tandon, 2006; McGillicuddy, 2016). Here, PSOM is used to test whether the vertical displacements of the tracers sampled during AlborEx are explained by baroclinically unstable frontal processes. The model is initialized with a geostrophic zonal flow in thermal wind balance with a density cross-front section from an AlborEx glider extended with WMOP output. In addition, a passive tracer that varies linearly with depth is used to examine vertical excursions. The simulation is run without atmospheric forcing and the flow remains inertially and symmetrically stable during the experiment.
Results
Oceanographic Context from Satellites
During the month preceding the AlborEx experiment, remote sensing observations were collected daily and proved to be essential for the design of the mission. SST images, sea surface altimetry and ocean color were closely screened and used to determine the positions of the two CTD surveys to be conducted during the experiment.
The circulation patterns depicted by surface altimetry in March 2014 (Figure 2) represent the typical circulation of the Alboran Sea with the presence of both the Western and Eastern Alboran Gyres (e.g., Renault et al., 2012). From April 2014, a large meander of the Algerian current was observed around 1.5° W, in a region highlighted by Escudier et al. (2016) as an important formation area for intense anticyclonic eddies evolving along the Algerian coast. At the beginning of May 2014, this flow instability had evolved to form a clear anticyclonic structure that was propagating eastward. On 19 May, a few days before the start of the field experiment, altimetric fields depicted maximum velocities larger than 50 cm/s at the eddy periphery.
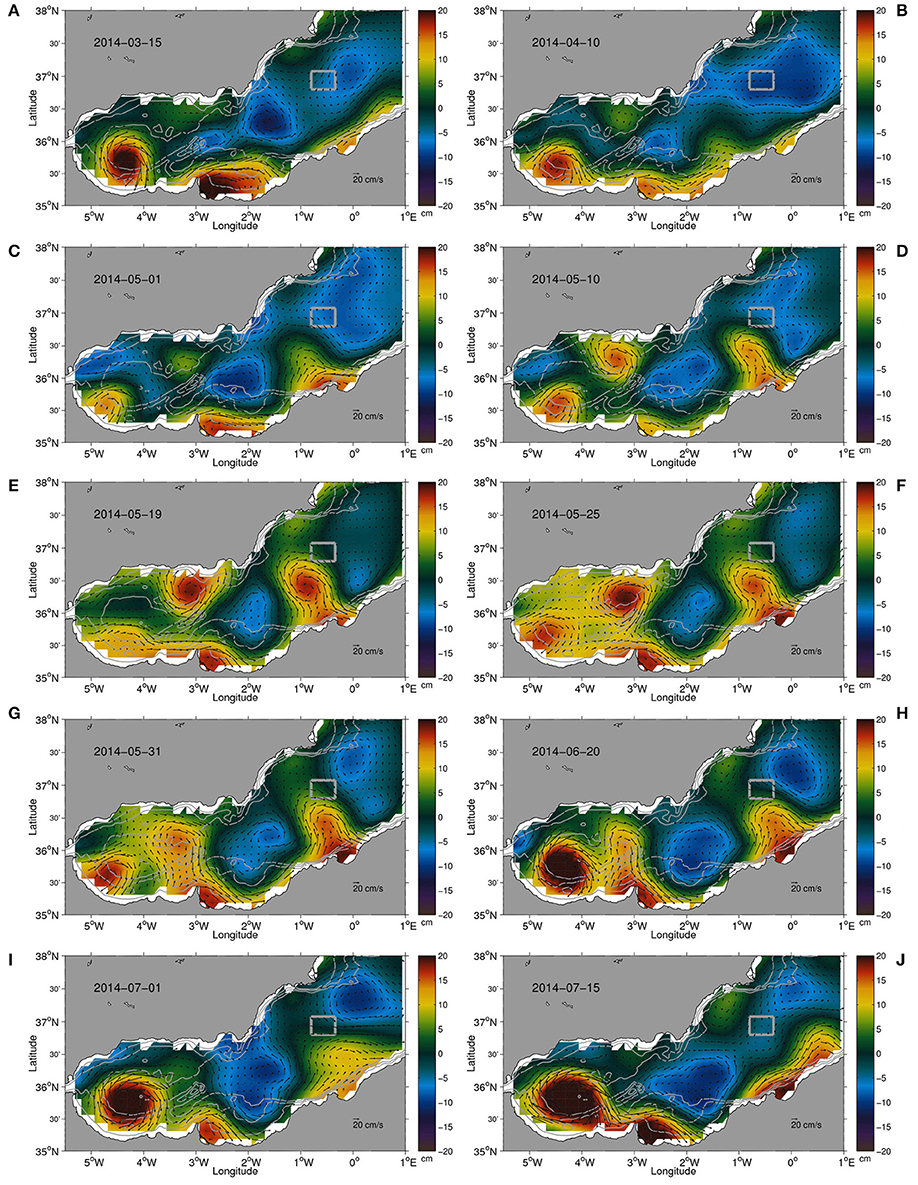
Figure 2. Absolute dynamic topography (cm) derived from satellite altimetry with associated geostrophic currents (cm/s) prior to (A–E), contemporaneous with (F,G) and after (H–J) the field experiment. The gray box corresponds to the boundaries of the domain sampled during the AlborEx experiment (CTD grid).
SST and ocean color images were used to track the evolution of the meso- and submesoscale structures, the latter not visible in altimetric fields due to their limited resolution. During the weeks before the experiment, the presence of the anticyclonic eddy and associated filaments was evident on the SST picture (Figure 3). A clear frontal zone between warm and cold waters was identified between 0° and 1° W.
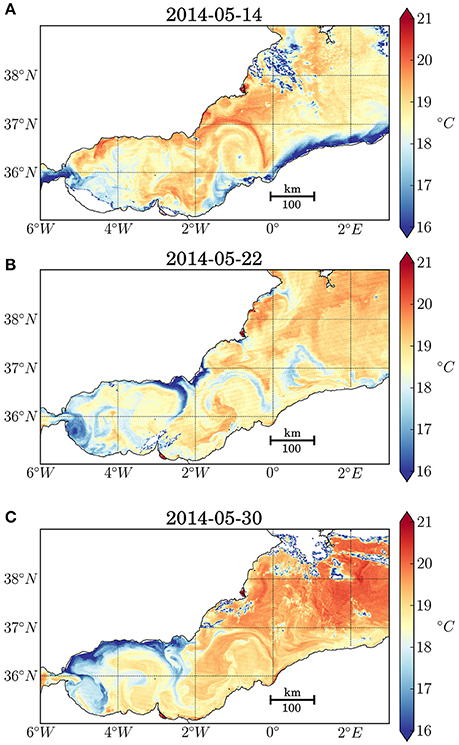
Figure 3. SST images prior to (A,B) and contemporaneous with (C) the field experiment.
On 25 May, the first day of the field experiment, altimetry locates the eddy center at 0.5°W, and indicates a slow eastward drift. During the week of the experiment, the SST fields confirmed the persistence of the anticyclonic eddy and the submesoscale filaments. An ocean color image corresponding to 29 May 2014 (Figure 4) reveals the frontal area in the northern margin of the anticyclone. At the same time a Chl-a filament detaching from the coast seems to feed into the eddy.
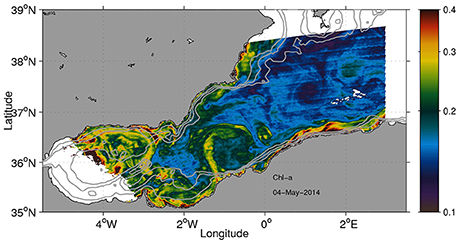
Figure 4. MODIS (L2) Chl-a image on May 4, 2014. Isobaths correspond to 200, 500, and 1000 m.
As altimetry shows (Figure 2), the eddy decayed in June and finally vanished in July.
Main Findings from in-situ Observations
Intense Salinity Front and Associated Velocities
The thermosalinograph measured differences in salinity of about 1.5 in <5 km (Figure 5). The northern part of the sampling area is characterized by salinity around 38.2 while below 37°N, salinity is around 37.5 or fresher. These strong gradients in salinity correspond to the confluence of recent Atlantic water (recent AW) entering from Gibraltar and the more saline resident Mediterranean Water, which is referred to here as old Atlantic Water (old AW). T-S diagrams from the CTD data (Figure 5) confirm the presence of both types of water, not only at the surface but also at deeper levels [note that with the aim of reducing time, the casts went down to only 600 m and, as a consequence, the presence of deep waters (Levantine Intermediate Water and Deep Mediterranean Water) is only partially detected]. Both recent and old AW can also be identified with data from survey 2, but with a higher degree of mixing in the upper layer with respect to survey 1 (not shown).
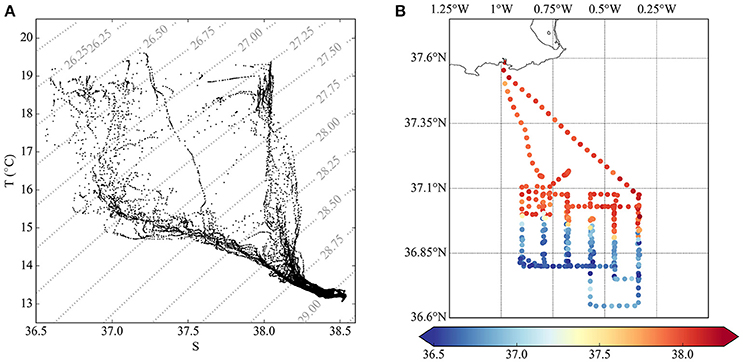
Figure 5. T-S diagrams from CTD stations (A) and salinity from thermosalinograph (B) from the first survey.
Gliders were also able to sample at high resolution along the frontal zone. Figure 6 shows the temperature, salinity and fluorescence data recorded by the coastal glider, revealing that the salinity front is present down to ~ 120 m depth. Additionally, subducting small-scale (<10 km width) filaments are observed in different parts of the sampled area.
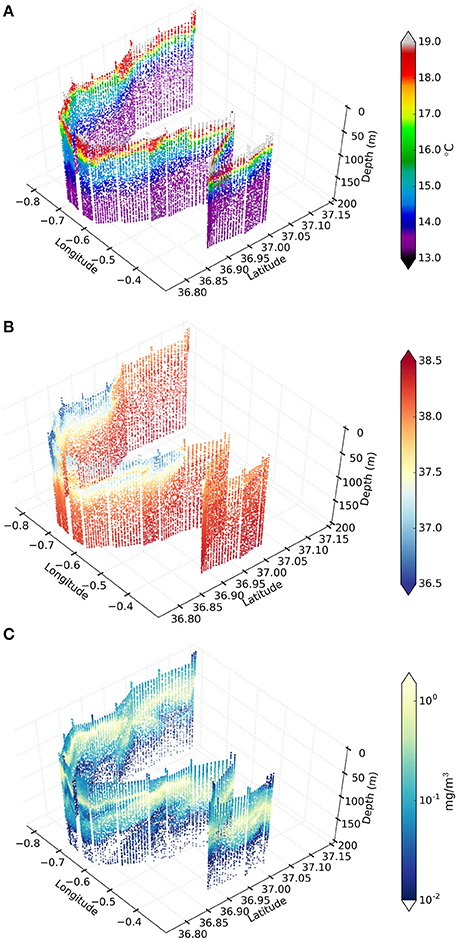
Figure 6. 3D views of potential temperature (A), salinity (B), and Chl-a (C) collected by the coastal glider.
Salinity fields obtained from an objective analysis applied to CTD casts at 50 m depth confirm the prominent salinity front (Figure 7). Comparison between hydrographic fields from surveys 1 and 2 reveals the rapid evolution of the frontal structure. It suffers a clear deformation on days 29 and 30 May, evolving with the anticyclonic structure and significantly modifying the salinity pattern observed during survey 1.
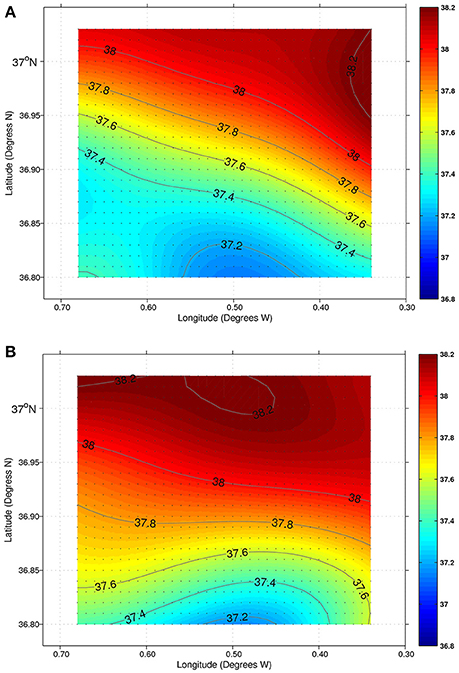
Figure 7. Salinity at 50 m depth from CTD survey 1 (A) and survey 2 (B).
Figure 8 shows geostrophic velocities derived from the CTD data at 50 m depth from surveys 1 and 2. The signature of an anticyclonic eddy is clearly identified. For the second survey the deformation of the front is visible and the magnitude of velocity field is higher in the southeastern part of the domain. The geostrophic fields are coherent in terms of the patterns in the velocities recorded by the vessel-mounted ADCP (Figure 9). It is however worth noting that the values of the geostrophic flow in the vicinity of the frontal zone at 50 m depth (order 40 cm/s) are smaller than those from the ADCP, which are about 50 cm/s. This is expected since the ADCP measures actual velocity, including all velocity components. Moreover, in the southern part of the domain, geostrophic and actual velocity patterns show some differences in the path of the flow. This needs to be investigated carefully; the initial hypothesis is that the actual flow includes a cyclostrophic acceleration, which also produces an additional deformation of the flow. This component has been evaluated in previous studies in the area to be approximately 20% (Gomis et al., 2001). Also, the velocities retrieved from the ADCP data are almost a factor 2 larger than the magnitude of derived surface currents from standard altimetric gridded fields. Further, altimetric fields failed to properly detect the extension of the front due to limited horizontal resolution (see Figure 2).
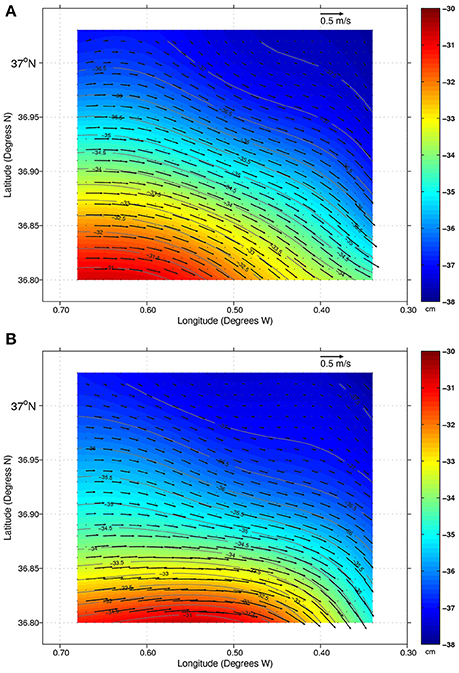
Figure 8. Dynamic height (cm, background color) and geostrophic velocity (cm/s, vectors) at 50 m depth from survey 1 (A) and survey 2 (B).
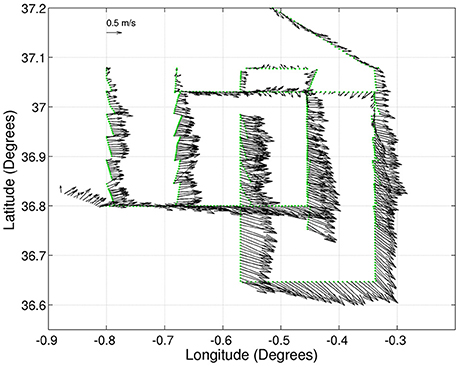
Figure 9. Velocity field from the ADCP at 16 m depth.
Figure 10 displays the trajectories of the drifters deployed during the AlborEx campaign from their initial positions on on 25 May 2014 (circles) until 14 July 2014 (asterisks). All drifters coherently followed the northeastern limb of the anticyclonic gyre associated with the frontal zone in good agreement with the geostrophic velocity and ADCP patterns described above. Maximum velocities reported by drifters reach values over 50 cm/s, which implies that in <2 days the drifters exited the CTD grid. Drifters deployed more to the south were quickly captured by the Algerian Current and transported along the Algerian coast, while the drifters deployed further to the north were deflected northward and split into two different paths: some moved eastward to trace another anticyclonic eddy, while others were advected northwestward.
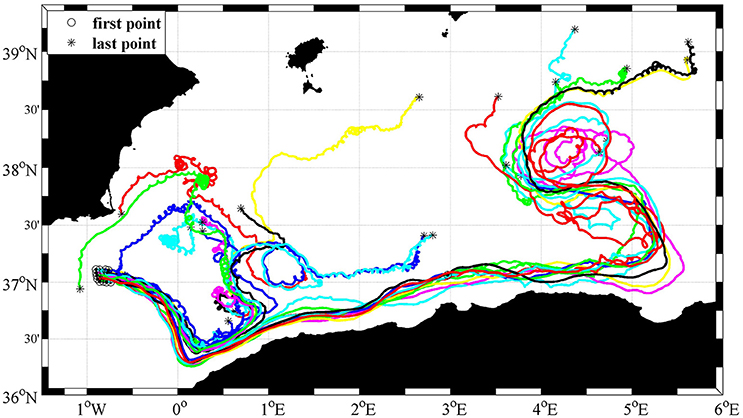
Figure 10. SVP drifter tracks between 25 May 2014 and 14 July 2014.
Subsurface Salinity Minimum
The trajectory of the Arvor-C is shown in Figure 11. It drifted initially to the southeast toward the African continent, and then joined the Algerian Current and moved rapidly along the coast in a northeastward direction to as far as 4°E. The float subsequently detached from the Algerian Current and moved generally northward under the influence of several mesoscale eddies. It finally reached the vicinity of the island of Menorca where it stopped operating in late August 2014.
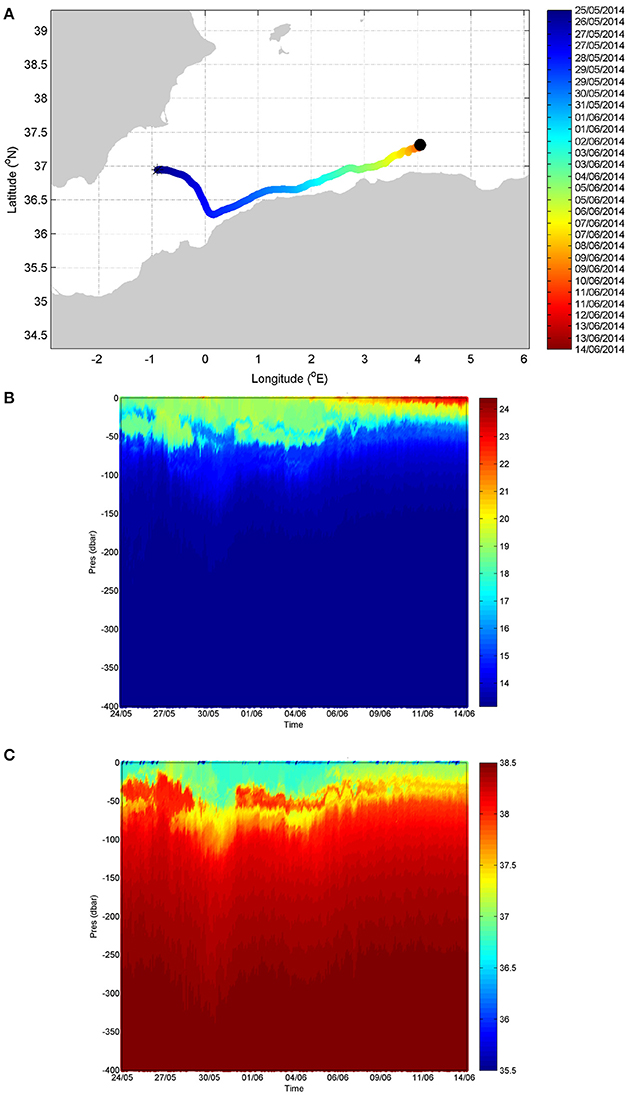
Figure 11. (A) Trajectory of the Arvor-C between deployment on 25/05/2014 (star symbol) and position on 14/06/2014 (black dot). Color coding is a function of time. Contour plots of potential temperature (B) and salinity (C) measured by the Arvor-C along its trajectory.
The Arvor-C performed more than 450 profiles between 400 m and the surface, at ~ 1.5 h intervals. The potential temperature and salinity data, plotted vs. depth and time, are also shown in Figure 11. The formation of the seasonal thermocline in late spring (mostly between 5 and 14 June) and the signature of the surface low-salinity water of Atlantic origin are evident. A secondary subsurface salinity minimum is also seen, in particular between 31 May and 10 June, at depths ranging from 50 to 100 m. Substantial high-frequency oscillations (with periods of the order of 1 day) occur between 5 and 8 June that correspond to internal waves with amplitudes of tens of meters. The occurrence of all these fine and high-frequency structures was captured in the high horizontal resolution and frequency Arvor-C data. This is the first time that this kind of measurements have been made in this area of the Algerian Current.
Evidence of Frontal Impacts on Biogeochemical Observations
Nutrient samples from the CTD surveys revealed large spatial variability associated with the frontal dynamics. concentrations ranged from 0.1 to 12.6 μM (Figure 12A). Concentrations of 2 μM contour (Figure 12A) are found at around 30 m depth on the fresher side of the front and at about 80 m on the Mediterranean side, evidencing the effect of mesoscale uplifting on the vertical nutrient distribution. Similarly, the horizontal phosphate distribution (Figure 12B) at selected depths reveals higher concentrations on the Atlantic side of the front.
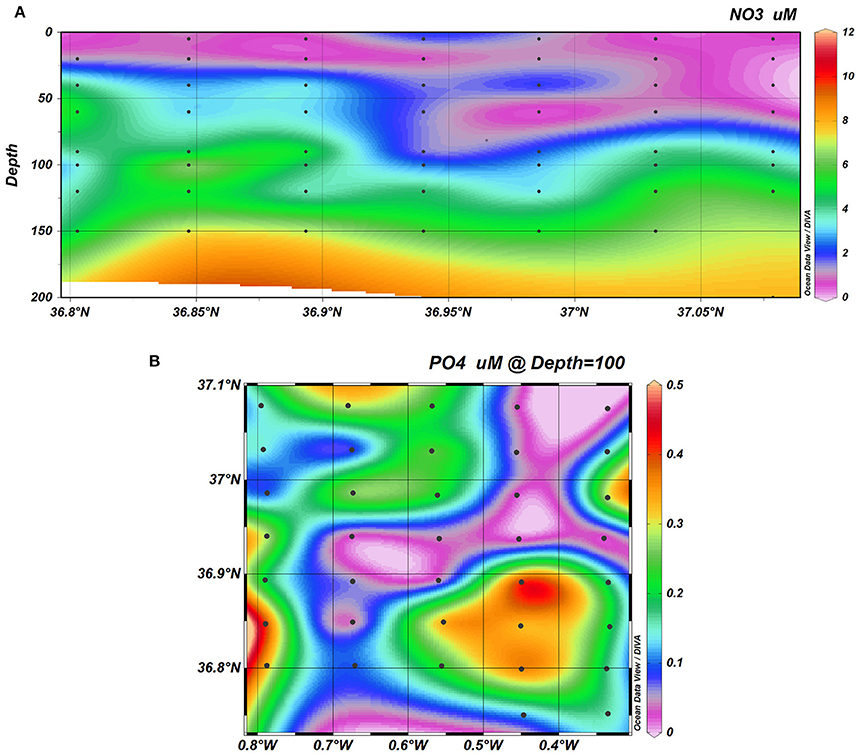
Figure 12. Vertical section of nitrates (A) and horizontal distribution of phosphates at 100 m (B).
At a finer scale, quasi-synoptic glider observations reveal submesoscale structures associated with the frontal zone, and variations in the depth of the deep Chl-a maximum (DCM) across the density front (see Figure 6C). The glider data resolution is suitable for investigation of the DCM response to mesoscale and submesoscale dynamics. Simultaneously, data from the profiling float equipped with PAR (Photosynthetic Active Radiation) sensors allowed the calibration of an empirical function to model instantaneous PAR profiles from within the glider temporal and spatial frame as a function of depth and Chl-a (Zielinski et al., 2002). A simplified version of the Morel and André (1991) bio-optical model was applied to assess instantaneous primary production rates (PP) along the glider path, similar to the methodology used by Hemsley et al. (2015) in the North Atlantic. A complete methodology and discussion of these results is presented in an ongoing study (Olita et al., in revision).
Depth resolved primary production revealed maxima on the fresher side of the front, where the upwelling signature is evident. Integrated estimates of PP based on glider observations show averages of ~ 1.3 g C m−2 d−1 along the entire glider path (with a large variance of 2.25 g C m−2 d−1), which is twice the largest value extrapolated from satellite products and four times larger than the most conservative satellite estimates (respectively, VGPM and CBPM algorithms, see http://www.science.oregonstate.edu/ocean.productivity/ for algorithm documentation). The reason for such an underestimation by the satellite PP algorithms in a highly dynamic event during stratified conditions (when most production occurs at the DCM, Macías et al., 2014) is that such algorithms rely on a Gaussian or uniform vertical distribution of the Chl-a over the water column in the upper mixed layer (a situation that is found only during the winter season, when the upper layers are fully mixed by winds). Such an assumption of the vertical distribution of Chl-a is required to deal with the inability of the satellite optical sensors to cover the full euphotic depth (that in the present case extends to between ~ 60 and ~ 80 meters depending on the incident light, turbidity and optical properties of the water column). Vertical displacement of the productive layers across the frontal area is further evidenced by the apparent oxygen utilization (AOU) section (Figure 13) which is in agreement with the observed nutrient distribution. The nitracline position is co-located with the position of the zero AOU contour, also concomitant with the “core” of the DCM. Production maxima are located in convergence areas, where the AOU vertical gradient (negative to positive, top to bottom) also appears to be maximum. A large AOU gradient, located across the zero value, implies stronger biological activity in terms of an augmented production/consumption ratio.

Figure 13. Section of AOU (umol/l) along a transect from the shallow glider, with superimposed instantaneous PP 0.1 and 0.3 (g C m−3 d−1) contours (black lines). The zero AOU contour is also drawn (red curve). The modulation of this isoline is evident, as also the modulation of production due to vertical displacements of the biomass patches.
Nutrient uplift toward the euphotic zone is the basic mechanism promoting high primary production. Finer details of this uplift and subduction on the other side of the front are given in the next section on the modeling results and, in more detail, in an ongoing study (Ruiz et al., submitted).
Main Findings from Numerical Models
Figure 14 illustrates the impact of assimilated data (as described in Section WMOP Operational Model) along a vertical salinity section in WMOP that is coincident with glider measurements. The assimilation of CTD data collected during the first leg allows reconstructing the intense salinity gradients in the model with a very good agreement with independent observations from the shallow water glider that crossed the front. In the reduced portion of the section observed by the glider between 36.85 and 37.15°C North (portion displayed in Figures 14A,B), the position, shape and magnitude of the frontal structure are all much more realistic after data assimilation. Moreover, the assimilation of complementary satellite SST and SSH observations as well as Argo profiles allows to constrain the rest of the domain, leading to the representation of a dynamically consistent salinity field, in particular providing a full 3-dimensional structure of the front. The model is then able to restart from this improved initial state to predict its evolution. The evaluation of the forecasting skill of the model after data assimilation is presently object of further research (Mourre et al., in preparation).
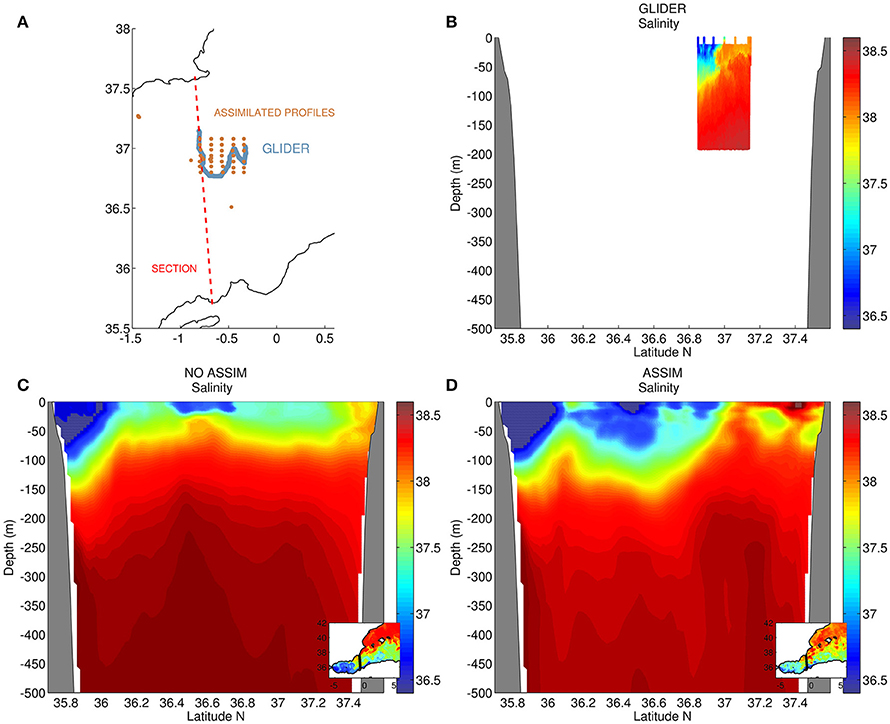
Figure 14. (A) Position of the vertical section together with assimilated profiles and glider trajectory; Vertical section of: (B) glider salinity data; (C) WMOP model salinity without data assimilation and with data assimilation (D).
Complementary high-resolution numerical simulations show that the reconstruction of sharp salinity gradients in this region is crucial to understanding the frontally-driven dynamics of the upper ocean. The Process Study Ocean Model demonstrates that the lateral density gradients sampled during AlborEx result in a baroclinically unstable flow that gives rise to submesoscale instability and frontogenesis. This causes vertical displacements (of about 50 m) in the tracer, particularly for tracer initially located at a depth of 40 m, and fine-scale features in temperature and salinity over horizontal distances of about 10 km (Figures 15A,B) that are in qualitative agreement with glider observations. The vertically displaced tracer is rapidly advected downstream in the form of sharp filaments (Figure 15C). We conclude that submesoscale frontal processes are the cause of the large vertical excursions of biogeochemical tracers observed during the AlborEx experiment.
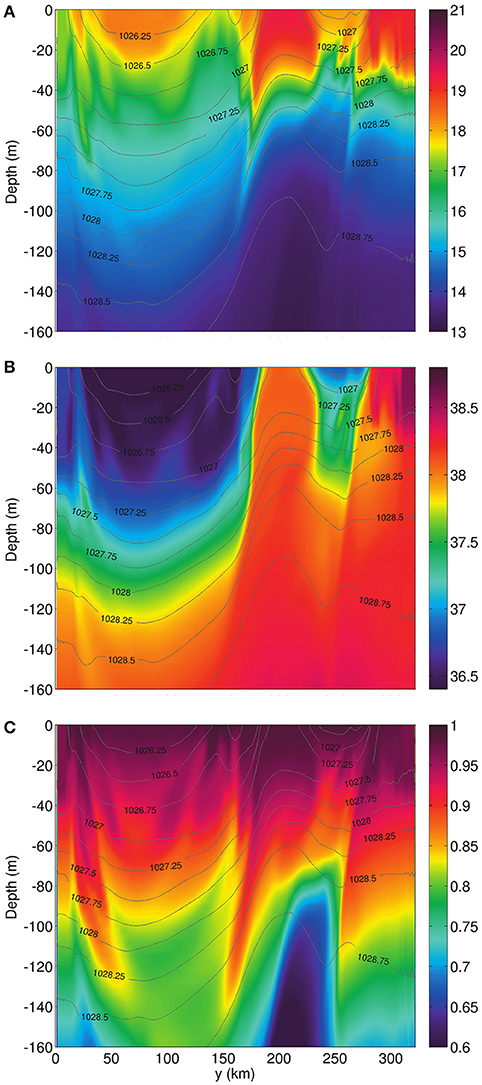
Figure 15. Cross-front sections of modeled potential temperature in °C (A), salinity (B), and a passive tracer (C) that is initialized constant on horizontal levels. Output is from the submesoscale-resolving PSOM simulation 25 days after the front becomes baroclinically unstable. Density contours are overlaid.
Discussion
In this work we have presented a general overview of the intensive AlborEx multi-sensor experiment carried out in May 2014 in the eastern Alboran Sea. This unique process-oriented experiment in the Western Mediterranean aimed at studying meso- and submesoscale dynamics in an area characterized by a strong density front. In situ systems, including gliders, drifters and Argo floats were combined with satellite data and model simulations to provide a full description of the physical and biogeochemical variability. Two high-resolution grids covering an area of 40 × 40 km were sampled by the ship. At each station, one CTD cast and water samples for Chl-a and nutrient analyses were collected. Additional ADCP data were recorded in continuous mode.
The ongoing analysis of the data collected by AlborEx has proved that the Alboran Sea is indeed an ideal test site for studying 3D meso- and submesoscale processes, with intense fronts that impact biogeochemistry. A unique aspect of AlborEx is the comprehensive synergy of high-resolution synoptic measurements, remote sensing and modeling in an area relatively low sampled by previous works. AlborEx is also an example of the new integrated and quasi real time approach to ocean observation that is made possible by joint and collaborative efforts of scientists and technicians from diverse international institutions.
Work in progress using the Process Study Ocean Model aimed to resolve vertical transport at the front will provide new insight into the potential mechanisms governing upward/downward motions in frontal zones. Quasi-geostrophic theory can partially explain vertical exchanges at the mesoscale, however at smaller scales (submesoscale) with Rossby numbers of order of magnitude one, other mechanisms such as frontogenesis may play an important role on the distribution of the DCM in an intense frontal zone (Olita et al., in revision; Ruiz et al., submitted).
In subtropical regions where winter overturning is not strong enough to significantly reverse a permanent oligotrophic state, “extraordinary mid-ocean plankton blooms” (McGillicuddy et al., 2007) are supported by smaller scale processes that re-fertilize the photic surface layers. This has generated considerable debate (Lévy et al., 2001; Oschlies, 2002; McGillicuddy et al., 2003; Allen et al., 2005; Mahadevan et al., 2008) over which smaller scale physical processes provide the “missing flux.” In particular, there has been much discussion over whether processes at the mesoscale (<100 km, e.g., eddy-pumping) or submesoscale (<10 km, e.g., filamentary upwelling) dominate. Theoretical calculations and advanced modeling suggest that submesoscale processes are key (Lévy et al., 2001; Lapeyre and Klein, 2006; Ramachandran et al., 2014; Omand et al., 2015). Combining cutting-edge and well established observational techniques, we now have the ability to observe the submesoscale and quantify its importance.
Future studies will require expanded observing capabilities with new high-resolution interdisciplinary experiments integrating diverse multiplatform approaches with numerical models. Particular emphasis will be devoted to the calibration and validation of the wide-swath SWOT altimeter, that will make an unprecedented contribution by enabling the first observations in the 20–100 km wavelength band (Dufau et al., 2016). These process-oriented studies will have to resolve a range of scales and will contribute to enhancing our understanding of intense but transient vertical exchanges associated with meso- and submesoscale features, with impacts on longer climatic scales, in order to fill gaps in our knowledge about the connections between physical processes and ecosystem response.
Author Contributions
AP, SR, AO, PP, AT, JA, JT: Conception, planning and design of the experiment. AP, SR, AO, CT, BC, PP, AT, AC, JA: Data collection and analysis of results. MC, BM, AM: model implementation and analysis of results. All authors contributed to the drafting of all sections and approved the final version of the manuscript.
Conflict of Interest Statement
The authors declare that the research was conducted in the absence of any commercial or financial relationships that could be construed as a potential conflict of interest.
The reviewer LB and handling Editor declared their shared affiliation, and the handling Editor states that the process nevertheless met the standards of a fair and objective review.
Acknowledgments
The AlborEx experiment was conducted in the framework of PERSEUS EU-funded project (Grant agreement no: 287600). The experiment was led by the Spanish National Research Council (CSIC) institution with strong involvement and cooperation from other national and international partners: Balearic Islands Coastal Observing and Forecasting System (SOCIB, Spain); Consiglio Nazionale delle Ricerche (CNR, Italy), McGill University (Canada); Istituto Nazionale di Oceanografia e di Geofisica Sperimentale (OGS, Italy) and Woods Hole Oceanographic Institution (WHOI, USA). Glider operations were partially funded by JERICO FP7 project. AP acknowledges support from the Spanish National Research Program (E-MOTION/CTM2012-31014 and PRE-SWOT/CTM2016-78607-P). SR and AP are also supported by the Copernicus Marine Environment Monitoring Service (CMEMS) MedSUB project. EM is supported by a post-doctoral grant from the Conselleria d'Educació, Cultura i Universitats del Govern de les Illes Balears (Mallorca, Spain) and the European Social Fund. AC is a FNRS researcher under the FNRS BENTHOX project (Convention T.1009.15). The altimeter products were produced by Ssalto/Duacs and distributed by CMEMS. The profiling floats and some drifters were contributed by the Argo-Italy program. The authors are in debt with A. Massanet, F. Margirier, M. Palmer, C. Castilla, P. Balaguer and for their efficient work and implication during the AlborEx cruise. We also thank M. Menna, G. Notarstefano and A. Bussani for their help with the drifter and float data processing and the production of some figures. This article was initiated during a research visit of the first two authors to Woods Hole Oceanographic Institution.
References
Allen, J., Smeed, D., Tintoré, J., and Ruiz, S. (2001). Mesoscale subduction at the Almeria–Oran front. J. Mar. Syst. 30, 263–285. doi: 10.1016/s0924-7963(01)00062-8
Allen, J. T., Brown, L., Sanders, R., Moore, C. M., Mustard, A., Fielding, S., et al. (2005). Diatom carbon export enhanced by silicate upwelling in the northeast Atlantic. Nature 437, 728–732. doi: 10.1038/nature03948
Bouffard, J., Renault, L., Ruiz, S., Pascual, A., Dufau, C., and Tintoré, J. (2012). Subsurface small-scale eddy dynamics from multi-sensor observations and modeling. Prog. Oceanogr. 106, 62–79. doi: 10.1016/j.pocean.2012.06.007
Capet, X., McWilliams, J. C., Molemaker, M. J., and Shchepetkin, A. F. (2008). Mesoscale to submesoscale transition in the california current system. Part II: frontal processes. J. Phys. Oceanogr. 38, 44–64. doi: 10.1175/2007jpo3672.1
Chelton, D. B., Schlax, M. G., and Samelson, R. M. (2011). Global observations of nonlinear mesoscale eddies. Prog. Oceanogr. 91, 167–216. doi: 10.1016/j.pocean.2011.01.002
Cotroneo, Y., Aulicino, G., Ruiz, S., Pascual, A., Budillon, G., Fusco, G., et al. (2016). Glider and satellite high resolution monitoring of a mesoscale eddy in the Algerian basin: effects on the mixed layer depth and biochemistry. J. Mar. Syst. 162, 73–88. doi: 10.1016/j.jmarsys.2015.12.004
Dufau, C., Orsztynowicz, M., Dibarboure, G., Morrow, R., and Le Traon, P.-Y. (2016). Mesoscale resolution capability of altimetry: Present and future. J. Geophys. Res. Oceans 121, 4910–4927. doi: 10.1002/2015jc010904
Escudier, R., Mourre, B., Juza, M., and Tintoré, J. (2016). Subsurface circulation and mesoscale variability in the Algerian subbasin from altimeter-derived eddy trajectories. J. Geophys. Res. Oceans 121, 6310–6322. doi: 10.1002/2016jc011760
Flexas, M., Gomis, D., Ruiz, S., Pascual, A., and León, P. (2006). In situ and satellite observations of the eastward migration of the Western Alboran Sea Gyre. Prog. Oceanogr. 70, 486–509. doi: 10.1016/j.pocean.2006.03.017
Fu, L.-L., and Ferrari, R. (2008). Observing oceanic submesoscale processes from space. Eos 89, 488–488. doi: 10.1029/2008eo480003
Gomis, D., Pascual, A., and Pedder, M. A. (2005). Errors in dynamical fields inferred from oceanographic cruise data: Part II. The impact of the lack of synopticity. J. Mar. Syst. 56, 334–351. doi: 10.1016/j.jmarsys.2005.02.003
Gomis, D., Ruiz, S., and Pedder, M. (2001). Diagnostic analysis of the 3D ageostrophic circulation from a multivariate spatial interpolation of CTD and ADCP data. Deep Sea Res. I Oceanogr. Res. Pap. 48, 269–295. doi: 10.1016/s0967-0637(00)00060-1
Grasshoff, K., Ehrhardt, M., and Kremling, K. (Eds.) (1983). Methods of Seawater Analysis, 2nd Edn. Weinheim: Verlag Chemie.
Hemsley, V. S., Smyth, T. J., Martin, A. P., Frajka-Williams, E., Thompson, A. F., Damerell, G., et al. (2015). Estimating oceanic primary production using vertical irradiance and chlorophyll profiles from ocean gliders in the North Atlantic. Environ. Sci. Technol. 49, 11612–11621. doi: 10.1021/acs.est.5b00608
Isern-Fontanet, J., García-Ladona, E., and Font, J. (2003). Identification of marine eddies from altimetric maps. J. Atmos. Oceanic Technol. 20, 772–778. doi: 10.1175/1520-0426(2003)20<772:iomefa>2.0.co;2
Juza, M., Mourre, B., Renault, L., Gómara, S., Sebastián, K., Lora, S., et al. (2016). SOCIB operational ocean forecasting system and multi-platform validation in the Western Mediterranean Sea. J. Oper. Oceanogr. 9, s155–s166. doi: 10.1080/1755876x.2015.1117764
Klein, P., and Lapeyre, G. (2009). The oceanic vertical pump induced by mesoscale and submesoscale turbulence. Ann. Rev. Mar. Sci. 1, 351–375. doi: 10.1146/annurev.marine.010908.163704
Krug, M., Swart, S., and Gula, J. (2017). Submesoscale cyclones in the Agulhas current. Geophys. Res. Lett. 44, 346–354. doi: 10.1002/2016gl071006
Lapeyre, G., and Klein, P. (2006). Dynamics of the upper oceanic layers in terms of surface quasigeostrophy theory. J. Phys. Oceanogr. 36, 165–176. doi: 10.1175/jpo2840.1
La Violette, P. E. (1984). The advection of submesoscale thermal features in the Alboran Sea gyre. J. Phys. Oceanogr. 14, 550–565. doi: 10.1175/1520-0485(1984)014<0550:taostf>2.0.co;2
Le Traon, P. Y. (2013). From satellite altimetry to Argo and operational oceanography: three revolutions in oceanography. Ocean Sci. 9, 901–915. doi: 10.5194/os-9-901-2013
Lévy, M., Klein, P., and Treguier, A.-M. (2001). Impact of sub-mesoscale physics on production and subduction of phytoplankton in an oligotrophic regime. J. Mar. Res. 59, 535–565. doi: 10.1357/002224001762842181
Liblik, T., Karstensen, J., Testor, P., Alenius, P., Hayes, D., Ruiz, S., et al. (2016). Potential for an underwater glider component as part of the global ocean observing system. Methods Oceanogr. 17, 50–82. doi: 10.1016/j.mio.2016.05.001
Macías, D., Stips, A., and Garcia-Gorriz, E. (2014). The relevance of deep chlorophyll maximum in the open Mediterranean Sea evaluated through 3D hydrodynamic-biogeochemical coupled simulations. Ecol. Modell. 281, 26–37. doi: 10.1016/j.ecolmodel.2014.03.002
Mahadevan, A. (2016). The impact of submesoscale physics on primary productivity of plankton. Ann. Rev. Mar. Sci. 8, 161–184. doi: 10.1146/annurev-marine-010814-015912
Mahadevan, A., Oliger, J., and Street, R. (1996a). A nonhydrostatic mesoscale ocean model. Part I: well-posedness and scaling. J. Phys. Oceanogr. 26, 1868–1880. doi: 10.1175/1520-0485(1996)026<1868:anmomp>2.0.co;2
Mahadevan, A., Oliger, J., and Street, R. (1996b). A nonhydrostatic mesoscale ocean model. Part II: numerical implementation. J. Phys. Oceanogr. 26, 1881–1900. doi: 10.1175/1520-0485(1996)026<1881:anmomp>2.0.co;2
Mahadevan, A., and Tandon, A. (2006). An analysis of mechanisms for submesoscale vertical motion at ocean fronts. Ocean Modell. 14, 241–256. doi: 10.1016/j.ocemod.2006.05.006
Mahadevan, A., Tandon, A., and Ferrari, R. (2010). Rapid changes in mixed layer stratification driven by submesoscale instabilities and winds. J. Geophys. Res. 115:C03017. doi: 10.1029/2008jc005203
Mahadevan, A., Thomas, L. N., and Tandon, A. (2008). Comment on “Eddy/Wind Interactions Stimulate Extraordinary Mid-Ocean Plankton Blooms”. Science 320, 448b. doi: 10.1126/science.1152111
Malanotte-Rizzoli, P., Artale, V., Borzelli-Eusebi, G. L., Brenner, S., Crise, A., Gacic, M., et al. (2014). Physical forcing and physical/biochemical variability of the Mediterranean Sea: a review of unresolved issues and directions for future research. Ocean Sci. 10, 281–322. doi: 10.5194/os-10-281-2014
Mason, E., Molemaker, J., Shchepetkin, A. F., Colas, F., McWilliams, J. C., and Sangrà, P. (2010). Procedures for offline grid nesting in regional ocean models. Ocean Modell. 35, 1–15. doi: 10.1016/j.ocemod.2010.05.007
Mason, E., Pascual, A., and McWilliams, J. C. (2014). A new sea surface height-based code for oceanic mesoscale eddy tracking. J. Atmos. Oceanic Technol. 31, 1181–1188. doi: 10.1175/jtech-d-14-00019.1
McGillicuddy, D. J. (2016). Mechanisms of physical-biological-biogeochemical interaction at the oceanic mesoscale. Ann. Rev. Mar. Sci. 8, 125–159. doi: 10.1146/annurevmarine-010814-015606
McGillicuddy, D. J., Anderson, L. A., Bates, N. R., Bibby, T., Buesseler, K. O., Carlson, C. A., et al. (2007). Eddy/Wind Interactions Stimulate Extraordinary Mid-Ocean Plankton Blooms. Science 316, 1021–1026. doi: 10.1126/science.1136256
McGillicuddy, D. J., Anderson, L. A., Doney, S. C., and Maltrud, M. E. (2003). Eddy-driven sources and sinks of nutrients in the upper ocean: results from a 0.1° resolution model of the North Atlantic. Glob. Biogeochem. Cycles 17, 1035. doi: 10.1029/2002gb001987
McWilliams, J. C. (2016). Submesoscale currents in the ocean. Proc. R. Soc. A 472, 20160117. doi: 10.1098/rspa.2016.0117
Morel, A., and André, J.-M. (1991). Pigment distribution and primary production in the western Mediterranean as derived and modeled from coastal zone color scanner observations. J. Geophys. Res. 96, 12685. doi: 10.1029/91jc00788
Morrow, R., Carret, A., Birol, F., Nino, F., Valladeau, G., Boy, F., et al. (2017). Observability of fine-scale ocean dynamics in the northwestern Mediterranean Sea. Ocean Sci. 13, 13–29. doi: 10.5194/os-13-13-2017
Oguz, T., Macias, D., Garcia-Lafuente, J., Pascual, A., and Tintore, J. (2014). Fueling plankton production by a meandering frontal jet: a case study for the Alboran Sea (Western Mediterranean). PLoS ONE 9:e111482. doi: 10.1371/journal.pone.0111482
Oguz, T., Mourre, B., and Tintoré, J. (2016). Upstream control of the frontal jet regulating plankton production in the Alboran Sea (Western Mediterranean). J. Geophys. Res. Oceans 121, 7159–7175. doi: 10.1002/2016jc011667
Ohlmann, J. C., Molemaker, M. J., Baschek, B., Holt, B., Marmorino, G., and Smith, G. (2017). Drifter observations of submesoscale flow kinematics in the coastal ocean. Geophys. Res. Lett. 44, 330–337. doi: 10.1002/2016gl071537
Omand, M. M., D'Asaro, E. A., Lee, C. M., Perry, M.-J., Briggs, N., Cetinic, I., et al. (2015).Eddy-driven subduction exports particulate carbon from the spring bloom. Science 348, 222. doi: 10.1126/science.1260062
Onken, R., Fiekas, H.-V., Beguery, L., Borrione, I., Funk, A., Hemming, M., et al. (2016). High-resolution observations in the Western Mediterranean Sea: the REP14-MED experiment. Ocean Sci. Discuss. doi: 10.5194/os-2016-82.
Oschlies, A. (2002). Can eddies make ocean deserts bloom? Glob. Biogeochem. Cycles 16, 53–1–53–11. doi: 10.1029/2001gb001830
Pascual, A., Bouffard, J., Ruiz, S., Buongiorno Nardelli, B., Vidal-Vijande, E., Escudier, R., et al. (2013). Recent improvements in mesoscale characterization of the western Mediterranean Sea: synergy between satellite altimetry and other observational approaches. Sci. Mar. 77, 19–36. doi: 10.3989/scimar.03740.15a
Pascual, A., Faugère, Y., Larnicol, G., and Le Traon, P.-Y. (2006). Improved description of the ocean mesoscale variability by combining four satellite altimeters. Geophys. Res. Lett. 33, L02611. doi: 10.1029/2005GL024633
Pascual, A., Gomis, D., Haney, R. L., and Ruiz, S. (2004). A quasigeostrophic analysis of a meander in the palamós canyon: vertical velocity, geopotential tendency, and a relocation technique. J. Phys. Oceanogr. 34, 2274–2287. doi: 10.1175/1520-0485(2004)034<2274:AQAOAM>2.0.CO;2
Pascual, A., Lana, A., Troupin, C., Ruiz, S., Faugère, Y., Escudier, R., et al. (2015). Assessing SARAL/AltiKa data in the coastal zone: comparisons with HF radar observations. Mar. Geodesy 38, 260–276. doi: 10.1080/01490419.2015.1019656
Pascual, A., Pujol, M.-I., Larnicol, G., Le Traon, P.-Y., and Rio, M.-H. (2007). Mesoscale mapping capabilities of multisatellite altimeter missions: first results with real data in the Mediterranean Sea. J. Mar. Syst. 65, 190–211. doi: 10.1016/j.jmarsys.2004.12.004
Penven, P., Debreu, L., Marchesiello, P., and McWilliams, J. C. (2006). Evaluation and application of the ROMS 1-way embedding procedure to the central california upwelling system. Ocean Modell. 12, 157–187. doi: 10.1016/j.ocemod.2005.05.002
Pujol, M.-I., and Larnicol, G. (2005). Mediterranean sea eddy kinetic energy variability from 11 years of altimetric data. J. Mar. Syst. 58, 121–142. doi: 10.1016/j.jmarsys.2005.07.005
Ramachandran, S., Tandon, A., and Mahadevan, A. (2014). Enhancement in vertical fluxes at a front by mesoscale-submesoscale coupling. J. Geophys. Res. Oceans 119, 8495–8511. doi: 10.1002/2014jc010211
Renault, L., Oguz, T., Pascual, A., Vizoso, G., and Tintore, J. (2012). Surface circulation in the Alborán Sea (Western Mediterranean) inferred from remotely sensed data. J. Geophys. Res. Oceans 117:C08009. doi: 10.1029/2011jc007659
Rio, M.-H., Pascual, A., Poulain, P.-M., Menna, M., Barceló, B., and Tintoré, J. (2014). Computation of a new mean dynamic topography for the Mediterranean Sea from model outputs, altimeter measurements and oceanographic in situ data. Ocean Sci. 10, 731–744. doi: 10.5194/os-10-731-2014
Rodríguez, J., Tintoré, J., Allen, J. T., Blanco, J. M., Gomis, D., Reul, A., et al. (2001). Mesoscale vertical motion and the size structure of phytoplankton in the ocean. Nature 410, 360–363. doi: 10.1038/35066560
Rudnick, D. L. (2016). Ocean research enabled by underwater gliders. Ann. Rev. Mar. Sci. 8, 519–541, doi: 10.1146/annurev-marine-122414-033913
Ruiz, J., Macías, D., Rincón, M. M., Pascual, A., Catalán, I. A., and Navarro, G. (2013). Recruiting at the edge: kinetic energy inhibits anchovy populations in the Western Mediterranean. PLoS ONE 8:e55523. doi: 10.1371/journal.pone.0055523
Ruiz, S., Garau, B., Martínez-Ledesma, M., Casas, B., Pascual, A., Vizoso, G., et al. (2012). New technologies for marine research: five years of glider activities at IMEDEA. Sci. Mar. 76, 261–270. doi: 10.3989/scimar
Ruiz, S., Pascual, A., Casas, B., Poulain, P., Olita, A., Troupin, C., et al. (2015). Report on Operation and Data Analysis from Multiplatform Synoptic Intensive Experiment (AlborEx). Tech. rep., D3.8 Policy-oriented marine Environmental Research in the Southern European Seas. Available onilne at: https://www.researchgate.net/publication/282610625_Report_on_operation_and_data_analysis_from_Multi-Platform_Synoptic_Intensive_Experiment_ALBOREX
Ruiz, S., Pascual, A., Garau, B., Pujol, I., and Tintoré, J. (2009). Vertical motion in the upper ocean from glider and altimetry data. Geophys. Res. Lett. 36:L14607. doi: 10.1029/2009GL038569. L14607
Shcherbina, A. Y., Sundermeyer, M. A., Kunze, E., D'Asaro, E., Badin, G., Birch, D., et al. (2015). The latmix summer campaign: submesoscale stirring in the upper ocean. Bull. Am. Meteorol. Soc. 96, 1257–1279. doi: 10.1175/bams-d-14-00015.1
Tintoré, J., Gomis, D., Alonso, S., and Parrilla, G. (1991). Mesoscale dynamics and vertical motion in the Alborán Sea. J. Phys. Oceanogr. 21, 811–823. doi: 10.1175/1520-0485(1991)021<0811:mdavmi>2.0.co;2
Tintoré, J., Vizoso, G., Casas, B., Heslop, E., Pascual, A., Orfila, A., et al. (2013). SOCIB: the Balearic Islands Coastal ocean observing and forecasting system responding to science, technology and society needs. Mar. Technol. Soc. J. 47, 101–117. doi: 10.4031/mtsj.47.1.10
Todd, R. E., Gawarkiewicz, G. G., and Owens, W. B. (2013). Horizontal scales of variability over the Middle Atlantic Bight shelf break and continental rise from finescale observations. J. Phys. Oceanog. 43, 222–230. doi: 10.1175/JPO-D-12-099.1
Troupin, C., Pascual, A., Valladeau, G., Pujol, I., Lana, A., Heslop, E., et al. (2015). Illustration of the emerging capabilities of SARAL/AltiKa in the coastal zone using a multi-platform approach. Adv. Space Res. 55, 51–59. doi: 10.1016/j.asr.2014.09.011
Keywords: mesoscale, submesoscale, ocean front, Western Mediterranean, integrated multidisciplinary ocean observations, multiplatform, numerical simulations
Citation: Pascual A, Ruiz S, Olita A, Troupin C, Claret M, Casas B, Mourre B, Poulain P-M, Tovar-Sanchez A, Capet A, Mason E, Allen JT, Mahadevan A and Tintoré J (2017) A Multiplatform Experiment to Unravel Meso- and Submesoscale Processes in an Intense Front (AlborEx). Front. Mar. Sci. 4:39. doi: 10.3389/fmars.2017.00039
Received: 17 November 2016; Accepted: 02 February 2017;
Published: 21 February 2017.
Edited by:
Eugen Victor Cristian Rusu, “Dunarea de Jos” University of Galati, RomaniaReviewed by:
Diego M. Macias, Joint Research Centre (JRC) - European Commission, ItalyLidia Benea, “Dunarea de Jos” University of Galati, Romania
Copyright © 2017 Pascual, Ruiz, Olita, Troupin, Claret, Casas, Mourre, Poulain, Tovar-Sanchez, Capet, Mason, Allen, Mahadevan and Tintoré. This is an open-access article distributed under the terms of the Creative Commons Attribution License (CC BY). The use, distribution or reproduction in other forums is permitted, provided the original author(s) or licensor are credited and that the original publication in this journal is cited, in accordance with accepted academic practice. No use, distribution or reproduction is permitted which does not comply with these terms.
*Correspondence: Ananda Pascual, ananda.pascual@imedea.uib-csic.es