Mesophotic Coral Ecosystems: A Geoacoustically Derived Proxy for Habitat and Relative Diversity for the Leeward Shelf of Bonaire, Dutch Caribbean
 Arthur C. Trembanis
 Alexander L. Forrest
 Bryan M. Keller1
  Mark R. Patterson
- 1Robotics Discovery Laboratories, School of Marine Science and Policy, College of Earth, Ocean, and Environment, University of Delaware, Newark, DE, USA
- 2Department of Civil and Environmental Engineering, University of California Davis, Davis, CA, USA
- 3Marine Science Center, Northeastern University, Nahant, MA, USA
Current trends demonstrate coral reef health in serious decline worldwide. Some of the most well-preserved coral reefs in the Caribbean basin are located in the waters surrounding Bonaire, in the Dutch Caribbean. In many places on the leeward side on islands dominated by trade winds, the shallow reef systems extend into deeper water where they are known as Mesophotic Coral Ecosystems (MCE). Autonomous Underwater Vehicles (AUVs) were used to collect geoacoustic data of these leeward reefs at multiple sites as part of an ocean exploration project. AUV swath bathymetry and side-scan sonar data were analyzed for depth, acoustic backscatter intensity, seafloor slope, and rugosity. These geomorphic metrics were then used as inputs to generate a composite synthetic index of bottom-type to delineate MCE features. A confusion matrix statistical analysis of the acoustic class map showed an overall accuracy of the acoustic classes at 66%, with accuracy of the hard coral class the highest at 83%, and the sandy-bottom class the lowest at 55. The hard coral class was also the statistically most reliable, at over 80%, with the noise class coming in as the least reliable. This morphologic habitat index is a potentially useful new tool in quantifying the extent of MCE located in proximity to Marine Protected Areas (MPAs).
Introduction
Coral reefs surrounding the island of Bonaire, Dutch Caribbean, are arguably some of the most well-preserved in the Caribbean. Nevertheless, there has been recent evidence of coral mortality, decline in live coral reef cover and changing ecosystem dynamics as compared to previous decades (Steneck and McClanahan, 2004; Bak et al., 2005; Stokes et al., 2010). Most ecosystem research in Bonaire has been focused primarily along the shallow (<12 m water depth), near-shore reef communities. For example, van Duyl (1985) mapped out bottom types and benthic community structure around the leeward perimeter of the island from the shoreline to a depth of ~10 m. There have been limited observations of reefs in Bonaire at greater depths and almost no work has been done to date at depths where Mesophotic Coral Ecosystems (referred to in the research literature as MCEs) exist. A recent study by De Bakker et al. (2016) reported pressures and declines in coral assemblages even in depths of 30–40 m off Bonaire and Curaçao thus emphasizing the need to locate and characterize coral reef assemblages in mesophotic depths. MCEs in Bonaire have been shown to extend from 30 to 150 m water (De Meyer and MacRae, 2006; Keller, 2011).
MCEs are known to: (1) exist at multiple locations around the world (e.g., Fricke and Meischner, 1985; Bridge et al., 2011a); (2) extend deeper than the shallow reefs (beginning at 30 m deep) to the bottom of the photic zone (>75 m) depending on the light penetration through the water column (Bridge et al., 2011b); (3) provide potentially important refugia for deep- and shallow-water fishes and coral species (Brockovich et al., 2008; Lesser et al., 2009; Bridge et al., 2013; Harris et al., 2013); and, (4) act as important sources and sinks of shallow coral larvae and thus can affect the recovery time of damaged coral reefs (Bongaerts et al., 2010). The systems are comprised mainly of zooxanthellate scleractinian and octocorallian taxa, sponges, and rhodolith assemblages and very greatly from region to region as noted in the exhaustive review by Kahng et al. (2010). The presence and structure of the MCE are influenced by additional factors such as light availability (PAR), nutrient levels, and hydrodynamic processes (e.g., waves and currents) that drive physical mixing at depth in the water column. The physical process generated turbulent energy has ramifications for the ecology associated with MCEs (Leichter et al., 1998).
Recent advances in diving technologies (e.g., closed-circuit rebreathers, application of mixed gases, etc.), field robotics (e.g., Autonomous Underwater Vehicles -AUVs, Remotely Operated Vehicles, -ROVs), and survey techniques (e.g., sonar and benthic optical imagery) from towed bodies allow MCEs to be explored in an unprecedented way (Armstrong et al., 2006; Locker et al., 2010; Williams et al., 2010; Relles and Patterson, 2011; Bridge et al., 2011a; Smale et al., 2012). The use of AUVs as data collection platforms decouples data collection from a surface vessel allowing higher frequency and shorter pulse length sonars to be brought closer to the seabed (lower altitude) in deeper waters than would be possible from a surface vessel mounted sonar system. This inherently improves the resolution of the sonar based survey data to decimeter horizontal and vertical scale resolution even at depths well-beyond 100 m (Patterson and Relles, 2008; Williams et al., 2010; Forrest et al., 2012; Trembanis et al., 2012). This increased level of precision provided by subsea robotic platforms allows for bottom features, such as coral reef morphologic structures, to be resolved from small (0.1–0.5 m) to large (>1 m) scale over broad areas of the seabed (1–10s of km). Benthic imagery concurrently collected by AUVs allows the measured acoustic backscatter to be ground-truthed in such a way that was previously only possible through logistically challenging field campaigns (Locker et al., 2010). Other aspects of the marine environment can also be surveyed. For example, nekton can be identified from acoustic returns (Fernandes et al., 2003; Patterson et al., 2007) and water quality parameters can also be simultaneously surveyed from AUVs (Moline et al., 2005).
This study aims to identify and characterize through remote sensing the mesophotic reef ecosystem at eight sites along the insular, leeward side, of Bonaire. Dutch Caribbean. Bathymetric sonar, side-scan sonar, and benthic imagery surveys collected from an AUV at each site down to depths of >200 m provide the basis of the geoacoustic data used for the subsequent benthic classification. Substrate classification was conducted using an Acoustic Ground Discrimination System (AGDS) using a new synthetic index for feature discrimination. This classification was then ground-truthed against images concurrently collected from above the seabed. The resulting geoacoustic classification is then used to show the presence of and geomorphic distribution and characteristics of MCEs at some of the test sites. Distribution charts of the MCEs are developed in this work and then presented along with a comparison of MCE presence in the Bonaire Marine Park as compared to sites receiving regular tourist diving in the shallower reef. Implications of these findings for MCE distribution are discussed.
Materials and Methods
Study Area
This study was part of a larger National Oceanic and Atmospheric Association (NOAA) Signature Expedition in 2008 to Bonaire, Dutch Caribbean (Patterson et al., 2008). Bonaire is located in the Caribbean Sea immediately north of Venezuela (Figure 1—Insert). The island municipality of Bonaire is comprised of the main island of Bonaire and then the smaller uninhabited island of Klein Bonaire, which is located on the leeward, western side of the main island (Figure 1). While the eastern (windward) side of Klein Bonaire is occasionally subject to large swell from hurricanes passing through the Caribbean, the western (leeward) side sees infrequent events (Bries et al., 2004). The western side of the island is also exposed to smaller wave energy environments (levels are numbered in Figure 1; adapted from van Duyl, 1985). The study sites (Figure 1—filled squares) range from indexed wave energy states of 4–6 (i.e., the lower end of the wave spectrum) and correspond to wave heights up to 1 m. As wave heights along the western side of the island are lower than the eastern, the shallow reefs are better preserved (Steneck and McClanahan, 2004) and more routinely explored.
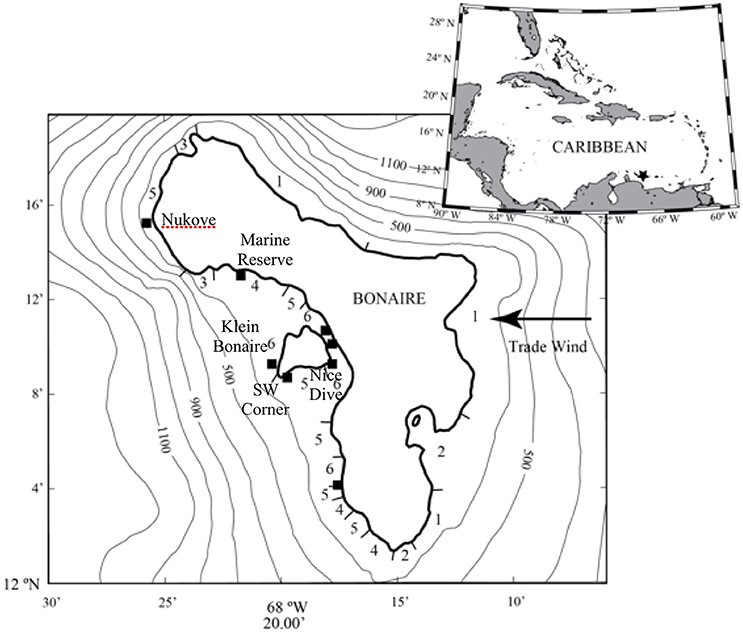
Figure 1. Chart of Bonaire, Dutch Caribbean (global location marked in inset) with surrounding bathymetry and index of wave level environments around the shoreline indicated (Level 1: Wave height 2–3.5 m; 2: 1.5–2 m; 3: 1–1.5 m; 4: 0.5–1 m; 5: 0.3–0.5; 6: 0.0–0.3 m, as adapted from van Duyl, 1985). Survey sites indicated around the island (filled squares). For reference Nukove is the northernmost site. Klein Bonaire is the smaller island to west of main island.
Data Collection by AUV
At each of the sites, a phase-measuring bathymetric sonar (PMBS) and a side-scan sonar (SSS) data were acquired using a Teledyne Gavia AUV as the survey platform (Figure 2). The depth rating (200 m) allowed missions over a large range of the mesophotic zone. Note that while strictly speaking the mesophotic zone operatively extends to the bottom of the photic zone, here functionally we set our analysis to between the 30 and 150 m isobath (Lesser et al., 2009). Powered with a 1 kW h lithium-ion battery pack (Figure 2A2), the AUV has a mission duration of c. 4 h at a swimming speed of ~1.8 m s−1, or greater than 25 km of trackline in a given mission. This AUV utilized a Kearfott T-24 INS Inertial Navigation System (INS) aided with a 1,200 kHz RDI Doppler Velocity Log (DVL) for navigation (Figure 2A4). The navigational solution has less than 0.05% error by distance traveled resulting in ~3.0 m positional uncertainty after completing an hour of submerged trackline (Trembanis et al., 2012).
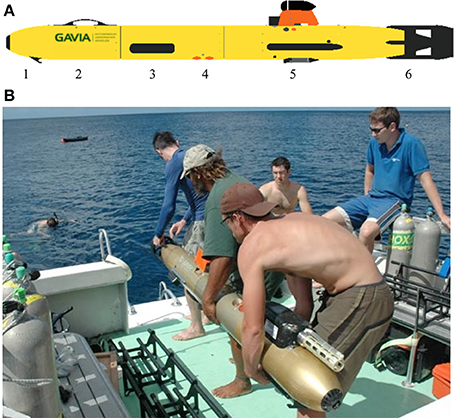
Figure 2. The gavia autonomous underwater vehicle (A) as assembled for these survey dives and (B) being launched from the surface vessel. Numbers delineate each of the modules of the AUV. 1, Nose Cone where the camera view port is located; 2, Battery Module; 3, Phase Measuring Bathymetric Sonar Module; 4, Inertial Navigation System Module; 5, Control Module with side-scan sonar transducers; 6, Propulsion Module.
The key scientific payloads on the AUV were the camera, the phase-measuring bathymetric sonar (PMBS), and a side-scan sonar (SSS). Fitted into the nose module (Figure 2A1) of the AUV was a Point Gray Scorpion 20SO digital camera that has an image capture rate of ~ 4 Hz. At the survey speed of ~1.8 m s−1, this frame rate results in one image every 0.45 m and ~40% overlap between frames for typical flight altitudes of the AUV. With geophysical surveys commanded at vehicle altitudes of 15 m, this fixed in-water field of view of the camera of 54°, features of 6–12 cm were resolvable in the resulting images. Camera gain, aperture, and exposure were set to be fully automatic rather than fixed contrary to recommendations for imagery in low light environments (Pike, 2011). The phase measuring bathymetric sonar was a GeoSwath module manufactured by Kongsberg Maritime (Figure 2A3). The 500 kHz operating frequency provides 20 cm horizontal resolution in the final acoustic backscatter mosaic, with 1.0 m horizontal resolution in the associated gridded bathymetric surface. Side-scan sonar data were also collected with a 900/1,800 kHz Marine Sonic Technology Sea Scan module (Figure 2A5). Side-scan sonar data were collected exclusively at 900 kHz, which provides 18 cm horizontal resolution in the gridded backscatter mosaic.
Between January 13 and 25, 2008, nearly 200 h and over 160 km of trackline survey data were collected. The AUV was programmed to follow a constant altitude of typically 15 m for bathymetric surveys, with survey lines run roughly parallel to known bathymetric contours (using known bathymetry for mission planning). Alternating line spacing of 30 and 60 m was used with sonar set to achieve swath widths of 70 m. These acquisition settings resulted in data with ~150% port and starboard overlap on successive survey lines. Identical acquisition settings with this same AUV have been used by the authors successfully in several similar studies (Raineault et al., 2012; and Trembanis et al., 2012, 2013).
Data Processing
Phase-measuring bathymetric data were processed with commercial processing software including GS+ (GeoAcoustics Ltd) and SonarWiz (Chesapeake Technology Inc.) with an established workflow (Figure 3) for removing outliers caused by noise within the water column and generating bathymetry and backscatter representation of the seafloor. Geocoder software, a component of the Fledermaus software suite was used to generate backscatter mosaics including geometric and radiometric corrections in addition to the motion compensation provided by the INS data. These data were then imported to a data visualization software package Fledermaus (QPS BV) and gridded onto a user-specified grid, in this case a cell size of 1.0 m, using a moving average that included three nearest neighbors (Keller, 2011). Acoustic backscatter data were processed and quantitatively compared using an additional seabed Acoustic Ground Discrimination System (AGDS) software package called QTC SWATHVIEW (Quester Tangent, Saanichton BC) following the methods and approach of other recent investigators e.g., Brennan et al. (2012) and Raineault et al. (2012). Class maps of similar acoustic image properties are generated with SWATHVIEW and are then ground truthed from seabed photos for each of the investigated sites (Figure 4). Seabed characteristics for a defined class are assumed to be reasonably constant (i.e., consistent between study sites based on similar setting and the consistent sonar settings used for each survey) and distinct from other class characteristics.
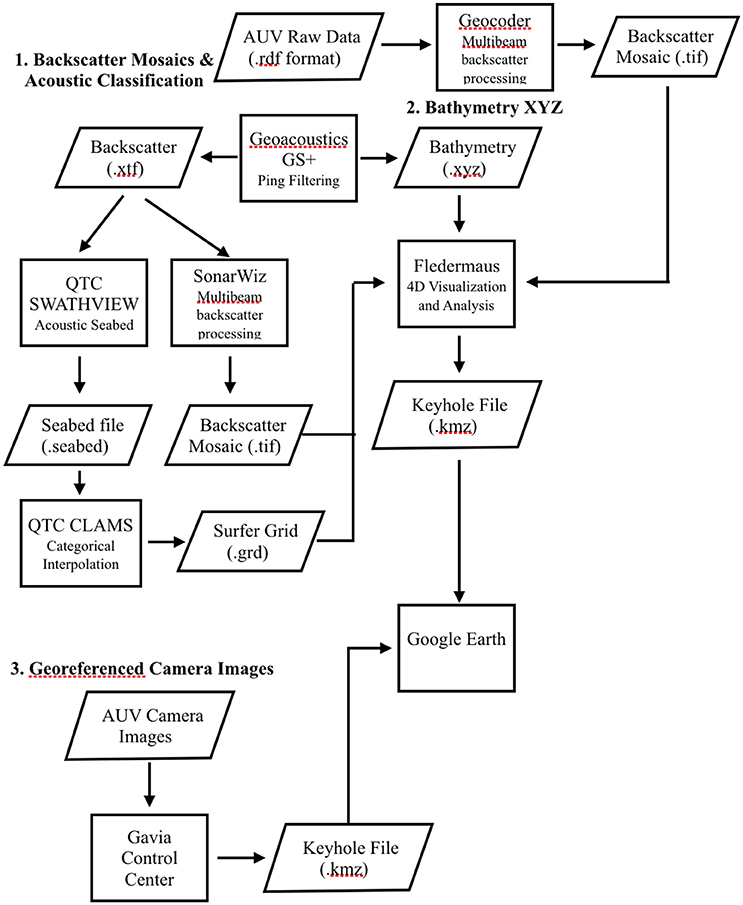
Figure 3. Data processing workflow for the generation of (1) Backscatter mosaics (2) XYZ bathymetry ad (3) georeferenced camera images. All of the resulting products are then integrated and visualized together for analysis in Matlab and Google Earth.
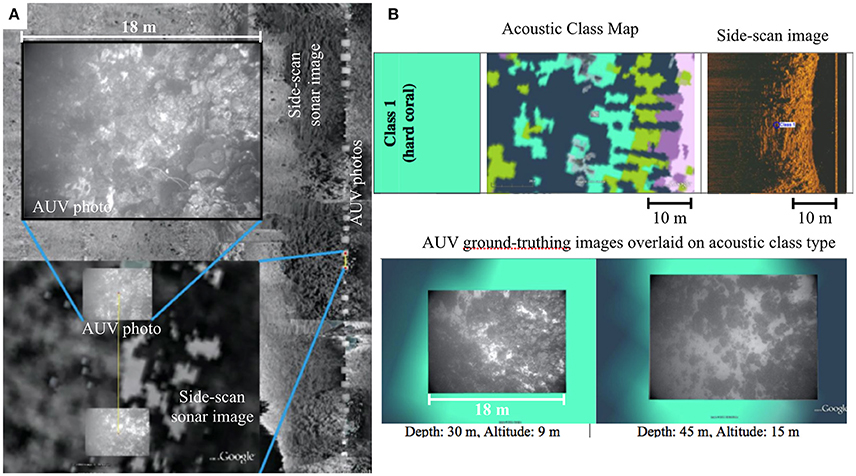
Figure 4. (A) AUV benthic images from the Nukove Bonaire (northern most survey site) displaying the photo size and spacing in Google Earth. Note: Display interval above set to show only every tenth photo. Approximate Image Footprint = 18 × 13 m. (B) Example of acoustic class map highlighting class 1 hard coral (turquoise color) along with representative side-scan sonar image of class 1 and AUV camera photos used to ground-truth and classify class 1 as indicative of hard coral cover.
Classification in this manner reduces the amount of ground-truthing data (Figure 5) that must be collected in order to verify that a specific substrate segmentation coincides with a specific sediment type (i.e., only a small nominal number of ground-truthing samples from each class are adequate to define the entire class). QTC SWATHVIEW has been widely used in acoustic habitat studies and further theoretical information and example studies (Preston et al., 2001; Quester Tangent, 2010; Brennan et al., 2012; Raineault et al., 2012, 2013). As shown in Figures 4, 5, for all of the datasets, the final output was Keyhole Markup Language (.kml) files, which could be imported directly into Google Earth. In addition to acoustic class maps and sonar mosaics, gridded Digital Elevation Models (DEMs) were generated from the bathymetric data.
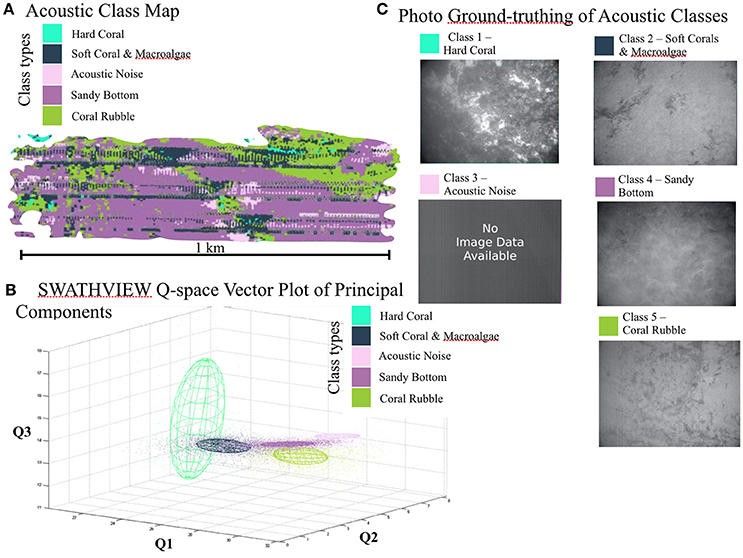
Figure 5. QTC SWATHVIEW acoustic classifications of the combined Bonaire MCE survey database. (A) Acoustic Class map of the southwest Klein Bonaire site (cf Figure 6). (B) Q-Space vector plot of each point in the survey map in the three-dimensional principle component space with each class type colored and outlined in the vector space. (C) Examples of AUV ground-truthing photos of each acoustic class type used to specify the class composition.
Synthetic Bottom-Type Index
Biological diversity (e.g., Shannon's diversity index, H′,) is a measure of information entropy, however, there were no direct estimations of taxa (genus or species) observed in the benthic imagery as a result of the higher AUV flight altitudes designed to maximize sonar coverage (cf. analyses done from AUV sampling in Bridge et al., 2011a,b). Nevertheless, a new quantitative synthetic index proxy of diversity potential was created. This index , was related to the geomorphology and the biological complexity, by combining the geoacoustic classes from the QTC principal components analysis together with the benthic photographic imagery and morphologic measurements of slope, rugosity, and depth from the sonar mapping measurements.
The synthetic bottom-type index, , is given by:
where R is the estimated rugosity (based on Jenness, 2004), d is the depth (m), dmid is the mid-point depth of the survey site region (here 50 m), s is slope of the seafloor in the absolute value (degrees) relative to a horizontal plane), and Cweight is the weighted classification (Figure 6) of the different bottom-type acoustic classes that were previously identified by QTC SWATHVIEW, following a similar methodology as employed in other geoacoustic studies (Brennan et al., 2012; Raineault et al., 2013). Note that the dmid/d term places more emphasis on shallow compared to deeper depths. Cweight allows different acoustic cluster classes to have different weightings. For example, coral bottom substrates will have a significantly higher index value than sand or macroalgae. Diversity weightings, Cweight, (Figure 6) were assigned according to previously published diversity indices for Caribbean reefs with values of 3.5, 3.2, 1.9, and 0.1 assigned to the hard coral, coral rubble, macro algae, and sandy bottom cluster classes, respectively (computed as bits and reported by Porter, 1972). It should be noted that the “unknown” noise class identified in the geoacoustic classification was assigned a value of 0, as it was most similar to sand. Based on the location of this class, with respect to vessel trackline, it is suspected to be purely acoustic noise.
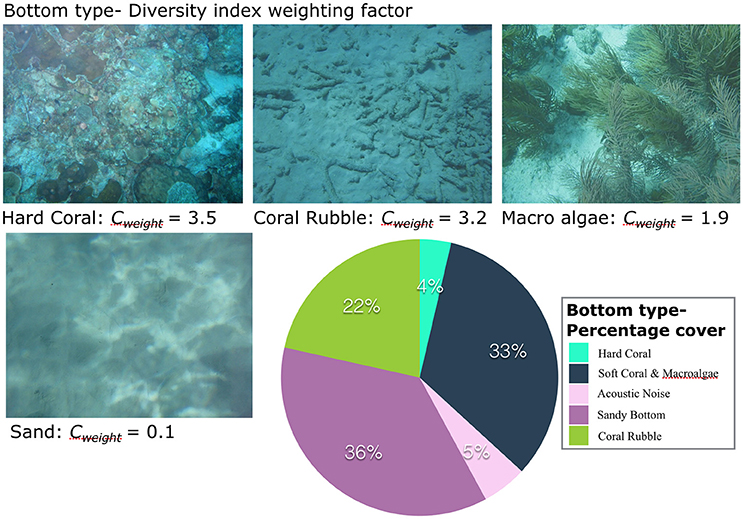
Figure 6. Representative photos of each bottom type class along with the diversity index values assigned for each class type computed as bits using values reported by Porter (1972). Distribution of each class type as a percentage of the mapped seafloor.
These map datasets were then input into Eq. 1 in order to produce composite maps of on a 4 m grid (Figure 11) for Klein Bonaire from ~ 0–135 m depth (see Figure 10 for depth profile). This larger grid resolution was required because the acoustic classes are calculated over multiple pixels of the underlying side-scan sonar mosaic.
The depth of many of the Bonaire site locations exceeds 200 m, well-beyond the nominal depth of scientific diving activity (~40 m). Many of the MCEs identified in this study were found in depths greater than 70 m, the simultaneous collection of sonar and benthic imagery provides additional information in assessing MCE characteristics and distribution. Furthermore, the camera images are valuable for ground-truthing acoustic class maps. The AUV camera records frames at approximately two frames per second and, during the Bonaire surveys, collected nearly 73,000 images. Given the speed of the vehicle, the overlap in consecutive images, and a nominal autocorrelation length scale of 10 m the image database reduces down to ~5,800 images that could be considered independent measurements of the seabed habitat composition. Using the Gavia Control Center software, and the metadata contained within each image, these camera images were georeferenced and exported to .kml, which could be imported directly into Google Earth for overlay onto the sonar and class maps. An example of a set of georeferenced images gathered with the downward facing AUV camera is provided in Figures 4, 5. A subset of 1,500 images from the photo collection were used to perform a statistical analysis of the accuracy and reliability of the acoustic class map and are reported in the results section. Operationally higher altitudes are preferred in order to optimize the sonar swath width, however, we found that camera image resolution degrades with increasing altitude above the bed as the image footprint covers and increasingly wider area, which allows to us distinguish habitat type but not to the level of species and genus.
AUV camera imagery was used to ground-truth different sediment types associated with each particular SWATHVIEW seafloor classification (Figure 5). The mission altitudes that were selected to maximize for acoustic swath coverage produce images that can be used to distinguish bulk habitat class types (e.g., sandy bottom vs. hard coral vs. noise) but are not of sufficient resolution from these survey altitudes to distinguish genus or species. Ground-truthing was achieved by loading a class map into Google Earth as a layer and then loading overlay images of that particular type. For each class three hundred images were examined to validate the acoustic class type (Keller, 2011). This method was used to validate the SWATHVIEW acoustic classifications collected from the surveys (Figures 4B, 5C).
Results
SWATHVIEW Classification
Based upon multiple runs of SWATHVIEW, it was determined that five acoustic classifications best fit the available data, as they included all of the known bottom types (Figure 5B). Based on the available AUV ground-truthing image data, Class 1 is associated with clearly defined hard coral structures, including both massive head corals, and foliaceous corals (e.g., Agaricia agaricites). Class 2 is associated with soft coral (e.g., Pseudopterogorgia acerosa) and macroalgae. No image data are available for Class 3 as it is an acoustical noise class (accounting for only 5% of total class coverage). Class 4 is associated with sandy bottom areas with few distinct characteristics. Class 5 is associated with coral rubble and sparse macroalgae (Figure 5). These conclusions about bottom type were made by comparison of the AUV imagery data to photos taken by van Duyl (1985) and also from diver photos taken during the 2008 field campaign and represent bulk habitat class determinations.
Using equation 1 and the aforementioned class weightings, shows its highest value when coral substrate is found with high rugosity and steep slope in shallower water. This index proved useful in delineating features seen in the acoustic imagery because features created by coral produce complex topography with the highest values using this new combinatorial formulation scheme. Operationally, ranges from 0 to c. 2.5 for the weighting scheme we used in this work. Note that this synthetic proxy index has dimensions only of bits as the other units all cancel out; thus the absolute magnitude of values computed at a specific seafloor location cannot be directly transferred to another location, but this proxy metric method does prove operationally useful for landscape-level classifications to locate MCE and prioritize within a given location. Other schemes for weighting the bottom types could be used to achieve similar results.
Two of the survey sites were selected as being representative of the two dominant type of shelf profile observed: Klein Bonaire was chosen to represent Type I (Figure 11), and Nukove was chosen to represent Type II (Figure 12). At each of the sites, estimates of slope, rugosity, and geoacoustic classification were generated for the surveyed region and combined into the relative diversity proxy value.
Figure 12 shows similar composite index results for Nukove (Type II) from ~ 0–225 m depth (see Figure 10 for depth profile) with a similar submerged structure running parallel to shore as was observed at the Klein Bonaire (Type I) site. However, in contrast to the previous site, this submerged reef occurred at 100 m depth. These greater depths will decrease the value of . For example the average value for the deep submerged reef at the Nukove (Type II) site is ~ 1.75 in contrast to an computed value of ~ 2.25 at the Klein Bonaire site (Type I).
Fully 55.6% of all data points collected in Bonaire fall within the mesophotic zone; however, this includes both flat sandy bottoms as well as coral substrate. To better understand the distribution of coral structures in Bonaire, both the classification data as well as the calculated rugosity values must be interpreted. A high rugosity value is often indicative of the presence of coral structures (Prada et al., 2008), in fact 11.8% of all data points had a rugosity ratio of 1.3 or greater and were found within the inferred hard coral acoustic class (Figure 6). In Figure 6, the classifications assigned to each data point are shown along with the percentage of the seabed coverage that each class accounted for. Classes 1 (Hard Coral) and 2 (Soft Corals and Macroalgae) are indicative of live coral substrate. These two geoacoustic classes account for 37% of all data points.
Accuracy Metrics of Habitat Classification
In order to assess the accuracy and reliability of the acoustically derived class maps, 1500 independent images were analyzed using a confusion matrix approach (Table 1). These images represent ~25% of the total independent images in the presented survey areas. For the accuracy and reliability assessment images were selected from the areas presented here in the results (Figures 11, 12) with 300 non-overlapping images in each acoustic class domain randomly selected and then the image based bottom type was recorded into a confusion matrix for statistical analysis. The statistical analysis showed an overall accuracy of the acoustic classes at 66%, with accuracy of the hard coral class the highest at 83%, and the sandy-bottom class the lowest at 55. The hard coral class was also the statistically most reliable, at over 80%, with the noise class coming in as the least reliable.
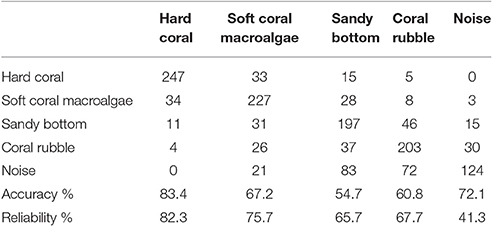
Table 1. Confusion matrix.
Discussion
This work detailed the use of an AUV for a high-resolution remote sensing survey of nearly two square kilometers of seafloor around Bonaire in a short 7-day period. Many of the areas mapped in this survey have never been explored in detail before now owing to the depths being beyond traditional SCUBA diver limits. In addition to the commonly visited shallow reef, observations of a second reef which exists from 75 to 100 m on much of the leeward coast from a time that sea level was lower than its current state. Significant deep-water features were discovered at several locations. Their existence was likely unknown, as these depths are greater than traditional scuba diving is capable of achieving. Over half of all the observed reef structures are found outside of the designated Marine Protected Area, and do not benefit from the conservation efforts that exist to protect the shallow reef. Figure 13 shows a conceptual diagram profile of the leeward shoreline of Bonaire, based on the bathymetry and classification data from all the AUV survey locations. This figure summarizes where specific features and bottom types were found by our AUV surveys and estimated from the data fusion of geomorphologic and acoustic class metrics using a new synthetic proxy index for inferred diversity.
Classes 1 (Hard Coral) and 2 (Soft Corals and Macroalgae), when found at depths beyond 40–50 m (Figure 7) these two classes represent inferred areas of MCE. These geoacoustically inferred MCE substrates are fairly discontinuous, and change in width and depth depending on location around the island. Most sites have very low rugosity at depths greater than 100 m; however, Just a Nice Dive, Southwest Corner, and the Marine Park each have significant roughness features indicative of possible MCE sites. The two Klein Bonaire sites show evidence of reef-like structures existing at depths greater than 175 m with no other structures nearby (Figure 8). By examining the slope map, these features shows a trail directly behind them trending up into shallower water. This suggests that at least some amount of slumping of the reef structure downslope has likely occurred. This escarpment is fairly continuous and is thus indicative of a submerged reef rather than a collapsed fragment from the modern reef. These calculations of show that this submerged reef is a potential viable MCE community at ~60 m depth, although likely not as diverse as the shallow modern reef based on the proxy diversity index calculation. There is also evidence of a feature on the northern side of the plot that is not part of this continuous feature. At 100 m, this feature is much deeper than the submerged reef and is inferred to be a submerged collapsed feature, which may also act as potential deepwater habitat.
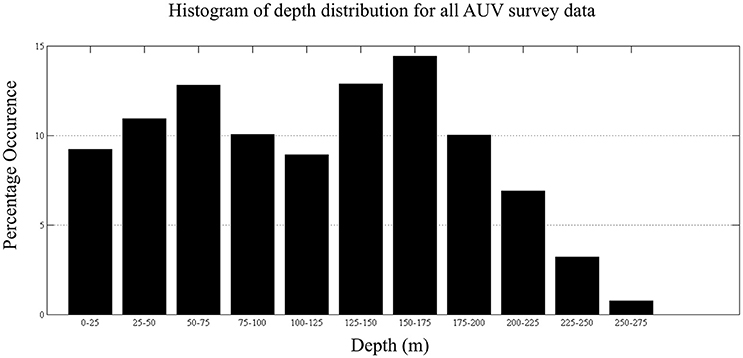
Figure 7. Histogram distribution of bathymetry from all Bonaire survey locations in this study. Portions of the survey within the mesophotic zone comprise 57% of the data and are found in the depth intervals between 50–150 m.
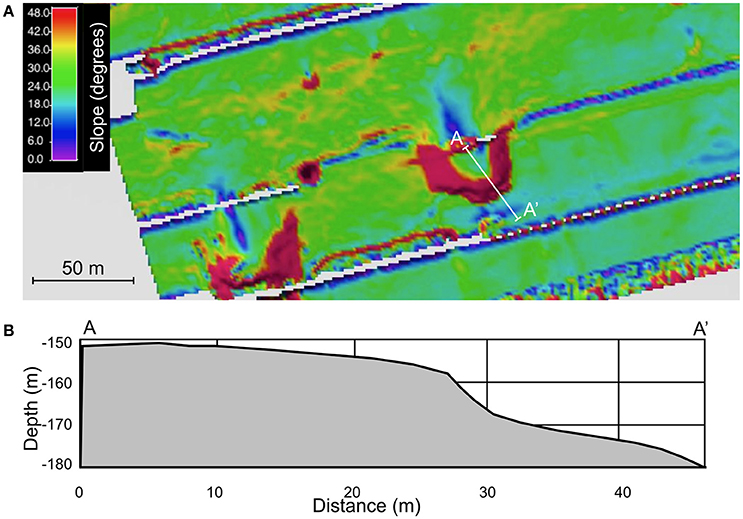
Figure 8. (A) Slope map of the southern section of the Southwest Corner site (cf Figure 1) showing trails behind two the deep water reef-like features. (B) Close-up bathymetric profile over the deep mound structure. Profile ends refer to A and A′ in panel A.
A large pile of coral rubble was discovered at the marine reserve site at a depth of 170 m. This pile was measured to be 10 m in height, with a width of nearly 300 m, and surrounded by sand (Class 4; Figure 9). It is unlikely that this coral was originally found at this location, as it does not display a shape congruent with a patch reef. Although no significant break in the shallow reef can be distinguished from the available data, it appears to have originated in shallow water. Morton et al. (2008) found a significant onshore ridge deposit at this location, with a width of 60–70 m and a thickness of 3 m, consisting of mostly pebbles to cobbles, with some sand and fine boulders. Formations such as these are often indicative of single or multiple significant wave events (Morton et al., 2008). If a large wave event did create this ridge formation onshore, it is likely that substantial damage was also done to the underwater environment, which may have generated this large pile of coral rubble from downslope transport.
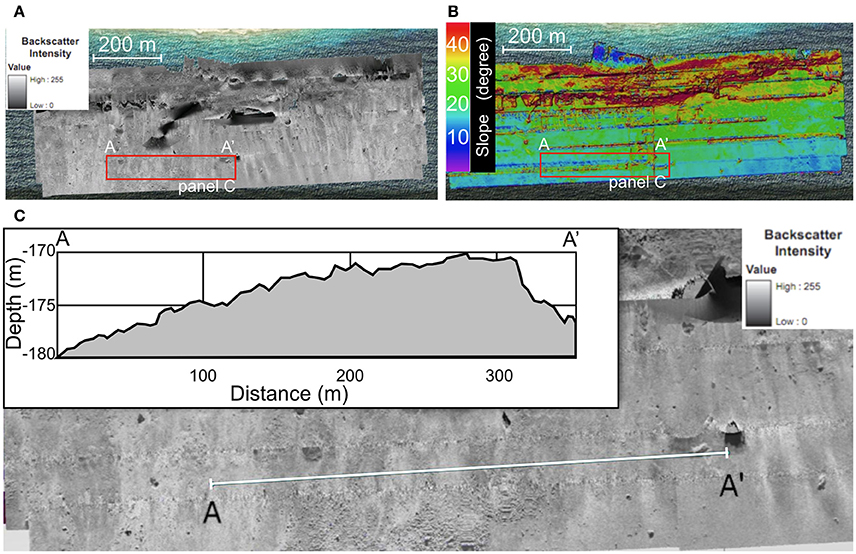
Figure 9. (A) Backscatter mosaic map of the Marine Reserve site. (B) Slope map of the Marine Reserve site. (C) Profile of bathymetry data overlaid with a backscatter mosaic showing a large mound, ~10 m in height, with a rough acoustically bright surface, and a horizontal width of nearly 300 m.
These potentially gravity-driven slump features, whether storm or tsunamigenic in origin, provide a transport pathway for the movement of shallow reef species to depth and at the very least would provide new exploitable structural substrate for deep tolerant species to take. These pathways could potentially allow these deposits to serve as conduits to deeper reef banks, or to serve as refugia themselves for any shallow water corals transported with the slump block that are capable of still thriving at the new depths (Bongaerts et al., 2010). Harriott and Banks (2002) and Harris et al. (2013) found that the presence of hard substrate was essential for coral development. Therefore, we infer that antecedent geology, or more recent event transport mechanisms that can introduce hard substrate at depth, may both provide potential value to MCE development that can be characterized by careful high-resolution remote sensing combining sonar and camera imagery from autonomous underwater vehicles.
One of the original hypotheses associated with this work was that differences in the extent of MCE would be related to the index of wave environments zones proposed by van Duyl (1985). The eight survey sites spanned index values 4–6 according to the van Duyl classification, which covers all of the zones on the leeward side of the island (c.f. Figure 1). There appears to be minimal correlation between wave environment zone and the typical observed cross-shore profiles collected at each site (Figure 10). Slopes at almost all the locations were relatively shallow (<5°) until the reef break 100–125 m from shore and then dropped quite steeply (>20°). As shown, the profiles at each of sites can be generalized into one of two different morphologic types (Figure 10): Type I—steep initial slope to 50 m with a minor secondary shelf break; and, Type II—steep initial slope to 125 m depth followed by a lower slope inflection. We hypothesized that MCE features associated with the Type I shelf form would be submerged reefs with higher index values whereas Type II shelf forms would more likely be collapse features with lower index values. From this analysis, it is possible to conclude that MCE occurring in regions that have a depth profiles similar to a Type I profile are more likely to have greater index values than on Type II slopes. Utilizing this approach of fusing remote sensing information on morphology and class type to produce composite indices provides a quantitative way to determine areas of interest for follow-up investigation by divers or remotely operated vehicles.
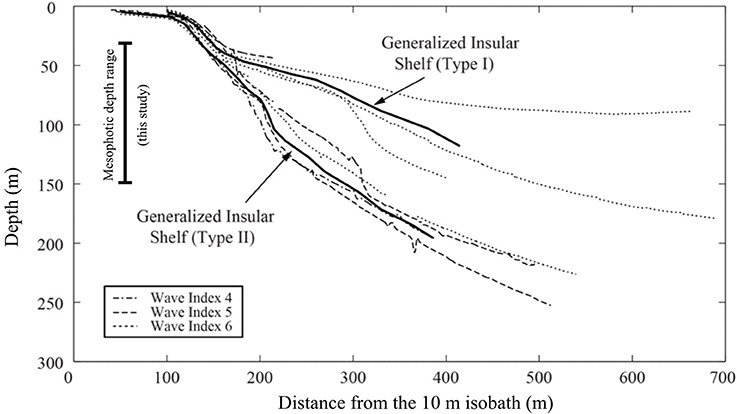
Figure 10. Depth profiles from each study site along the leeward side of Bonaire with the two observed generalized shelf types based on averages of the other profiles.
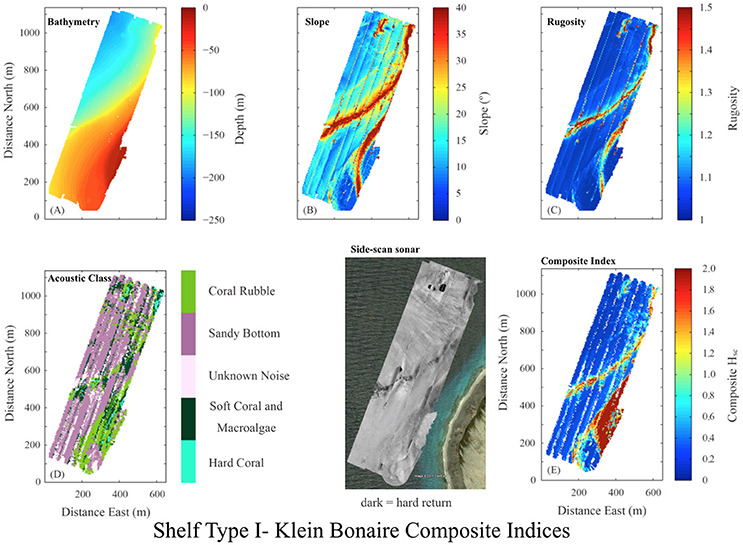
Figure 11. Synthetic bottom type-diversity index, for the Klein Bonaire site based on composite summary of bathymetry, rugosity, slope, and acoustic class type. Color scale indicates magnitude of synthetic bottom-type diversity index (cf. Equation 1).
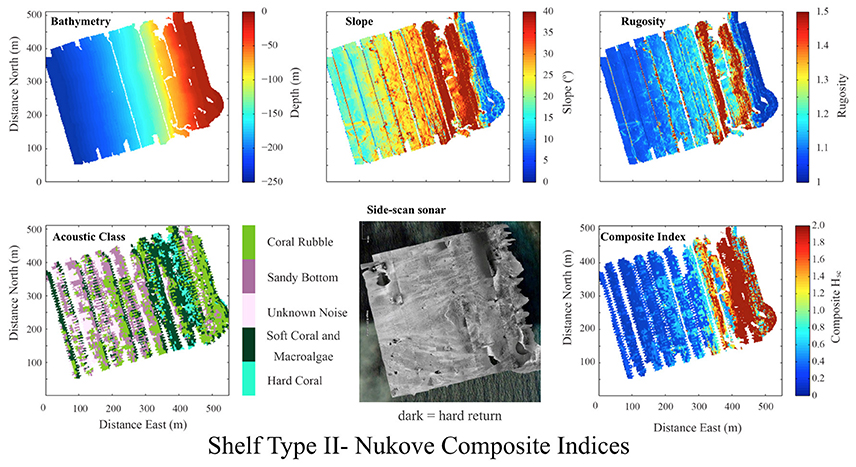
Figure 12. Synthetic bottom type-diversity index for the Nukove Bonaire site based on composite summary of bathymetry, rugosity, slope, and acoustic class type. Color scale indicates magnitude of synthetic bottom-type diversity index (cf. Equation 1).
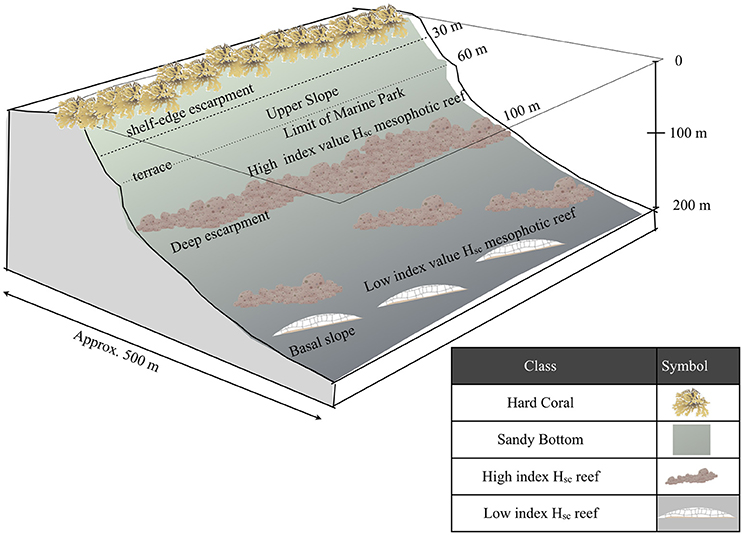
Figure 13. Conceptual diagram of an idealized profile of the insular shelf of Bonaire based on the AUV acoustic data and synthetic diversity maps of mesophotic bottom types.
Although these newly mapped MCE are nominally below the depth of the Bonaire MPA (60 m isobath) they may represent significant and important contributors to the health of the reef within the MPA jurisdiction. These deep reef formations have little direct significance to the diving tourism industry, as they fall well-beyond the range of recreational SCUBA diving; however, they may play a vital role to the continued health of the shallower reef. The mesophotic zone for this study is defined as the region between 30 and 150 m and has been shown to support growth of some coral species. The entirety of the deeper coral reef found in Bonaire lies within this zone and has been suggested by numerous studies (Brockovich et al., 2008; Lesser et al., 2009; Bridge et al., 2013; Harris et al., 2013) to serve as refugia and to play an important role in the recovery of damaged shallow water coral reefs.
A follow-up survey of Bonaire would be beneficial as a measure of tracking how the reef has changed since the last survey, especially with the damage caused by Hurricane Omar in October 2008. Several of the significant deep water features were located on the edge of the maps, so these areas could also be further explored in more detail to see how the features relate to the areas around them. These data, along with additional coordinated onshore surveys to determine the locations of wave deposits, could be used to better determine and study possible extreme events that may have generated many of the features shown in these surveys. Similar studies could also be conducted on the neighboring islands of Curaçao and Aruba, due to their close proximity.
Confusion matrix based statistical analysis of the remotely sensed geoacoustic class types provided additional insights into the strengths and challenges associated with any form of pixel based seabed classification from automated ground discrimitation system (AGDS) approaches such as the QTC SWATHVIEW system employed in this study. The AGDS system was seen to have the highest accuracy (83.4%) and reliability (82.3%) for the hard coral class, which is a beneficial finding for studies focused on identifying and assessing hard coral communities. It may be inferred that the generally higher amplitude of acoustic return and shadow created from the relief of hard coral heads compared to other benthic class types makes it more readily distinguishable from the other classes. It was the “Soft Coral and Macroalgae” which had the next highest combination of reliability and accuracy, perhaps intuitively congruent, as this habitat type presents a structural response to ensonification making it fairly easy to distinguish. Acoustic noise, which can come from a variety of sources including inherent design and geometries of the sonar system and environmental variables, showed a farily high accuracy but the lowest reliability, meaning that it could generally be found but that it was also readily confused with either the “Sandy Bottom” or “Coral Rubble” classes perhaps a result of the low amplitude reflection of the former and the somewhat scattered and specular nature of the latter. Of importance to this study, the ADGS was able to clearly distinguish between noise and hard coral classes with no occurrences of noise having been classed as hard coral according to the statistical analysis.
Ground-truthing data, including georeferenced photographs taken closer to the seabed, should be collected to better associate the QTC SWATHVIEW classifications with sediment type and to derive direct species-level measurement indices of diversity to compare to the inferred composite index developed here in this study.
MCEs at Bonaire provide a potential buffer against pressures such as climate change and storms. MCEs throughout the ABC islands (Aruba, Bonaire, and Curaçao) and many others in the Caribbean still remain largely unexamined. Further research is required to determine the full extent and condition of the MCE grounds both on the leeward and particularly the largely unexplored windward portion of the island. Our results suggest that the potential reef habitat of Bonaire may be underestimated. Our summary finding is that geoacoustic surveys from robotic platforms can be used to accurately discriminate between different habitat types/ecological communities in deep waters that are otherwise difficult to survey, and that this type of remote sensing habitat mapping tool provides valuable information for the management of coral reef/MCE ecosystems here and elsewhere.
Author Contributions
AT was the Co-PI of the project and lead the design of the experiment, field effort, and supervised the analysis of the data. He advised the graduate student involved and helped write the manuscript and draft the figures. AF helped execute the field collection of the AUV data and to develop the post-processing analysis and to write the paper. BK was the graduate student involved in the data analysis and interpretation and helped write the manuscript. MP was the project Co-PI and helped lead the design of the overall project and to conduct the field work.
Conflict of Interest Statement
The authors declare that the research was conducted in the absence of any commercial or financial relationships that could be construed as a potential conflict of interest.
Acknowledgments
This work was supported by a NOAA Office of Ocean Exploration and Research Award #NA07OAR4600291. Expert field assistance was provided by project co-PIs J. Leichter, and M. D. Stokes, and expedition members C. Cocarro, K. Collins, S. Genovese, T. Hiller, D. Jones, B. Laval, E. Magnússon, J. Mallinson, K. McCole, D. Miller, N. and A. Relles, O. Rutten, H. Stevens, and R. Yeo. E. Beukenboom and R. de Leon of STINAPA Bonaire provided logistical help, field assistance, and boat access. F. van Slobbe, Department of Environment and Natural Resources, and the Honorable H. Domacassé, Lt. Governor of the Government of the Island Territory of Bonaire provided insights into development trends and political support for the expedition.
References
Armstrong, R. A., Singh, H., Torres, J., Nemeth, R. S., Can, A., Roman, C., et al. (2006). Characterizing the deep insular shelf coral reef habitat of the Hind Bank marine conservation district (US Virgin Islands) using the Seabed autonomous underwater vehicle. Cont. Shelf Res. 26, 194–205. doi: 10.1016/j.csr.2005.10.004
Bak, R. P. M., Nieuwland, G., and Meesters, E. H. (2005). Coral reef crisis in deep and shallow reefs: 30 years of constancy and change in reefs of Curaçao and Bonaire. Coral Reefs 24, 475–479. doi: 10.1007/s00338-005-0009-1
Bongaerts, P., Ridgway, T., Sampayo, E., and Hoegh-Guldberg, O. (2010). Assessing the “deep reef refugia” hypothesis: focus on Caribbean reefs. Coral Reefs 29, 309–327. doi: 10.1007/s00338-009-0581-x
Brennan, M. L., Robert, D. B., Roman, C., Bell, K. L. C., Buxton, B., Coleman, D. F., et al. (2012). Evaluation of the modern submarine landscape off southwestern Turkey through the documentation of ancient shipwreck sites. Cont. Shelf Res. 43, 55–70. doi: 10.1016/j.csr.2012.04.017
Bridge T. C. L., Done, T. J., Friedman, A., Beaman, R. J., Williams, S. B., Pizarro, O., et al. (2011b). Variability in mesophotic coral reef communities along the Great Barrier Reef, Australia. Mar. Ecol. Prog. Ser. 428, 63–75. doi: 10.3354/meps09046
Bridge, T. C. L., Done, T., Beaman, R., Friedman, A., Williams, S., Pizarro, O., et al. (2011a). Topography, substratum and benthic macrofaunal relationships on a tropical mesophotic shelf margin, central Great Barrier Reef, Australia. Coral Reefs 30, 143–153. doi: 10.1007/s00338-010-0677-3
Bridge, T., Hughes, T., Guinotte, J., and Bongaerts, P. (2013). Call to protect all coral reefs. Nat. Clim. Change 3, 528–530. doi: 10.1038/nclimate1879
Bries, J. M., Debrot, A. O., and Meyer, D. L. (2004). Damage to the leeward reefs of Curaçao and Bonaire, Netherlands Antilles from a rare storm event: Hurricane Lenny, November 1999. Coral Reefs 23, 297–307. doi: 10.1007/s00338-004-0379-9
Brockovich, E., Einbinder, S., Shashar, N., Kiflawi, M., and Kark, S. (2008). Descending to the twilight zone: changes in coral reef fish assemblages along a depth gradient down to 65 m. Mar. Ecol. Prog. Ser. 371, 253–262. doi: 10.3354/meps07591
De Bakker, D. M., Meesters, E. H., Bak, R. P. M., Nieuwland, G., and Van Duyl, F. C. (2016). Long-term shifts in coral communities on shallow to deep reef slopes of Curaçao and Bonaire: are there any winners? post-hoc. Mar. Sci. 3:247. doi: 10.3389/fmars.2016.00247
De Meyer, K., and MacRae, D. (2006). Bonaire National Marine Park Management Plan. Part 1. Background. The Dutch Caribbean Nature Alliance (Bonarte) and Coastal Zone Management. Available online at: http://ec.europa.eu/ourcoast/download.cfm?fileID=865
Fernandes, P. G., Stevenson, P., Brierley, A. S., Armstrong, F., and Simmonds, E. J. (2003). Autonomous underwater vehicles: future platforms for fisheries acoustics. ICES J. Mar. Sci. 60, 684–691. doi: 10.1016/S1054-3139(03)00038-9
Forrest, A. L., Trembanis, A. C., and Todd, W. L. (2012). Ocean floor mapping as a precursor for space exploration. J. Ocean Technol. 7, 71–87.
Fricke, H., and Meischner, D. (1985). Depth limits of Bermudan scleractinian corals: a submersible survey. Mar. Biol. 88, 175–187. doi: 10.1007/BF00397165
Harriott, V. H., and Banks, S. B. (2002). Latitudinal variation in coral communities in eastern Australia: a qualitative biophysical model of factors regulating coral reefs. Coral Reefs 21, 83–94. doi: 10.1007/s00338-001-0201-x
Harris, P. T., Bridge, T. C. L., Beaman, R. J., Webster, J. M., Nichol, S. L., and Brooke, B. P. (2013). Submerged banks in the Great Barrier Reef, Australia, greatly increase available coral reef habitat. ICES J. Mar. Sci. 70, 284–293. doi: 10.1093/icesjms/fss165
Jenness, J. S. (2004). Calculating landscape surface area from digital elevation models. Wild Soc. Bull. 32, 829–839. doi: 10.2193/0091-7648(2004)032[0829:CLSAFD]2.0.CO;2
Kahng, S. E., Garcia-Sais, J. R., Spalding, H. L., Brokovich, E., Wagner, D., Weil, E., et al. (2010). Community ecology of mesophotic coral reef ecosystems. Coral Reefs 29, 255–275. doi: 10.1007/s00338-010-0593-6
Keller, B. M. (2011). Imaging the Twilight Zone: the Morphology and Distribution of Mesophotic Zone Features, a Case Study from Bonaire, Dutch Caribbean. MSc thesis, University of Delaware, 168.
Leichter, J. J., Shellenbarger, G., Genovese, S. J., and Wing, S. R. (1998). Breaking internal waves on a Florida (USA) coral reef: a plankton pump at work? Mar. Ecol. Prog. Ser. 166, 83–97. doi: 10.3354/meps166083
Lesser, M. P., Slattery, M., and Leichter, J. J. (2009). Ecology of mesophotic coral reefs. J. Exp. Mar. Biol. Ecol. 375, 1–8. doi: 10.1016/j.jembe.2009.05.009
Locker, S., Armstrong, R., Battista, T., Rooney, J., Sherman, C., and Zawada, D. (2010). Geomorphology of mesophotic coral ecosystems: current perspectives on morphology, distribution, and mapping strategies. Coral Reefs 29, 329–345. doi: 10.1007/s00338-010-0613-6
Moline, M. A., Blackwell, S. M., Allen, B., Austin, T., Forrester, N., Goldsborogh, R., et al. (2005). Remote Environmental Monitoring UnitS: an autonomous vehicle for characterizing coastal environments. J. Atmos. Ocean. Technol. 22, 1798–1809. doi: 10.1175/jtech1809.1
Morton, R. A., Richmond, B. M., Jaffe, B. E., and Gelfenbaum, G. (2008). Coarse-clast ridge complexes of the Caribbean: a preliminary basis for distinguishing tsunami and storm-wave origins. J. Sed. Res. 78, 624–637. doi: 10.2110/jsr.2008.068
Patterson, M. R., and Relles, N. J. (2008). “Autonomous underwater vehicles resurvey bonaire: a new tool for coral reef management,” in Proceedings of the 11th International Coral Reef Symposium, Vol. 1 (Lauderdale, FL), 546–550.
Patterson, M. R., Doolittle, D. F., Rahman, Z., and Mann, R. L. (2007). Method for Identification and Quantification of Biological Sonar Targets in Liquid Medium. U. S. Patent 7,221,621. Washington, DC: U.S. Patent and Trademark Office.
Patterson, M., Hiller, T., and Trembanis, A. (2008). Exploring coral reef sustainability. Hydro Int. 12, 10–15.
Pike, W. J. (2011). Optical Benthic Imagery Survey in a Lacustrine Basin Using an Autonomous Underwater Vehicle. MSc thesis, University of British Columbia, Vancouver, BC.
Porter, J. W. (1972). Patterns of species diversity in Caribbean reef corals. Ecology 53, 745–748. doi: 10.2307/1934796
Prada, M. C., Appeldoorn, R. S., and Rivera, J. A. (2008). Improving coral reef habitat mapping of the Puerto Rico insular shelf using side scan sonar. Mar. Geod. 31, 49–73. doi: 10.1080/01490410701812170
Preston, J. M., Christey, A. C., Bloomer, S. F., and Beaudet, I. L. (2001). “Seabed classification of multibeam sonar images,” Proceedings of the MTS/IEEE Conference, 01.
Raineault, N. A., Trembanis, A. C., and Miller, D. (2012). Mapping benthic habitats in Delaware Bay and the coastal Atlantic: acoustic techniques provide greater coverage and high resolution in complex shallow-water environments, Estuar. Coasts 35, 682–699. doi: 10.1007/s12237-011-9457-8
Raineault, N. A., Trembanis, A. C., Miller, D. C., and Capone, V. (2013). Interannual changes in seafloor surficial geology at an artificial reef site on the inner continental shelf. Cont. Shelf Res. 58, 67–78. doi: 10.1016/j.csr.2013.03.008
Relles, N. J., and Patterson, M. R. (2011). “AUVs (ROVs),” in Encyclopedia of Modern Coral Reefs, ed D. Hopley (Dordrecht: Springer), 71–75.
Smale, D. A., Kendrick, G. A., Harvey, E. S., Langlois, T. J., Hovey, R. K., Van Niel, K. P., et al. (2012). Regional-scale benthic monitoring for ecosystem-based fisheries management (EBFM) using an autonomous underwater vehicle (AUV). ICES J. Mar. Sci. 69, 1108–1118. doi: 10.1093/icesjms/fss082
Steneck, R., and McClanahan, T. (2004). A Report on the Status of the Coral Reefs of Bonaire with Advice on the Establishment of fish Protection Areas. Pew Charitable Trust Report.
Stokes, M. D., Leichter, J. J., and Genovese, S. J. (2010). Long-term declines in coral cover at Bonaire, Netherlands Antilles. Atoll Res. Bull. 582, 1–21. doi: 10.5479/si.00775630.582.1
Trembanis, A. C., DuVal, C., Beaudoin, J., Schmidt, V., Miller, D., and Mayer, L. (2013). A detailed seabed signature from hurricane sandy revealed in bedforms and scour. Geochem. Geophys. Geosyst. 14, 4334–4340. doi: 10.1002/ggge.20260
Trembanis, A. C., Forrest, A. L., Miller, D. C., Lim, D. S. S., Gernhardt, M. L., and Todd, W. L. (2012). Multiplatform ocean exploration: insights from the NEEMO space analog mission. J. Mar. Technol. Soc. 46, 7–19. doi: 10.4031/MTSJ.46.4.2
van Duyl, F. C. (1985). Atlas of the Living Reefs of Curaçao and Bonaire (Netherlands Antilles). Vrije Universiteit, Utrecht.
Keywords: Mesophotic Coral Ecosystem (MCE), Autonomous Underwater Vehicle (AUV), Acoustic Ground Discrimination System (AGDS), Caribbean, side-scan sonar, swath bathymetry, seafloor rugosity
Citation: Trembanis AC, Forrest AL, Keller BM and Patterson MR (2017) Mesophotic Coral Ecosystems: A Geoacoustically Derived Proxy for Habitat and Relative Diversity for the Leeward Shelf of Bonaire, Dutch Caribbean. Front. Mar. Sci. 4:51. doi: 10.3389/fmars.2017.00051
Received: 30 September 2016; Accepted: 14 February 2017;
Published: 01 March 2017.
Edited by:
Steven G. Ackleson, Naval Research Laboratory, USAReviewed by:
Joaquin Rodrigo Garza-Pérez, National Autonomous University of Mexico (UNAM), MexicoBryan Costa, National Oceanic and Atmospheric Administration (NOAA), USA
Copyright © 2017 Trembanis, Forrest, Keller and Patterson. This is an open-access article distributed under the terms of the Creative Commons Attribution License (CC BY). The use, distribution or reproduction in other forums is permitted, provided the original author(s) or licensor are credited and that the original publication in this journal is cited, in accordance with accepted academic practice. No use, distribution or reproduction is permitted which does not comply with these terms.
*Correspondence: Arthur C. Trembanis, art@udel.edu