Microbially-Mediated Transformations of Estuarine Dissolved Organic Matter
 Patricia M. Medeiros1*
  Michael Seidel1,2
  Scott M. Gifford3
  Ford Ballantyne4
  Thorsten Dittmar2
  William B. Whitman5
  Mary Ann Moran1
- 1Department of Marine Sciences, University of Georgia, Athens, GA, USA
- 2Research Group for Marine Geochemistry (ICBM-MPI Bridging Group), Institute for Chemistry and Biology of the Marine Environment, Carl von Ossietzky University of Oldenburg, Oldenburg, Germany
- 3Department of Marine Sciences, University of North Carolina, Chapel Hill, NC, USA
- 4Odum School of Ecology, University of Georgia, Athens, GA, USA
- 5Department of Microbiology, University of Georgia, Athens, GA, USA
Microbially-mediated transformations of dissolved organic matter (DOM) in a marsh-dominated estuarine system were investigated at the molecular level using ultrahigh resolution mass spectrometry. In addition to observing spatial and temporal variability in DOM sources in the estuary, multiple incubations with endogenous microorganisms identified the influence of DOM composition on biodegradation. A clear microbial preference for degradation of compounds associated with marine DOM relative to those of terrestrial origin was observed, resulting in an overall shift of the remaining DOM toward a stronger terrigenous signature. During short, 1-day long incubations of samples rich in marine DOM, the molecular formulae that were enriched had slightly smaller mass (20–30 Da) and number of carbon atoms compared to the molecular formulae that were depleted. Over longer time scales (70 days), the mean differences in molecular mass between formulae that were depleted and enriched were substantially larger (~270 Da). The differences in elemental composition over daily time scales were consistent with transformations in functional groups; over longer time scales, the differences in elemental composition may be related to progressive transformations of functional groups of intermediate products and/or other reactions. Our results infused new data toward the understanding of DOM processing by bacterioplankton in estuarine systems.
Introduction
Bacterioplankton control the flux of dissolved organic matter (DOM) into the coastal microbial food web and influence the release of inorganic carbon to atmospheric and offshore reservoirs. Thousands of compounds make up the estuarine DOM pool, each with different biological turnover rates (Poretsky et al., 2010). This complex DOM pool is processed by a diverse community of heterotrophic bacteria composed of hundreds of taxa (Giovannoni and Stingl, 2005) with varying ecological strategies for the uptake and metabolism of carbon using largely uncharacterized biochemical pathways (Cottrell and Kirchman, 2000; Mou et al., 2007). While measures of changes in chemical characteristics and bulk metabolic rates have provided considerable insights into DOC turnover (Kirchman et al., 2001; Repeta et al., 2002; Benner and Kaiser, 2003; Hertkorn et al., 2006), alone they are insufficient to fully understand the transformation of this complex mixture.
Riverine input can be a large source of DOM of terrigenous origin to estuaries and coastal areas (Hedges et al., 1997; Fichot and Benner, 2014; Medeiros et al., 2016). As riverine DOM is transported toward the ocean, its quantity and composition is often altered (Cole et al., 2007) by a variety of chemical, biological and physical processes (Tzortziou et al., 2008), making estuaries hot spots of DOM cycling. Significant gradients exist in the composition of DOM in estuaries (Sleighter and Hatcher, 2008; Medeiros et al., 2015c; Seidel et al., 2015). In general, DOC concentrations and the DOM aromaticity decrease toward the ocean (Abdulla et al., 2013) at the same time that DOM lability increases (D'Andrilli et al., 2015). Despite intense cycling, a large portion of compounds persist during estuarine passage (Osterholz et al., 2016).
Understanding transformations of the DOM pool in estuaries is important to constraint the characteristics of the DOM introduced to the coastal zone (Bauer and Bianchi, 2011) that may ultimately reach the deep sea (Opsahl and Benner, 1997). Characterizing DOM degradation remains challenging, however, due to the complex nature of DOM, the variety of microbial metabolic pathways, and the various environmental conditions that regulate bacterial metabolism (Eichinger et al., 2011). Despite these challenges, much has been learned by tracking changes in DOC concentration and DOM composition during incubation experiments, including the variation in biomineralization rates as a function of DOM source (e.g., Moran and Zepp, 1997; Obernosterer and Benner, 2004), the relationship of microbial activity to the production of labile (e.g., Kawasaki and Benner, 2006) and refractory (e.g., Ogawa et al., 2001; Jiao et al., 2010; Lechtenfeld et al., 2015) DOM, and how bacterial-derived refractory material compares structurally to refractory DOM in the ocean (e.g., Osterholz et al., 2015). Studies using ultrahigh resolution mass spectrometry have revealed additional molecular-level transformations in DOM as a result of microorganism activity (Kujawinski et al., 2004), including a significant decrease in the molecular diversity of terrigenous DOM (Seidel et al., 2015) and a preferential degradation of oxygen-rich molecules on a time scale of several days (Kim et al., 2006; Medeiros et al., 2015c; Seidel et al., 2015).
Here, we use incubation experiments lasting from 24 h to 70 days to identify microbially-mediated transformations in DOM composition based on ultrahigh resolution mass spectrometry analysis. The incubations were pursued using water from three sites along a marsh-dominated estuary characterized by strong spatial and temporal variability in DOM sources, including terrigenous, marine, and salt marsh inputs (Medeiros et al., 2015a). The estuarine system is characterized by large interannual variability, and some of the incubations captured a record drought during fall 2012, when river discharge was the lowest recorded since measurements began in 1931 (Medeiros et al., 2015a). The two main goals of this study were to (1) identify how DOM from different sources influence the patterns of DOM transformation at the molecular level due to biodegradation, and to (2) identify the dominant changes in DOM composition resulting from microbially-mediated transformations over time scales from hours to months.
Methods
Sample Collection and Microbial Incubations
DOM was collected in the Altamaha-Doboy-Sapelo Estuary off the southeastern U.S. coast in November 2012 and May 2013. Samples were collected in triplicate at three locations: the Altamaha River (salinity S = 0 to 11; strong terrigenous inputs), the mouth of Doboy Sound (S = 22.9 to 34.6; large marine influence) and near the head of Sapelo Sound (S = 9.1 to 31.5; mixture of terrigenous, marine and salt marsh inputs; Medeiros et al., 2015a) (Figure S1). All samples were collected during high tide. Immediately after collection, triplicate water samples from each site were filtered sequentially through Whatman GF/D filters (pre-combusted at 450°C for 5 h; nominal 2.7 μm pore size) and 0.2 μm Pall Supor membrane filters into pre-combusted amber glass bottles. Fifty milliliters aliquots of the filtrate from each sampling site were set aside in separated beakers for the preparation of microbial inocula. For that, the 0.2 μm filters from all locations were aseptically cut into pieces and equal areas of the filters were pooled into 50 mL aliquots of 0.2 μm filtrate from each of the three sites and stirred for 30 min. The resulting filtrates, now containing microbes from all sites, were added back to the appropriate set of bottles. This ensured that functional capabilities of the microbes were similar during all incubations and changes in DOM composition could therefore be attributed predominantly to the different initial composition of the DOM pools. We note that fine particles that passed through the GF/D filter but were retained in the 0.2 μm membrane were likely also introduced to the bottles. After the addition of inorganic nutrients (20 μM Na2PO4 and 50 μM NH4Cl), a triplicate set from each sampling site was immediately filtered (0.2 μm) in order to characterize the initial condition for each experiment. Aliquots were stored frozen for DOC analysis, and the remaining filtrates were acidified to pH 2 (using HCl) and DOM was extracted using solid phase extraction (SPE) cartridges (Agilent Bond Elut PPL) as in Dittmar et al. (2008). We refer to those samples as T0.
The remaining triplicate sets were incubated in the dark at the temperature measured at the time of collection for up to 70 days. At days 35 and 70, samples were filtered, acidified, and DOM was extracted using PPL cartridges as described previously. These samples are referred to as T35 and T70. Shorter-term incubations lasting 24 h were also conducted with water collected at the mouth of Doboy Sound in February and in December of 2011 (referred to as T1). Aliquots for DOC analysis were collected for all incubations as described above (i.e., prior to acidification, stored frozen).
Chemical Analyses
In all cases, DOC concentration in water samples and extracts (i.e., dried and redissolved in ultrapure water) was measured with a Shimadzu TOC-VCPH analyzer. Analytical accuracy and precision were tested against the Consensus Reference Material (Hansell, 2005) and were better than 5%. SPE extraction efficiency across all samples was 75 ± 5% of the DOC. Bulk δ13C of extracted DOC (SPE-DOC) was measured with a Finnigan MAT 251 isotope ratio mass spectrometer after complete drying. Procedural blanks did not yield detectable amounts of carbon isotope contamination. The molecular composition of DOM extracts (15 mg C L−1 in 1:1 methanol/water) was analyzed using a 15T Fourier transform ion cyclotron resonance mass spectrometer (FT-ICR MS; Bruker Daltonics) with electrospray ionization (negative mode) as in Seidel et al. (2014). Spectra were internally calibrated with >100 known CxHyOz molecular formulae over the mass range in the samples. With this calibration procedure, a mass error of <0.1 ppm was achieved. Before each sample set, blank checks with methanol and ultrapure water were measured. Molecular formulae were calculated in the mass range between 150 and 850 Da by applying the following restrictions: 12C1−1301H1−200O1−15014N0−4S0−2P0−2. Assignment of molecular formulae was done considering a maximum mass error of 0.5 ppm and using the criteria described by Rossel et al. (2013). Only compounds with a signal-to-noise ratio of 4 or higher were used in the analysis to eliminate inter-sample variability based on peaks that were close to the limit of detection. Additional details of molecular formulae assignment are given in Seidel et al. (2014). A sample from the North Equatorial Pacific Intermediate Water collected at station NELHA off Big Island in Hawaii at 674 m water depth (Osterholz et al., 2015; Riedel et al., 2016) was also analyzed repeatedly (41 times) in order to characterize differences in DOM composition as identified by FT-ICR MS that arise solely due to instrument variability.
Patterns of variability in FT-ICR MS-derived DOM composition were distinguished by principal component (PC) analysis using all replicates simultaneously as in Medeiros et al. (2015a,b,c). All PCs shown here are significantly different (95% confidence level) from results of PC analysis of spatially and temporally uncorrelated random processes (Overland and Preisendorfer, 1982). The Wilcoxon rank-sum test was used for comparisons between groups of compounds, as in Osterholz et al. (2016).
Results
Spatial and Temporal Variations in DOM Composition
A detailed characterization of spatial and temporal differences in DOM composition in this system has been presented in Medeiros et al. (2015a). We briefly summarize results here for comparison with microbially-mediated transformations described in the next section. DOC concentrations were substantially lower near the ocean at Doboy Sound than at the other sites (Table S1) and increased at all locations in May 2013 when river discharge was high. The pre-incubation samples (T0; solid symbols) were spread along the first PC (PC1) axis (Figure 1A), which separated samples with high salinity (e.g., Doboy in November 2012) from those with low salinity (e.g., Altamaha in May 2013) (Table S1) (see caption of Figure 1 for example of interpretation of the analysis). The correlation coefficient between PC1 and salinity for the pre-incubation samples was −0.87 (p < 0.01). The loading of PC1 (Figure 1B) shows a pattern typical of river-to-ocean transects (Medeiros et al., 2015c), with high salinity samples enriched with compounds with high H/C ratios compared to low-salinity samples, which is consistent with the higher abundance of aliphatic structures in marine DOM (Sleighter and Hatcher, 2008; Osterholz et al., 2016). This is also consistent with the strong gradient in DOM sources in the system associated with terrigenous vs. oceanic inputs (Medeiros et al., 2015a).
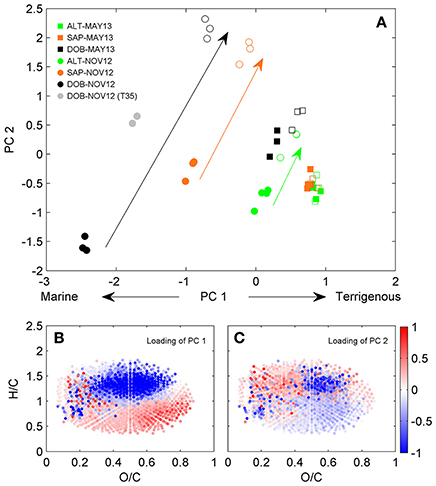
Figure 1. Principal component analysis of DOM composition. (A) Scores of the first two principal components are shown color coded. Solid and open symbols represent T0 and T70, respectively. Small gray circles are T35 for incubation of Doboy Sound water in November 2012. Color coded arrows are shown for illustrative purposes, emphasizing the extent of transformation in DOM composition between pre- and post-incubated samples in November 2012 based on the first two principal components (i.e., samples close together in principal component space are more similar to each other, while samples that are far apart are more different to each other in terms of DOM composition). Van Krevelen diagrams color coded with loadings of (B) PC1 and (C) PC2 are also shown. For a given sample, if the score of a PC (shown in panel A) is negative, then DOM is relatively enriched with compounds associated with molecular formulae whose loadings for that PC (shown in B or C) are negative, and depleted with those whose loadings are positive. The opposite is true if the score of a given PC is positive.
For any given location, samples from May 2013 had higher DOC concentrations and DOM with a more terrigenous character than samples from November 2012 (e.g., samples from Altamaha River in May 2013 had higher PC1 scores than samples from Altamaha River in November 2012; the same is true for samples from Sapelo to Doboy Sounds; Figure 1A), a pattern consistent with their lighter δ13C values (Table S1). This difference probably resulted from a severe drought in fall 2012, when the Altamaha River discharge was anomalously low (Medeiros et al., 2015a). During that time, salinity at all sampling sites was higher than in May 2013 (Table S1), which is consistent with the more marine character of the DOM observed in November 2012.
Microbially-Mediated Transformations in DOM Composition
In addition to capturing the gradient in DOM composition in the estuary (section Spatial and Temporal Variations in DOM Composition), the PC analysis shown in Figure 1 also captured microbially-mediated transformations of the DOM. The largest transformations in DOM as captured by the first 2 principal components [i.e., the largest distances in PC space between T0 (solid symbols) and T70 (open symbols) for a given incubation in Figure 1A] occurred in samples with a more marine character (i.e., Doboy Sound in November 2012, black circles), decreasing progressively in samples with a more terrigenous signature. Incubations of Altamaha River water in May 2013 (green squares), when discharge was near the seasonal maximum (Medeiros et al., 2015a), yielded no significant changes in DOM composition as detected by the first 2 PCs (a different pattern of DOM transformation was observed in that case; see Figure S2).
It is interesting to note that microbially-mediated transformations resulted in changes on both the first and second PCs. The PC1 scores at the end of the incubations (T70) were generally higher than those at the start of the incubations (T0). Since large PC1 scores are associated with terrigenous DOM (see section Spatial and Temporal Variations in DOM Composition), this indicates that microbial degradation resulted in DOM with a more terrigenous character. This presumably resulted from preferential degradation of marine DOM, which is indeed thought to be more labile than freshwater DOM (D'Andrilli et al., 2015). As marine DOM (i.e., molecular formulae shown in blue in Figure 1B) was degraded during the experiment, terrigenous DOM (i.e., molecular formulae shown in red in Figure 1B) became relatively more important compared to the initial state. The shift toward a terrigenous signature (i.e., a shift toward high values along the PC1 axis) was stronger in the samples that had a stronger marine signature initially (Figure 1A). For the incubations of Doboy Sound water in November 2012, in particular, PC1 changed substantially during the incubation, representing 53% of the distance along the PC1 axis between marine (solid black circle, PC1 = −2.45 ± 0.03) and terrigenous (solid green square, PC1 = +0.86 ± 0.05) DOM. In other words, PC1 (Figures 1A,B) captured the fraction of the DOM that is statistically different between the sites and is related to the gradient in DOM composition due to terrigenous vs. marine inputs (as shown in section Spatial and Temporal Variations in DOM Composition). Biodegradation during the incubation of Doboy Sound water from November 2012 resulted in large enough changes in that fraction captured by PC1 that the DOM composition as identified by FT-ICR MS at the end of the experiment (open black circles in Figure 1A) was nearly as similar to riverine DOM (solid green squares) as it was to the original pre-incubated marine DOM (solid black circles). We note that photo-degradation generally produces the opposite effect, with riverine DOM resembling marine DOM in its broad molecular composition after extensive photo-degradation mainly due to removal of aromatics (Riedel et al., 2016).
Pre- and post-incubation samples were also characterized by different PC2 scores (Figure 1A). Microbially-mediated transformations therefore also resulted in a shift in DOM composition that did not fall along the terrigenous-marine gradient captured by PC1. The loading of PC2 reveals that molecules characterized by low O/C and high H/C ratios (molecules in red in Figure 1C) were relatively enriched at the end of the incubations. A detailed investigation of those changes is presented in the next section.
DOM Transformations at Doboy Sound
These analyses show that microbial degradation resulted in shifts in DOM composition so that the pool as a whole lost some of its marine characteristics and became more similar to terrigenous DOM. However, the analyses included samples from different locations and times. To examine the specific chemical formula changes occurring during biodegradation, the PC analysis was repeated considering only incubations of DOM from Doboy Sound in November 2012. This removed effects of spatial and temporal variability in DOM composition from the analysis, so that transformations could be primarily attributed to biodegradation.
DOC concentrations decreased progressively during the course of the incubation (Table S1), indicating remineralization of a fraction of the DOM pool. The score of the first principal component (referred to as PC1DOB−long) increased with time (Figure 2A), and compounds associated with molecular formulae shown in blue in Figure 2B (negative loading) decreased in relative abundance during microbial processing while those associated with formulae shown in red (positive loading) increased with processing. As such, compounds that decreased or increased in relative abundance had distinct chemical characteristics. There was a relative enrichment of molecules that occupy the upper left corner of the van Krevelen diagram after the incubation (Figure 2B), i.e., a shift toward low O/C and high H/C ratios, which is consistent with molecular transformations observed in dark incubations of DOM from the Amazon River mouth (Medeiros et al., 2015c; Seidel et al., 2015). Additionally, while formulae whose relative abundances strongly decreased after the incubation (i.e., more negative loadings of PC1DOB−long in Figure 2B) were characterized by high masses (553.5 ± 78.7 Da), formulae whose relative abundances were enriched after the incubation (i.e., more positive PC1DOB−long loading in Figure 2B) were characterized by significantly lower masses (286.0 ± 93.9 Da) (Figure 3A and Table 1; Wilcoxon rank-sum test, p < 0.01). Molecular formulae associated with compounds that were preferentially depleted during the incubation were also characterized by a significantly higher numbers of carbon, hydrogen and oxygen atoms compared to compounds whose relative abundance enriched due to microbially-mediated transformations in DOM composition (Figures 3B–D; Wilcoxon rank-sum test, p < 0.01). They were also characterized by lower aromaticity indices (AI*; a measure of the aromaticity of the molecules; Koch and Dittmar, 2006, 2016; Figure 3H), although the differences are small (but still significant; Wilcoxon rank-sum test, p < 0.01). Lastly, the transformations in DOM composition resulting from biodegradation (Figure 2B) were compared with the DOM composition variability associated with differences in terrigenous and marine inputs (Figure 1B) on a molecular basis. Molecular formulae associated with compounds whose relative abundances decreased after the microbial transformation (blue dots in Figure 2B) were generally also associated with compounds enriched in marine DOM (blue dots in Figure 1B), although there is substantial scatter around the bin averages (Figure 3E). Molecular formulae associated with compounds whose relative abundances increased after the incubation, on the other hand, were associated with compounds enriched in terrigenous DOM, with much smaller scatter around the bin averages. Thus, the marine DOM appeared to be preferentially transformed during the incubations, leaving behind relatively more terrigenous DOM, which is consistent with results shown in Figure 1. The large scatter around the formulae associated with the compounds depleted during the incubation (Figure 3E) indicated that, although there is a preference for biotransformation of marine DOM, a fraction of the compounds enriched in terrigenous DOM were also transformed during the incubation.
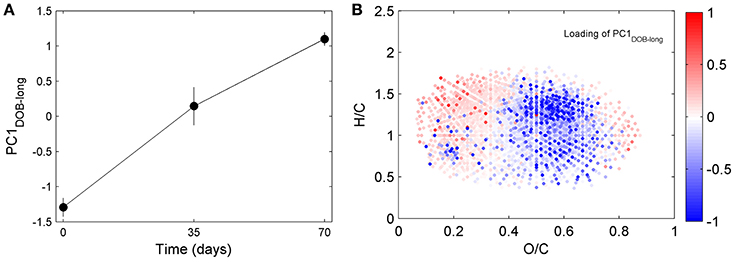
Figure 2. Principal component analysis of DOM composition for long incubation of Doboy Sound water in November 2012. Samples collected at T0, T35, and T70 are separated along PC1DOB−long axis. (A) Time series of scores of PC1DOB−long during incubation. (B) Van Krevelen diagram color coded with loading of PC1DOB−long. Molecular formulae shown in red were relatively enriched at the end of the incubation.
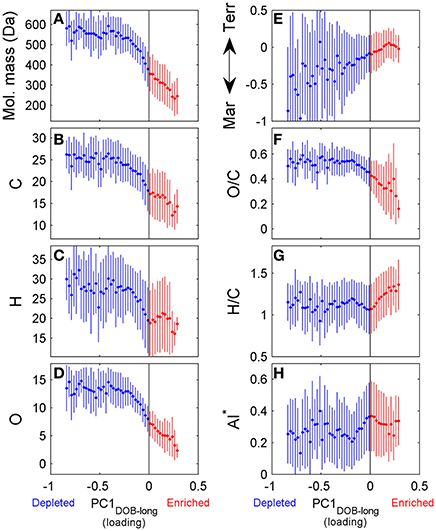
Figure 3. Chemical characteristics of molecular formulae whose relative abundances were depleted (blue) or enriched (red) during incubation of Doboy Sound water in November 2012. Loading of PC1DOB−long shown on x-axis in all panels are values from Figure 2B. Fifty uniformly spaced bins were selected spanning the range of the values of the loading of PC1DOB−long. Then, for each bin, the average ±1 standard deviation of each chemical characteristic [molecular mass (A), number of carbon (B), hydrogen (C), and oxygen (D) atoms, oxygen/carbon (F) and hydrogen/carbon (G) ratios] were computed. Y-axis on panel (E) distinguishing marine and terrigenous DOM are values from Figure 1B. AI*: modified aromaticity index (H) (Koch and Dittmar, 2006, 2016).
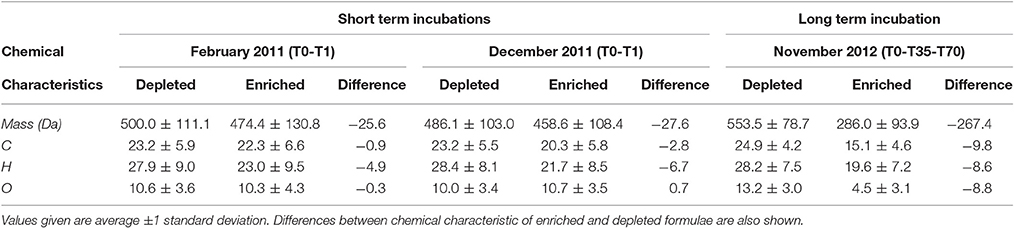
Table 1. Chemical characteristics of formulae whose relative abundances were enriched vs. depleted during incubations of Doboy Sound samples.
Repeating the PC analysis using only samples from days 0 to 35 (T0 and T35), T0 and T70, or T35 and T70 led to results similar to those obtained using all time points together. This indicates that the dominant pattern of DOM compositional change associated with biodegradation remained similar during the course of the incubation, at least at the monthly time scale captured by the sampling. Moreover, when the T0, T35 and T70 samples from Doboy Sound were analyzed together, approximately 60% of the total change in PC1DOB−long occurred in the first 35 days (i.e., from −1.29 ± 0.13 to 0.15 ± 0.27 along PC1DOB−long axis; Figure 2A), with the remaining 40% of the change (i.e., from 0.15 ± 0.27 to 1.10 ± 0.09; Figure 2A) occurring in the second half of the incubation. This indicates that active DOM transformations occurred throughout the experiment.
Changes in DOM Composition Over Short Time Scales
We have also investigated changes in DOM composition during the 24-h long incubations (T0-T1; Table 1). At those short time scales, the overall change in DOC concentrations were quite small (Table S1). Molecular formulae which were enriched after the 1-day experiments had chemical characteristics that were similar to those whose relative abundances decreased, occupying similar regions in van Krevelen space (Figure 4). For example, molecular formulae that were preferentially depleted after the 1-day incubations had masses of 485–500 Da, while formulae that were preferentially enriched had masses of 460–475 Da (Table 1; those differences were statistically significant; Wilcoxon rank-sum test, p < 0.01). Thus, the difference in the average mass of molecular formulae whose relative abundance decreased vs. increased during the short incubations (~Δ mass = 25–30 Da) was substantially smaller than the difference observed in the incubation lasting 70 days (~Δ mass = 270 Da; Table 1). Likewise, the differences in the number of carbon and oxygen atoms between compounds whose relative abundances decreased vs. increased in the 1-day incubations were also small (23 vs. 20–22 carbon atoms, respectively; unaltered for oxygen atoms; Table 1).
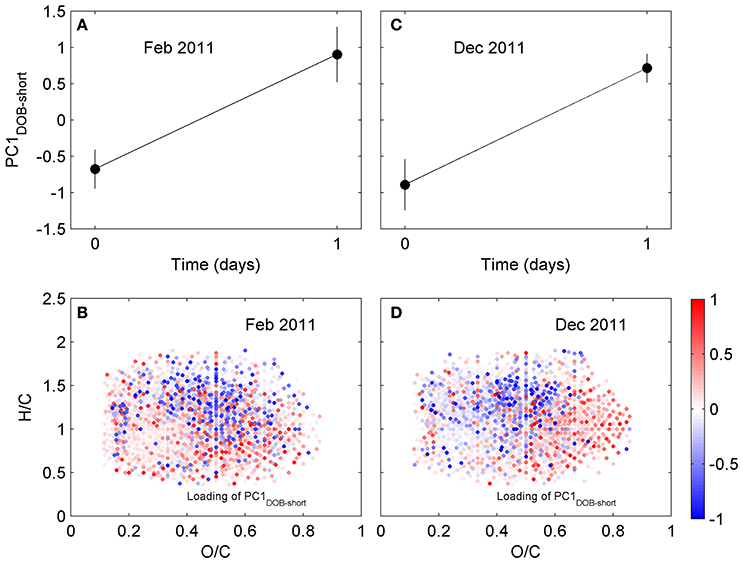
Figure 4. Principal component analysis of DOM composition for short incubation of Doboy Sound water in (A,B) February and (C,D) December 2011. (A,C) Time series of scores of PC1DOB−short during incubation. (B,D) Van Krevelen diagram with loading of PC1DOB−short. Molecular formulae shown in red were relatively enriched at the end of the incubations.
Changes in DOM Composition at Sapelo Sound and the Altamaha River
We also pursued a separate PC analysis for the other sets of replicates from each long incubation (e.g., from Sapelo Sound in May 2013, from Altamaha River in November 2012), similarly to the analysis presented in Figures 2, 3. The analysis revealed a progressive shift in the attributes of transformed DOM (Figure 5). In the 70-day incubation of DOM from the Altamaha River in May 2013 (i.e., water rich in terrigenous material; Figure 1), the compounds whose relative abundance enriched and decreased during the incubation had similar molecular masses (Figure 5). In that regard, results were qualitatively similar to the 1-day incubation (T0-T1) of the more marine-influenced Doboy Sound DOM (Table 1). As the marine character of the sample increased (as identified in Figure 1A), the mass difference between decreasing vs. increasing compounds also increased (Figure 5). For the incubation of Doboy Sound water from November 2012, increasing the duration of the experiment from 35 to 70 days led to a slight (but statistically significant) increase in the mass difference between compounds depleted vs. enriched.
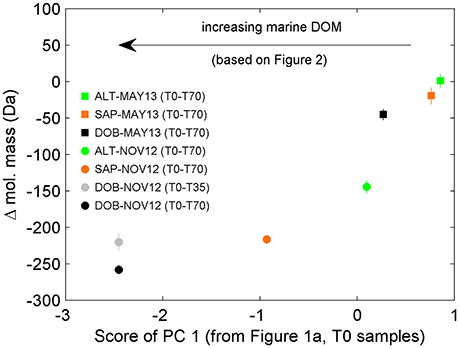
Figure 5. Difference in average mass of molecular formulae whose relative abundances were enriched vs. depleted during the incubations. Negative values indicate that molecular formulae whose relative abundance were significantly enriched have smaller mass than those significantly depleted. The marine signature of the DOM pool as detected by PC analysis (see Figure 1) increases from right to left (e.g., more terrigenous signature for Altamaha River water in May 2013, ALT-MAY13; more marine signature for Doboy Sound water in November 2012, DOB-NOV12). Error bars are standard error of the mean. In some cases, error bars are smaller than the size of the symbols.
Discussion
Temporal Changes in DOM Transformation
Since the average mass difference between compounds whose relative abundance significantly increased vs. decreased in the short incubation of Doboy Sound water is small (average of 20–30 Da; Table 1) and they often occupy similar regions in van Krevelen space (Figure 4), it is possible that those differences are reflecting transformations of functional groups. Side chain oxidation (e.g., Filley et al., 2002), demethylation, or hydroxylation (e.g., Crawford and Crawford, 1980) of compounds present in the initial DOM pool (i.e., at T0) would lead to a reduction in the abundance of those compounds at the end of the incubation and to an increase in the abundance of compounds with slightly lower molecular masses. For example, vanillic acid (~168 Da) can be converted via demethylation to protocatechuic acid (~154 Da) (Merkens et al., 2005). In this case, the difference in the mass of the compounds that were consumed and produced is small at 14.0157 Da (-CH2). If multiple progressive transformations occur, however, then the difference in the mass of the compounds consumed and produced will be larger (Bugg et al., 2011). As an example, the lignin model biphenyl compound 5,5′-dehydrodivanillate (~332 Da) can be transformed by bacterial degradation via an O-demethylation followed by a subsequent ring cleavage (Masai et al., 2007). If the resulting product is further hydrolyzed, decarboxylated, and then demethylated, protocatechuic acid is generated. In this case, the change in the mass between compounds consumed and produced progressively increases with each transformation (i.e., O-demethylation, ring cleavage, etc), reaching ~178 Da for the end result (i.e., comparing 5,5′-dehydrodivanillate and protocatechuic acid). Although, those examples come from investigations of microbial degradation of terrigenous material in soils, they provide illustrations of how biodegradation of DOM may result in small shifts in masses initially, and to large shifts in masses later on associated with additional, progressive transformations of the intermediate products. This scenario is consistent with the progression observed for microbially-mediated transformations in DOM composition in the incubations shown here. For Doboy Sound water, for example, the short term incubations yielded small differences in the average mass of the compounds whose relative abundances significantly decreased vs. increased (Table 1), which could be associated with the removal of a functional group (e.g., demethylation). If those resulting products are further transformed progressively via modification of additional functional groups (e.g., demethylation followed by hydroxylation and decarboxylation), then a large difference in the average mass of the compounds whose relative abundances significantly decreased vs. increased would be expected, which is consistent with results from the long-term incubations (Table 1). Alternatively, the large difference in masses between consumed and produced compounds in the long-term incubation could also be a result of different reactions. It will be interesting to see if emerging tools in analytical chemistry, microbiology and informatics (Moran et al., 2016) will allow for future studies to identify the specific pathways that occur in the transformation of DOM.
Microbially-Mediated DOM Compositional Changes at the Molecular Level
In the previous section, we hypothesized that progressive modifications of functional groups could explain why the differences in the masses of compounds whose relative abundance decreased vs. increased was small in short-term incubations, and comparatively larger in long-term experiments. Here, we compare the elemental composition of the compounds that changed significantly during the incubations to identify if those changes are consistent with that hypothesis.
The molecular formulae associated with the compounds whose relative abundance changed during the 1-day incubations have masses that are similar to each other. This does not necessarily mean, however, that they can be related to each other via transformations of side functional groups. Compounds with similar masses can have very different elemental compositions, and FT-ICR MS analysis does not give direct information about structure (e.g., Longnecker et al., 2015). We therefore investigated the possibility of transformations of functional groups using a strictly probabilistic approach. The analysis began by first selecting all molecular formulae associated with compounds whose relative abundance significantly increased after a given incubation. For the 1-day incubation (triplicate) from February 2011, for example, there were 496 such molecular formulae. For each of these, we computed the difference between its elemental composition and the elemental composition of all molecular formulae associated with compounds whose relative abundance decreased during the incubation (there were 408 such formulae in the February 2011 incubation). Therefore, the February 2011 calculation yielded a total of 202,368 (496 × 408) possible composition differences of potential substrates and products. Lastly, we sorted those composition differences to identify how often a potential change in elemental composition appeared (see Figure S3 for an example of the calculation). The rationale behind this calculation is that, if the microbial community is transforming the DOM via modification of a specific functional group, then it is more likely that a difference in elemental composition between compounds whose relative abundance decreased vs. increased equivalent to that modification will appear more often in the difference matrix. For example, if the microbial community is actively demethylating (i.e., targeting –CH3), then it is more likely that a difference in elemental composition of a CH2 (e.g., replacement of a CH3 group by an H) between compounds whose relative abundance changed will be common. If, on the other hand, the differences in molecular formulae between relatively depleted and enriched compounds appear random, then it seems less likely that the microbial community is biasing their activity toward specific molecular modifications. If the most frequent composition differences in the 1-day incubations involve additions and removals of large numbers of carbon and heteroatoms, then the similarity in masses (Table 1) is likely simply coincidental and unlikely to have resulted from direct transformation of side functional groups. For example, although C16H6O9 and C13H13O7NS have a small mass difference of 14.9599 Da, the former cannot be converted into the latter via simple transformations of side functional groups given the large difference in their elemental composition.
The calculations revealed that, for the 1-day incubations, the most common differences in elemental composition were those involving a small number of C, H, and/or O atoms (e.g., removal or addition of a CH2; removal of an O) (Table S2) and a small mass (Figure S4). This indicates that compounds whose relative abundances were significantly decreased vs. increased in the short incubations not only had similar masses (Table 1) and occupied similar regions in van Krevelen space (Figure 4), but many of them also had similar elemental compositions (i.e., small differences in the number of atoms in Table S2). Of the 200 most frequently observed composition differences shown in Table S2, 82 appeared in both the February and the December 2011 short incubations. If the analysis is expanded to include the 800 most frequently observed composition differences, then 268 appear in both incubations. Some of the most common composition differences that appeared in both the February and the December 2011 short incubations are listed in Table 2. For the 70-day incubation, on the other hand, the most frequent composition differences involve a net removal of a much larger number of C, H, and O (e.g., net removal of C16H8O15, Table S2) and a larger mass (Figure S4). These could be related to changes in functional groups occurring sequentially (e.g., demethylation followed by hydroxylation and decarboxylation, whose cumulative result would be a large change in elemental composition) and/or other reactions. There is no overlap between the composition differences appearing in the short and long incubations. It is likely that similar changes do occur in the long incubations, but because of their cumulative effect (i.e., changes occurring on intermediate products) the net change in elemental composition is different than in the short incubations. These results are consistent with our previous hypothesis that changes in DOM composition in the 1-day incubations may be related to transformations in side functional groups (with a small change in elemental composition and mass), while changes in the long incubations may be related to progressive transformations (and thus with a larger change in elemental composition and mass). We note that previous incubations of coastal water lasting for up to 9 days have not revealed a significant impact of incubation time on DOM composition (Kujawinski et al., 2016). Our analysis of short- (1 day) and long-term (35 or 70 days) incubations indicate that significant differences can occur over these longer time scales.
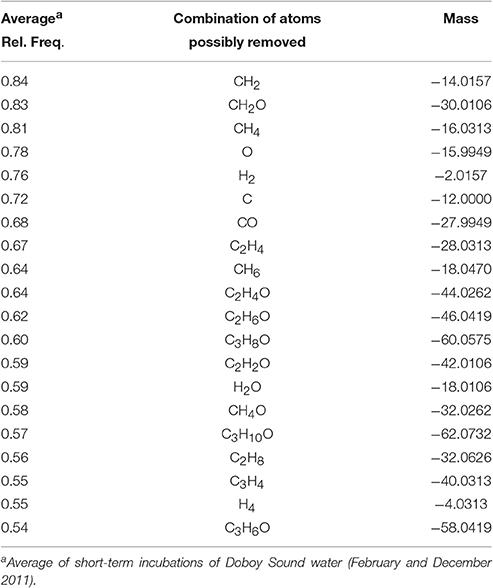
Table 2. Most common potential transformations in elemental compositions that would have resulted in a decrease in molecular mass after short-term incubations.
The patterns just described for short- and long-term incubations are not due to instrument variability or noise. First, the principal component analysis separated the pre-incubation samples from those collected at the end of the experiments in both cases (Figures 2A, 4A,C). If the transformation in DOM composition shown in the van Krevelen diagrams (Figures 2B, 4B,D) were simply due to instrument noise, there would be no reason to expect separation between pre- and post-incubation samples in the principal component analysis. Second, we repeated the analysis using all 41 injections of the sample from the North Equatorial Pacific Intermediate Water collected at station NELHA off Hawaii. The differences in elemental composition between those samples (which in this case were entirely due to instrument variability) were mostly random, with small and large changes in molecular mass occurring frequently.
It is important to note some of the limitations of the analysis. The calculation provides a check for consistency only, since it is possible that even when the difference in elemental composition is small (small number of C, H, and/or O atoms), the structure of the compounds that underlies the predicted formula may not allow for that particular transformation. In addition, the analytical methods used here are focused on the investigation of compounds with molecular mass larger than about 150–160 Da. As reviewed by Kujawinski (2011), previous studies have shown that small molecules that are ubiquitous in cellular biomass can be easily assimilated into cells through dedicated transport systems. Since those compounds fall outside our analytical window, however, the transformations in DOM composition reported here are only representative of the fraction in the 150–850 Da range that can be detected by FT-ICR MS analysis. The analyses are also only representative of the fraction of the DOM that is retained in the solid phase extraction resin. Saccharides, for example, are known to be consumed by microorganisms (e.g., Rich et al., 1996), but are generally not well captured by the resin used here. As such, some of the DOC decrease observed in the incubations is likely related to a fraction of the DOM that is not captured by the FT-ICR MS analysis. The statistically significant transformations in composition reported in the short-term incubations reveal, however, that at least a portion of the labile DOM was captured by the solid phase extraction. Lastly, we note that we have focused here on transformations of estuarine DOM due to microbial degradation. In situ transformations are influenced by additional processes, including photochemistry and flocculation.
In summary, our analyses of microbial-mediated changes in DOM composition in an estuarine system characterized by strong terrigenous and marine inputs identified significant transformations. Analyses at the molecular level revealed a general preference for degradation of compounds that are enriched in marine DOM, which resulted in the remaining DOM becoming relatively more terrigenous. Transformations observed during short-term incubations resulted in a small difference in the average mass of compounds whose relative abundance decreased vs. increased, and a novel probabilistic approach revealed that changes in elemental composition were consistent with modifications of functional groups. Over longer time scales, the differences in mass were significantly larger, possibly a result of additional changes in function groups of intermediate products. Despite limitations, and given the challenges of actually identifying transformations in the complex DOM mixture, the analysis presented here serves as a step toward shedding light into these elusive processes. Future studies combining this probabilistic approach, NMR analysis and other techniques that provide direct information about structure, and biological gene expression at a highly-resolved scale will be particularly useful to tackle the biological complexity of carbon turnover.
Author Contributions
PM conceived and designed the research; PM, MS, and TD generated and processed FT-ICR MS data. SG, FB, WW, and MM contributed materials/analysis tools. PM analyzed the data. PM wrote the paper; all authors commented on the manuscript.
Conflict of Interest Statement
The authors declare that the research was conducted in the absence of any commercial or financial relationships that could be construed as a potential conflict of interest.
Acknowledgments
We thank D. Kirchman and H. Ogawa for their constructive comments and suggestions, which led to a much improved manuscript. This research was supported by the National Science Foundation through the Sapelo Island Microbial Carbon Observatory (SIMCO, OCE-1356010). Additional support was provided by the NSF—Georgia Coastal Ecosystems Long Term Ecological Research program (GCE-LTER, OCE-1237140). We thank the University of Georgia Marine Institute at Sapelo Island for logistical support. This is University of Georgia Marine Institute contribution number 1058.
Supplementary Material
The Supplementary Material for this article can be found online at: https://www.frontiersin.org/article/10.3389/fmars.2017.00069/full#supplementary-material
References
Abdulla, H., Minor, E., Dias, R., and Hatcher, P. (2013). Transformations of the chemical compositions of high molecular weight DOM along a salinity transect: using two dimensional correlation spectroscopy and principal component analysis approaches. Geochim. Cosmochim. Acta 118, 231–246. doi: 10.1016/j.gca.2013.03.036
Bauer, J., and Bianchi, T. (2011). “Dissolved organic carbon cycling and transformation,” in Treatise on Estuarine and Coastal Science. Vol. 5, eds E. Wolanski and D. McLusky (Waltham, MA: Academic Press), 7–67.
Benner, R., and Kaiser, K. (2003). Abundance of amino sugars and peptidoglycan in marine particulate and dissolved organic matter. Limnol. Oceanogr. 48, 118–128. doi: 10.4319/lo.2003.48.1.0118
Bugg, T., Ahmad, M., Hardiman, E., and Singh, R. (2011). The emerging role for bacteria in lignin degradation and bio-product formation. Curr. Opin. Biotechol. 22, 394–400. doi: 10.1016/j.copbio.2010.10.009
Cole, J., Prairie, Y., Caraco, N., McDowell, W., Transvik, L., Striegl, R., et al. (2007). Plumbing the global carbon cycle: integrating inland waters into the terrestrial carbon budget. Ecosystems 10, 171–184. doi: 10.1007/s10021-006-9013-8
Cottrell, M. T., and Kirchman, D. L. (2000). Natural assemblages of marine proteobacteria and members of the Cytophaga-Flavobacter cluster consuming low- and high-molecular weight dissolved organic matter. Appl. Environ. Microbiol. 66, 1692–1697. doi: 10.1128/AEM.66.4.1692-1697.2000
Crawford, D., and Crawford, R. (1980). Microbial degradation of lignin, enzyme. Microb. Technol. 2, 11–22. doi: 10.1016/0141-0229(80)90003-4
D'Andrilli, J., Cooper, W., Foreman, C., and Marshall, A. (2015). An ultrahigh-resolution mass spectrometry index to estimate natural organic matter lablity. Rapid Commun. Mass Spectrom. 29, 2385–2401. doi: 10.1002/rcm.7400
Dittmar, T., Koch, B., Hertkorn, N., and Kattner, G. (2008). A simple and efficient method for the solid-phase extraction of dissolved organic matter (SPE-DOM) from seawater. Limnol. Oceanogr. Methods 6, 230–235. doi: 10.4319/lom.2008.6.230
Eichinger, M., Poggiale, J. C., and Sempéré, R. (2011). “Toward a mechanistic approach to modeling bacterial DOC pathways: a review,” in Microbial Carbon Pump in the Ocean, eds N. Jiao, F. Azam, and S. Sanders (Washington, DC: Science/AAAS), 66–68.
Fichot, C. G., and Benner, R. (2014). The fate of terrigenous dissolved organic carbon in a river-influenced ocean margin. Glob. Biogeochem. Cycles 28, 300–318. doi: 10.1002/2013GB004670
Filley, T., Cody, G., Goodell, B., Jellison, J., Noser, C., and Ostrofsky, A. (2002). Lignin demethylation and polysaccharide decomposition in spruce sapwood degraded by brown rot fungi. Org. Geochem. 33, 111–124. doi: 10.1016/S0146-6380(01)00144-9
Giovannoni, S. J., and Stingl, U. (2005). Molecular diversity and ecology of microbial plankton. Nature 437, 343–348. doi: 10.1038/nature04158
Hansell, D. A. (2005). Dissolved organic carbon reference material program. Eos Trans. Am. Geophys. Union 86, 318. doi: 10.1029/2005EO350003
Hedges, J., Keil, R., and Benner, R. (1997). What happens to terrestrial organic matter in the ocean? Org. Geochem. 27, 195–212. doi: 10.1016/S0146-6380(97)00066-1
Hertkorn, N., Benner, R., Frommberger, M., Schmitt-Kopplin, P., Witt, M., et al. (2006). Characterization of a major refractory component of marine dissolved organic matter. Geochim. Cosmochim. Acta 70, 2990–3010. doi: 10.1016/j.gca.2006.03.021
Jiao, N., Herndl, G., Hansell, D., Benner, R., Kattner, G., Wilhelm, S., et al. (2010). Microbial production of recalcitrant dissolved organic matter: long-term carbon storage in the global ocean. Nat. Rev. Microbiol. 8, 593–599. doi: 10.1038/nrmicro2386
Kawasaki, N., and Benner, R. (2006). Bacterial release of dissolved organic matter during cell growth and decline: molecular origin and composition. Limnol. Oceanogr. 51, 2170–2180. doi: 10.4319/lo.2006.51.5.2170
Kim, S., Kaplan, L., and Hatcher, P. (2006). Biodegradable dissolved organic matter in a temperate and a tropical stream determined from ultrahigh resolution mass spectrometry. Limnol. Oceanogr. 51, 1054–1063. doi: 10.4319/lo.2006.51.2.1054
Kirchman, D. L., Meon, B., Ducklow, H. W., Carlson, C. A., Hansell, D. A., and Steward, G. F. (2001). Glucose fluxes and concentrations of dissolved combined neutral sugars (polysaccharides) in the Ross Sea and Polar Front Zone, Antarctica. Deep-sea Res. II, Top. Stud. Oceanogr. 48, 4179–4197. doi: 10.1016/S0967-0645(01)00085-6
Koch, B. P., and Dittmar, T. (2006). From mass to structure: an aromaticity index for high-resolution mass data of natural organic matter. Rapid Commun. Mass Spectrom. 20, 926–932. doi: 10.1002/rcm.2386
Koch, B. P., and Dittmar, T. (2016). Erratum: from mass to structure: an aromaticity index for high-resolution mass data of natural organic matter. Rapid Commun. Mass Spectrom. 30:250. doi: 10.1002/rcm.7433
Kujawinski, E. B. (2011). The impact of microbial metabolism on marine dissolved organic matter. Ann. Rev. Mar. Sci. 3, 567–599. doi: 10.1146/annurev-marine-120308-081003
Kujawinski, E. B., Del Vecchio, R., Blough, N., Klein, G., and Marshall, A. (2004). Probing molecular-level transformations of dissolved organic matter: insights on photochemical degradation and protozoan modification of DOM from electrospray ionization Fourier transform ion cyclotron resonance mass spectrometry. Mar. Chem. 92, 23–37. doi: 10.1016/j.marchem.2004.06.038
Kujawinski, E. B., Longnecker, K., Barrot, K., Weber, R., and Soule, M. (2016). Microbial community structure affects marine dissolved organic matter composition. Front. Mar. Sci. 3:45. doi: 10.3389/fmars.2016.00045
Lechtenfeld, O., Hertkorn, N., Shen, Y., Witt, M., and Benner, R. (2015). Marine sequestration of carbon in bacterial metabolites. Nat. Comm. 6:6711. doi: 10.1038/ncomms7711
Longnecker, K., Futrelle, J., Coburn, E., Soule, M., and Kujawinski, E. (2015). Environmental metabolomics: databases and tools for data analysis. Mar. Chem. 177, 366–373. doi: 10.1016/j.marchem.2015.06.012
Masai, E., Katayama, Y., and Fukuda, M. (2007). Genetic and biochemical investigations on bacterial catabolic pathways for lignin-derived aromatic compounds. Biosci. Biotechnol. Biochem. 71, 1–15. doi: 10.1271/bbb.60437
Medeiros, P. M., Seidel, M., Dittmar, T., Whitman, W. B., and Moran, M. A. (2015a). Drought-induced variability in dissolved organic matter composition in a marsh-dominated estuary. Geophys. Res. Lett. 42, 6446–6453. doi: 10.1002/2015GL064653
Medeiros, P. M., Seidel, M., Niggemann, J., Spencer, R. G. M., Hernes, P. J., Yager, P. L., et al. (2016). A novel molecular approach for tracing terrigenous dissolved organic matter into the deep ocean, Glob. Biogeochem. Cycles 30, 689–699. doi: 10.1002/2015GB005320
Medeiros, P. M., Seidel, M., Powers, L. C., Dittmar, T., Hansell, D. A., and Miller, W. L. (2015b). Dissolved organic matter composition and photochemical transformations in the northern North Pacific Ocean. Geophys. Res. Lett. 42, 863–870. doi: 10.1002/2014GL062663
Medeiros, P. M., Seidel, M., Ward, N. D., Carpenter, E. J., Gomes, H. R., Niggemann, J., et al. (2015c). Fate of the Amazon River dissolved organic matter in the tropical Atlantic Ocean. Glob. Biogeochem. Cycles 29, 677–690. doi: 10.1002/2015GB005115
Merkens, H., Beckers, G., Wirtz, A., and Burkovski, A. (2005). Vanillate metabolism in Corynebacterium glutamicum. Curr. Microb. 51, 59–65. doi: 10.1007/s00284-005-4531-8
Moran, M. A., Kujawinski, E. B., Stubbins, A., Fatland, R., Aluwihare, L., Buchan, A., et al. (2016). Deciphering ocean carbon in a changing world. Proc. Natl. Acad. Sci. U.S.A. 113, 3143–3151. doi: 10.1073/pnas.1514645113
Moran, M. A., and Zepp, R. (1997). Role of photoreactions in the formation of biologically labile compounds from dissolved organic matter. Limnol. Oceanogr. 42, 1307–1316. doi: 10.4319/lo.1997.42.6.1307
Mou, X., Hodson, R., and Moran, M. A. (2007). Bacterioplankton assemblages transforming dissolved organic compounds in coastal seawater. Environ. Microbiol. 9, 2025–2037. doi: 10.1111/j.1462-2920.2007.01318.x
Obernosterer, I., and Benner, R. (2004). Competition between biological and photochemical processes in the mineralization of dissolved organic carbon. Limnol. Oceanogr. 49, 117–124. doi: 10.4319/lo.2004.49.1.0117
Ogawa, H., Amagai, Y., Koike, I., Kaiser, K., and Benner, R. (2001). Production of refractory dissolved organic matter by bacteria. Science 292, 917–920. doi: 10.1126/science.1057627
Opsahl, S., and Benner, R. (1997). Distribution and cycling of terrigenous dissolved organic matter in the ocean. Nature 386, 480–482. doi: 10.1038/386480a0
Osterholz, H., Kirchman, D., Niggemann, J., and Dittmar, T. (2016). Environmental drivers of dissolved organic matter molecular composition in the Delaware estuary. Front. Earth Sci. 4:95. doi: 10.3389/feart.2016.00095
Osterholz, H., Niggemann, J., Giebel, H., Simon, M., and Dittmar, T. (2015). Inefficient microbial production of refractory dissolved organic matter in the ocean. Nat. Commun. 6:7422. doi: 10.1038/ncomms8422
Overland, J., and Preisendorfer, R. (1982). A significance test for principal components applied to a cyclone climatology. Mon. Weather Rev. 110, 1–4.
Poretsky, R. S., Sun, S., Mou, X., and Moran, M. A. (2010). Transporter genes expressed by coastal bacterioplankton in response to dissolved organic carbon. Environ. Microbiol. 12, 616–627. doi: 10.1111/j.1462-2920.2009.02102.x
Repeta, D. J., Quan, T., Aluwihare, L. I., and Chen, R. F. (2002). Chemical characterization of high molecular weight dissolved organic matter in fresh and marine waters. Geochim. Cosmochim. Acta 66, 955–962. doi: 10.1016/S0016-7037(01)00830-4
Rich, J. II., Ducklow, H. W., and Kirchman, D. L. (1996). Concentrations and uptake of neutral monosaccharides along 140°W in the equatorial Pacific: contribution of glucose to heterotrophic bacterial activity and the DOM flux. Limnol. Oceanogr. 41, 595–604. doi: 10.4319/lo.1996.41.4.0595
Riedel, T., Zark, M., Vähätalo, A., Niggemann, J., Spencer, R., Hernes, P., et al. (2016). Molecular signatures of biogeochemical transformations in dissolved organic matter from ten world rivers. Front. Earth. Sci. 4:85. doi: 10.3389/feart.2016.00085
Rossel, P. E., Vähätalo, A. V., Witt, M., and Dittmar, T. (2013). Molecular composition of dissolved organic matter from a wetland plant (Juncus effusus) after photochemical and microbial decomposition (1.25 yr): common features with deep sea dissolved organic matter. Org. Geochem. 60, 62–71. doi: 10.1016/j.orggeochem.2013.04.013
Seidel, M., Beck, M., Riedel, T., Waska, H., Suryaputra, I., Schnetger, B., et al. (2014). Biogeochemistry of dissolved organic matter in an anoxic intertidal creek bank. Geochim. Cosmochim. Acta 140, 418–434. doi: 10.1016/j.gca.2014.05.038
Seidel, M., Yager, P., Ward, N., Carpenter, E., Gomes, H., Krusche, A., et al. (2015). Molecular-level changes of dissolved organic matter along the Amazon River-to-ocean continuum. Mar. Chem. 177, 218–231. doi: 10.1016/j.marchem.2015.06.019
Sleighter, R., and Hatcher, P. (2008). Molecular characterization of dissolved organic matter (DOM) along a river to ocean transect of the lower Chesapeake Bay by ultrahigh resolution electrospray ionization Fourier transform ion cyclotron resonance mass spectrometry. Mar. Chem. 110, 140–152. doi: 10.1016/j.marchem.2008.04.008
Keywords: dissolved organic matter, biodegradation, estuarine processes, DOM composition, FT-ICR MS
Citation: Medeiros PM, Seidel M, Gifford SM, Ballantyne F, Dittmar T, Whitman WB and Moran MA (2017) Microbially-Mediated Transformations of Estuarine Dissolved Organic Matter. Front. Mar. Sci. 4:69. doi: 10.3389/fmars.2017.00069
Received: 12 December 2016; Accepted: 27 February 2017;
Published: 14 March 2017.
Edited by:
Toshi Nagata, University of Tokyo, JapanCopyright © 2017 Medeiros, Seidel, Gifford, Ballantyne, Dittmar, Whitman and Moran. This is an open-access article distributed under the terms of the Creative Commons Attribution License (CC BY). The use, distribution or reproduction in other forums is permitted, provided the original author(s) or licensor are credited and that the original publication in this journal is cited, in accordance with accepted academic practice. No use, distribution or reproduction is permitted which does not comply with these terms.
*Correspondence: Patricia M. Medeiros, medeiros@uga.edu