A Tale of Two Crowds: Public Engagement in Plankton Classification
 Kelly L. Robinson
 Jessica Y. Luo
 Su Sponaugle
 Cedric Guigand3
 - 1Hatfield Marine Science Center, Oregon State University, Newport, OR, USA
- 2Department of Integrative Biology, Oregon State University, Corvallis, OR, USA
- 3Department of Marine Biology and Ecology, Rosenstiel School of Marine and Atmospheric Sciences, University of Miami, Miami, FL, USA
“Big data” are becoming common in biological oceanography with the advent of sampling technologies that can generate multiple, high-frequency data streams. Given the need for “big” data in ocean health assessments and ecosystem management, identifying and implementing robust, and efficient processing approaches is a challenge for marine scientists. Using a large plankton imagery data set, we present two crowd-sourcing approaches applied to the problem of classifying millions of organisms. The first used traditional crowd-sourcing by asking the public to identify plankton through a web-interface. The second challenged the data science community to develop algorithms via an industry partnership. We found traditional crowd-sourcing was an excellent way to engage and educate the public while crowd-sourcing data scientists rapidly generated multiple, effective solutions. As the need to process and visualize large and complex marine data sets is expected to grow over time, effective collaborations between oceanographers and computer and data scientists will become increasingly important.
Data-intensive Oceanography
Biological oceanography is rapidly becoming a data-intensive science with the advent of high resolution sampling technologies (Abbott, 2013). Often referred to as the “fourth paradigm,” data-intensive science is the synergistic outcome of empirical, theoretical, and computational efforts that collect and analyze massive amounts of information from an array of sources (Gray, 2009). It is made possible by the convergent evolution of high-resolution sensors, computing power, and networking capabilities which has accelerated the rate at which information about the environment can be gathered (Delaney and Barga, 2009; Benson et al., 2010; Porter et al., 2012). Data emerging from this convergence are colloquially known as “big data”—characterized by large volume, great variety, high veracity, and high velocity.
A key indicator of this shift to “big data” in biological oceanography is the precipitous rise in dataset size and complexity as a result of increased spatial, temporal, and taxonomic resolution, and increased rates of data generation (Table S1; Figure S1). Historically, large and complex biological oceanography datasets were generated exclusively by national- or international-level, multi-investigator programs that spanned years or even decades. The Challenger Expedition (the original “big data” program) collected 15,000 specimens representing 10,000 species at an average rate of 4,708 specimens year−1 over its 4-year (1872–1876) circumnavigation of the world's oceans (Thomson and Murray, 1895). The North Atlantic Continuous Plankton Recorder survey has collected 200 biological samples every month for the past 56 years, yielding nearly 2 million plankton records in total (Vezzulli and Reid, 2003). Remote sensing programs like SeaWiFS (and its descendants Aqua MODIS, VIIRS, and MERIS) have gathered multiple types of global ocean color data daily at spatial resolutions ranging 10–1,000 km for the past 20 years, resulting in a satellite imagery data set hundreds of terabytes in size (NASA Goddard Space Flight Center Ocean Biology Processing Group, 2014). Recent efforts such as the Census of Marine Life (2000–2010) have been able to individually assign 30.3 million marine organisms to one of 120,000 species at a rate of 3.3 million observations per year (Sedberry et al., 2011), a nearly 900-fold increase when compared to the data generation rate of the Challenger Expedition for a similar set of questions.
The recent expansion and increased affordability of sampling technologies that can generate synoptic high-frequency observations for multiple data streams simultaneously has also allowed individual investigators to generate “big” data (Figure S1). These technologies include fixed and mobile remote sensing platforms, imaging systems, acoustic sensors, autonomous underwater vehicles (AUVs), and instruments used to generate genomics data. The flexibility to deploy many of these systems for long periods of time, either alone or as part of an integrated network, has allowed the measurement of processes and states at a range of spatial (10−2 to 105 m), temporal (millisecond to year), and taxonomic (species to domain) scales. For instance, plankton imaging systems such as the Video Plankton Recorder (VPR; Davis et al., 1992), Underwater Vision Profiler (UVP; Picheral et al., 2010), and now In Situ Ichthyoplankton Imaging System (ISIIS; Cowen and Guigand, 2008) can resolve hundreds of thousands of individual organisms in a matter of hours, resulting in imagery datasets tens of terabytes in size. The ability to identify many of these organisms to low taxonomic levels adds layers of complexity to a dataset already spanning multiple temporal and spatial scales.
Thus, oceanographers and marine ecologists are increasingly finding themselves in a “deluge of data” (Baraniuk, 2011), facing the challenge of robustly and efficiently storing, processing, and analyzing datasets that are voluminous, heterogeneous, and taxonomically complex (Figure S1). Previous discussions about working with “big” ecological data have focused largely on cyber-infrastructure capabilities, data management (Michener and Jones, 2012; Gilbert et al., 2014), and the need for data-driven approaches (Kelling et al., 2009). While novel analytical techniques such as machine learning and crowd-sourcing for processing large and complex ecological data sets are increasingly reported in the terrestrial literature (Kelling et al., 2013; Peters et al., 2014), marine examples are limited (Wiley et al., 2003; Dugan et al., 2013; Millie et al., 2013; Shamir et al., 2014). Given this paucity and the need to use “big” biological oceanography and marine ecology data for rapid assessment of ocean health and adaptive management of ecosystems, we present here an evolution of approaches applied to the problem of efficiently classifying tens of millions of images of individual plankters generated by ISIIS. We discuss how partnerships were established, the questions we hoped to answer via crowd-sourcing approaches, as well as the success, the pit-falls, and the surprising outcomes generated by each approach.
Plankton Imagery Data
Plankton imagery data were collected with ISIIS, which is a towed underwater vehicle capable of imaging large volumes of water sufficient for quantifying rare mesoplankton (0.02–20 mm) and macroplankton (2–20 cm) such as larval fishes in situ (Cowen and Guigand, 2008; Cowen et al., 2013); Figure 1A). It is equipped with two line-scan cameras that can be deployed at either a fixed depth or set to “tow-yo” between two depths (see McClatchie et al., 2012; Figure 1B). The large camera is capable of imaging 140 L s−1 with a 68 μm pixel resolution while the small camera can image 15 L s−1 at 59 μm pixel resolution. Each camera produces a continuous picture that then is parsed into equivalent frames at rates of 17 and 61 frames s−1, respectively. Combined, these cameras produce 660 gigabytes of uncompressed imagery per hour. After each cruise, imagery data from each camera are pre-processed in a distributed computing environment. Each frame is flat-fielded to remove anomalous dark vertical bands and its contrast normalized to enhance regions with higher gray intensity. Regions-of-interest (i.e., particles) within each frame are then extracted from the frame using a process called segmentation that separates the signal (i.e., the particle) from the noise (i.e., frame background) (Figure 1C; Luo et al., in review). This process yields individual images, or “vignettes,” of planktonic organisms (Figure 1D). Because each frame typically contains multiple vignettes and ISIIS can be deployed for as many hours as there is sufficient storage, it can rapidly generate a dataset comprised of hundreds of thousands to millions of vignettes. The ISIIS has been successfully used in multiple ecosystems (McClatchie et al., 2012; Greer et al., 2013, 2014, 2015; Luo et al., 2014). Data discussed below were collected in the North Atlantic, the Southern California Current, and the Straits of Florida.
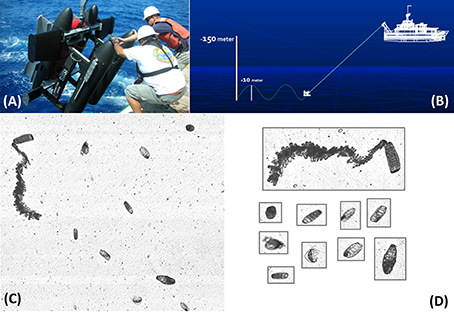
Figure 1. (A) Shipboard deployment of the In Situ Ichthyoplankton Imaging System (ISIIS). (B) Conceptual illustration of the ISIIS being towed during an undulation transect (i.e., “tow-yo”). (C) Example of a flat-fielded frame captured by the ISIIS. (D) Vignettes generated from the frame shown in (C) as a result of segmenting regions-of-interest.
Manual Classification
The first approach applied to ISIIS plankton imagery data was manual extraction and classification. For its first deployment in the Southern California Bight, a group of four experts manually extracted and identified to the lowest taxonomic level possible 85,000 organisms from 150,000 frames in 3 mo. (≈1440 person h; McClatchie et al. (2012). Greer et al. (2013) identified 35,028 gelatinous plankters and a subsample of highly abundant organisms such as copepods and appendicularians in 2 mo. Luo et al. (2014) expanded work by McClatchie et al. (2012) and hand-labeled 793,048 vignettes of gelatinous zooplankton found in 700,000 frames—an effort that took an estimated 2,880 person h to complete over the course of 36 mo. It is noteworthy that these 3 years represent the time it took to identify only the gelatinous zooplankton and does not include abundant taxa such as copepods. Subsequent efforts to analyze ISIIS data collected over Stellwagen Bank and in the northern Gulf of Mexico utilized a combination of manual and semi-automatic classification methods (Greer et al., 2014, 2016). Greer et al. (2014) took ~100 person h to hand-label 24,247 vignettes to either family (i.e., for larval fish) or class level (e.g., polychaetes, ctenophores, siphonophores). An automated particle counter was used to identify copepods; however, this latter process included manual sorting of an additional 12,981 vignettes for validation. Most recently, Greer et al. (2016) used a semi-automated classification method to sort 285,863 vignettes from 374,378 frames in 800 person h. For this effort, an identification expert manually extracted and classified each organism of interest with an ImageJ macro. Again, this approach did not include identifying the more abundant organisms such as copepods and appendicularians, as doing so would have greatly increased the amount of required classification time (Greer et al., 2016). While these predominately manual classification methods yielded highly accurate results, the time required (2 mo to 1.5 years of classification effort per person) of a few experts to achieve this accuracy was considerable.
General Crowd
Our next step was to use traditional crowd-sourcing (i.e., citizen science) to assist with ISIIS imagery plankton classification. Citizen science has long been an effective outreach and data collection tool for marine ecologists (e.g., coral reef monitoring, Pattengill-Semmens and Semmens, 2003), assessing invasive species (Delaney et al., 2008), tracking marine debris (Smith and Edgar, 2014), and categorizing whale calls (Shamir et al., 2014). For our project “Plankton Portal,” we partnered with Zooniverse (www.zooniverse.org), one of the major hubs for online citizen science projects. Zooniverse is most well-known for its highly successful Galaxy Zoo project, where individuals helped astronomers identify planets, galaxies, and stars (Lintott et al., 2008).
Development of the Plankton Portal (PP) site required extensive consideration of the simplest task users could be asked to do, and progressed in two phases (e.g., PP v. 1 and 2). For the original launch of PP v. 1, we decided that the target plankton taxa needed to be grouped into dominant shapes, as opposed to taxonomy. Therefore, our “round” category included two types of lobate ctenophores and pelagic tunicates. Our “elongated or ribbon-like” category included disparate organisms such as chaetognaths, radiolarian colonies, and cestid ctenophores. Likewise, our field guide (Available at: https://github.com/Planktos/TwoCrowds) reflected this thinking, where organisms were described according to their shape and appearance, as opposed to taxonomic identifiers. For PP v. 1, we asked users to: (1) identify the organism from a set of categories, (2) identify the organism's orientation, and (3) measure the organism's major and minor axes. However, with the second iteration (PP v. 2), which launched in June 2015 with the addition of a new dataset from the Mediterranean, we greatly simplified the classification tasks. Instead of measuring size and orientation as well as classification, users were asked to only classify objects. This simplification was made after observations that many users struggled with the orientation and measurement tasks. For example, users typically had trouble measuring the length of curved organisms (e.g., curved chaetognaths, larvaceans, and shrimp), as well as the orientation of organisms where specialized knowledge was needed to determine top vs. bottom (e.g., lobate and beroid ctenophores). Eliminating these tasks made classification faster and easier, as well as accessible on mobile devices.
Crowd-sourcing methods require the crowd, or group of users completing a classification task, to converge on a common answer. This convergence helped ensure data quality dimensions like precision and reliability are met (Wang and Strong, 1996). To systematically implement such a rule, we established “retirement rules,” or a set of conditions that cause an image's classification to be deemed final. Our rules were as follows:
1) If the first three people agree that the image is blank
2) If there are four classifications that state that the image is blank
3) If six people submit identical counts of taxa within an image
4) If the classification count reaches or exceeds 12
Despite the initial boost from Plankton Portal's launch (500,000 classifications in the first 6 mo.), classifications and unique users dropped off, though steady classification was still fueled by dedicated volunteers (Figure 2A). One such volunteer was quickly made a moderator, and as of September 2016, has contributed more than 275,000 classifications. Furthermore, the top 10% of users (3,146 out of 31,457) have contributed 83% of the classifications to date. However, as the rate of classifications dropped, the second 500,000 classifications took 1.5 years to complete. The combination of the exponential decline in classification rates with the necessary retirement rules resulted in only 24% of 403,881 frames completed (with 7% paused and 18% ongoing), despite receiving over 1.2 million classifications from over 10,000 users.
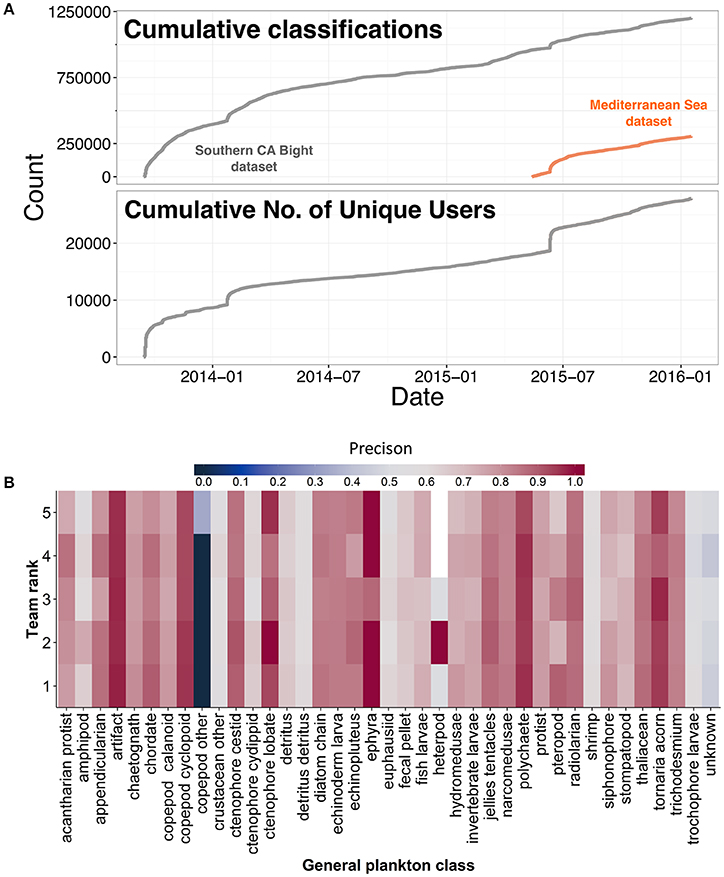
Figure 2. (A) Cumulative plankton classifications made by citizen scientists engaged in Plankton Portal and cumulative number of unique users in Plankton Portal over time (year-month). (B) Precision of classifying algorithms for the top five teams participating in the inaugural National Data Science Bowl.
The drop in classification rate and the rise in classifications by a relatively small user group prompted us to consider the outcomes of Plankton Portal relative to other, similar Zooniverse projects like Snapshot Serengeti. While many plankton groups like jellyfish may be charismatic, the average user typically is not familiar with their shapes, sizes, and diversity, resulting in a lower crowd information quality (Lukyanenko et al., 2014). The presumed greater success of Snapshot Serengeti is likely attributed to its users possessing basic knowledge of African wildlife, as their characteristics are often taught during childhood. Thus, Snapshot Serengeti users become competent classifiers more quickly relative to Plankton Portal users. This reduced learning curve increases the rate of accurate classifications (and the user's confidence), and, ostensibly, results in continued participation, including engagement in more difficult tasks like resolving orientation. Thus, we propose that the efficacy of traditional citizen science projects will be greater when participants have an a priori an understanding or interest of the study components at some level, making specific and higher order tasks easier to learn and execute.
Specialized Crowd
The most recent approach to the plankton image classification problem combined elements of traditional crowd-sourcing and algorithm development. Through our collaborators at Zooniverse, we were approached by Kaggle, an online data science competition community, and Booz Allen Hamilton, a management and technology consultant firm. These companies were looking for a compelling “big data” problem for their inaugural National Data Science Bowl (www.datasciencebowl.com), a competition created to effect social good through data science analytics. Kaggle has hosted several competitions for marine scientists, including one in 2009 for cetacean biologists seeking an automated approach to identifying individual whale calls from bioacoustic data (Dugan et al., 2013) as well as a recent competition to automate the recognition of right whales from images of rostrum callosity patterns (https://www.kaggle.com/c/noaa-right-whale-recognition). For each of these competitions, the host provides an example data set that is used to train and test predictive algorithms created by competitors.
The National Data Science Bowl competition dataset consisted of 60,736 plankton vignettes separated into 121 classes (Cowen et al., 2015). To create this dataset, approximately two million vignettes from the western Straits of Florida were manually sorted by five experts over 2 mo (≈650 person h). A subset of the two million was used because over 50% of the initial set were artifacts (e.g., bubbles, water movement wisps, and frame edges), and we wanted the number of vignettes in each class to represent a somewhat realistic frequency distribution of plankton types. For example, the number of copepod vignettes (7,732) far exceeded the number of larval fish vignettes (660). While this approach yielded a representative dataset, it meant rare, but highly important taxa such as larval fishes, would be under-represented during training. This under-representation can be problematic, since the efficacy at which a classification algorithm correctly identifies an image can vary with how often the program “sees” that class during training. To mediate, we targeted a minimum of 100 vignettes for taxonomic groups of particular interest.
Vignettes were at first classified based on strict taxonomy. This approach generated classes that consisted of organisms in all orientations, of varying sizes, and life stages. Vignettes were then partially re-sorted into classes that reflected broad taxonomic groups, organism shape (i.e., orientation), and size. Larval fish, for example, were separated into five classes: Very thin fish, thin fish, medium-bodied fish, and deep-bodied fish, myctophids, and leptocephali larvae.
The dataset was then split 30:70 into training and test sets. The training set was made available to competitors and was stripped of all metadata. Competitors were given 3 mo (December 15, 2014–March 14, 2015) to develop the most accurate classification algorithm, measured by the lowest log-loss. Cash prizes ($100,000–1st, $45,000–2nd, $15,000–3rd, and $15,000 to the top student team) provided the means to engage 1,293 participants comprising 1,049 teams from multiple countries. All submissions were made available on the competition website (https://www.kaggle.com/c/datasciencebowl/submissions/all) following the close of the competition. The top five algorithms had overall classification accuracies greater than 80%, a marked improvement in comparison to the Support Vector Machine (A. Sarafraz and C. Mader, University of Miami, pers. comm.) or Random Forest-based models previously used (ZooProcess; J.O. Irisson, University of Pierre and Marie Curie, pers. comm.). Mean precision (true positives/(true positives + false positives) was also high at 77%, although it varied among taxonomic groups (Figure 2B).
General vs. Specialized Crowd
Setting up our second crowd-sourcing approach as a competition to produce a product was advantageous over the traditional crowd-sourcing approach for multiple reasons. First, the competition yielded a suite of classifying algorithms we could use for future projects. This differs from traditional citizen science projects in that our crowd's productivity extended beyond the active engagement time. Second, we were able to quantitatively, comprehensively, and simultaneously evaluate a large suite of classification schemes in real-time. Third, it allowed us to benefit from group intelligence, a phenomenon where the collective intelligence of group is greater than the sum of the intelligences of individuals in the group (Woolley et al., 2010). This benefit was realized two-fold since most participants were part of a team and many answered questions and shared ideas on the competition forum (https://www.kaggle.com/c/datasciencebowl/forums). Fourth, the large cash prize meant participants were highly motivated. The limited timeline for submissions meant a rapid turn-around from problem to ultimate solution. Social advantages were also realized. The competition provided a platform for developing collaborative relationships between the top machine learning and computer vision researchers in the world and biological oceanographers. These collaborations have set off a cascade of activity at Oregon State University in the United States and at the University of Pierre and Marie Curie in France as solutions from the competition were quickly utilized to classify vignettes from a variety of plankton imaging systems.
Challenges associated with the competition were few. Most notable was that the structure of some of top solutions did not scale easily from the competition dataset (60,000 vignettes) to the actual size of our Straits of Florida imagery data set (≈340 million vignettes). This structural issue meant that additional programming expertise was required to significantly modify the algorithms before they could be applied. A second and related challenge was implementing the solutions, as many were created with cutting-edge techniques. Possible improvements to the competition framework could include a judging criteria regarding the scalability of the algorithm structure, as well as asking top competitors to consult for a period of time (e.g., 12 mo.) post-competition. Alternatively, research teams could include a bioinformatics specialist from the onset to facilitate the transfer and implementation of algorithms.
Conclusions
The archetypal approach of a single research group processing and analyzing large datasets in isolation is becoming increasingly infeasible—particularly given the need for the data to be promptly incorporated into ocean health assessments and marine ecosystem management. An effective, alternative approach is citizen science. We found that traditional crowd-sourcing was an excellent way to engage and educate a broad spectrum of the public, while simultaneously applying human capital to a labor-intensive task. However, crowd-sourcing data scientists, a small and highly specialized group, was the most efficient approach to solving a complex bioinformatics problem. Our results highlight that traditional citizen science projects will be the most effective when the questions under study are already familiar to participants or the tasks the participants are asked to engage in are easy to learn. Lastly, as the need to process and visualize large and complex marine science data is expected to grow over time, collaborations between biological oceanographers, marine ecologists, and computer and data scientists will become increasingly valuable.
Author Contributions
KR, JL, SS, and RC designed the National Data Science Bowl (NDSB) competition. JL and KR created the NDSB dataset. CG, JL, and RC designed and ran the Plankton Portal citizen science project. KR analyzed the “big data” trends data. JL contributed Plankton Portal data. KR, JL, SS, and RC wrote the manuscript.
Conflict of Interest Statement
The authors declare that the research was conducted in the absence of any commercial or financial relationships that could be construed as a potential conflict of interest.
Acknowledgments
The authors wish to thank our National Data Science Bowl host Kaggle.com and sponsor Booz Allen Hamilton (in particular, Anthony Goldbloom, William Cukierski, Steven Mills, and Angela Zutavern). We also thank the Zooniverse team for the design and development of Plankton Portal, as well as Jean-Olivier Irisson, who provided data on the Plankton Portal—Mediterranean section. We acknowledge the contributions of our volunteer moderators, particularly Zuzana Macháčková. Lastly, we thank Clare Hansen, Megan Atkinson, and Mackenzie Mason for their assistance creating the NDSB competition image set. This manuscript was written with support from the National Science Foundation (NSF-OCE 1419987).
Supplementary Material
The Supplementary Material for this article can be found online at: https://www.frontiersin.org/article/10.3389/fmars.2017.00082/full#supplementary-material
References
Abbott, M. R. (2013). From the President: the era of big data comes to oceanography. Oceanography 26, 7–8. doi: 10.5670/oceanog.2013.68
Baraniuk, R. G. (2011). More is less: signal processing and the data deluge. Science 331, 717–719. doi: 10.1126/science.1197448
Benson, B. J., Bond, B. J., Hamilton, M. P., Monson, R. K., Monson, R. K., and Han, R. (2010). Perspectives on next-generation technology for environmental sensor networks. Front. Ecol. Environ. 8, 193–200. doi: 10.1890/080130
Cowen, R. K., and Guigand, C. M. (2008). In situ Ichthyoplankton Imaging System (ISIIS): system design and preliminary results. Limnol. Oceanogr. Methods 6, 126–132. doi: 10.4319/lom.2008.6.126
Cowen, R. K., Greer., A. T., Guigand, C. M., Hare, J. A., Richardson, D. E., and Walsh, H. J. (2013). Evaluation of the In Situ Ichthyoplankton Imaging System (ISIIS): comparison with the traditional (bongo net) sampler. Fish Bull. 111, 1–12. doi: 10.7755/FB.111.1.1
Cowen, R. K., Sponaugle, S., Robinson, K. L., and Luo, J. Y. (2015). Data from: PlanktonSet 1.0: Plankton Imagery Data Collected from F.G. Walton Smith in Straits of Florida from 2014-06-03 to 2014-06-06 and Used in the 2015 National Data Science Bowl. NOAA National Centers for Environmental Information.
Davis, C. S., Gallager, S. M., Berman, M. S., Haury, L. R., and Strickler, J. R. (1992). The Video Plankton Recorder (VPR): design and initial results. Arch. Hydrobiol. Beih 36, 67–81.
Delaney, D. G., Sperling, C. D., Adams, C. C., and Leung, B. (2008). Marine invasive species: validation of citizen science and implications for national monitoring networks. Biol. Invasions 10, 117–128. doi: 10.1007/s10530-007-9114-0
Delaney, J. R., and Barga, R. S. (2009). “A 2020 vision for ocean science,” in The Fourth Paradigm: Data-Intensive Scientific Discovery, eds T. Hey, S. Tansley, and K. Tolle (Redmond, WA: Microsoft Research), 27–38.
Dugan, P., Pourhomayoun, M., Shiu, Y., Paradis, R., Rice, A., and Clark, C. (2013). Using high performance computing to explore large complex bioacoustic soundscapes: case study for Right Whale acoustics. Proc. Comput. Sci. 20, 156–162. doi: 10.1016/j.procs.2013.09.254
Gilbert, J. A., Dick, G. J., Jenkins, B., Heidelberg, J., Allen, E., Mackey, K. R., et al. (2014). Meeting Report: ocean “omics” science, technology, and cyberinfrastructure: current challenges and future requirements (August 20-23, 2013). Stand. Gen. Sci. 9, 1251–1258. doi: 10.4056/sigs.5749944
Gray, J. (2009). “Jim Gray and eScience: a transformed scientific method,” in The Fourth Paradigm: Data-Intensive Science, eds T. Hey, S. Tansley, and K. Tolle (Redmond, WA: Microsoft Research), 19–33.
Greer, A. T., Woodson, C. B., Smith, C. E., Guigand, C. M., and Cowen, R. K. (2016). Examining mesozooplankton patch structure and its implications for trophic interactions in the northern Gulf of Mexico. J. Plank. Res. 38, 1115–1134. doi: 10.1093/plankt/fbw033
Greer, A. T., Cowen, R. K., Guigand, C. M., and Hare, J. A. (2015). Fine-scale planktonic habitat partitioning at a shelf-slope front revealed by a high-resolution imaging system. J. Mar. Syst. 142, 111–125. doi: 10.1016/j.jmarsys.2014.10.008
Greer, A. T., Cowen, R. K., Guigand, C. M., and Tang, D. (2014). The role of internal waves in larval fish interactions with potential predators and prey. Prog. Oceanogr. 127, 47–61. doi: 10.1016/j.pocean.2014.05.010
Greer, A. T., Cowen, R. K., Guigand, C. M., Mcmanus, M. A., Sevadjian, J. C., and Timmerman, A. H. V. (2013). Relationships between phytoplankton thin layers and the fine-scale vertical distributions of two trophic levels of zooplankton. J. Plankton Res. 35, 939–956. doi: 10.1093/plankt/fbt056
Kelling, S., Hochachka, W. M., Fink, D., Riedewald, M., Caruana, R., Ballard, G., et al. (2009). Data-intensive science: a new paradigm for biodiversity studies. Bioscience 59, 613–620. doi: 10.1525/bio.2009.59.7.12
Kelling, S., Lagoze, C., Wong, W. K., Gerbracht, J., Fink, D., Yu, J., et al. (2013). eBird: a human/computer learning network to improve biodiversity conservation and research. AI Mag. 34, 10–20.
Lintott, C. J., Schawinski, K., Slosar, A., Land, K., Bamford, S., Thomas, D., et al. (2008). Galaxy Zoo: morphologies derived from visual inspection of galaxies from the Sloan Digital Sky Survey. Mon. Not. R. Astron. Soc. 389, 1179–1189. doi: 10.1111/j.1365-2966.2008.13689.x
Lukyanenko, R., Parsons, J., and Wiersma, Y. F. (2014). The IQ of the crowd: understanding and improving information quality in structured user-generated content. Inform. Syst. Res. 25, 669–689 doi: 10.1287/isre.2014.0537
Luo, J. Y., Grassian, B., Tang, D., Irisson, J.-O., Greer, A. T., Guigand, C. M., et al. (2014). Environmental drivers of the fine-scale distribution of a gelatinous zooplankton community across a mesoscale front. Mar. Ecol. Prog. Ser. 510, 129–149. doi: 10.3354/meps10908
McClatchie, S., Cowen, R., Nieto, K., Greer, A., Luo, J. Y., Guigand, C., et al. (2012). Resolution of fine biological structure including small narcomedusae across a front in the Southern California Bight. J. Geophys. Res. Oceans 117, C04020. doi: 10.1029/2011JC007565
Michener, W. K., and Jones, M. B. (2012). Ecoinformatics: supporting ecology as a data-intensive science. Trends Ecol. Evol. 27, 85–93. doi: 10.1016/j.tree.2011.11.016
Millie, D. F., Weckman, G. R., Young, W. A., Ivey, J. E., Fries, D. P., Ardjmand, E., et al. (2013). Coastal “Big Data” and nature-inspired computation: prediction potentials, uncertainties, and knowledge derivation of neural networks for an algal metric. Estuar. Coast. Shelf Sci. 125, 57–67. doi: 10.1016/j.ecss.2013.04.001
NASA Goddard Space Flight Center Ocean Biology Processing Group (2014). Sea-viewing Wide Field-of-view Sensor (SeaWiFS) Ocean Color Data, NASA OB.DAAC. Greenbelt, MD, USA. NASA Ocean Biology Distibuted Active Archive Center (OB.DAAC), Goddard Space Flight Center, Greenbelt, MD (Accessed October 25, 2015). doi: 10.5067/ORBVIEW-2/SEAWIFS_OC.2014.0
Pattengill-Semmens, C. V., and Semmens, B. X. (2003). Conservation and management applications of the REEF volunteer fish monitoring program. Environ. Monit. Assess. 81, 43–50. doi: 10.1023/A:1021300302208
Peters, D. P. C., Havstad, K. M., Cushing, J., Tweedie, C., Fuentes, O., and Villanueva-Rosales, N. (2014). Harnessing the power of big data: infusing the scientific method with machine learning to transform ecology. Ecosphere 5, 1–15. doi: 10.1890/ES13-00359.1
Picheral, M., Guidi, L., Stemmann, L., Karl, D. M., Iddaoud, G., and Gorsky, G. (2010). The Underwater Vision Profiler 5: an advanced instrument for high spatial resolution studies of particle size spectra and zooplankton. Limnol. Oceanogr. Methods 8, 462–473. doi: 10.4319/lom.2010.8.462
Porter, J. H., Hanson, P. C., and Lin, C. C. (2012). Staying afloat in the sensor data deluge. Trends Ecol. Evol. 27, 121–129. doi: 10.1016/j.tree.2011.11.009
Sedberry, G. R., Fautin, D. G., Feldman, M., Fornwall, M. D., Goldstein, P., and Guralnick, R. P. (2011). OBIS-USA: a data-sharing legacy of census of marine life. Oceanography 24, 166–173. doi: 10.5670/oceanog.2011.36
Shamir, L., Yerby, C., Simpson., R., von Benda-Beckmann, A. M., Tyack, P., Samarra, F., et al. (2014). Classification of large acoustic datasets using machine learning and crowdsourcing – application to whale calls. J. Acoust. Soc. Am. 135, 953–962. doi: 10.1121/1.4861348
Smith, S. D., and Edgar, R. J. (2014). Documenting the density of subtidal marine debris across multiple marine and coastal habitats. PLoS ONE 9:e94593. doi: 10.1371/journal.pone.0094593
Thomson, C. W., and Murray, J. (1895). Voyage of the H.M.S. Challenger during the Years 1875-76: A Summary of the Scientific Reports. First Part. Digital edition prepared by Brossard, D.C. (2013); Eyre & Spottiswoode, London, 107–1247. Available online at: http://www.19thcenturyscience.org/HMSC/HMSC-Reports/1895-Summary/htm/doc.html
Vezzulli, L., and Reid, P. C. (2003). The CPR survey (1948-1997): a gridded database browser of plankton abundance in the North Sea. Prog. Oceanogr. 58, 327–336. doi: 10.1016/j.pocean.2003.08.011
Wang, R. Y., and Strong, D. M. (1996). What data quality means to data consumers. J. Manag. Inform. Syst. 12, 5–33.
Wiley, E. O., McNyset, K. M., Peterson, A. T., and Stewart, A. (2003). Niche modeling and geographic range predictions in the marine environment using a machine-learning algorithm. Oceanography 16, 120–127. doi: 10.5670/oceanog.2003.42
Keywords: marine science, plankton, big data, crowd-sourcing, machine learning, citizen science
Citation: Robinson KL, Luo JY, Sponaugle S, Guigand C and Cowen RK (2017) A Tale of Two Crowds: Public Engagement in Plankton Classification. Front. Mar. Sci. 4:82. doi: 10.3389/fmars.2017.00082
Received: 19 October 2016; Accepted: 10 March 2017;
Published: 11 April 2017.
Edited by:
Peng Liu, Institute of Remote Sensing and Digital Earth (CAS), ChinaReviewed by:
Guillem Chust, AZTI-Tecnalia, SpainYolanda F Wiersma, Memorial University of Newfoundland, Canada
Copyright © 2017 Robinson, Luo, Sponaugle, Guigand and Cowen. This is an open-access article distributed under the terms of the Creative Commons Attribution License (CC BY). The use, distribution or reproduction in other forums is permitted, provided the original author(s) or licensor are credited and that the original publication in this journal is cited, in accordance with accepted academic practice. No use, distribution or reproduction is permitted which does not comply with these terms.
*Correspondence: Kelly L. Robinson, kelly.robinson@louisiana.edu
†Present Address: Kelly L. Robinson, Department of Biology, University of Louisiana at Lafayette, Lafayette, LA, USA;
Jessica Y. Luo, Climate and Global Dynamics Lab, National Center for Atmospheric Research, Boulder, CO, USA