Modeling Both the Space and Place of Coastal Environments: Exploring an Approach for Developing Realistic Geovisualizations of Coastal Places
 Robert Newell
 Rosaline Canessa
 Tara Sharma1,2
- 1Geography, University of Victoria, Victoria, BC, Canada
- 2Parks Canada, Government of Canada, Sidney, BC, Canada
Effective coastal planning incorporates the variety of user needs, values, and interests associated with coastal environments. This requires understanding how people relate to coastal environments as “places,” imbued with values and meanings, and accordingly, tools that can capture place and connect with people's “sense of place” have the potential for supporting effective coastal management strategies. Realistic, immersive geographical visualizations, i.e., geovisualizations, theoretically hold potential to serve such a role in coastal planning; however, significant research gaps exist around this application context. Firstly, place theory and geovisualizations are rarely explicitly linked in the same studies, leaving questions around how to model “coastal place,” as well as coastal space. Secondly, geovisualization work has focused on terrestrial environments, and research on how to realistically model coastal places is currently in its infancy. The current study addresses the research gaps by developing a coastal geovisualization under place-based considerations, and then examining its capacity as a tool for connecting with people's sense of place. The research uses Sidney Spit in the Gulf Islands National Park Reserve (BC, Canada) as a study site, and a geovisualization was developed using a combination of ArcGIS, Adobe Photoshop, Trimble SketchUp, and Unity3D. Focus groups were assembled involving Parks Canada staff and Greater Victoria Area residents, and the geovisualization was assessed in terms of its representation of a real-world coastal place and ability for connecting with sense of place. Findings from the study indicate that the presence of certain elements in coastal geovisualizations can contribute to realism and sense of place, such as people, dogs, birds, marine life, vegetation, and boats; however, simultaneously, deficiencies in numbers and varieties of these elements can detract from realism and sense of place. In addition, incorporation of soundscape and viewshed elements both demonstrated as significant to the tool's ability to connect with sense of place, with the latter potentially being more significant among those with higher familiarity with the real-world place. Beach textures were also found to be important for the geovisualization's ability to connect with sense of place; however, this ability can be compromised when running versions of the tool with lower graphical resolution.
Introduction
Effective coastal planning and management is socially inclusive and recognizes the variety of user needs, values, and interests associated with coastal environments (Bowen and Riley, 2003; Cicin-Sain and Belfiore, 2005). This requires understanding how people relate to coastal environments as “places,” layered with values and identities, rather than solely through its biophysical properties (Shackeroff et al., 2009; Poe et al., 2014). Accordingly, tools and techniques that can capture place and connect with people's “sense of place,” i.e., the meanings, values, beliefs, and/or feelings people associate with places (Williams and Stewart, 1998), are integral for supporting effective coastal management strategies. Newell and Canessa (2015) posit that realistic, immersive geographical visualizations, i.e., geovisualizations, can serve such a role and act as place-based tools in inclusive approaches to management and planning. Due to their realism, geovisualizations can communicate outcomes of potential management strategies (or consequences of not enacting strategies) in a “relatable” fashion, meaning that they provide people with salient understandings of how they would feel about outcomes/impacts if transpired in real-world places (Sheppard, 2001). Because they have this capacity, visualizations have shown promise for functions, such as effectively communicating potential outcomes of resource management options with local communities (Lewis and Sheppard, 2006), providing community members with salient understanding of importance of and options around climate adaptation planning (Schroth et al., 2009; Shaw et al., 2009; Sheppard et al., 2011) and stimulating discussion among stakeholders regarding future land-uses in the face of changing landscape conditions (Schroth et al., 2011).
Newell and Canessa (2015) argue that the utility of geovisualizations in collaborative planning stems from their ability to connect with people's sense of place, allowing them to serve as tools for gaining valuable insight on local people-place relationships and facilitating planning efforts that effectively recognize these relationships. By connecting with people's sense of place, geovisualizations can stimulate different stakeholders' thoughts and concerns associated with the place-based relationships they have formed with areas targeted for management or development, thereby providing a means for elucidating the socio-cultural realities, concerns, and needs associated with these areas and enabling productive planning discussions (Newell and Canessa, 2015). This perspective on geovisualizations (i.e., as place-based tools) positions them as powerful tools for coastal planning efforts; however, it is important to recognize that aside from this work (which was purely literature review-based research), place theory/concepts and geovisualizations are rarely explicitly linked and explored in the same studies. Therefore, pursuing this line of thinking requires further (applied) research around the considerations and challenges associated with how to “model place” as well as space. For example, Sheppard (2001) noted the importance of developing realistic visualizations with accuracy and minimal bias; however, while such criteria can be addressed when using primarily spatial approaches, engaging in place-based work presents complications. Place comprises subjective geography (Bott et al., 2003) that is shaped by our lived experiences (Stedman, 2003; Gunderson and Watson, 2007); therefore, the modeling process is inherently subjected to the architect's place-based experiences and biases. In addition, the relationships people form with places are influenced by a multitude of social, economic, cultural and environmental factors and (thus) can vary from person-to-person (Vorkinn and Riese, 2001); therefore, ambiguities arise around what is an “accurate” depiction of place. Furthermore, sense of place is influenced by a range of sensory inputs, such as sound, smell, temperature, etc. (Tuan, 1975), which brings forward considerations around modeling the multisensory nature of places; however, as suggested by the name, the majority work on geovisualizations focuses primarily on the visual sense and multisensory tools have received relatively little attention (Lindquist and Lange, 2014).
Research that examines geovisualizations as place-based tools can greatly increase understanding around how to develop these tools for coastal planning; however, this line of inquiry faces a second major challenge, specifically surrounding the environmental context. Most geovisualization work has focused on terrestrial environments, and research on the coastal and marine contexts is currently in its infancy. Effective coastal management requires cognizance that coasts are comprised of interconnected marine and terrestrial environments (Cicin-Sain, 1993; Sorensen, 1997; Garriga and Losada, 2010); thus, coastal geovisualizations need to capture the continuum from land to sea. In addition, coasts are inherently dynamic (Jentoft and Chuenpagdee, 2009; Hofmeester et al., 2012), and while many terrestrial visualizations consist of static images (e.g., Tress and Tress, 2003; Lewis and Sheppard, 2006; Schroth et al., 2011) or scenes (e.g., Salter et al., 2009; Smith et al., 2012), such formats would be inadequate for capturing the nature of coastal places. In light of these considerations, Newell and Canessa (2017) recommended that coastal geovisualizations be built with navigability (in order to move across the land-sea interface) and fourth-dimensional properties (to convey dynamism); however, their research was purely review-based and applied research is needed to better understand how to model such complex and dynamic places.
The current study addresses the aforementioned research gaps by firstly, developing a coastal geovisualization under place-based considerations, and secondly, examining its capacity as a tool for connecting with people's sense of place. The former activity involved selecting a coastal park in western Canada as a case study, where field data was collected and used to build a realistic dynamic geovisualization that can be navigated through the first-person perspective. The latter was done through focus group methodology, which involved participants evaluating the geovisualization in terms of how well it represents a real-world coastal place, thereby elucidating both how well the tool aligns with their sense of place and what aspects and/or potential place-based biases of the architect (i.e., researcher) might have affected this alignment. The current study is part of greater research project that investigates how geovisualizations can be used as place-based tools for collaborative coastal planning and the focus groups also used the tool to explore different management scenarios; however, this aspect of the research is not documented here and will be presented in forthcoming publications.
Methods
Study Area
The geovisualization in this study models the Sidney Spit area of the Gulf Islands National Park Reserve (GINPR) in British Columbia (BC), Canada. Sidney Spit comprises the northern most portion of Sidney Island and is located approximately 4 km east of the municipality of Sidney (Figure 1). The park contains a spit that projects 1.8 km northward (known as Long Spit) and is contiguous with hook-shaped spit (known as Hook Spit) that forms the border of a lagoon. The modeling in this work focuses on the Long Spit, and most of the geovisualization detail captures the area from the main dock at the southern end of the spit to the northern end (Figure 1).
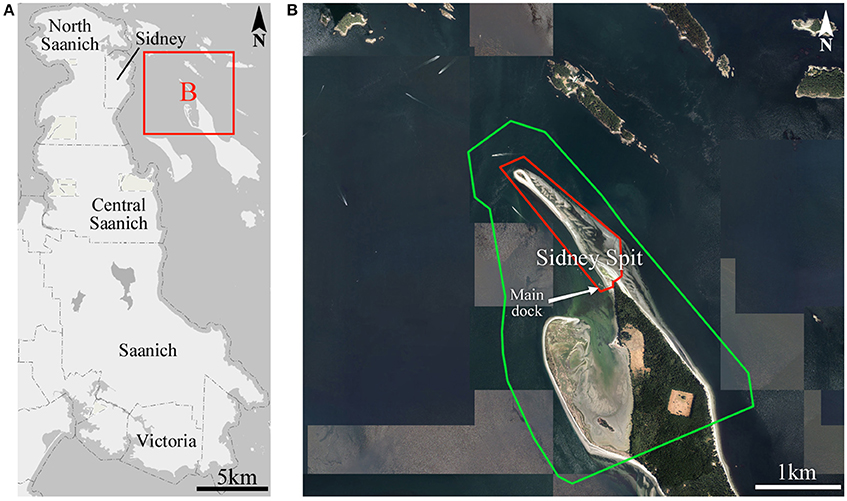
Figure 1. Map of Sidney Spit and surrounding area (source: Capital Regional District Webmap). (A) Features a map of Capital Regional District (CRD) municipalities near Sidney Island, and (B) features a map of Sidney Spit park. In (B), park boundaries are displayed in green, and the area where geovisualization modeling was focused is highlighted with red line.
Sidney Island contains critical habitat for variety of bird species and marine life, and the northern part of the island and adjacent waters were established as the Sidney Spit Provincial Marine Park in 1961 (Maurer, 1989). In 2003, this area became incorporated within GINPR, and current uses of the island consist primarily of recreational activities such as camping and walking (Parks Canada, 2012). The island is accessible by private boat or by a seasonal ferry, which typically runs from late-May to early-September (Parks Canada, 2012). Marine areas around the island are used by boaters, and some fishing activities are permitted in these spaces (e.g., Fisheries and Oceans Canada, 2014).
Geovisualization
The geovisualization was built using a combination of data retrieved from Parks Canada and collected through fieldwork. Fieldwork was conducted over 16 days, and field data captured different aspects of the parks such as types and locations of various beach sediment, positions of shoreline at different tidal levels, positions of different viewshed features, and numbers and locations of people, wildlife, plants, and objects (Figure 2). The nature of field data varied depending on the item modeled; however, it primarily consisted of photographs collected using Canon T2i camera and spatial data collected using a Garmin eTrex 20 GPS device.
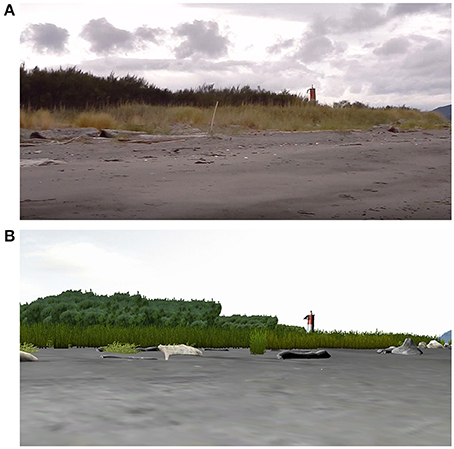
Figure 2. Photographic image of Sidney Spit and screenshot of geovisualization. (A) Features a photographic image taken at the north end of Sidney Spit (extracted from video footage). (B) Features a screenshot of the geovisualization taken from the same location and perspective as the photograph.
It is important to note that sense of place can be influenced by environmental conditions, which can vary depending on the time of year, e.g., changes in weather and temperature (Campelo et al., 2014). Therefore, when developing a realistic depiction of a place, decisions need to be made around what conditions will serve as the “benchmark” for the simulation (O'Neill et al., 2005) and fieldwork needs to be planned accordingly. In the case of this study, the majority of the data was collected from late-July to early-September. This was deemed to be an appropriate benchmark because the geovisualization was designed as a tool for inclusive management and many visitors will access the park during the summer months when the seasonal ferry is running (see Section Study area).
Building the geovisualization involved a combination of ArcGIS (v10.3.1), Unity3D (v5.3.4), Adobe Photoshop (CS5), and Trimble SketchUp (pro 2015). ArcGIS allows for processing and organizing spatial data in order to ensure the geovisualization was built with spatial integrity. Unity is a gaming engine that was used to build the geovisualization and export the final product. Being a gaming engine, Unity allowed for a geovisualization that is dynamic and navigable, as recommended by Newell and Canessa (2017). In addition, the geovisualization was developed to be experienced from the egocentric or first-person perspective to create a sense of being “on the ground” (Orland et al., 2001), and Unity is a powerful platform for developing such an experience. Photoshop and SketchUp were used to develop (respectively) textures and objects. Photoshop also served as an intermediate between ArcGIS and Unity, meaning maps created in ArcMap were exported to and arranged in Photoshop before importing into Unity in order to align them properly within the gaming engine environment.
The modeling process first involved creating the land-to-sea surface by merging topographic and bathymetric data. Textures were mapped and applied to the surface to represent elements that comprise the beach and seafloor. A water surface was added and calibrated to different tidal heights. Vegetation (terrestrial and marine) was then added, as well as a variety of objects that represent different elements located within the coastal place (e.g., woody debris, human structures, wildlife, people, etc.). Viewshed imagery was incorporated into the model, representing ocean views seen from the park. A soundscape was also incorporated to represent sounds heard within the park. A detailed description of the modeling process can be seen in Section Building the geovisualization, and a video demonstration of the geovisualization can been seen on the project webpage: http://www.sidneyspitviz.com.
Focus Group
Focus group work was performed in two stages. The first stage was conducted in April 2016, and it involved a smaller group composed of six Parks Canada staff who worked within the branch responsible for the management of Sidney Spit. This group was recruited for the study because of their experience and familiarity with the park, thereby following methodology that employs small-sized focus groups comprised of people with expert knowledge (Onwuegbuzie et al., 2009). Professions within the focus group ranged, and included positions such as resource management, promotion, visitor experience, park ranger, and park interpreter.
The session was held at the Parks Canada office in Sidney and lasted 2 h; however, this paper reports on only part of the session (see Section Introduction). The session began with a 15-min presentation on how the geovisualization was built. The geovisualization was then presented on a 50-inch Panasonic TH-50PH12 screen, running the application from a Dell Precision T1700 computer with an NVidia Quadro K2200 graphics card and using external speakers for sound. The group was given a demonstration on navigating the virtual environment and viewing the various terrestrial and marine elements. We subsequently engaged in discussion around which elements contributed to realism and sense of place and which elements detracted from this sense (i.e., what was modeled incorrectly or was missing). The geovisualization was continually used during this discussion in order to stimulate comments and feedback around various aspects of the virtual environment and model elements.
In addition to sharing thoughts through discussion, participants were given a feedback form, which they used to provide written responses to three questions-(1) how does the geovisualization compare with the real-world environment overall, (2) what aspects contribute to realism and sense of place, and (3) what aspects detract from these qualities. The written feedback and notes from the discussion were entered into NVivo (v10), where it was thematically coded (Seidel and Kelle, 1995) and analyzed. Coding was based on the types of elements to which comments referred, and codes consisted of viewshed, driftwood, human constructions, vegetation, birds, people, dogs, boats, beach textures, dynamics, marine environment and species, and sounds. Coding was also done to capture whether data refers to aspects that contribute to realism and sense of place or aspects that detract from this sense.
The second stage of the focus group work was held in July and August of 2016, and it involved residents of the Capital Regional District (CRD) of BC. Recruitment was done through letter mail sent to a random sample of 300 addresses located within the municipalities of Sidney and North Saanich. These municipalities were specifically selected as they are nearest to Sidney Spit, thus allowing the study to follow methodology of other visualization research which examines responses of local residents (e.g., Lewis and Sheppard, 2006; Salter et al., 2009; Schroth et al., 2009). However, further recruitment was needed for the study, and this was done through snowball sampling1, which resulted in participants from other nearby municipalities. Altogether, 27 participated with most from Sidney (44.4%) and North Saanich (22.2%) and others residing in Victoria (11.1%), Saanich (18.5%), and View Royal (3.7%)2.
Focus groups were conducted over seven sessions, and they were held either in a conference room at the Mary Winspear Centre (Sidney, BC) or in the GIS Visualization Lab at the University of Victoria. Groups ranged in size, and (listed chronologically) consisted of seven, eight, two, two, two, five, and one3 participant(s). Focus groups sessions were 2 h in length; however, as with the Parks Canada group, this paper only reports on part of the session (see Section Introduction). The session began with participants filling out a form providing information on age, gender, and years residing in the CRD. Age distribution consisted of 63.0% aged 65 and over, 29.6% aged 55–64, and 3.7% aged 45–54 (the remaining 3.7% did not provide this information). Gender distribution consisted of 70.4% female and 29.6% male. The longest period of residence in the CRD was noted to be 70 years, the shortest was 2 years, and the median was 24 years.
Participants were given a brief presentation on the purpose of the research and a demonstration of the geovisualization. Similar to the Parks Canada session, the geovisualization was run on a Dell Precision T1700 computer and projected on a screen, and this was used to demonstrate what can be seen and how to navigate the virtual environment. However, unlike the Parks Canada session, each participant also was provided with a Lenovo ThinkPad T530 laptop (and headphones) equipped with the geovisualization4. After the demonstration, participants were given information sheets detailing the user controls and allowed to explore the geovisualization on their own. During this period, participants were given a feedback form similar to that used in the Parks Canada focus group, where they provided comments on both what contributed to and what detracted from realism and sense of place. At the end the session, a brief discussion was held, which also captured these points, and feedback form and discussion data were entered into NVivo and thematically coded (Table 1). Coding was done in the same manner as with Parks Canada with the exception of an additional “user control” code to capture the fact that participants could operate the geovisualization themselves using the laptops provided. Participants were also asked to rate how well the visualization resembles a real-world place on a scale of 1 (i.e., “not at all”) to 10 (i.e., “extremely well”), in similar manner to that done in other studies involving virtual environments (e.g., Bishop and Rohrmann, 2003; Baños et al., 2005).
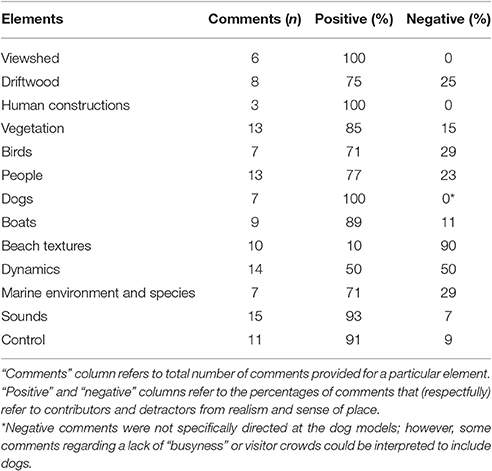
Table 1. Summary of local resident feedback on contributors and detractors from realism.
Providing participants with laptops held the advantage of giving the users the ability to directly interact with the geovisualization and freely explore the environment. In addition, it allowed participants to work independently, creating more opportunity for everyone to provide comments. However, it is important to recognize that the Dell Precision T1700 is a much more powerful computer than the Lenovo ThinkPad T530; thus, the laptops were equipped with a lower resolution version of the geovisualization that performed much more slowly.
Unlike the Parks Canada staff, it could not be assumed that all local resident participants have previously visited Sidney Spit, and albeit they would be familiar with the type of coastal environment being residents of the region, they might not be familiar with the specific place. This distinction is important because as argued by Newell and Canessa (2015), familiarity with the real-world place could affect how well a geovisualization connects with a user's sense of place. Accordingly, familiarity effects were investigated, and this took two approaches. The first followed Bishop and Rohrmann (2003) study on simulated environments, which noted that visiting a real-world place immediately before viewing a simulation of the place can positively influence users impressions of the simulation's realism. In the current study, such an effect was investigated by taking some groups out to Sidney Spit prior to exploring the geovisualization (groups n = 7, n = 8, and n = 1), while other groups either visited the park afterward (group n = 5) or not at all (groups n = 2, n = 2, and n = 2). The second method for investigating familiarity follows Tuan (1975) assertion that place is a function of the richness of experiences a person has with their environment. Participants were asked to indicate how many times they have visited Sidney Spit prior to the session (i.e., excluding the trip taken on the day of the session), and responses from those who had visited only once or not at all were classified as “unfamiliar” and those who have visited multiple times in the past were classified as “familiar.” Following this classification, the feedback data from the two different groups were compared (Table 2).
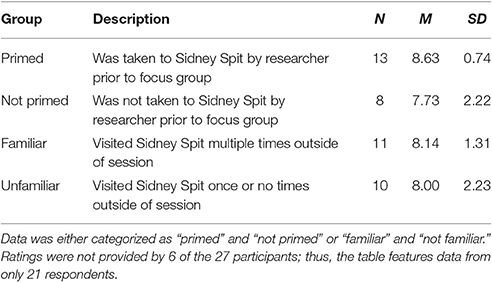
Table 2. Descriptive statistics of representation of place ratings.
As this research involved human participants, an ethical review was conducted and approved by the Human Research Ethics Board of the University of Victoria. Focus group participants were provided with a letter of informed consent that provided information on the research and their participation, and they signed these letters prior to engaging in the research. Signed copies were kept by the researcher, and participants were provided with unsigned copies for their reference. In accordance with the ethical review, names of individuals are not displayed in this paper, and references to particular participants are done using identification numbers.
Building the Geovisualization
Modeling Land-to-Sea Surface
The geovisualization captures the continuum from land-to-sea; thus, it was built upon a DEM of a seamless terrestrial-to-marine surface. This was created by merging topographic and bathymetric raster data obtained from Parks Canada. The topographic raster had a resolution of 2 m and was generated through LiDAR data. The bathymetric raster had a resolution of 25 m, and it consisted of a mosaic created from multi-beam data and a surface developed from contour and point data.
Previous research has noted that creating topo-bathymetric surfaces presents the challenge of reconciling vertical datums to ensure topographic and bathymetric data reference a common sea level (Myers, 2005; Bartier and Sloan, 2007). However, this challenge is irrelevant in the context of the current study, as the final exported geovisualization product did not ascribe to a particular geographical datum. Albeit spatial data is used to inform the build of the geovisualization, the tool is designed for place-based analysis and ultimately assumes a “sandbox” format, meaning that it focuses solely on elements that users can see and interact with when located within a defined, bounded space. It is therefore sufficient to make the model spatially relative (i.e., objects have the same relative positioning and orientation as they would have in the real place), rather than maintaining coordinate data of modeled items. Accordingly, rather than defining a common datum for the two raster sets, the topo-bathymetric surface was created by simply vertically shifting the topographic raster cells to align with the bathymetric raster (using the raster calculator in ArcMap), resulting in a terrestrial-to-marine surface with the right “shape.” The amount of shifting was determined by calculating 20 elevation differences between topographic and bathymetric cells that overlapped in nearshore areas, and then “raising” the topography by the average value.
Because the user experiences the geovisualization as one would if “on the ground,” it was important to maintain the maximum level of resolution in the DEM. Consequently, the 2 m resolution of the topography was used to define the topo-bathymetric raster, as this allowed for better representation of terrain shape and more realistic place experience than would the 25 m bathymetric resolution. This means that the bathymetry was artificially segmented into 2 m cells; however, the geovisualization is not intended as a tool for computational spatial analysis and thus this segmenting was not a concern.
The topo-bathymetric raster was imported into Unity as a heightmap and used to shape terrain assets. Unity operates in arbitrary units, and when importing a heightmap into the program, the length, width, and height extents of the terrain need to be defined. In this case, each unit was treated as a meter, and the model dimensions were 5,250 m (length), 5,250 m (width), and 117 m (height), with the height dimension based on a maximum observed elevation of 48 m and a minimum of −69 m. After defining the extents, Unity extrudes the terrain surface in accordance with the grayscale of the raster.
The workflow for using raster data to create three-dimensional terrain assets in Unity involves exporting the raster from ArcMap as a TIFF file, converting the TIFF to RAW format in Photoshop, and then importing the RAW file into a Unity terrain asset. As Photoshop serves as an intermediate between ArcGIS and Unity, it can be used to “smooth” the raster in a way that creates a better representation of what real-world terrain looks and feels like. Raster surfaces are composed of cells, and thus extruding these surfaces without smoothing can lead to “step-like” terrain shapes (Appleton et al., 2002). However, a Gaussian blur can be applied to the raster map when in Photoshop, and this spreads gray shading across cell borders, leading to smoother terrain when imported into Unity (Figure 3).
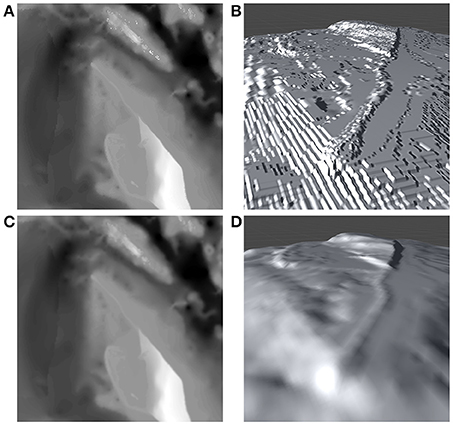
Figure 3. Differences in terrain assets between pre- and post-smoothing. (A) Displays the topo-bathymetric raster without smoothing effects applied, and (B) depicts the unsmoothed raster used as a heightrnap in Unity. (C) Displays the topo-bathymetric raster with a Gaussian blur applied in Photoshop, and (D) depicts the smoothed raster used as a heightrnap.
A higher level of detail was desired for surface textures in navigable areas because users will be directly on top of these surfaces. Therefore, the navigable terrain was segmented into eight pieces of 500 m by 500 m dimensions, as this allowed for terrain textures with much higher resolution. Impassible boundaries were created that encompassed an 85-hectare space within navigable segments, and this ensured that users could only walk on the smaller segments with higher resolution textures. Boundaries were invisible, and areas outside these boundaries served as viewshed components.
Segmenting the terrain presented two considerations around the preparation of heightmaps. Firstly, navigable terrain segments needed to fit within the larger non-navigable terrain. This was done by creating a “hole” in the latter, meaning that the navigable terrain area was “blacked-out” on the larger map in Photoshop (Figure 4A) and this area became a depression when extruded in Unity (i.e., because extrusion is based on the grayscale). The navigable segments were then arranged within the depression (see Figure 4B). The second consideration that presented itself when segmenting terrain was that grayscale needed to be coherent across all segments because Unity units are arbitrary and heightmaps are extruded according to the scale. To maintain coherence, two cells in each segment were resampled to represent the maximum (14.5 m) and minimum elevation (−31 m) observed among all eight pieces before conducting segmentation. These resampled cells served as reference points for elevation extents, ensuring that the grayscale represented standardized elevation changes when segments were clipped from the larger map and subsequently used as heightmaps for the smaller terrain assets.
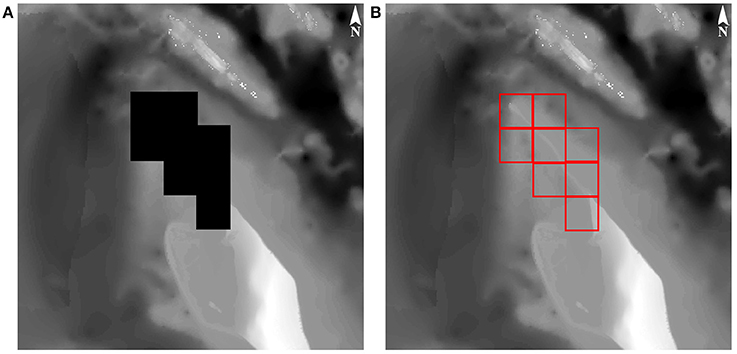
Figure 4. Segmenting of navigable terrain. (A) Displays the non-navigable terrain map with area blacked-out to create a depression for the navigable terrain segments. (B) Displays the eight navigable terrain segments fit into the map.
Terrain Textures
Terrain textures modeled elements that did not significantly protrude from the beach and seafloor, such as beach sediment, macrophytic wrack, pebbles, small pieces of woody debris, etc. In real coastal places, these elements have the potential to “speak” to the sense of place of various coastal users in different ways; for example, wrack deposits on the beach could be seen as “clutter” by some, whereas others might view it as part of a healthy local ecosystem (Thompson, 2007). Consequently, terrains textures have potential to play an important role in how geovisualizations connect with sense of place, and significant efforts were made to create high resolution surfaces that resembled the real-world environment.
One approach for mapping surface textures of real-world places onto terrain assets in Unity involves fitting orthophotographs on these assets; however, this approach can result in a model that is adequate only for aerial viewing as it suffers from poor resolution when experienced from the ground-level view (e.g., Bourke and Green, 2016). To avoid such issues, this research instead designed and employed a technique, which resulted in textures that are mapped like orthophotographic imagery but built with a much higher resolution. The technique, referred to here as “texture mapping,” involved taking pictures of the beach and collecting corresponding waypoints in a series of tracks that (for the most part) ran parallel to the shoreline. Collection occurred in 2–10 m intervals, depending of the variation in sediment type; that is, more pictures were taken in areas of higher variation. Point data was projected overtop of the topo-bathymetric raster in ArcMap, maps were exported from ArcMap as image files, and then they were fitted into a large Photoshop canvases (20,000 px by 20,000 px) (Figure 5A). Batch processing was used to scale down beach photographs in a manner that (roughly) matched the map dimensions, and the scaled images were placed on top of the appropriate points (Figure 5B). Gaps were then filled in using Photoshop tools such as clone and pattern stamping (Figure 5C). The result of this technique is a high resolution surface with different sediment textures that mapped in a way that they appear (approximately) in the same areas as observed during field collection (Figure 5D). It is worth noting that this technique involves significant data collection, and the texture maps that were built use approximately 2,300 photographs with corresponding waypoints.
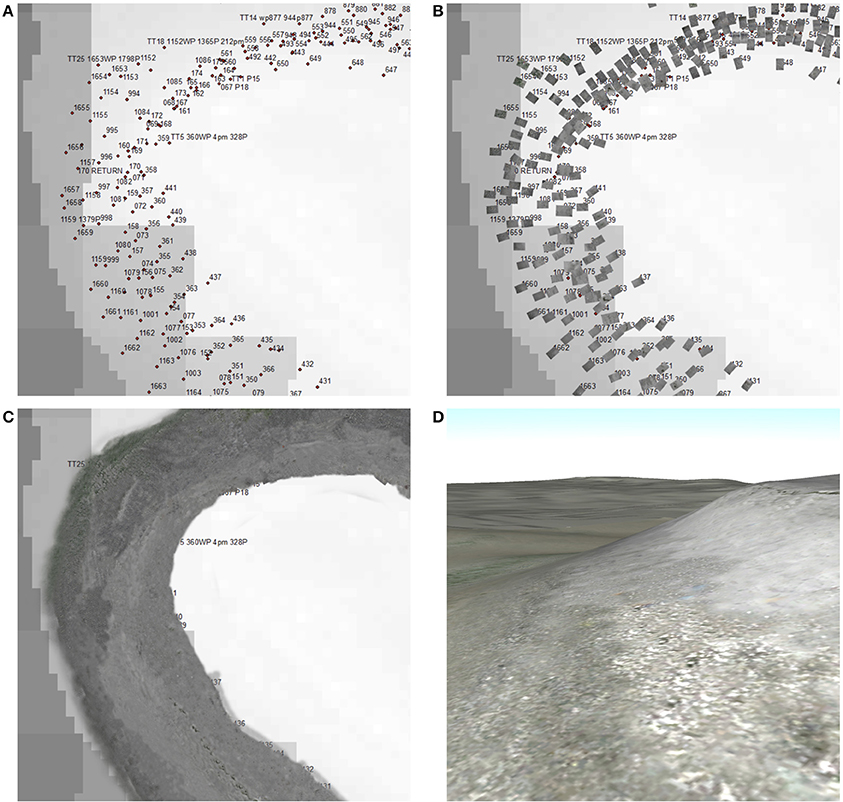
Figure 5. Mapping of surface textures. (A) Shows a map of locations where beach texture photographs were taken. (B) Shows scaled-down images of beach textures superimposed on mapped points in Photoshop. (C) Demonstrates results of building the remainder of the surface texture using clone and pattern stamping tools. (D) Depicts the texture map placed on a terrain asset in Unity.
Texture mapping was also done for the marine environment, and seafloor photographs were collected during snorkeling fieldwork using a GPS-enabled waterproof camera (Nikon AW130). However, due to visibility issues, underwater images were not directly applied to texture maps. Instead, terrestrial images that held similar compositions to the various underwater images (e.g., a similar proportion of algae to sand) were applied to the marine points on the texture maps, and seafloor texture was built using this imagery.
Water Elements and Tides
When modeling other aspects of the geovisualization, texture maps were temporarily removed and other maps were fitted onto terrain assets to serve as references for positioning the different elements. These types of maps, referred to here as “reference maps,” were used to model shoreline and water levels at different tidal heights. The shoreline was mapped at three different tides, capturing low tide (0.2 m), medium tide (1.9 m), and high tide (3.2 m). Maps were exported from ArcMap and arranged in Photoshop in order to fit the terrain assets in Unity properly (i.e., in terms of orientation and extent) (Figure 6A). The reference maps were then applied to the terrain surfaces in Unity. A water surface element was obtained through Unity's standard asset library, added to the model, and then raised until it roughly aligned with the mapped shoreline data (Figures 6B,C). As three tidal levels were mapped, a separate scene was created for each level, and users can experience the geovisualization at low, medium, and high tide by clicking key commands that load respective scenes.
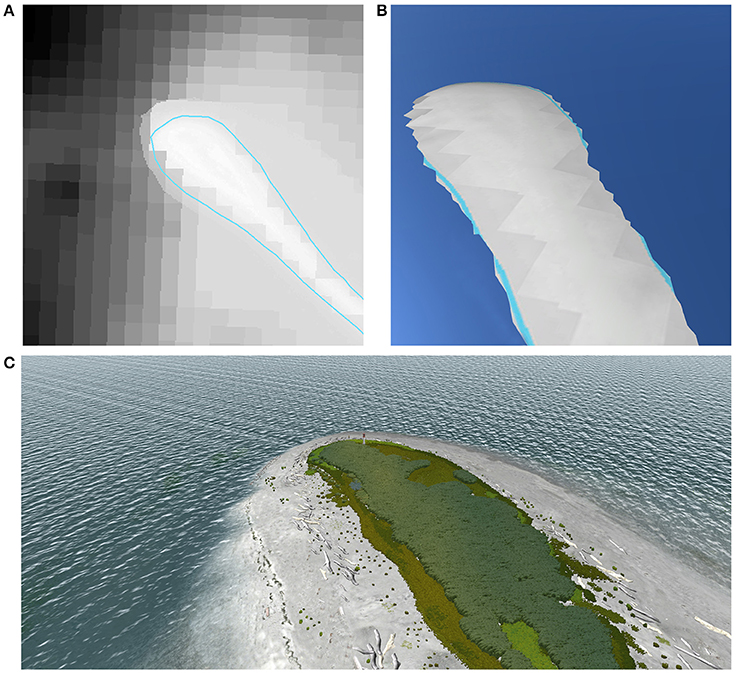
Figure 6. Adding water surface element. (A) Shows shoreline mapped at medium tide (1.9 m). (B) Depicts the process of using the shoreline reference map to fit the water surface element to the appropriate tidal level. (C) Shows a water surface asset fitted to the appropriate tidal level and with surface effects applied.
Certain areas of Sidney Spit are flooded at high tide; thus, walking along the spit during high tide can constitute a different place experience than that of low tide (i.e., wading through water rather than walking on beach). However, such differences were not initially modeled in the geovisualization when extruding the topo-bathymetric heightmap, as the raster did not adequately capture the depressions where flooding occurs. To rectify this, 3D modeling tools (from Unity's toolset) were used to depress terrain in flooding areas, using the high tide reference map to guide this modeling. Terrain was depressed only to the extent where areas were flooded at the appropriate tidal levels (e.g., some areas flooded at high tide but not at medium and low tides), ensuring the geovisualization properly depicted flooding patterns of the real-world environment.
Previous efforts on developing realistic geovisualizations of marine places have applied fog effects to represent the poorer visibility of the underwater environment (Canessa et al., 2015). In a geovisualization that captures solely the marine environment, a fog effect can be applied to an entire virtual environment; however, this is more complicated in a coastal visualization that transitions from land to sea, as visibility differs depending on whether the character is above or below the water surface. In order to capture visibility changes, a “collider” was placed in the marine environment that triggers a fog effect once the user submerges underwater. When emerging above the surface and exiting the collider, it triggers once again and the fog effect is disabled.
Vegetation
Bushes, grasses, and other small plants were built as “terrain detail” items, which refers to two-dimensional elements placed orthogonally to terrain surfaces that always face the viewer regardless of the viewing angle. Some plant models could be retrieved from Unity's standard asset library and customized for the geovisualization (particularly dune grasses); however, the library did not contain models for many of the local plants such as silky beach peach, yellow sand-verbena, sea asparagus, and Scotch broom. Therefore, many of the plant models were built in Photoshop, using photographs taken in the field for developing realistic depictions. When placed in the model, a “bend factor” was applied to plants, which caused them to sway as if blowing in the wind in order to convey the impression of windy coastal environment.
Plants were positioned within the model using multiple methods. Vegetation found in large dense patches, such as the Scotch broom located at the north end of the spit, were added to geovisualization using orthophotographs (retrieved from Parks Canada and Google Earth) as reference maps. Less conspicuous plants that were more difficult to see through orthophotography were added using reference maps created by walking around vegetation areas and taking photographs (with corresponding waypoints) at various points along the walked route. When placed on terrain assets, these vegetation reference maps were used by looking at photographs corresponding to point data and examining them for the types, densities, and compositions of plants adjacent to said points. Vegetation found in smaller patches, such as seen with sea asparagus or dune grasses located closer to shore, were added to the map using reference maps created from GPS tracks that followed patch borders and photographs of the patches to estimate vegetation density (Figure 7).
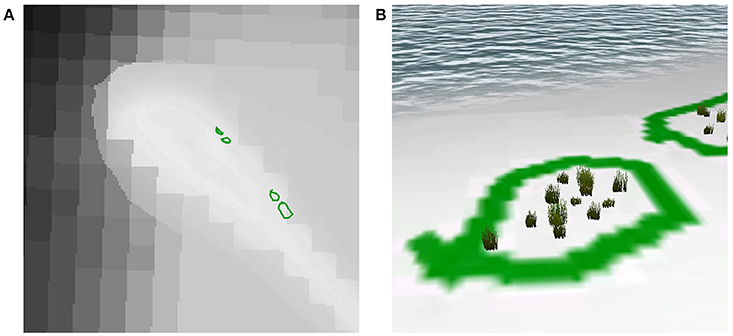
Figure 7. Mapping of small vegetation patches. (A) Shows a map of locations of small grass patches on the beach. (B) Depicts the map fitted to terrain assets in Unity for informing where grass elements are added to the geovisualization.
Marine vegetation also was featured in the geovisualization, with particular attention given to eelgrass meadows (Figure 8). Eelgrass is an ecologically important species that provides habitat and shelter for wildlife (Dumbauld et al., 1993; McDonald et al., 2001), and thus modeling the position and distribution of eelgrass meadows around Sidney Spit was deemed important. These meadows have already been mapped through previous research efforts using remote sensing techniques (O'Neill et al., 2011), and maps from this work were used as reference maps for placing eelgrass within the geovisualization. Heights of eelgrass blades were adjusted according to depth; that is, eelgrass in deeper areas were modeled with taller blades.
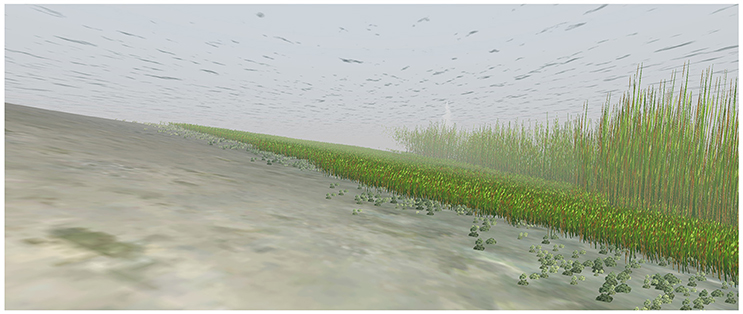
Figure 8. Marine environment within geovisualization. Image features a screenshot of the marine environment within the geovisualization, taken from a location where eelgrass and sea lettuce elements can be observed.
Sea lettuce models were also added to the geovisualization; however, maps were not available for sea lettuce patches. Instead, sea lettuce elements were placed within the model using images obtained during the snorkeling fieldwork, as these allowed for a rough idea of sea lettuce densities in certain areas. It is important to note that sea lettuce is represented through the texture maps placed on the terrain surfaces; however, it was also added as a terrain detail item in marine areas because of how sea lettuce floats when underwater (i.e., it is less “flat” than what is depicted through the texture maps).
Trees were also added to the geovisualization; however, unlike other vegetation, tree elements consisted of three-dimensional models (obtained through Unity's standard asset library), rather than terrain detail items. Most tree elements were positioned outside of the navigable area, such as in the southern portion of the park and the nearby Forrest Island; thus, they primarily served as viewshed components. Trees were added using orthophotographs to create reference maps, similar to how the large vegetation patches (e.g., Scotch broom) were modeled.
Objects
Objects were either created using SketchUp or (in the case of more complex designs) purchased through the Unity Asset Store and then modified/customized to suit the geovisualization. Objects consisted of both stationary (i.e., not animated) and dynamic (i.e., animated) elements. Modeling of stationary objects employed similar techniques from object-to-object, and these objects included signs, litter, picnic tables, beached dinghy, dock, fences, lighthouse, and pilings. Similar to the processes for modeling tides and vegetation, stationary objects were added using reference maps created from either field data (Figure 9) or orthophotography. Large woody debris also was added to model, and this was done in a process similar to that described above with the “less conspicuous plants” (see Section Vegetation). Photographs of woody debris were taken with corresponding waypoints, and these points were subsequently used to create reference maps. The appropriate concentrations/sizes of debris objects were then added to the geovisualization, as informed by reference maps and corresponding photographs.
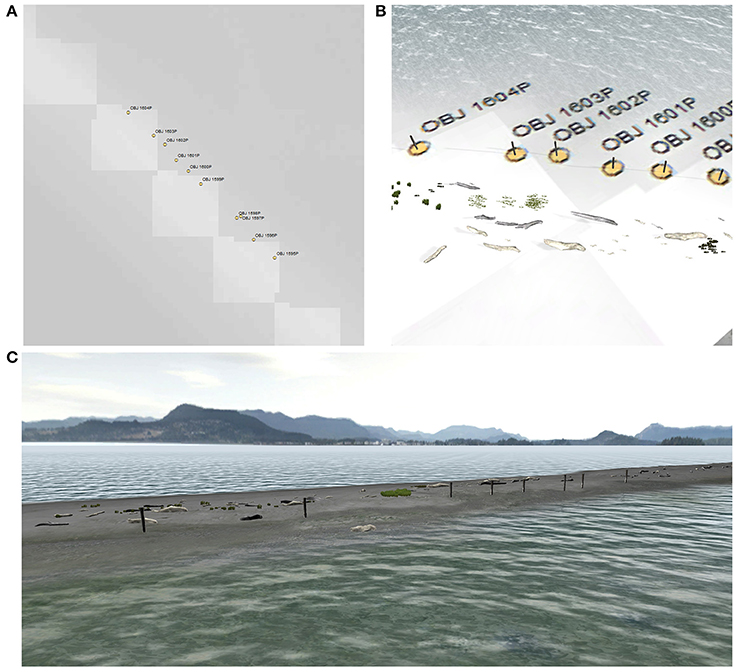
Figure 9. Object mapping of pilings. (A) Shows a map of waypoints representing locations of pilings on Sidney Spit. (B) Depicts a reference map fitted to a terrain asset in Unity and used to inform where piling elements are added. (C) Displays a screenshot of the geovisualization featuring the added piling objects.
The majority of stationary objects were built in SketchUp, using textures created from photographs collected in the field (the exception to this being the picnic table model, which was purchased through the Unity Asset Store). Smaller objects were scaled in Unity using the convention of 1 Unity unit is equivalent to 1 meter, and dimensions were calculated by photographing and comparing an object of known dimensions to the object-to-be-modeled (e.g., a water bottle was placed next to the pilings prior to taking their pictures). Pieces of larger objects, such as dock posts and fence railings, were scaled in similar manner; however, orthophotography was also used to capture the ground extent of the full objects (i.e., the entire dock, the complete fence).
Dynamic objects required a variety of techniques depending on the nature of the object, and further information on these techniques can be found in the Supplementary Material. Dynamic objects included people, dogs, gulls, crabs, and boats. Distributions of people and dog models were determined through counts conducted at various points on and near the Long Spit during fieldwork, and the models were animated to represent the types of activities people/dogs engage in when in the park (based on anecdotal observations). Gull models were distributed throughout the geovisualization based on field observations, and animations were applied to these models to depict them as living animals (e.g., gulls turning heads, occasional foraging, and wing flapping). Dungeness crabs models were placed on the edges of eelgrass meadows to convey the reliance of the species on these meadows (Dumbauld et al., 1993; McDonald et al., 2001), and the models were animated in a manner that made it appear as if the animals were walking in and out of the meadows. Boat models were positioned off the western side of Sidney Spit in an area where mooring buoys have been placed by Parks Canada for the use of park visitors, and they were modeled in such a manner that captures both boats using the mooring buoys (Figure 10A) and boats using their anchors5 (Figure 10B). In addition, boats traveling near Sidney Spit (i.e., boats that can be viewed from within the park) were included within the geovisualization, and they were animated to represent boats in travel.
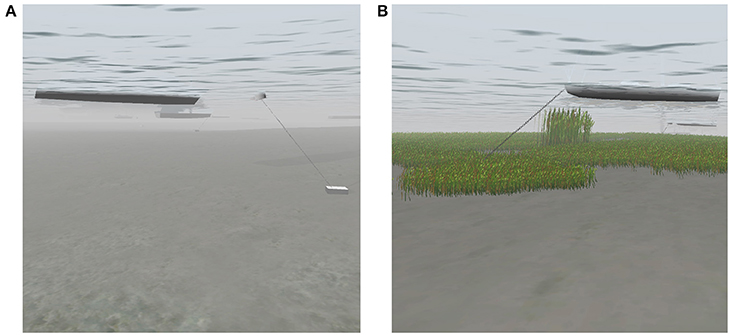
Figure 10. Modeling of mooring buoy systems and anchored boats. (A) Depicts a model of a boat tied to a mooring buoy. (B) Depicts a boat using an anchor instead of a mooring buoy.
Distant Viewshed Elements
Some viewshed elements were captured within the non-navigable terrain; however, this excluded distant elements that extended beyond this area. Instead, such distant elements were incorporated into the geovisualization using a skybox, which is a cube that encompasses a virtual environment and contains images on the inside panels to serve as background scenery (e.g., Hong-ge, 2010; Hu et al., 2012). A panoramic image was stitched together using photographs taken from various points around Sidney Spit, and this image was fitted to the inside of the skybox. However, Unity does not contain a function for aligning the skybox in a geographically accurate manner; thus, a method for doing this was designed. For each panoramic picture, a corresponding waypoint was collected (111 points in total) and the direction the photograph was taken was recorded. When projected in ArcMap, an eight-point star symbol was selected to represent the point data (Figure 11A), and a reference map was subsequently created. A skybox with a ruler spanning the panels was then created and imported in the geovisualization, and using the star symbols for orientation, the ruler points served as reference points for aligning the panoramic imagery (Figure 11B). For example, when standing at point 1,133 and facing northeast in the virtual environment, one would see a particular ruler mark in the center of his/her field of vision. By comparing this to the photograph taken facing northeast at point 1,133 in the real-world environment, the alignment of the panoramic could be determined. This process was done for 10 points, which provided enough reference for building and aligning the skybox in a geographically accurate manner (Figure 11C).
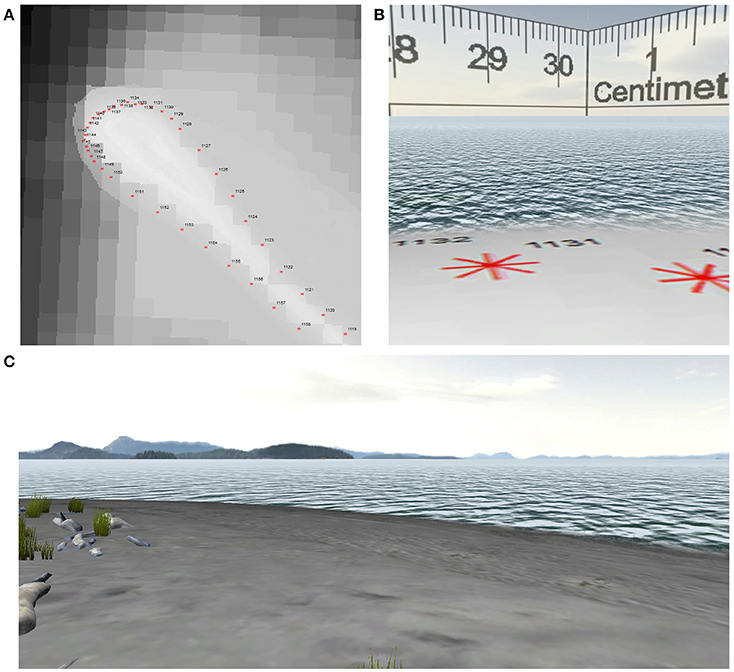
Figure 11. Aligning viewshed imagery. (A) Shows a map of waypoints where viewshed photographs were taken. (B) Shows the map fitted to terrain in Unity, and a ruler skybox used for guiding alignment of viewshed imagery. (C) Exhibits the final product with viewshed imagery properly aligned.
Sound
Sounds incorporated into the geovisualizations include ocean waves, boat motors, gulls cawing, dogs barking, people walking on the beach, greetings from other park visitors, and sounds of conversation. Sounds with distinct sources (e.g., footsteps of people, boat motors, etc.) were directional (i.e., stereo sound) and increased in volume as the user approached the source. Many sounds were triggered by colliders; for example, greetings would sound as the user entered a collider attached to front of a person model, giving the user the sense of being greeted by another park visitor (Figure 12). Colliders were also used to change ambient sound when above and below the ocean surface, resulting in ocean waves heard above the surface and a softer “bubbling” sound heard below. It is worth noting that the soundscape was designed in manner that all above-surface sounds could not be heard when in the marine environment with the exception of boat noises, and this exception was made in recognition of growing research around underwater noise pollution from marine vessel traffic (Simmonds et al., 2014; Williams et al., 2014, 2015).
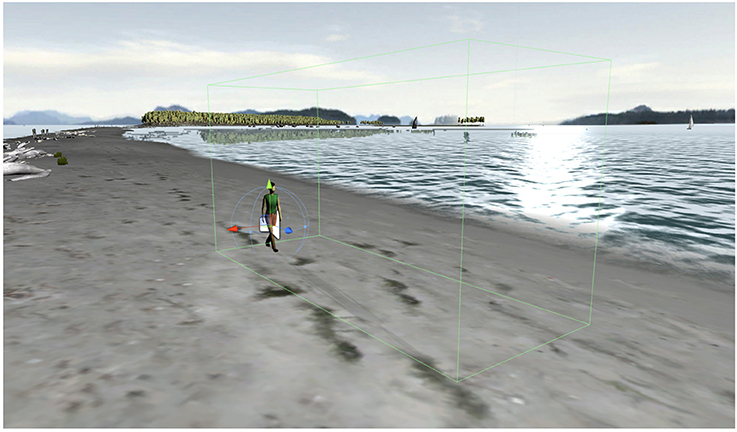
Figure 12. Person model equipped with sound collider. Green box around the person model represents a sound collider. When the user character enters the collider, a greeting sound is triggered, giving the user the sense of being greeted by another park visitor.
User Character
The geovisualization is experienced from the first-person perspective, and the camera was vertically set to emulate an adult park visitor of a height of approximately 170 cm. When navigating the virtual environment, the camera moves at a speed of 10 km/h, which is faster that one would normally move in the real-world. However, as found in previous research (Bishop and Rohrmann, 2003), people perceive their movements in virtual environments as slower than the actual speed the camera travels. A faster walking speed was selected to compensate for this perception and to allow users to navigate the environment at what appears as a reasonable pace. In addition, because the geovisualization covers a sizable area (i.e., 85 navigable hectares), “teleportation points” were positioned in various places along the spit, allowing users to instantly travel to a particular point using a key command.
The users' movements were linked with sounds associated with walking in a coastal places, and such sounds varied depending on where the user was within the virtual environment. For example, sounds of footsteps on sand could be heard when walking on beach, sounds of footsteps on wood could be heard when on the dock, and “splashing” sounds were heard when wading in water. In addition, footsteps sounds are replaced with water “swishing” sounds when in the underwater environment.
Focus Group Results
Parks Canada
Contributors to and Detractors from Representation of Place
Parks Canada participants expressed that (for the most part) the geovisualization was realistic and resembled Sidney Spit well. Particular aspects of the geovisualization that contributed to its representation noted in the feedback forms included beach textures (n = 2) and driftwood (n = 2). For the former, specific mentions were made of the beach wrack elements in surface textures, which aligns with aforementioned notion that certain beach texture elements (such as algae deposits) can “speak” to sense of place (see Section Terrain textures).
Viewshed elements were also mentioned as a positive aspect of the geovisualization, and some participants (n = 3) noted in their feedback forms that this contributed to the representation. However, one negative comment was made, where a participant mentioned that a nearby island within the viewshed (i.e., Forrest Island) detracted from realism. During the group discussion, the comment was expanded upon by explaining that the colors were much brighter than those of the other viewshed items, and thus it look too distinct and less realistic. The island was part of the three-dimensionally modeled terrain rather the surrounding skybox, and what the participant's comments indicate is that these differences in how these elements were modeled affected the coherence of the viewshed.
“The island to the north looks less realistic than the rest” (Participant 6).
Positive comments were made around the marine environment within the geovisualization. One participant mentioned the change in visibility, noting that this contributed to the underwater experience. Others positively commented on the inclusion of eelgrass, and these comments led to discussion around potential for using the geovisualization to raise awareness around impacts anchoring can have on eelgrass meadows. However, some suggestions for improving the marine environment were made, particularly with adding more animal species as currently Dungeness crabs are the only marine animal featured in the geovisualization.
Several participants noted the incorporation of sound to be a positive aspect of the geovisualization in the feedback forms (n = 4), particularly the sounds of footsteps and gulls. One negative comment was made around the sound, referring to the ambient wave noise as being too loud. However, for most part, the soundscape was regarded as a contributor to realism and sense of place.
The major aspect of the geovisualization that detracted from the representation was noted to be the lack of bird diversity, which was mentioned in feedback forms (n = 2) and (more extensively) in group discussion. The park provides habitat for a variety of bird life (Maurer, 1989); however, only gulls were included in the geovisualization and thus bird diversity was not captured. The participants expressed that this was a major missing piece, noting the absence of sandpipers, plovers, eagles, and herons. In addition, the participants discussed the absence of purple martins and the nesting boxes that were installed on the main dock by Parks Canada. They indicated the birds and nesting boxes to be salient aspects of place by expressing how they regularly notice the birds/boxes when first entering park from dock and (thus) their absence was conspicuous.
Vegetation also was noted to be a detractor from realism and sense of place. Similar to the birds, the lack of tree diversity was commented on, specifically noting the absence of Arbutus tree species. In addition, the grass on the dune was noted to be too dense and uniform in height, giving it a less natural and more “crop-like” look.
“Dune grass at very tip near light beacon–too uniform/crop-like” (Participant 3).
Other aspects that detracted from the representation related to how the geovisualization did not capture the perceived “busyness” of the park. In the feedback forms, participants noted that more boats (n = 2), people (n = 2), and dogs (n = 2) are typically found within the park. Specific mentions were made of the absence of boats tied to the dock and of people/dogs in the visitors area. Comments on the scarcity of dogs in the geovisualization were followed by discussion on issues concerning off-leash dogs disturbing local wildlife, indicating that the noted scarcity was linked with concerns for place.
“Day-use [i.e., visitors area] should be busier with people and dogs” (Participant 3).
“Should be boats tied to the dock” (Participant 5).
“In my experience, there are many more boats on the dock, many more people” (Participant 6).
Participants mentioned that the starting point within the geovisualization detracted from the feeling of being in the real-world place, referring to how it loaded with the user at the north end of the spit. This starting point was selected because the fieldwork began here and more data was collected for this portion of the park. However, as noted in the group discussion, the vast majority of visitors enter the park through the main dock, and thus this would be a more appropriate starting point in terms of capturing place experiences.
Some of the coded data could not be classified as predominately positive or negative in response; for example, human-constructed elements within the geovisualization received “mixed” responses. Positive responses were given for textures on these objects, such as the creosote on pilings and the legible images on signs (Figure 13). However, negative responses were also provided, particularly concerning the absence of certain objects such as dock signage and payment vaults.
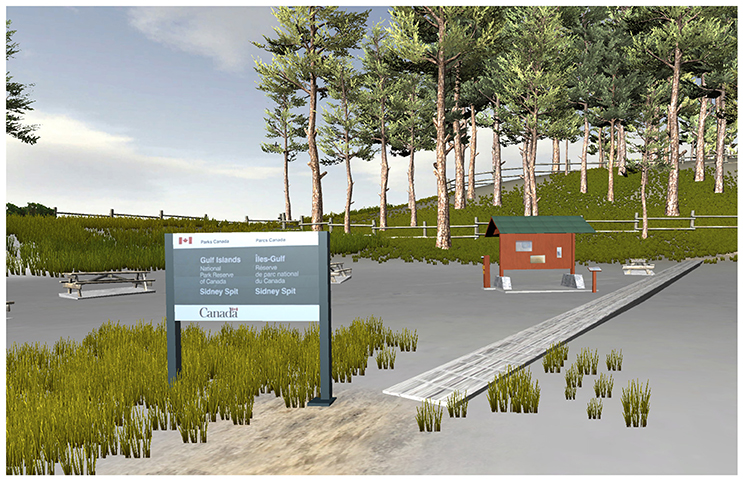
Figure 13. Visitors area within geovisualization. Signage within the visitors area was made using photographs of actual signs and is legible to geovisualization users.
Another aspect that received mixed responses was the dynamics within the geovisualization. Dynamic elements such as the movement and ripples on the water surface were regarded positively. However, other dynamics were regarded more critically; in particular, the swaying animation of vegetation in the wind was noted to be too dramatic. Such observations illustrate the importance of giving due attention to how dynamic elements should be animated, rather than simply thinking about what should be animated.
Modifications to Geovisualization
In recognition of the Parks Canada feedback, five more people models were placed in geovisualization (within the visitors area), and these were equipped with animations and sounds to depict a group of visitors engaged in conversation. In addition, an off-leash dog running up and down the northern end of the spit was added, and gulls reacted to the dog by flying away when it approached6. Five boats tied to the dock were also added, and the dock was set as the starting point. Furthermore, the bend factor in the grass was reduced to make the swaying animation less dramatic, and the range and randomization of grass blade heights were increased to reduce uniformity. Finally, ambient ocean wave sounds were reduced in volume. All these modifications were made prior to local resident focus groups, and thus local resident participants interacted with the modified version of the geovisualization.
Local Residents
Contributors to and Detractors from Realism
The overall response to the geovisualization in how it represented a real-world environment was positive, and it received a mean rating of 8.1 (n = 21). Interestingly, it was noted in multiple focus groups that imagery clearly looked like computer rendering; however, this did not detract from sense of place. Such comments align with observations made by Turner et al. (2013), who found sense of place could be evoked through stylized (i.e., less photo-realistic) virtual environments.
Several similarities were observed between Parks Canada and the local resident focus groups in terms of what contributed to realism and sense of place. For example, viewshed elements were mentioned as contributors (n = 6), in particular skybox elements such as islands, landscape, clouds, and mountains. The presence of driftwood was also mentioned as a contributor by several participants (n = 6), although two participants did not did not like the design of the driftwood models. Human-constructed elements, such as signs, were regarded positively by three participants, and one of these participants made comments similar to those of Parks Canada regarding the legibility of signs, suggesting that being able to read signs is form of interaction that contributes to geovisualization's representation of place.
“Posters are readable on bulletin board!” (Participant 25).
In contrast to the Parks Canada session, vegetation for the most part was regarded positively with many noting in their feedback form that this contributed to realism (n = 11) and fewer providing negative comments (n = 2) around this aspect of the geovisualization. Participants made specific references to the grasses (n = 7) and trees (n = 5), and two participants spoke positively about the diversity of vegetation. Birds were also regarded less critically with only one comment in the feedback forms around the lack of diversity (and another critiquing the design of the bird models), whereas five comments indicating that the bird elements contributed to the representation.
The presence of people and dogs were noted in the feedback forms as contributors to realism and sense of place (respectively, n = 10 and n = 7). One participant referred to a specific person model within the geovisualization as “holding our gaze,” indicating that the user's interaction with this model is effectively being perceived as a social interaction. However, albeit comments were mostly positive, two participants7 echoed Parks Canada sentiments concerning the lack of busyness in the geovisualization, despite the addition of more people models and another dog. One participant specifically referred to the “large crowds” they experienced during their visit and expressed concerns around managing this level of visitor traffic. Similarly, the presence of boat elements also were noted to be a contributor to place (n = 8); however, at least one participant felt there were too few to adequately capture the busyness of the environment.
“Guy in red t-shirt shifting feet and holding our gaze” (Participant 22).
“Missing are the large crowds the day we were there - how will Parks [Canada] deal with these” (Participant 1).
As with the Parks Canada session, sounds were considered by many as a great contributor to realism and sense of place (n = 14) with some mentioning during group discussions that this was the best aspect of the geovisualization. Some participants specifically commented on sounds associated with particular aspects of the environment, such as dogs (n = 2), boats (n = 2), and people (n = 2), and with the latter, one of the participants noted that the people speaking “seemed natural.” The only negative comment associated with sound involved a participant noting that she would have liked to have understood some of the conversations8, which could be interpreted as the people models being convincing enough that they spurred a desire for further interaction. Other positive comments around sound related to changes in footstep sounds when in different parts of the geovisualization (n = 2), particularly the splashing sounds when wading in water.
“Liked the fact that people spoke–which seemed natural” (Participant 13).
“When approach group of people, would have liked to hear what they are talking about” (Participant 27).
Local resident focus group sessions differed from the Parks Canada session in that participants were provided with laptops to explore the geovisualization on their own. In turn, many local resident participants provided comments through feedback forms around how user control contributed to the geovisualization experience (n = 10), and only one participant provided a negative comment around this aspect (specifically noting that the movement speed felt somewhat slow). Four participants noted the ability to look in different directions as a benefit, and during the discussion, one of these participants specifically noted having the ability to look up toward flying birds after seeing shadows coincided with the instinctual responses he would have in the real world. In addition, three participants commented on the ability to move across the land-sea interface as strong aspect of the geovisualization. These points were reinforced during the discussion as some expressed that the ability to enter the marine environment was one of the most important aspects of the geovisualization, discussing how it portrays coasts and interconnected terrestrial and marine environments. It is also worth noting that changing the starting position to the main dock did appear to contribute to the geovisualization's effectiveness, as a participant noted that it contributed to a sense of “being there” in the real-world environment.
“Starting at the dock–totally felt like I was there” (Participant 20).
In contrast to the Parks Canada session, the beach textures were noted by many local resident participants as detractor from realism and sense of place (n = 9). In some cases, these comments referred certain items that were not included in the textures such as footprints; however, many of the comments referred to items that were in the textures but more difficult to see in the lower resolution laptop versions (e.g., shells, small pieces of wood). In addition, the contrast between sand and water was poorer on the laptop screens, making it difficult to differentiate between the two bodies. Because Parks Canada participants did not use laptops, this was not described as a detractor in this session, and it was clear through the discussions and feedback forms, local resident participants recognized the issue as being with the laptop version.
“The details on the “[projected] screen” are more realistic and easier to follow” (Participant 20).
As with Parks Canada, dynamic elements received mixed responses with some participants mentioning contributors (n = 7) and others noting detractors (n = 7). Comments on contributors generally referred to the presence of animations, such as people walking, dogs running, and waves washing ashore (it is worth noting that grass swaying in the wind also was noted as a contributor, indicating that reducing the bend factor was effective). Detractors were more specific around behaviors, noting movements that did not appear “right” such as some people moving too “jerkily” and gulls not foraging in the correct manner. Such observations reinforce the notion that attention needs to be given to how dynamic elements are animated, and in certain cases such as with wildlife elements, architects of geovisualizations can collaborate with ecologists to develop better animations that model behaviors in a more convincing manner.
As noted above, the ability to enter the marine environment was regarded positively; however, the elements displayed in this environment received a more mixed response. Some participants made positive mention of the eelgrass (n = 3) and crabs (n = 2), but the lack of other species was commented on in feedback forms (n = 2) and also emerged as a topic in group discussions. In addition, some participants mentioned that they might not have even noticed the crabs if they were not pointed out during the demonstration. Such observations indicate that expectations around vibrancy of marine ecosystems were not met with the geovisualization.
Familiarity Effects
Quantitative analysis on the ratings of how well the geovisualization represents a real-world place did not produce statistical evidence for supporting the notion that familiarity influenced these values. This was the case for both approaches for investigating familiarity effects, where categorization was done with people “primed” with a visit to Sidney Spit prior to the focus group [t(19) = 1.09, p = 0.28] and with people that have visited the park multiple times in the past [t(19) = −0.17, p = 0.87]. A potential explanation for this could relate to comments made during one of focus groups involving participants that were not taken to Sidney Spit. It was noted during group discussion that the geovisualization was very “typical” of BC coastal places. If this sentiment was shared among participants in other groups, then it could be argued that the virtual environment held a certain degree of familiarity to all participants as it resembled other local coastal places, regardless of whether the participant had specific familiarity with Sidney Spit Park.
Albeit familiarity effects were not observed with ratings data, an interesting trend was observed when examining coded feedback data. When categorizing groups into “familiar” and “unfamiliar,” all positive comments around viewshed elements (n = 6) were associated with “familiar” group. Similarly, when categorizing into “primed” and “not primed”, most viewshed comments (n = 5) were associated with the “primed” group. No other geovisualization element exhibited such a noticeable coding difference, and it is possible that viewshed elements in particular can speak more strongly to sense of place of people that have experienced and/or are familiar with the specific real-world place. This notion is further supported by the fact that Parks Canada participants (i.e., a “familiar” group) also brought forward viewshed elements as strong contributors to realism and sense of place.
Discussion
Newell and Canessa (2015) posit that geovisualizations are effective collaborative planning tools due to their capacity for connecting with people's sense of place, and building on this thinking, the current study conducted applied research to examine the considerations around place-based approaches to coastal geovisualization. As discussed in Section Introduction, such considerations include how to model coastal “place” (as well as coastal space), how place-based experiences of the geovisualization architect can influence modeling, what elements are significant in terms of connecting with sense of place, what aspects might detract from this sense, and how to incorporate multisensory experiences associated with places into a virtual representation. Each of these considerations are important in terms of how a geovisualization represents and connects with particular place meanings and values, and thus they hold implications for geovisualizations' capacity as place-based tools for engaging different groups and stakeholders. This work on developing a coastal geovisualization and assessing/examining how it connects with sense of place has provided insights on these considerations, and these insights are shared through the sections below.
Modeling Place
The current study is novel in how it focuses on modeling place rather than space; however, as demonstrated in the research, such place-based modeling is strongly linked with spatial considerations. Sheppard (2001) noted that a visualization can realistically portray a place without accurately representing a real-world location, and such a comment reflects consequences of capturing place features without due attention to space. Space and place are both fundamental properties of geography (Agnew, 1987); therefore, albeit this research focuses on place-based tools, this process of geographical visualization required attention to both properties. However, this being said, spatial considerations were handled differently with this place-based tool than if preparing a tool for spatial analysis. For example, creating the topo-bathymetric raster did not require reconciling vertical datums as the aim was simply to develop a surface with the correct land-to-sea “shape,” and in addition, raster cells were distorted with a Gaussian blur to better capture said shape. As another example, boats traveling past the park were not modeled using vessel tracks; rather, they were set on paths with particular distances from the shoreline to accurately emulate place-based experiences of observing boats when viewing the ocean (see Supplementary Material). Similarly, distant viewshed elements were not modeled in terms of their actual location around Sidney Island; instead, they were prepared as a two-dimensional panoramic, fitted in a skybox, and then oriented to accurately represent the viewshed. Ultimately, developing place-based tools involves consideration around both space and place; however, with many of the modeled elements, spatial work was done in the context of place, meaning that place characteristics were aligned with spatial relationships.
Places are shaped by our lived experiences (Stedman, 2003; Gunderson and Watson, 2007), and thus the activities a person performs in a coastal place can influence their sense of place (Shackeroff et al., 2009). As seen in this study, such influences in turn can translate to how the architect of a coastal geovisualization models place. In some cases, this can contrast with the sense of place of the geovisualization users, e.g., initially setting the starting point at the north end of Sidney Spit was based on entirely the first author's fieldwork experiences, whereas the dock starting point better aligned with the place experiences of others. In other cases, there might be congruence in place experiences between the architect and users, e.g., the ability to read signs was incorporated into the geovisualization due to the first author's experiences reading the signs as soon as he entered the park and this feature was regarded positively by others who (likely) had similar experiences. In addition, because the activities people perform influence sense of place, it follows that their professions and interests do as well (Yung et al., 2003). When such professions/interests involve specialized knowledge, this can lead to nuanced perceptions of places; for example, Wood and Lavery (2000) found that seagrass scientists and coastal resource managers include particular biological elements in their images of certain seagrass meadows based on their knowledge of how healthy they perceived the meadows to be and what makes for a healthy ecosystem. Similarly, in this study, the lack of bird and tree diversity was apparent to Parks Canada staff, who had expert knowledge on Sidney Spit's ecosystem; whereas, this was not as conspicuous to those without the same level of knowledge, i.e., the researcher and local resident participants. Such observations suggest that attention needs to be paid to the user group when developing realistic geovisualizations because the exclusion of particular elements can reduce the tool's effectiveness for connecting with the sense of place of certain coastal stakeholders and (perhaps of more concern) for conveying potential effects/impacts to such elements when using the tool to display potential management options to these stakeholders.
Connecting with Sense of Place
The presence of people in the geovisualization was considered to be a contributor to realism and sense of place, with specific mentions made around how people models could speak and greet the user. This aligns with studies that describe social contexts as being part of sense of place (Lai and Kreuter, 2012; Campelo et al., 2014) and research that discusses how many coastal users value coastal places for their social opportunities (Thompson, 2007; Stocker and Kennedy, 2009). However, although the presence of people models was regarded positively, the abundance of people, or lack thereof, was regarded more critically (even after more models were added to geovisualization). The numbers and distribution of people were based on field data averages; therefore, fewer people in fact were observed in some field days than were present in the geovisualization. However, ultimately, focus group comments indicated that (at least for some) this did not adequately capture the busyness of the park. In light of these findings, perhaps using visitor traffic averages in modeling coastal place is not the best approach; rather, this would be better done through ranges and allowing users to experience “busy days” or “quiet days,” in a similar manner to how users can experience the geovisualization at different tidal levels.
Viewshed elements were regarded as contributors to realism and sense of place. This was somewhat expected, as it coincides with other research that describes ocean views as particularly important to certain coastal users (Thompson, 2007). However, what was interesting about user interaction with viewshed elements was its potential sensitivity to familiarity effects, meaning that people who were familiar with the real-world coastal place appeared more likely to comment on the viewshed (and commented positively). Such a finding aligns with previous research that has found ocean views to be linked with place attachment (e.g., Devine-Wright and Howes, 2010) and that such attachment can form with time spent in coastal places (e.g., Kelly and Hosking, 2008). What this would suggest is that architects of coastal geovisualizations should pay particular attention to the development of viewshed components when building the tools for collaborative planning with stakeholders of high place-familiarity, particularly when proposed plans could threaten ocean views such as with offshore wind turbine developments (e.g., Phadke, 2010).
In contrast to the viewshed elements, beach textures received highly critical responses. In turn, these responses led to important findings on the effects image resolution held on the geovisualization's ability to connect with sense of place. Lewis et al. (2012) noted that much of visualization research has been driven by a “technical thrust” that focuses on qualities such as graphical capabilities and rendering speed; whereas, the “human aspects” (i.e., user-side) of the research have not been given as much attention. However, the findings from this study suggest that technological and human aspects of geovisualizations are intimately linked, particularly with respect to quality of image. When constructing the geovisualization, beach textures were considered by the researchers as important components of modeling place and much time was spent mapping and developing the texture surfaces. However, these efforts were negated when running the geovisualization on lower performance computers (i.e., the laptops), as place-related elements such as shells and woody debris could not be seen with poorer resolutions. Such an observation indicates that place-based tools require a certain level of computer performance to adequately convey the complexity, texture, and vibrancy of real-world environments.
Modeling Marine Places
A unique feature of the geovisualization in this study is that it allowed people to travel into the marine environment. Participants regarded this positively due to how it illustrated the interconnectivity of marine and terrestrial environments, which was an encouraging observation because effective coastal management requires cognizance that coasts comprise a land-to-sea continuum (Cicin-Sain, 1993; Sorensen, 1997; Garriga and Losada, 2010) and part of the intention of making the geovisualization navigable was to convey the interconnectivity (see Section Introduction). However, the marine component received some critical response, particularly in how it seemed lacking in marine species and (thus) did not capture the vitality of marine ecosystems. From the first author's experiences with the snorkeling fieldwork, the geovisualization actually did align with his memories of the underwater environment; that is, the visibility was poor and he mostly could see eelgrass, sea lettuce, and (occasionally) Dungeness crabs. However, despite this representativeness, the modeled marine environment did not meeting user expectations. A possible explanation for this incongruity can be drawn from Merchant (2012) phenomenological research on experiences of novice SCUBA divers. She observed that some divers' remembered coral reefs as “disappointing” due to their lack of vibrancy; however, when shown underwater images with filters that enhanced vibrancy, these images aligned more with their perception and expectation of the marine world than did their memories. As a terrestrial species, humans do not spend much time in the marine environment; therefore, it is possible many people form mental images of marine places based more on pictures, videos, and/or knowledge around marine ecosystems, rather than through first-hand experiences. If this is the case, it raises questions on how marine environments should be modeled in place-based geovisualizations. In particular, should this be according to field observations or collective understandings/impressions, and if it is a combination of both, how does the architect of a geovisualization optimally “balance” these modeling approaches?
Multisensory Tools
Unlike many other visualization tools, the geovisualization in this study incorporates sound and thus operates on senses beyond just sight. This feature was very well received, and it appeared to enhance the tool's ability to connect with sense of place. Sterne (2003, p. 15) noted that “hearing immerses its subject; [whereas,] vision offers a perspective,” which suggests that soundscapes can complement visuals within a geovisualization by offering a degree of immersion that allows for stronger place-based sensations. This notion is supported by other research that has found that people feel more “present” in virtual environments with soundscapes (Larsson et al., 2007). In light of such research and the findings of this study, future work on realistic geovisualizations should progress from studies on purely visual tools. Some efforts have been made in this area, such as Bishop and Stock (2010) incorporation of sound into their wind turbine visualization. However, much more research around developing and examining applications of multisensory tools is needed, and such research can even explore beyond what is studied here (i.e., sight and sound) to include other senses such as touch and smell (Lindquist and Lange, 2014).
Conclusion
Modeling place requires incorporating a large amount of detail and capturing a wide diversity of elements. Such efforts are time-intensive; however, future research similar to that done in this study can continually illuminate techniques for place-based modeling and streamlining the process. In addition, a geovisualization does not need to be built as a “final product,” meaning that it can involve an iterative and ongoing effort with improvements to the base model as more stakeholders interact with it. This approach does necessitate considerations around geovisualization ethics, particularly ensuring there is transparency in terms of what has been excluded due to time and/or data constraints (Sheppard, 2001). However, as Lewis et al. (2012) noted, this should not prevent continual development of such tools; instead, users should be made fully aware of the tools' shortcomings. In fact, the process of engaging in dialog around these shortcomings and ways of improving a geovisualization's representation of a real-world place can be valuable on itself, as it can lead to discussion and insights on what different stakeholders consider to be important aspects of certain places and environments.
Ethics Statement
Ethical review was approved by the Human Research Ethics Board (HREB) at the University of Victoria (Protocol Number: 14-200). Participants reviewed and signed a “Letter of Information for Participant Consent” prior to engaging in focus groups, and comments/feedback from participants was only used if letter was signed and collected.
Author Contributions
RN conducted the fieldwork, built the geovisualization, led the focus groups, analyzed the data, and wrote the first draft of the paper. RC is RN's PhD supervisor. RC devised the original concept for the project, provided guidance around the project plan, development and activities, and contributed to final paper. TS is on RN's doctoral committee, and also is a Parks Canada partner for the project. TS aided in acquiring data for building the geovisualization (i.e., data that was described as “obtained from Parks Canada”), provided guidance on conducting the research, helped organized the Parks Canada focus group and collected notes on feedback, and contributed to the final paper.
Funding
We gratefully acknowledge the funding from the Social Sciences and Humanities Research Council (SSHRC), who provided funding for the greater research project entitled “Seascape Visualisation for Marine Conservation Planning and Outreach” (grant number: 435-2013-01948). In addition, we acknowledge SSHRC for the support provided to the first author through the Joseph-Armand Bombardier Canada Graduate Scholarships Program (Doctoral Scholarships).
Conflict of Interest Statement
The authors declare that the research was conducted in the absence of any commercial or financial relationships that could be construed as a potential conflict of interest.
Acknowledgments
We would like to acknowledge the 4th International Marine Conservation Congress, where this research was first presented as a poster. We also acknowledge the support and participation Parks Canada staff, as well as the other residents of the CRD that participated in the focus groups. In addition, we thank Geneva Chow for her help with the shoreline data collection, and we also thank Caty Brandon for building and providing the Dungeness crab model. Finally, we thank Angela Krewda for her assistance with room setup and logistics associated with the focus group sessions.
Supplementary Material
The Supplementary Material for this article can be found online at: https://www.frontiersin.org/article/10.3389/fmars.2017.00087/full#supplementary-material
Footnotes
1. ^Snowball sampling consisted of recommendations from recipients of invitation letters, both from people who accepted the invitation and those who were unable to attend focus groups. In addition, some recruitment was done through professional networks. In particular, a connection with the District of Saanich's free local parks walking program allowed for recruitment of participants of the walking program.
2. ^Due to the number of participants, it cannot be claimed that the sample size is representative of the entire population of the CRD; however, the number of participants is sufficient for conducting qualitative analysis on feedback collected from participants of a variety of different interests and views. The work follows other visualization research that has involved small numbers of participants and qualitative work (Lewis and Sheppard, 2006; Salter et al., 2009).
3. ^The session with the singular participant was the only session held in August, and it consisted of a person who was scheduled for an earlier session but cancelled due to unexpected circumstances.
4. ^As noted in Introduction, the current study is part of greater research project that investigates how geovisualizations can serve as tools for collaborative coastal planning. To this end, local resident participants were provided with laptops and given the opportunity to use the tool to explore different management scenarios. The Parks Canada meeting differed in that it involved discussing management issues and developing scenario ideas; thus, user control was not necessary for this group. This aspect of the research will be discussed in further detail in forthcoming publications.
5. ^Parks Canada has provided 16 mooring buoys; however, more than 16 boats are often found in the mooring area. Thus, some boaters are (likely) using their anchors within the area.
6. ^The position of the dog was based on a field observation of an off-leash dog disturbing gulls.
7. ^Three negative comments were made regarding people elements in total; however, the comments differed in nature. Two regarded the lack of “busyness”, whereas the remaining comment indicated that the presence of people models did not contribute to the representation.
8. ^Some conversation sounds used “mumbling” sound effects with no coherent content.
References
Agnew, J. A. (1987). Place and Politics: The Geographical Mediation of State and Society. Boston, MA: Allen & Unwin.
Appleton, K., Lovett, A., Sünnenberg, G., and Dockerty, T. (2002). Rural landscape visualisation from GIS databases: a comparison of approaches, options and problems. Computers, Environment and Urban Systems, 26, 141–162. doi: 10.1016/S0198-9715(01)00041-2
Baños, R. M., Botella, C., Guerrero, B., Liaño, V., Raya, M. A., and Rey, B. (2005). The third pole of the sense of presence: comparing virtual and imagery spaces. Psychnol. J. 3, 90–100.
Bartier, P., and Sloan, N. (2007). Reconciling maps with charts towards harmonizing coastal zone base mapping: a case study from British Columbia. J. Coast. Res. 23, 75–86. doi: 10.2112/05-0526.1
Bishop, I. D., and Rohrmann, B. (2003). Subjective responses to simulated and real environments: a comparison. Lands. Urban Plann. 65, 261–277. doi: 10.1016/S0169-2046(03)00070-7
Bishop, I. D., and Stock, C. (2010). Using collaborative virtual environments to plan wind energy installations. Renewable Energy 35, 2348–2355. doi: 10.1016/j.renene.2010.04.003
Bott, S., Cantrill, J. G., and Myers, O. E. (2003). Place and the promise of conservation psychology. Res. Hum. Ecol. 10, 100–112.
Bourke, P., and Green, J. (2016). Keeping it real: creating and acquiring assets for serious games. Comp. Games J 5, 7–22. doi: 10.1007/s40869-016-0018-z
Bowen, R. E., and Riley, C. (2003). Socio-economic indicators and integrated coastal management. Ocean Coast. Manag. 46, 299–312. doi: 10.1016/S0964-5691(03)00008-5
Campelo, A., Aitken, R., Thyne, M., and Gnoth, J. (2014). Sense of place: the importance for destination branding. J. Travel Res. 53, 154–166. doi: 10.1177/0047287513496474
Canessa, R., Newell, R., and Brandon, C. (2015). “Uncovering the Oceans through MarineScape geovisualizations,” in Ocean Solutions, Earth Solutions, ed D. Wright (Redlands, CA: Esri), 243–246.
Cicin-Sain, B. (1993). Sustainable development and integrated coastal management. Ocean Coast. Manag. 21, 11–43. doi: 10.1016/0964-5691(93)90019-U
Cicin-Sain, B., and Belfiore, S. (2005). Linking marine protected areas to integrated coastal and ocean management: a review of theory and practice. Ocean Coast. Manag. 48, 847–868. doi: 10.1016/j.ocecoaman.2006.01.001
Devine-Wright, P., and Howes, Y. (2010). Disruption to place attachment and the protection of restorative environments: a wind energy case study. J. Environ. Psychol. 30, 271–280. doi: 10.1016/j.jenvp.2010.01.008
Dumbauld, B. R., Armstrong, D. A., and McDonald, T. L. (1993). Use of oyster shell to enhance intertidal habitat and mitigate loss of Dungeness crab (Cancer magister) caused by dredging. Can. J. Fish. Aquat. Sci. 50, 381–390. doi: 10.1139/f93-043
Fisheries and Oceans Canada (2014). Shellfish - Species and Limits Table. Available online at: http://www.pac.dfo-mpo.gc.ca/fm-gp/rec/species-especes/shelltable-tableaucoquille-eng.htm
Garriga, M., and Losada, I. J. (2010). Education and training for integrated coastal zone management in Europe. Ocean Coast. Manag. 53, 89–98. doi: 10.1016/j.ocecoaman.2010.01.004
Gunderson, K., and Watson, A. (2007). Understanding place meanings on the Bitterroot National Forest, Montana. Soc. Natl. Res. 20, 705–721. doi: 10.1080/08941920701420154
Hofmeester, C., Bishop, B., Stocker, L., and Syme, G. (2012). Social cultural influences on current and future coastal governance. Futures 44, 719–729. doi: 10.1016/j.futures.2012.04.002
Hong-ge, Y. (2010). “The realization of flight simulation system based on openGL” in 2010 Second International Conference on Information Technology and Computer Science (ITCS) (Washington, DC: IEEE), 198–201.
Hu, J., Wan, W., Wang, R., and Yu, X. (2012). “Virtual reality platform for smart city based on sensor network and OSG engine,” in 2012 International Conference on Audio, Language and Image Processing (ICALIP) (Shanghai: IEEE), 1167–1171.
Jentoft, S., and Chuenpagdee, R. (2009). Fisheries and coastal governance as a wicked problem. Marine Policy 33, 553–560. doi: 10.1016/j.marpol.2008.12.002
Kelly, G., and Hosking, K. (2008). Nonpermanent residents, place attachment, and “sea change” communities. Environ. Behav. 40, 575–594. doi: 10.1177/0013916507302246
Lai, P.-H., and Kreuter, U. P. (2012). Examining the direct and indirect effects of environmental change and place attachment on land management decisions in the Hill Country of Texas, USA. Lands. Urban Plann. 104, 320–328. doi: 10.1016/j.landurbplan.2011.11.007
Larsson, P., Västfjäll, D., Olsson, P., and Kleiner, M. (2007). “When what you hear is what you see: presence and auditory-visual integration in virtual environments,” in Proceedings of the 10th Annual International Workshop on Presence (Barcelona), 11–18.
Lewis, J. L., Casello, J. M., and Groulx, M. (2012). Effective environmental visualization for urban planning and design: interdisciplinary reflections on a rapidly evolving technology. J. Urban Technol. 19, 85–106. doi: 10.1080/10630732.2012.673057
Lewis, J., and Sheppard, S. R. J. (2006). Culture and communication: can landscape visualization improve forest management consultation with indigenous communities? Lands. Urban Plann. 77, 291–313. doi: 10.1016/j.landurbplan.2005.04.004
Lindquist, M., and Lange, E. (2014). “Sensory aspects of simulation and representation in landscape and environmental planning: a soundscape perspective,” in Innovative Technologies in Urban Mapping, Vol. 10, eds A. Contin, P. Paolini, and R. Salerno (Cham: Springer International Publishing), 93–106.
Maurer, A. L. (1989). Sidney Spit Provincial Marine Park – Wildlife Viewing Development Plan. Victoria, BC: Parks Library, Government of British Columbia.
McDonald, P. S., Jensen, G. C., and Armstrong, D. A. (2001). The competitive and predatory impacts of the nonindigenous crab Carcinus maenas (L.) on early benthic phase Dungeness crab Cancer magister Dana. J. Exp. Marine Biol. Ecol. 258, 39–54. doi: 10.1016/S0022-0981(00)00344-0
Merchant, S. (2012). Negotiating underwater space: the sensorium, the body and the practice of scuba-diving. Tour. Stud. 11, 215–234. doi: 10.1177/1468797611432040
Myers, E. P. (2005). “Review of progress on VDatum, a vertical datum transformation tool,” in Marine Technology Society/IEEE OCEANS Conference (Washington, DC).
Newell, R., and Canessa, R. (2015). Seeing, believing, and feeling: the relationship between sense of place and geovisualization research. Spaces Flows 6, 15–30. doi: 10.18848/2154-8676/CGP/v06i04/53779
Newell, R., and Canessa, R. (2017). Picturing a place by the sea: Geovisualizations as place-based tools for collaborative coastal management. Ocean Coast. Manag. 141C, 29–42.
O'Neill, J. D., Costa, M., and Sharma, T. (2011). Remote sensing of shallow coastal benthic substrates: in situ spectra and mapping of eelgrass (Zostera marina) in the Gulf Islands National Park Reserve of Canada. Remote Sens. 3, 975–1005. doi: 10.3390/rs3050975
O'Neill, S., McCall, R., Smyth, M., and Benyon, D. (2005). “Probing the sense of place,” in Proceedings of the Seventh International Workshop on Presence (Valencia), 104–111.
Onwuegbuzie, A. J., Dickinson, W. B., Leech, N. L., and Zoran, A. G. (2009). A qualitative framework for collecting and analyzing data in focus group research. Int. J. Qualit. Methods 8, 1–21. doi: 10.1177/160940690900800301
Orland, B., Budthimedhee, K., and Uusitalo, J. (2001). Considering virtual worlds as representations of landscape realities and as tools for landscape planning. Lands. Urban Plann. 54, 139–148 doi: 10.1016/S0169-2046(01)00132-3
Parks Canada (2012). 2012 Visitor's Guide - Gulf Islands National Park Reserve. Available online at: http://publications.gc.ca/collections/collection_2012/pc/R61-24-2012-eng.pdf
Phadke, R. (2010). Steel forests or smoke stacks: the politics of visualisation in the Cape Wind controversy. Environ. Polit. 19, 1–20. doi: 10.1080/09644010903396051
Poe, M. R., Norman, K. C., and Levin, P. S. (2014). Cultural dimensions of socioecological systems: key connections and guiding principles for conservation in coastal environments. Conserv. Lett. 7, 166–175. doi: 10.1111/conl.12068
Salter, J. D., Campbell, C., Journeay, M., and Sheppard, S. R. (2009). The digital workshop: exploring the use of interactive and immersive visualisation tools in participatory planning. J. Environ. Manag. 90, 2090–2101. doi: 10.1016/j.jenvman.2007.08.023
Schroth, O., Hayek, U. W., Lange, E., Sheppard, S. R. J., and Schmid, W. A. (2011). Multiple-case study of landscape visualizations as a tool in transdisciplinary planning workshops. Lands. J. 30, 53–71. doi: 10.3368/lj.30.1.53
Schroth, O., Pond, E., Muir-Owen, S., Campbell, C., and Sheppard, S. R. J. (2009). Tools for the Understanding of Spatio-temporal Climate Scenarios in Local Planning: Kimberley (BC) Case Study Report PBEZP1-122976. Bern: Swiss National Science Foundation. Available online at: http://calp.sites.olt.ubc.ca/files/2010/02/Schroth_2009_Final_SNSF_Report.pdf
Seidel, J., and Kelle, U. (1995). “Different functions of coding in the analysis of textual data,” in Computer-Aided Qualitative Data Analysis: Theory, Methods and Practice, ed U. Kelle (London: Sage), 52–61.
Shackeroff, J. M., Hazen, E. L., and Crowder, L. B. (2009). “The oceans as peopled seascapes,” in Ecosystem-Based Management for the Oceans (Washington, DC: Island Press), 33–54.
Shaw, A., Sheppard, S. R. J., Burch, S., Flanders, D., Wiek, A., Carmichael, J., et al. (2009). Making local futures tangible - synthesizing, downscaling, and visualizing climate change scenarios for participatory capacity building. Global Environ. Change 19, 447–463. doi: 10.1016/j.gloenvcha.2009.04.002
Sheppard, S. R. J. (2001). Guidance for crystal ball gazers: developing a code of ethics for landscape visualization. Lands. Urban Plann. 54, 183–199. doi: 10.1016/S0169-2046(01)00135-9
Sheppard, S. R. J., Shaw, A., Flanders, D., Burch, S., Wiek, A., Carmichael, J., et al. (2011). Future visioning of local climate change: a framework for community engagement and planning with scenarios and visualisation. Futures 43, 400–412. doi: 10.1016/j.futures.2011.01.009
Simmonds, M. P., Dolman, S. J., Jasny, M., Parsons, E. C. M., and Weilgart, L. (2014). Marine Noise Pollution–Increasing recognition but need for more practical action. J. Ocean Technol. 9, 71–90.
Smith, E. L., Bishop, I. D., Williams, K. J. H., and Ford, R. M. (2012). Scenario chooser: an interactive approach to eliciting public landscape preferences. Lands. Urban Plann. 106, 230–243. doi: 10.1016/j.landurbplan.2012.03.013
Sorensen, J. (1997). National and international efforts at integrated coastal management: definitions, achievements, and lessons. Coast. Manag. 25, 3–41. doi: 10.1080/08920759709362308
Stedman, R. C. (2003). Is it really just a social construction? The contribution of the physical environment to sense of place. Soc. Natl. Res. 16, 671–685. doi: 10.1080/08941920309189
Sterne, J. (2003). The Audible Past: Cultural Origins Of Sound Reproduction. Durham, NC: Duke University Press.
Stocker, L., and Kennedy, D. (2009). Cultural models of the coast in Australia: toward sustainability. Coast. Manag. 37, 387–404. doi: 10.1080/08920750902855998
Thompson, R. (2007). Cultural models and shoreline social conflict. Coast. Manag. 35, 211–237. doi: 10.1080/08920750601042294
Tress, B., and Tress, G. (2003). Scenario visualisation for participatory landscape planning—a study from Denmark. Lands. Urban Plann. 64, 161–178. doi: 10.1016/S0169-2046(02)00219-0
Tuan, Y. F. (1975). Place: an experiential perspective. Geogr. Rev. 65, 151–165. doi: 10.2307/213970
Turner, P., Turner, S., and Burrows, L. (2013). Creating a sense of place with a deliberately constrained virtual environment. Int. J. Cogn. Perform. Supp. 1, 54–68. doi: 10.1504/IJCPS.2013.053554
Vorkinn, M., and Riese, H. (2001). Environmental concern in a local context: the significance of place attachment. Environ. Behav. 33, 249–263. doi: 10.1177/00139160121972972
Williams, D., and Stewart, S. (1998). Sense of place: an elusive concept that is finding a home in ecosystem management. J. Forest. 96, 18–23.
Williams,. R., Ashe, E., Blight, L., Jasny, M., and Nowlan, L. (2014). Marine mammals and ocean noise: future directions and information needs with respect to science, policy and law in Canada. Marine Pollut. Bull. 86, 29–38. doi: 10.1016/j.marpolbul.2014.05.056
Williams, R., Wright, A. J., Ashe, E., Blight, L. K., Bruintjes, R., Canessa, R., et al. (2015). Impacts of anthropogenic noise on marine life: publication patterns, new discoveries, and future directions in research and management. Ocean Coast. Manag. 115, 17–24. doi: 10.1016/j.ocecoaman.2015.05.021
Wood, N., and Lavery, P. (2000). Monitoring seagrass ecosystem health - The role of perception in defining health and indicators. Ecosys. Health 6, 134–148. doi: 10.1046/j.1526-0992.2000.00015.x
Keywords: geovisualization, sense of place, coastal management, realistic model, stakeholder collaboration, interactive tools, virtual environments
Citation: Newell R, Canessa R and Sharma T (2017) Modeling Both the Space and Place of Coastal Environments: Exploring an Approach for Developing Realistic Geovisualizations of Coastal Places. Front. Mar. Sci. 4:87. doi: 10.3389/fmars.2017.00087
Received: 28 November 2016; Accepted: 13 March 2017;
Published: 30 March 2017.
Edited by:
Leslie Cornick, Alaska Pacific University, USAReviewed by:
Edward Jeremy Hind-Ozan, Manchester Metropolitan University, UKAndrew M. Fischer, University of Tasmania, Australia
Copyright © 2017 Newell, Canessa and Sharma. This is an open-access article distributed under the terms of the Creative Commons Attribution License (CC BY). The use, distribution or reproduction in other forums is permitted, provided the original author(s) or licensor are credited and that the original publication in this journal is cited, in accordance with accepted academic practice. No use, distribution or reproduction is permitted which does not comply with these terms.
*Correspondence: Robert Newell, rgnewell@uvic.ca