Bio-Optical Properties of Two Neigboring Coastal Regions of Tropical Northern Australia: The Van Diemen Gulf and Darwin Harbour
 David Blondeau-Patissier1,2,3*
  Thomas Schroeder3
  Lesley A. Clementson4
  Vittorio E. Brando5
  Diane Purcell1,6 Phillip Ford7 David K. Williams6
  David Doxaran8 Janet Anstee7 Nandika Thapar9 Miguel Tovar-Valencia2
- 1North Australia Marine Research Alliance (NAMRA), Darwin, NT, Australia
- 2Research Institute for the Environment and Livelihoods (RIEL), Charles Darwin University, Darwin, NT, Australia
- 3Oceans & Atmosphere, Commonwealth Scientific and Industrial Research Organization (CSIRO), Brisbane, QLD, Australia
- 4Oceans & Atmosphere, Commonwealth Scientific and Industrial Research Organization (CSIRO), Hobart, TAS, Australia
- 5Institute of Atmospheric Sciences and Climate, National Research Council (CNR), Rome, Italy
- 6Australian Institute of Marine Science (AIMS), Darwin, NT, Australia
- 7Oceans & Atmosphere, Commonwealth Scientific and Industrial Research Organization (CSIRO), Canberra, ACT, Australia
- 8Laboratoire d'Océanographie de Villefranche-sur-Mer (LOV), Centre national de la recherche scientifique (CNRS), Villefranche-sur-mer, France
- 9Agriculture, Commonwealth Scientific and Industrial Research Organization (CSIRO), Canberra, ACT, Australia
This study focuses on the seasonal and spatial characterization of inherent optical properties and biogeochemical concentrations in the Van Diemen Gulf and Darwin Harbour, two neighboring tropical coastal environments of Northern Australia that exhibit shallow depths (~20 m), large (>3 m) semi-diurnal tides, and a monsoonal climate. To gain insight in the functioning of these optically complex coastal ecosystems, a total of 23 physical, biogeochemical, and optical parameters were sampled at 63 stations during three field campaigns covering the 2012 wet and dry seasons, and the 2013 dry season. The total light absorption budget in the Van Diemen Gulf was dominated by non-algal particles (aNAP; >45%) during the dry season (May–October) and colored dissolved organic matter (aCDOM; 60%) during the wet season (November–April). The combined absorption by aNAP and aCDOM generally exceeded ~80% of the total absorption budget from 400 to 620 nm, with phytoplankton, aPhy, accounting for <20%. In Darwin Harbour, where only the dry season conditions were sampled, the total absorption budget was dominated by an equivalent contribution of aCDOM, aNAP, and phytoplankton. The major processes explaining the seasonal variability observed in the Van Diemen Gulf are resuspension from seasonal south-easterly trade winds in combination with the tidal energy and shallow bathymetry during the dry season months, and mostly terrestrial river runoff during the monsoon which discharge terrestrial CDOM from the surrounding wetlands. Due to light-limited conditions all year round, the particulate scattering coefficient [bp(555)] contributed significantly (90%) to the beam attenuation coefficient c(555), thus strongly limiting phytoplankton growth (Chlorophyll a ~1 mg.m−3). Spatially, the Van Diemen Gulf had higher total suspended solids and nutrient concentrations than Darwin Harbour, with dissolved organic carbon and aCDOM subjected to photobleaching during the dry season. Key bio-optical relationships derived from this comprehensive set of parameters, the first ever to be collected in this tropical coastal environment, were successfully used for a region-specific seasonal parameterization a region-specific seasonally parameterized ocean color algorithm. Challenges related to the parameterization, and the use, of ocean color remote sensing algorithms for these optically complex waters are discussed.
Introduction
Tropical coastal systems represent <1% of the world's ocean volume, yet they host some of the most productive and diverse ecosystems on earth (Jennerjahn, 2012; Bowen et al., 2013). Although, recent studies suggest that tropical marine regions will experience less drastic environmental changes than temperate regions in the future (Acevedo-Trejos et al., 2014), they remain largely understudied. This is particularly true in the southern hemisphere where very few datasets that capture the seasonal variations in bio-optical properties exist. The literature available on the tropical coastal waters of Far North Australia, referred to as the North Marine Region (NMR, Figure 1), is limited to marine phytoplankton productivity of this region (Hallegraeff and Jeffrey, 1984; Ilahude and Mardanis, 1990), its geology (Woodroffe et al., 1993) and the physical processes that influence its oceanography (Condie, 2011; Li et al., 2014). Across the NMR there is a need to develop better coastal ecosystem-based management strategies, which require quantitative assessment of the processes controlling the coastal marine environment. Combined bio-optical and biogeochemical measurements are key to quantify the ecosystem response to physical and chemical drivers. However, the remote location of the NMR makes the acquisition of in situ data by conventional sampling methods difficult (Figure 1), thus the use of ocean color and sea surface temperature (SST) satellite datasets for the study of the spatio-temporal patterns of biogeochemical processes in such remote areas is ideal. Recent studies using satellite-derived sub-surface light attenuation [Kd(λ)], Chlorophyll-a (Chl-a) and total suspended solids (TSS) concentrations have shown the distinct seasonal cycles of those parameters in the NMR (Schroeder et al., 2009; Blondeau-Patissier et al., 2011, 2014). Standard ocean color algorithms were used however, thus likely limiting the accuracy of the quantitative retrievals of the above-mentioned products due to the optical complexity of the North Australian shelf waters (IOCCG, 2000). Recommendations for future applications include the implementation of ocean color algorithms regionally tuned to the NMR using in situ optical measurements collected in this region for their parameterization. The success of such approach has been previously shown in other coastal regions (e.g., Brando et al., 2012; Tilstone et al., 2012; Roy et al., 2013). The optical properties and concentrations presented in this study are the first to have been collected in the region, and may be used as a baseline in any future bio-optical assessments guiding environmental management.
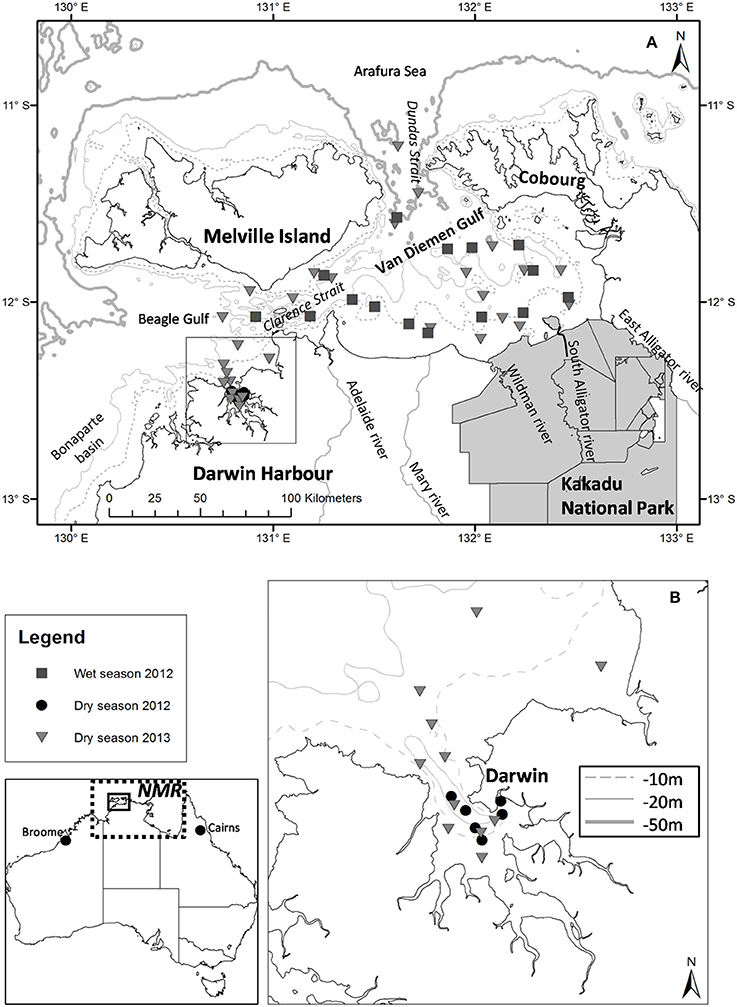
Figure 1. (A) Locations of the dry and wet season sampling stations for the 2012 and 2013 field campaigns; (B) Darwin Harbour (inset). The extent of the Northern Marine Region (NMR; dotted line) is shown. Bathymetry contours are indicated in light gray [isobaths −10 and −50 m for (A), and isobaths −10, −20, −50 m for (B)].
Located within the NMR and bounded to the east by the Gulf of Carpentaria, the Van Diemen Gulf (VDG) is a semi-enclosed bay (~16,000 km2) with two narrow openings (~25–30 km wide), one to the North into the Arafura Sea and a second to the West into the Beagle Gulf (Figure 1A). The VDG, our first study region, is a dynamic marine environment that is characterized by shallow depths (<20 m) and strong tidal forcing. Six major river catchments surround the VDG: to the east are the Wildman River and the West, South (10,000 km2), and East Alligator Rivers; to the west are the Mary (8,000 km2) and Adelaide Rivers (638 km2; Figure 1A). While the western catchments have been actively used for agricultural purposes, mainly cattle grazing, the eastern catchments are primarily for conservation (indigenous lands and national parks; CSIRO, 2009). Our second study region, Darwin Harbour (DH) (Figure 1B), is a semi-enclosed, shallow macro-tidal estuarine system (~3,000 km2) connected to the VDG via the Clarence Strait (e.g., Williams et al., 2006; Andutta et al., 2014). Home to more than half of the Northern Territory's population (~200,000), Darwin Harbour is an isolated coastal region with the closest other cities being located >1,000 km to the east (Cairns) or west (Broome) (Figure 1). While there are no major ocean currents in the NMR, tidal currents play a significant role in water movement in this region (Condie, 2011). The monsoonal climate of the NMR region is characterized by a wet season that extends from November to April, during which more than three-quarters of the yearly rainfall occurs* (e.g., Story et al., 1969). Monsoonal rainfall (~1,700 mm·yr−1)1 generates large quantities of freshwater that enter the coastal waters of the VDG via the surrounding catchments (Figure 1). Monsoonal winds are mostly northerly or north-westerly, with episodic cyclones (e.g., Acker et al., 2009; Lyon, 2010), while south-easterly trade winds predominate during the dry season (May–October). The rainfall, wind speed and direction vary dramatically between the wet and dry seasons, thus seasonal differences in water column mixing, turbidity, salinity, wave patterns, and wind-driven surface currents are to be expected. Overall a limited amount of light penetrates the water column of our study regions all year around, thus phytoplankton biomass and productivity are affected. In the neighboring Gulf of Carpentaria, Burford et al. (2012c) found that sediment resuspension from the tidal energy was the most important physical process limiting light penetration, and consequently phytoplankton primary production.
Surface inherent optical properties (IOPs) and biogeochemical concentrations, as well as nutrients for some stations, were sampled in the VDG and DH shelf waters during one wet season (March 2012) and two dry seasons (September 2012, 2013; Tables 1A,B). The specific objectives of this study are (1) to characterize the spatial and seasonal bio-optical variability of DH and VDG to understand the functioning of these complex coastal ecosystems by identifying the major controlling processes and (2) to examine the relationships that can be derived between parameters to provide recommendations for their use in biogeochemical modeling and the parameterization of satellite ocean color algorithms specific to this dynamic coastal region of the NMR.
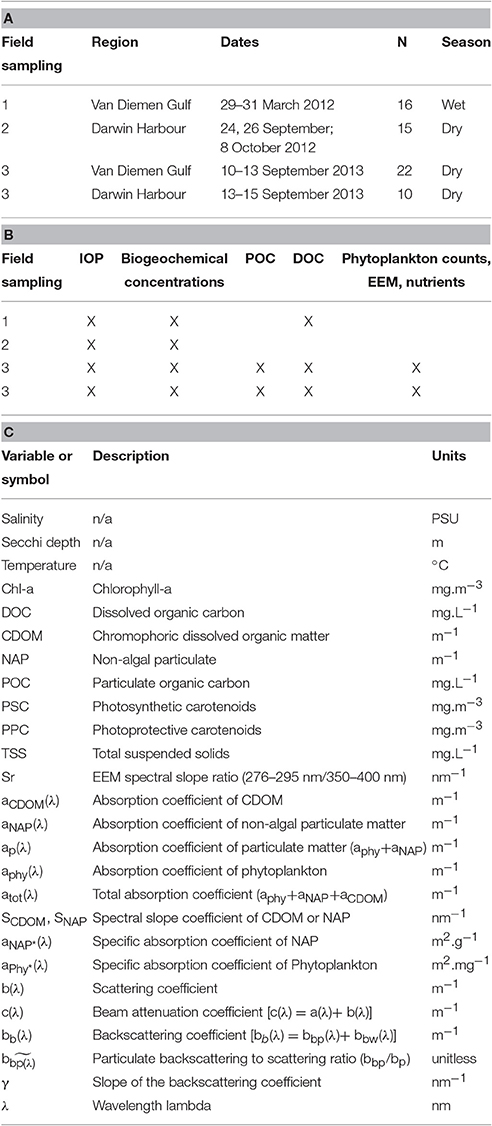
Table 1. (A) Details of the seasonal field sampling and (B) the variables measured, (C) Notations: abbreviations, symbols and units of all the parameters referred to in this study.
Methods
Characteristics of the Sampling Effort
The dataset presented in this study comprises 23 metadata, biogeochemical and optical parameters (Table 1) sampled at 63 stations over three field campaigns in the VDG and DH (Figure 1). Overall, the sampling effort corresponds to 13 days of field sampling—the distance from Darwin to the furthest sampling site in the VDG is 125 nautical miles, equivalent to >12 h of travel time for a vessel equipped for water sampling. Two research campaigns were undertaken in the VDG during (1) the wet season of 2012 (29–31 March 2012; N = 16) and (2) the dry season of 2013 (10–15 September 2013; N = 22; Figure 1A; Table 1A). Additionally, DH was also sampled on two occasions but only during the dry season: first, an intensive field campaign that solely focused on DH was undertaken during 3 days at the end of the 2012 dry season (24, 26 September and 8 October 2012; N = 15) and second, several stations (N = 10) were sampled in DH at the end of the September 2013 dry season field campaign when returning from the VDG (Figure 1; Table 1A). At the time of their sampling, the bottom depths of all stations ranged from 5 to 60 m (median: 21 m; N = 63). Water sampling was carried out 3–6 times a day to cover various tidal conditions.
The tidal regime in DH and VDG is semi-diurnal. While the tides in DH are macro-tidal with a mean spring tidal range of 6 m, the tidal range in DH can reach up to 8 m during spring tides, which is large compared to the mean depth (<20 m; Figure 1B). The tides are meso-tidal in the VDG, with a mean spring tidal range of 3 m and some tidal amplification up to 6 m in the south east of the Gulf, near the mouths of the Alligator Rivers (Figure 1). As a result the tidal phasing between DH and VDG can be between 1.5 and 2 h, with tides in the VDG occurring before those in DH. The tide tables and tide charts that are publicly available are from the Darwin City tide gauge only, and thus are not applicable to the entire study region. As our field sampling occurred across an area that covered both VDG and DH, the tidal properties at each station were computed for the sampling dates, times and locations using a two dimensional, depth-averaged, finite element, hydrodynamic Resources Modeling Associates (RMA) numerical model (Williams, 2009). The tidal range, the vertical difference between succeeding (or preceding) high and low tides depending on the time of sampling, was computed for each station.
The wet season of 2012 was characterized by above-average rainfall (1,661 mm > long term1941−2014 mean: 1,282 mm), with March 2012 (570 mm) receiving 80% more rain than the long-term average monthly rainfall. Similarly, the September 2012 rainfall (21 mm) exceeded the long-term average by 35%, while September 2013 was exceptionally dry (0.2 mm) (source: BOM*).
Optical Measurements
At each station, vertical profiles of temperature, salinity and density (WET Labs Water Quality Monitor, WQM) as well as light absorption, beam attenuation (WET Labs ac-s with a 10-cm path-length), and light backscattering (WET Labs ECO BB-9) coefficients were measured (Tables 1A,B). The BB-9 backscattering meter measures the light backscattered at an angle of 124° with a fixed gain at nine wavelengths, which were set at 412, 440, 488, 510, 532, 595, 650, 676, and 715 nm. The ac-s measures the light absorption [a(λ)] and beam attenuation [c(λ)] at multiple wavelengths (N = 82) from 401.6 to 739.7 nm. All instruments were deployed together in an optics cage to allow for simultaneous collection of the measurements. Corrections for temperature and salinity effects on water optical properties were applied to the ac-s data using the WQM measurements (Pegau et al., 1997). The incomplete recovery of the scattered light in the ac-s absorption tube was rectified using the proportional method described in Zaneveld et al. (1994). The BB-9 backscattering dataset was corrected for light loss due to absorption over the path length at each angle and wavelength using light absorption and scattering values from the ac-s (Boss et al., 2004). All vertical profiles were binned at 0.2 m depth intervals. In addition, the water transparency was visually estimated by the same observer at all stations by lowering a black and white disk (Secchi disk). The Secchi depth reported in this study is the depth at which the disk is no longer visible.
Assuming that dissolved organic matter in water has a negligible effect on scattering, the particulate scattering coefficient bp(λ) was derived by subtracting the scattering by pure water, bw(λ) from the difference between the total light attenuation c(λ) and total light absorption (particulate+dissolved), aTot(λ) [i.e., bp(λ) = (c(λ) − aTot(λ)) − bw(λ)]. For the scattering coefficient, the particulate backscattering coefficient, bbp(λ), was obtained by subtracting the backscattering component of pure water, bbw(λ), from bb (λ). The spectral slope of the backscattering coefficient, γ, was computed as a power-law (Whitmire et al., 2007).
For the determination of the particulate absorption coefficient, the sum of the phytoplankton and the non-algal particle (NAP) components [aP(λ) = aphy(λ)+aNAP(λ)], a volume of 0.4–1 L of surface seawater was filtered through a 25 mm Whatman GF/F glass-fiber filters. Filters were stored flat in liquid nitrogen until analysis. Optical densities were measured over the 250–800 nm spectral range with 0.9 nm increments, using a Cintra 404 UV/VIS dual beam spectrophotometer equipped with an integrating sphere. Pigmented material was extracted from the sample filter using the method of Kishino et al. (1985) to determine the optical density of the non-algal matter, ODNAP(λ). The optical density due to phytoplankton was obtained by difference [ODphy(λ) = ODP(λ)-ODNAP(λ)]. The pathlength amplification effect due to the filter was corrected by using the algorithm of Mitchell (1990). Finally, absorption coefficients of phytoplankton [aphy(λ)], non-algal particles [aNAP(λ)], and its slope SNAP were computed as described in Clementson et al. (2004).
All phytoplankton absorption spectra were plotted and quality controlled to avoid the inclusion of those contaminated by non-algal material.
Biogeochemical Measurements
For all measurements, water samples were collected at the surface (≤ 2 m), using either Niskin bottles (via a Rosette system) or by lowering a clean, polyethylene bucket from the side of the ship.
CDOM, POC, and DOC Concentrations
Water samples were filtered through a Whatman Anodisc membrane (0.22 μm; 47 mm) for CDOM and dissolved organic carbon (DOC) analysis. Filters were pre-rinsed with Milli-Q water prior to filtration. To track possible contamination of the glass filtration unit by the filters, the initial filtrate (100 ml) of Milli-Q water was discarded, and the subsequent filtrate of Milli-Q water was stored as a blank for the first and last samples collected during the campaign. The final filtrate was transferred to a SCHOTT glass bottle pre-rinsed with the same filtered seawater; the same was done for the DOC samples which were then preserved with 0.5 ml of 50% H3PO4. The samples were stored at 4°C. The analysis of DOC and Particulate Organic Carbon (POC), derived from subtracting DOC (water filtered through 0.22 μm) from the unfiltered water samples, is further described in the method section of MacIejewska and Pempkowiak (2014b). DOC and POC were not measured for 15 stations sampled in Darwin Harbour in the 2012 dry season, and POC (N = 29) was only collected during the 2013 dry season field campaign. The CDOM absorbance of each filtrate, after equilibrating to room temperature, was measured from 250 to 800 nm in a 10 cm pathlength quartz cell using a Cintra 404 UV/VIS spectrophotometer, with fresh Milli-Q water (Millipore) as a reference. The CDOM absorption coefficient (m−1) was calculated using the equation a CDOM = 2.3(OD(λ)/l) where l is the cell path length in meters. Finally, an exponential function was fitted to the CDOM spectra over the wavelength range 350–680 nm from which the slope, SCDOM, was derived as described in Clementson et al. (2004).
During the dry season sampling of September 2013, a second set of CDOM samples (N = 26) was analyzed by fluorescence Excitation-Emission Matrix spectroscopy (EEM). EEM is often used to trace photochemical and microbial reactions associated with fluorescent dissolved organic matter (FDOM). In this study, it was used to assess CDOM sources (terrestrial or marine). Water samples were filtered through 0.45-μm syringe filters into SCHOTT bottles pre-washed with HCl. The samples were stored at 4°C while at sea. They were then stored at −20°C once in the laboratory and were allowed to reach room temperature before analysis. Each sample was analyzed using a Horiba Jobin Yvon Aqualog Excitation-Emission spectro-fluorometer (240–600 nm) and a Starna 1-cm quartz cell. The EEM spectra were recorded under standard instrumental conditions and were subsequently corrected for internal absorbance effects. Both the first and second order Raman and Rayleigh lines were removed, and the intensity was expressed in Quinine Sulfate Units (QSUs) using the appropriate instrument normalization for the integration time (Watson and Zielinski, 2013). The spectral slope ratios Sr, were computed separately from the same data by least squares fitting of the log transformed raw absorbance in the ranges 275–296 and 350–400 nm (Helms et al., 2008).
Total Suspended Solids
For the determination of TSS concentrations, water samples (0.50–3.50 L) were filtered through pre-weighed Whatman GF/F glass microfiber filters (0.7 μm; 47 mm) pre-combusted at 450°C. A blank filter with filtered seawater was used as a reference. The filter was then rinsed with ~50 ml of distilled water to remove any salt from the filter and dried to constant weight at 65°C to determine the TSS (see Figure 1 of Neukermans et al., 2012). The filters were then placed in a furnace at 450°C for 3 h, allowed to cool and weighed to determine the amount of inorganic material remaining on the filter. To quantify sample variability between TSS samples, triplicates were taken at each station. Overall, the relative standard deviation between all triplicates was 8% (N = 57), varying the least for the DH dry season samples (2%) and the most for the VDG dry and wet season samples (13%). Laboratory-estimated particulate inorganic (PIM) and organic (POM) matter fractions of TSS were only available for the 2012 wet season samples and were extracted as described in Oubelkheir et al. (2014).
Determination of Phytoplankton Pigment Concentrations and Cell Counts
For phytoplankton pigment concentration and composition, water volumes of 0.10–1.20 L were filtered through Whatman GF/F glass microfiber filters (0.7 μm; 25 mm) and stored in liquid nitrogen until analysis. Phytoplankton pigments, extracted by High-performance Liquid Chromatography (HPLC) following Clementson (2013), were grouped into five categories: (1) Chl-a (Chlorophyll-a, divinyl-Chl-a, chlorophyllide-a and pheopigments); (2) Chl-b (Chl-b and divinyl Chl-b); (3) Chl-c (Chl-c1, -c2); (4) photosynthetic carotenoids (PSC; fucoxanthin, peridinin, 19–HF and 19–BF); and (5) photoprotective carotenoids (carotenoids (PPC, zeaxanthin, diadinoxanthin, alloxanthin, lutein, α- and β-carotene). The relative contribution of picophytoplankton (<2 μm), nanophytoplankton (2–20 μm), and microphytoplankton (>20 μm) was estimated for each sample using diagnostic pigments as described in Uitz et al. (2006), improved from Vidussi et al. (2001).
Surface water samples for microscopic phytoplankton cell counts were collected in 100-ml darkened bottles and preserved with paraformaldehyde for a final concentration of ~1% paraformaldehyde (2013 dry season campaign only). Using the Utermöhl technique, sub-samples were settled in 100-ml settling chambers for 24 h and examined using an inverted microscope (Nikon Eclipse Ti-S) following the methodology outlined by Hasle (1978). Large and numerically rare taxa were counted during full examination of the settling chamber (×100), while small and numerically dominant taxa were counted on 1–2 transects of the chamber (×400), or from cumulative counts of 5–10 fields of view. Diatoms and dinoflagellates were identified to the genera or species level, based on Hallegraeff et al. (2010). For picophytoplankton cell counts, samples were collected in 2.5-ml cryovials, preserved in 1% paraformaldehyde, kept in liquid nitrogen while at sea and stored at −80°C until analysis. An Accuri C6 Flow Cytometer was used, following the procedure described in Zubkov et al. (2007). Cells' viability was assessed through microscope counts, where cells that were broken or lysed were considered to be non-viable cells. When cell numbers were compared (i.e., between the phytoplankton community >2 μm and picoplankton <2 μm), phytoplankton cell counts amounted to <0.001% of the total (picoplankton + phytoplankton).
Specific Inherent Optical Properties
Mass-specific inherent properties (SIOPs), the absorption and backscattering coefficients normalized to their respective concentrations, are necessary for the parameterization of (semi-) analytical bio-optical models for complex coastal waters (e.g., Brando et al., 2012; Tilstone et al., 2012; Le et al., 2015). However, SIOP datasets are seldom available for most of the world's coastal ocean. To further characterize our optical dataset and to help the development of ocean color algorithms for this sub-region of the NMR, we computed the specific absorption coefficients for phytoplankton, aphy*(λ), obtained by normalizing aph(λ) to Chl-a, as well as the mass-specific non-algal particulate absorption, aNAP*(λ), and backscattering, bbp*(λ), coefficients by normalizing aNAP and bbp by their TSS concentrations. Further, we acknowledge that the algal contribution to TSS may not have been negligible, during the wet season in particular.
Nutrient Concentrations
Water samples for nutrients were collected at surface (0.5 m; 2013 dry season campaign only) and filtered through pre-combusted (500°C) 25 mm Whatman GF/F glass fiber filters. The samples were frozen and stored at −20°C prior to analysis. Nutrient species nitrite+nitrate ( + ), ammonium () and phosphate () were analyzed using a segmented flow analysis system following Ryle et al. (1981).
Statistics
The effect of seasons (i.e., dry vs. wet season) or locations (DH vs. VDG) on the measured variables were tested using a one-way analysis of variance (ANOVA). The normality of the distributions was verified using the Shapiro–Wilk test statistics at p > 0.05 and the homogeneity of variance was tested with the Bartlett's test prior to analysis. If none of the transformations used led to normally distributed data, the non-parametric Mann–Whitney–Wilcoxon test was applied.
Results
Metadata: Salinity, Secchi Depths, and Tides
The range of a selected set of metadata, concentrations and IOPs for the dry and wet seasons is shown in Table 2. Most (13) of the variables showed significant seasonal variations due to the monsoon (Tables 2, 3). Surface waters were found to be significantly cooler (median dry/wet: 28.35/29.83°C; p < 0.001; N = 63) and more saline (median dry/wet: 34.64/29.43 PSU; p < 0.005; N = 63) during the dry season (Table 2). Surface salinity varied by 33% during the wet season (N = 16), with stations featuring differences of up to 4 PSU between the surface and the bottom of the cast (Table 2). In comparison, dry season stations showed little variation (median: 0.1 PSU; N = 47).
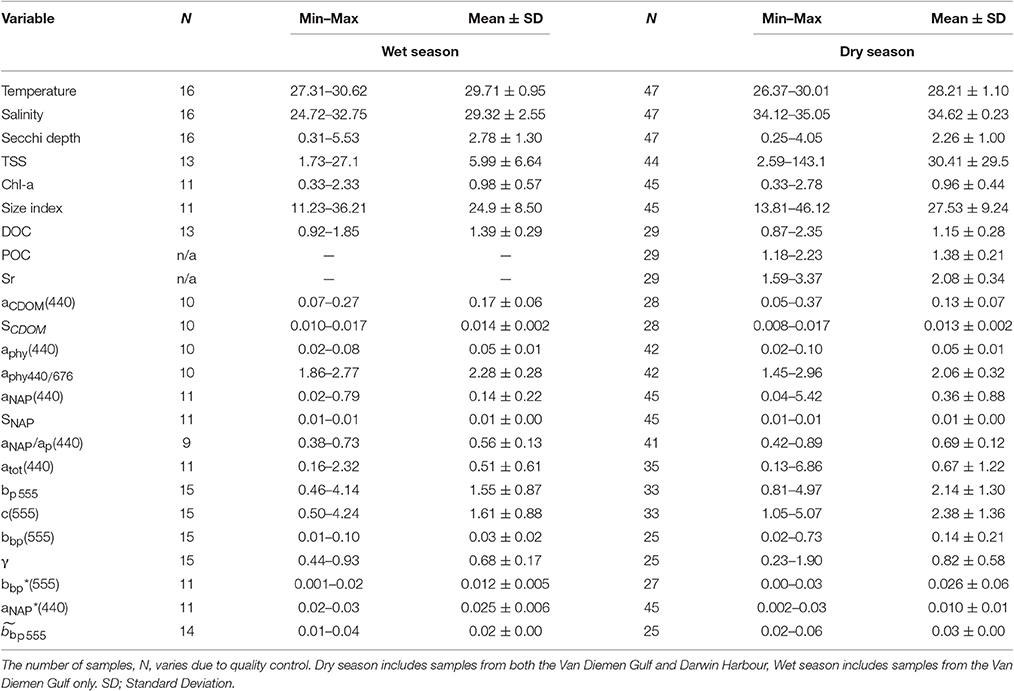
Table 2. Range of surface (<2 m) values in metadata, concentrations and IOPs in the Van Diemen Gulf and Darwin Harbour during the 2012–2013 dry and wet seasons field samplings.
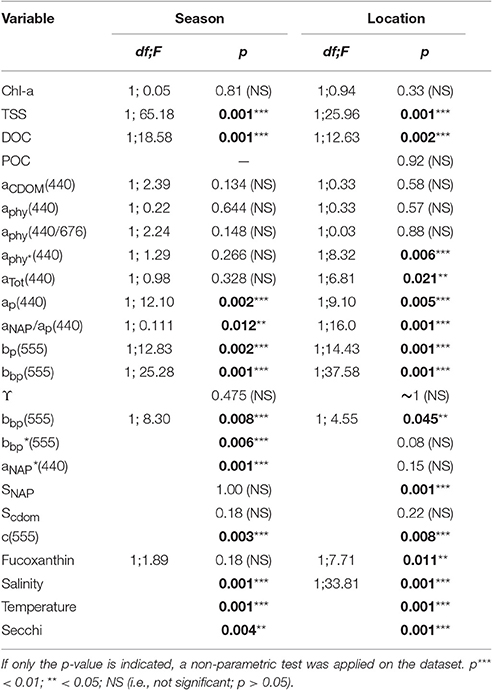
Table 3. One-way ANOVA results for selected concentrations, IOPs and metadata. The factor “Season” refers to dry vs. wet seasons (Van Diemen Gulf stations only), and “Location” refers to Van Diemen Gulf vs. Darwin Harbour (during the dry season only).
Significant differences in seasonal and regional Secchi depths were found (Table 3). Most of the Secchi depths sampled ranged from 1.0 to 3.0 m (67%), with 45% of the stations having a Secchi depth <2 m. The clearest waters were sampled in DH (Secchi depth >3 m), in the straits (>4 m), and in the Beagle Gulf (4 m), while most (N = 17) of the VDG dry stations had Secchi depths <2 m (Figure 1). Amongst the metadata, the Secchi depth was the parameter most correlated, albeit mildly, with the tidal range (R2 = 0.23, N = 56) and temperature (R2 = 0.22, N = 50), but not with salinity (R2 < 0.1, N = 58). Secchi depths were strongly correlated with aNAP (R2 = 0.73, N = 56) and aTot (R2 = 0.73, N = 46), while there was a mild co-variation with TSS (R2 = 0.34, N = 57). Temperature was moderately correlated with TSS (R2 = 0.47, N = 47). Tidal range was moderately correlated with aNAP slopes (R2 = 0.45, N = 50), and weakly with any of the concentrations.
Biogeochemical Concentrations and Inherent Optical Properties
The overall average Chl-a concentrations sampled during these three campaigns was 1.0 mg.m−3 (N = 56). The highest Chl-a concentrations measured were 2.8 mg.m−3 during the dry season and 2.3 mg.m−3 during the wet season, both sampled at the same VDG station located <15 km from the mouth of the Mary River (Figure 1A). Although, no significant difference was found for Chl-a between seasons or locations (Table 3), higher Chl-a concentrations (>1.3 mg.m−3) were found along the VDG coast and within DH (with a gradual decrease from the inner ~1.63 mg.m−3 to the outer ~ <1 mg.m−3 of the Harbour), while lower Chl-a concentrations were found in the middle of the VDG (0.6–1.25 mg.m−3) and at stations sampled in the Beagle Gulf and Dundas Strait (<0.6 mg.m−3; Figures 1, 2A; Table 2). TSS was found to be significantly higher for stations sampled during the dry season and located in the VDG (54.2 ± 40.0 mg.L−1; N = 20) in comparison to stations sampled in DH (15.6 ± 9.7 mg.L−1; N = 24) or during the wet season (6.0 ± 6.6 mg.L−1; N = 13; Tables 2, 3). Higher TSS concentrations were typically found along the coast, while lower TSS concentrations were found in the inner Harbour (Figure 2B). There was no interdependence between TSS and Chl-a (R2 < 0.1; N = 55; Figure 3A; Table 5), while TSS concentrations seem to increase with increasing tidal range, albeit with no significant relationship (R2 < 0.1; p > 0.1, N = 51; Figure 3B). The wet season TSS samples (VDG wet) were found to be mostly (75%) composed of inorganic material (N = 13).
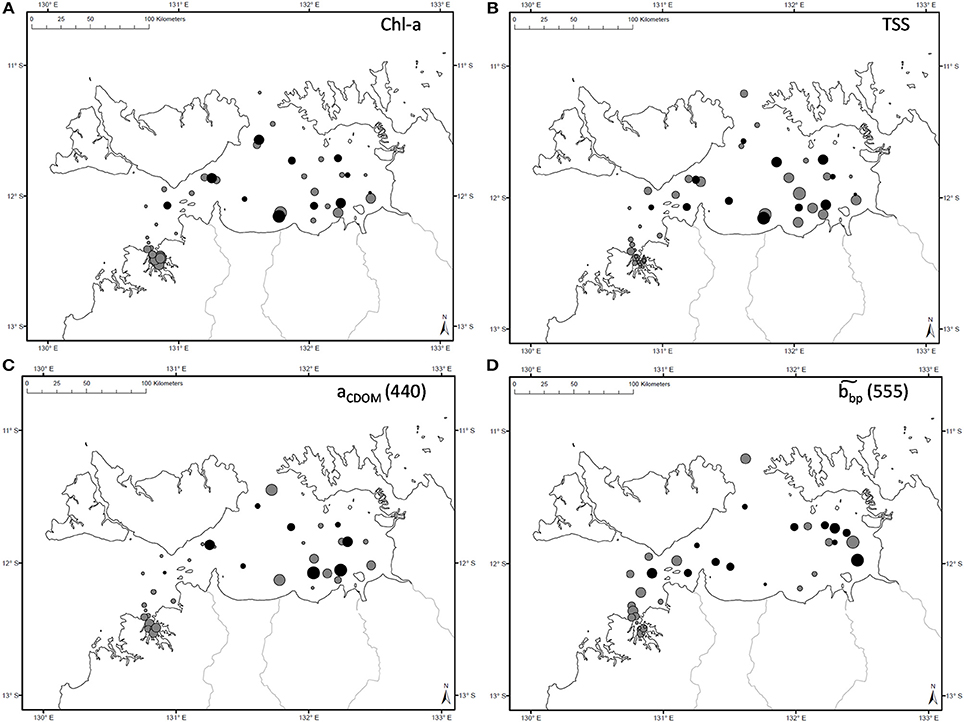
Figure 2. Spatial distribution of measured (A) Chl-a, (B) TSS, (C) aCDOM(440), and (D) during the dry (gray) and wet (black) seasons. Symbol sizes are representative of the concentration range sampled during a specific season.
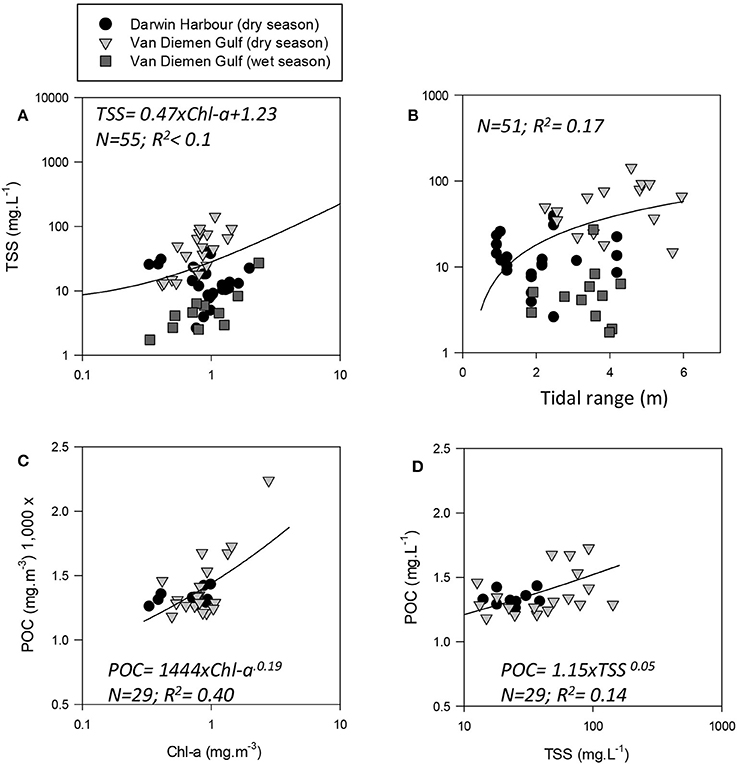
Figure 3. Relationships between: (A) TSS and Chl-a, (B) TSS and tidal range (note: × is linear), and POC as a function of (C) Chl-a and (D) TSS.
Organic carbon is divided into a particulate (POC) and a dissolved (DOC) fraction, both playing major roles in the ocean carbon cycle (Bauer et al., 2013) with the majority (~95%) of the ocean organic carbon being composed of DOC (e.g., Hansell and Carlson, 2001). The concentration in organic carbon varies according to the distance from land, with open ocean waters having less organic carbon than those in coastal regions. For instance, POC was found to be in the order ~0.1 mg.L−1 in Pacific Ocean waters (Claustre et al., 1999; Fabiano et al., 1999), 0.3 mg.L−1 in shallow shelf waters of the Northwest Atlantic (Bauer et al., 2002), 1.4 mg.L−1 in the Baltic Sea coastal waters (MacIejewska and Pempkowiak, 2014b), and up to 1.8 mg.L−1 in Chesapeake Bay (Fisher et al., 1998). For this study, POC (only available for the dry season samples) was found to be as high as 2.23 mg.L−1, with a mean concentration of 1.42 ± 0.26 mg.L−1 (N = 19) in the VDG and 1.33 ± 0.06 mg.L−1 (N = 10) in DH (Table 2). No significant difference in POC between the two locations was found (Table 3). In open ocean waters, Morel (1988) proposed the empirical relationship POC = 90 Chl-a0.57 (R2 = 0.68; N = 409), but in coastal waters, such robust relationships between POC and Chl-a may not be observed because of the higher non-phytoplankton contribution (e.g., Sathyendranath et al., 2009). For our dataset, after converting POC from mg.L−1 to mg.m−3, we obtained POC = 1,444 Chl-a0.19 (R2 = 0.40; N = 29; p < 0.005; Figure 3C; Tables 2, 5). TSS samples were also examined in relation to their POC content to assess their relative fraction of organic material but this was not possible due to a poor covariation of POC with TSS (R2 = 0.14; p < 0.05; N = 29) (Figure 3D).
Understanding the dynamics of DOC in coastal systems is key to accurately assessing the important role coastal regions play in the global carbon cycle (Fichot and Benner, 2014; Fichot et al., 2014). While POC is the sum of the masses of all organic particles, largely composed of phytoplankton and organic detritus (e.g., fecal pellets; Romero-Ibarra and Silverberg, 2011), DOC is directly related to micro-organism activities ranging from photosynthesis to virus lysis (Agustí and Duarte, 2013). The use of CDOM as a direct and reliable proxy for DOC in coastal waters has been demonstrated in previous studies. For instance, Fichot and Benner (2011) used multiple linear regressions to successfully (R2 > 80%) retrieve DOC from aCDOM(275) and SCDOM in the Beaufort Sea and the Northern Gulf of Mexico. More recently, Vantrepotte et al. (2015) retrieved DOC from aCDOM(412) using linear regressions and a dataset of contrasting coastal waters, comprising samples from the English Channel (R2 = 0.72), Vietnam (R2 = 0.81), and French Guiana (R2 = 0.78). For our dataset, there was no correlation between DOC and aCDOM(400) (R2 ~ 0.1; p > 0.1; N = 55; Figure 4C). DOC was found to be significantly different between both seasons and locations (Tables 2, 3). It was higher during the wet season (1.39 ± 0.29 mg.L−1; N = 13; Table 2) and varied spatially from lower concentrations in the embayment of the VDG (~0.8–1.0 mg.L−1) increasing toward Clarence Strait (>1.0 mg.L−1) and reaching up to 2.35 mg.L−1 in DH (Figure 1). Overall DOC (1.34 ± 0.37 mg.L−1; N = 10) in DH was found to be much lower than that observed by Burford et al. (2012a) in Buffalo Creek (2.9 ± 1.8 mg.L−1), 20 Km North of Darwin. This difference can be partly explained by the seasonal effect: samples from DH were from the dry season, while Burford et al.'s Buffalo Creek DOC values were sampled during the wet season (December 2008; Burford et al., 2012a). No correlation was found between DOC and salinity (R2 = 0.10; N = 38) (Figure 4D).
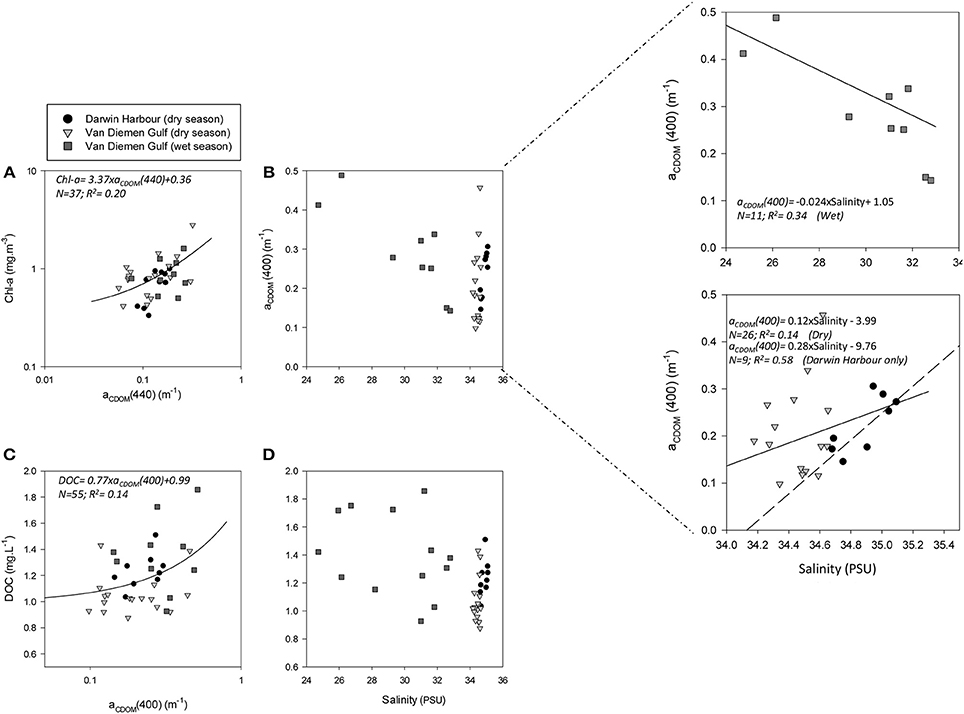
Figure 4. Relationships between: (A) Chl-a and aCDOM(440), (B) aCDOM(440) and salinity, (C) DOC and aCDOM(400), and (D) DOC and salinity. The dashed line indicates the regression line for the Darwin Harbour samples only (N = 9).
The absorption of CDOM at 440 nm was not found to be statistically significantly different between seasons (Table 3). Yet aCDOM(440) was characterized by higher values during the wet season (median dry/wet: 0.11/0.18 m−1; Table 2), and stations located in the VDG had slightly lower aCDOM (440) values (0.11 ± 0.09 m−1; N = 21) than those in DH (0.14 ± 0.03 m−1; N = 10; Figure 2C). Overall, aCDOM(440) was found to weakly increase with Chl-a (R2 = 0.20, N = 37; Figure 4A). Also a proxy for salinity, aCDOM can be used as a marker of freshwater influence during flooding conditions (e.g., Schroeder et al., 2012), but for our dataset, there was a very weak relationship between salinity and aCDOM (Figure 4B): albeit with a poor relationship, CDOM was found to increase with salinity during the dry season (R2 = 0.14; N = 26; Figure 4B), while it decreased with salinity during the wet season (R2 = 0.34; N = 11) possibly due to its terrestrial source (thus in higher concentration near the rivers). Its spectral slope, SCDOM, was not seasonally or spatially uniform (0.008–0.017; N = 38) but statistically, no seasonal or spatial difference was found (Tables 2, 3; Figure 5A). SCDOM was within the set range described by Blough and Del Vecchio (2002). The spectral slope of NAP did not change between seasons but unlike SCDOM, SNAP was found to differ spatially (p < 0.001; N = 45) with the dry season samples located in the VDG (median: 0.014 m−1; N = 20) having steeper slopes than those from DH (0.012 m−1; N = 25) (Figure 5B). From the EEM, we found Sr to be between 1.5 in DH and 3.5 in the VDG (Figure 13A). The slope ratios are in accordance with coastal environments, as sampled in our study, where Sr ranged from wetlands (0.69) to oceanic (9.02) (Helms et al., 2008). In addition, aCDOM(350) was found to exponentially decrease with S275−295 (Figure 13B), as per Figure 6 of Fichot and Benner (2012), thus indicating possible effects of photobleaching for the VDG-dry season samples.
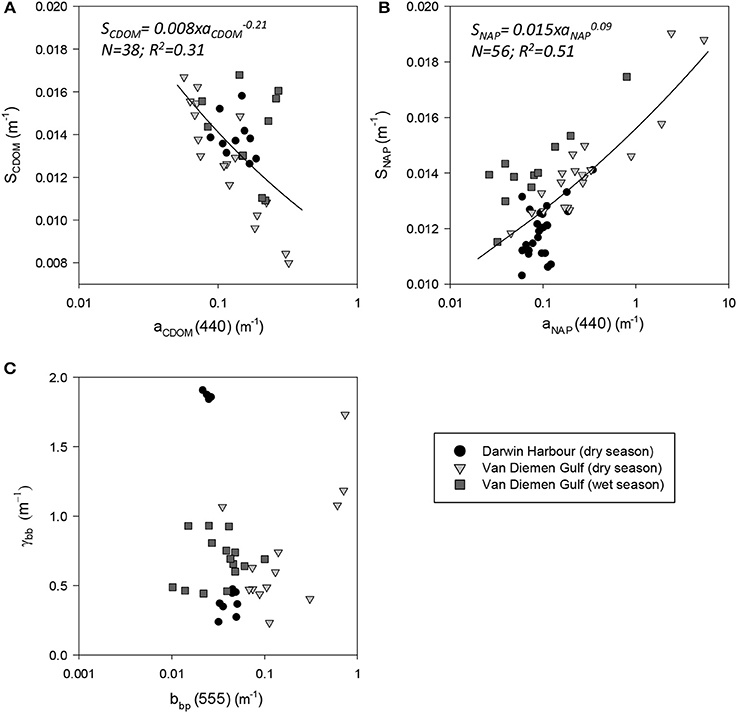
Figure 5. Spectral slopes. Slopes of (A) CDOM, (B) NAP, and (C) bbp as a function of their respective coefficients.
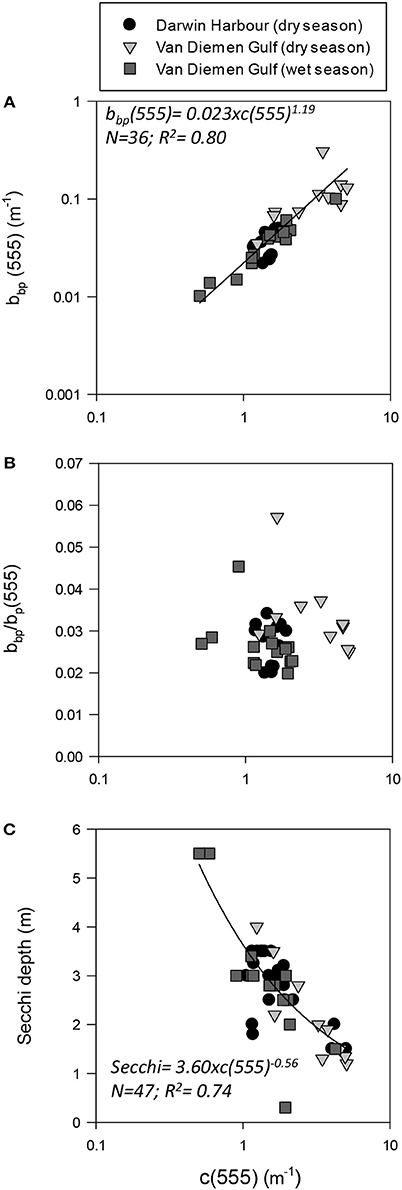
Figure 6. Beam attenuation coefficient (c555) as a function of (A) backscattering (bbp555); (B) the backscattering-to-scattering ratio (bb555); and (C) Secchi depth.
The magnitude of the particulate backscattering coefficient varied broadly [0.01 < bbp(555) < 0.73 m−1; N = 40; Table 2]. Its associated spectral slopes (0.2 < γ < 1.9 m−1) were well within the range reported by previous studies (Snyder et al., 2008; Figure 5C) but bbp(555) slopes did not feature any seasonal or spatial variations (γ~ −0.6 m−1; Table 3). While bbp(555) was evidently strongly correlated with bp(555) (R2 = 0.84; N = 37; p < 0.001; Table 5), there was also a significant correlation between bbp(555) and TSS (R2 = 0.53; p < 0.001; N = 36; Figures 7A,B; Table 5). Overall, the mass-specific non-algal particulate coefficient at 440 nm, aNAP*(440), varied between 0.002 and 0.035 m2.g−1 with a mean value of 0.025 m2.g−1 during the wet season decreasing to 0.010 m2.g−1 during the dry season. The wet season average is comparable to other coastal waters around the world such as that found in French Guiana (i.e., 0.023 m2.g−1; Loisel et al., 2009) but it is much lower than that of the North Sea (0.033 m2.g−1; Babin et al., 2003a) for instance; the extremely low dry season average confirms that the dry season samples are largely dominated by inorganic particles, which is in accordance with our hypotheses of a NAP-dominated system at that time of the year. A significantly strong correlation between aNAP*(555) and bbp*(555) and bbp*(555) (R2 = 0.77, p < 0.001, N = 36) is shown in Figure 7C. Such strong relationship between the two parameters was previously reported in the Great Barrier Reef, albeit at a different wavelength [aNAP*(440) & R2 = 0.82; see Figure 13 of Blondeau-Patissier et al. (2009)], and in the Gulf of Mexico (D'Sa et al., 2007).
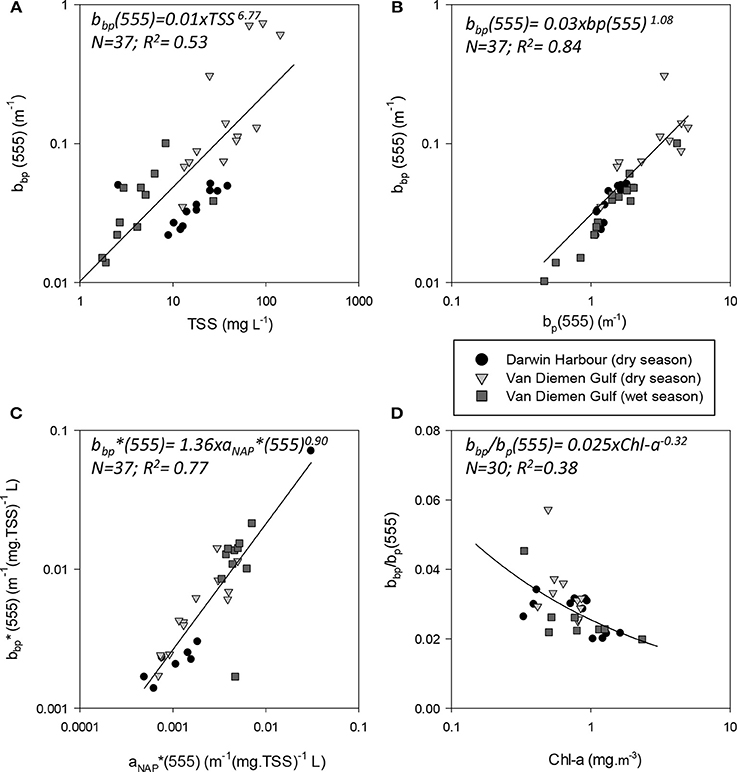
Figure 7. Absorption and scattering properties of particles. Scatterplots of backscattering (bbp555) as a function of (A) TSS and (B) the scattering coefficient (bp555), (C) Mass-specific NAP coefficient and mass-specific backscattering coefficient and (D) bb(555) as a function of Chl-a.
Temporal and spatial differences were found in the beam attenuation coefficient, c555, which was significantly higher during the dry season (p < 0.05; N = 33), particularly in the Gulf (VDGdry: 3.33 ± 1.42 m−1; p = 0.01; N = 11), compared with the wet season (VDGwet:1.61 ± 0.89 m−1; N = 15) and DH (1.91 ± 1.08 m−1; N = 22; Figure 6; Table 2). In the VDG, independent of the season, the total absorption at 555 nm, aTot(555), was a negligible portion of c555 (4 ± 1%; N = 26), while in DH it played a more important role (15 ± 8%; N = 22). The beam attenuation also displayed a strong relationship with bbp(555) (R2 = 0.80; p < 0.001; N = 36; Figure 6A). While Secchi depths were found to be relatively correlated with c(555) (R2 = 0.43; N = 47; p < 0.005; Figure 6C), c(555) was not correlated with the particulate backscattering to scattering ratio (555) (N = 26; R2 = 0.20; p > 0.1; Figure 6B). This latter parameter, , has been linked to the composition of the particle assemblage (e.g., Loisel et al., 2007), from the particle size distribution to its refraction index (e.g., Twardowski et al., 2001; Boss et al., 2004). For our dataset, (555) surface values varied three-fold (0.02–0.07; N = 36; Figure 7D; Table 2). We found a significant difference in (555) between locations and seasons (Tables 2, 3). Although, its mean value of 0.03 was above that found by Whitmire et al. (2007) (i.e., 0.01 < (555) < 0.02) over various coastal, oceanic, and freshwater environments of the US, it was in accordance with measurements found by McKee et al. (2009) in the shallow, macro-tidal estuary of the Bristol Channel where (532) was found to reach up to 0.07. Albeit at a different, shorter wavelength, the bulk of their measurements had a bi-modal distribution at 0.01 and 0.03. Spatially, (555) was found to differ (p < 0.05; N = 23), increasing from DH (0.027 ± 0.005; N = 12) to the VDG (0.033 ± 0.009; N = 11; Figures 2D, 7D). The scattering-to-attenuation ratio, b/c(555), averaged 0.91 ± 0.08 (N = 48) (Figure 9A), with the scattering coefficient, b(555), contributing >90% (N = 26) of the beam attenuation coefficient in the VDG independently of the seasons (Figures 6, 9D). In DH however, this contribution decreased to 79% during the dry season sampling in 2012 (N = 14) but was equivalent to that of the VDG (>90%) during the dry season sampling in 2013 (N = 8).
The relative contributions of phytoplankton, NAP and CDOM absorptions to the total absorption budget for our samples (N = 49) are displayed in Figure 8. Overall, the waters of this region were largely (60%) dominated by CDOM during the wet season and mostly (>45%) by NAP during the dry season, with phytoplankton contributing very little to the total absorption at 440 nm (Figure 8D). The combined absorption by NAP and CDOM generally exceeded 70% of the total absorption from 400 to 620 nm. The second highest combination was CDOM and phytoplankton (>60%), while NAP and phytoplankton contributed 50–60% for the same wavelengths. The median contribution of phytoplankton at 440 nm was 18% overall (Figure 8D), increasing to >55% at 665 nm. Darwin Harbour showed a mixed CDOM and NAP assemblage.
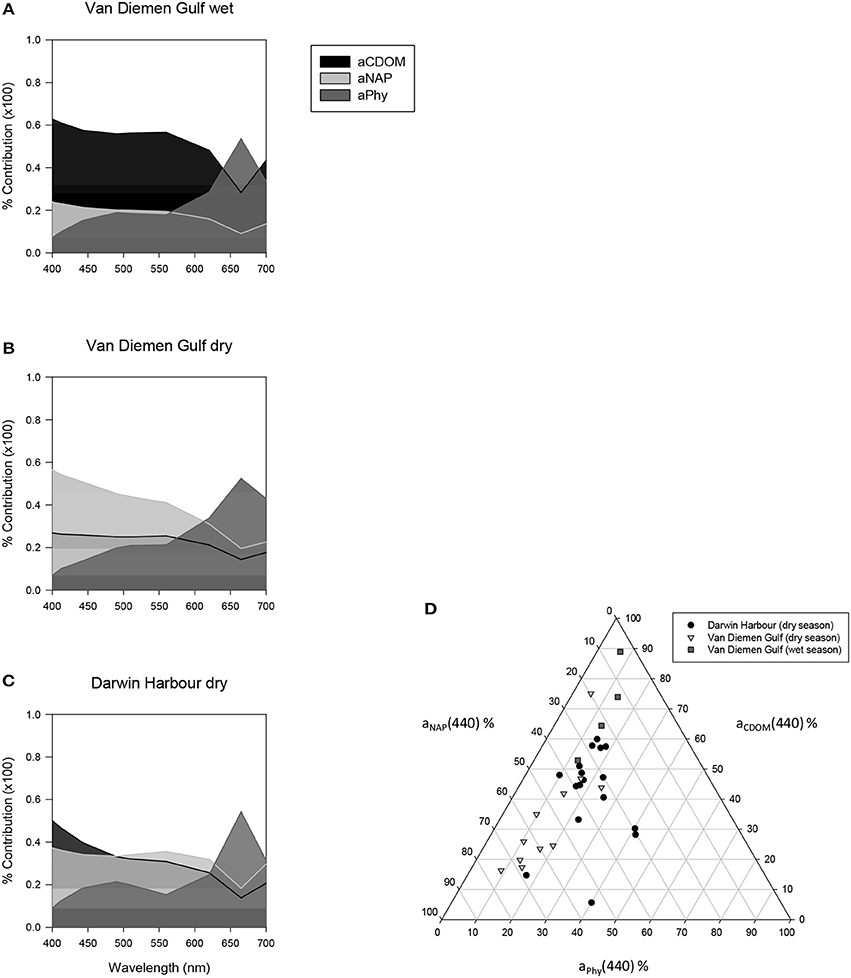
Figure 8. Average relative contribution of CDOM, NAP, and phytoplankton to the total absorption between 400 and 700 nm (A–C). Wavelength-specific ternary plot of their relative absorption at 440 nm (D).
The particulate absorption coefficient, aP(440), was found to be equally correlated with both TSS (R2 = 0.30; p < 0.001; N = 51; Figure 9B) and Chl-a (R2 = 0.28; p < 0.001; N = 50 not shown). A significant seasonal and local (VDG) variation was also found for aNAP/aP(440) (p < 0.05; N = 50) (Figure 9C; Table 3).
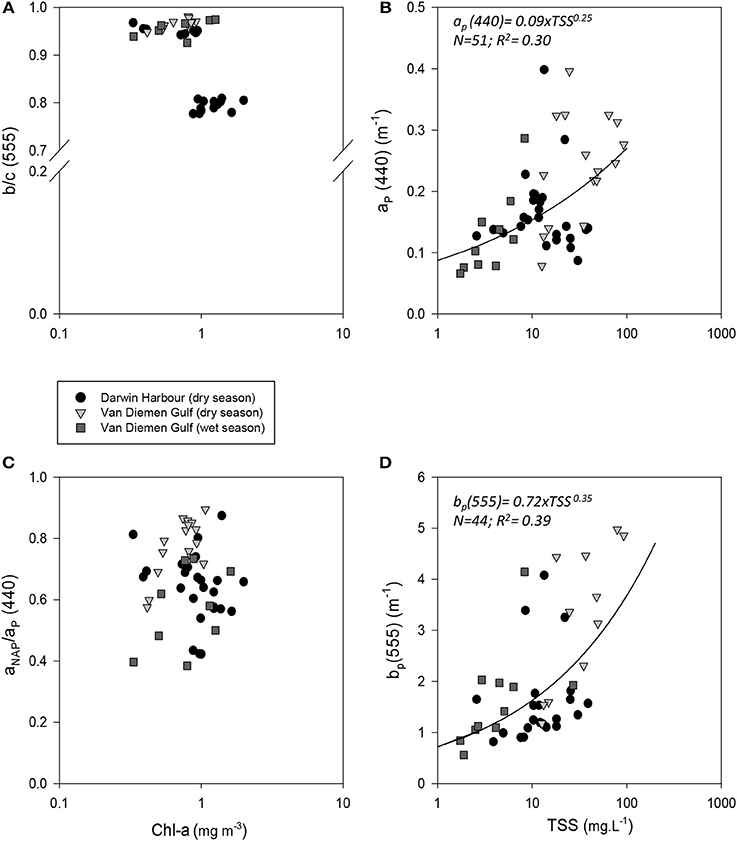
Figure 9. Relationships between (A) b/c(555) and Chl-a; (B) ap(440) and TSS; (C) proportion of non-algal particulate absorption to particulate absorption as a function of Chl-a and (D) bp(555) and TSS.
The quality of the optical closure between ac-s and filter pad total absorptions [aTot(λ)] was assessed at the selected wavelengths of 412, 440, 510, 532, and 676 nm for the VDG dry and wet season field campaign measurements. There was a very good agreement (R2 > 0.9) between the two methods in the blue and green spectral regions [i.e., aTot(ac−s) = 0.96xaTot(Filters); R2 = 0.99; N = 26 at 412 nm and aTot(ac−s) = 0.79xaTot(Filters); R2 = 0.97; N = 26 at 532 nm] but the optical closure largely degraded in the near-infrared [i.e., aTot(ac−s) = 0.31xaTot(Filters); R2 < 0.1; N = 26 at 676 nm]. The absolute relative errors between the two measurements increased from 3% in the blue to 16% in the green (532 nm) to 85% in the NIR. The correction for residual scattering in the reflecting tube of an ac-s (or ac-9) varies spectrally (Röttgers et al., 2013), while it is considered wavelength independent in the proportional correction method (as selected for this study). This may lead to high discrepancies (Leymarie et al., 2010; Pitarch et al., 2016) and although we acknowledge that the choice of the proportional correction method significantly affected our ac-s estimates in the NIR, no ac-s or bb-9 data beyond 555 nm was used in this study.
Phytoplankton: Absorption Coefficients, Pigments, Cell Counts, and Nutrients
Phytoplankton cell sizes in DH were mostly (>50%) dominated by picoplankton (<2 μm). In the VDG, the dry season samples were dominated (>60%) by microplankton (>20 μm), and the wet seasons samples were a mixed population assemblage (Figure 10). The two major carotenoid pigments, fucoxanthin and zeaxanthin, are diagnostic pigments for diatoms and cyanobacteria, respectively (Figures 11E,F). Overall, fucoxanthin was the most abundant pigment (60% of the 57 stations) and was mostly present in the VDG dry season samples (30%) (Table 3), while zeaxanthin characterized the DH samples (26%). As expected, fucoxanthin strongly co-varied with Chl-a (N = 57; R2 = 0.70; p < 0.001; Figure 11C). From the phytoplankton cell counts (2013 dry season campaign only), we found that the dominance of diatoms increased spatially, from DH to the Gulf. For the VDG dry season samples, fucoxanthin/Chl-a ratios were typically one order of magnitude higher than those of zeaxanthin, confirming that diatoms were the most abundant phytoplankton group (>70%; N = 36).
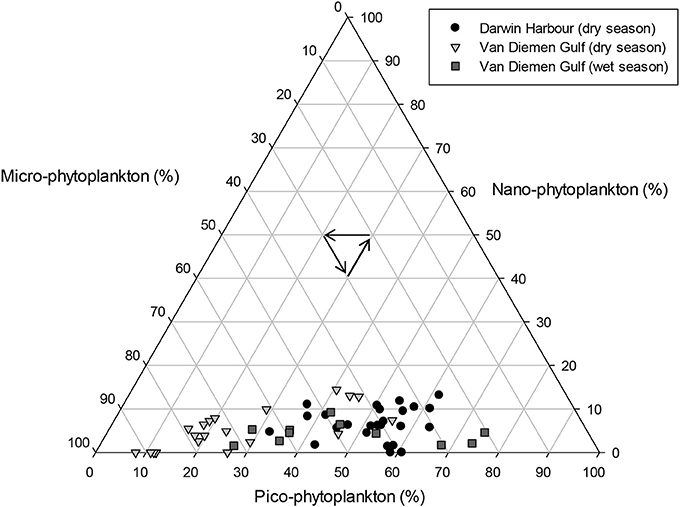
Figure 10. Proportions of phytoplankton cell sizes for the Darwin Harbour dry (N = 25), Van Diemen Gulf dry (N = 20), and Van Diemen Gulf wet (N = 11) samples. Size classes are defined as micro >20 μm, nano, 2–20 μm, and pico, <2 μm.
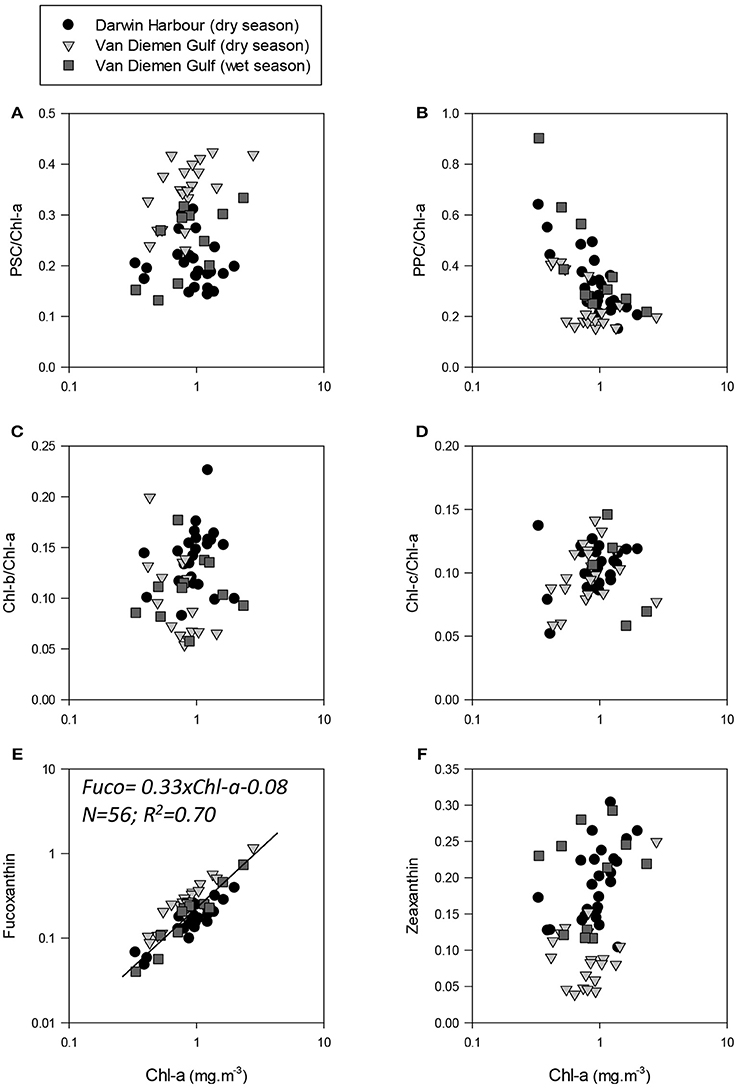
Figure 11. Photo-acclimation and photo-adaptation processes in the NMR. Pigment ratios as a function of Chl-a. (A) photosynthetic carotenoids to Chl-a ratios; (B) non-photosynthetic carotenoids/Chl-a ratios; (C) Chl-b to Chl-a ratios; and (D) Chl-c to Chl-a ratios. Fuxoxanthin and zeaxanthin as a function of Chl-a are shown in (E,F), respectively.
In the VDG, Chl-c, an accessory pigment in diatoms, was found to be more abundant than Chl-b (53%), a pigment generally associated with e.g., picophytoplankton Prochlorococcus which was mostly present in DH (72%). The pigment ratio Chl-b/Chl-a was low in the waters along Melville Island and higher in Darwin Harbour, while Chl-c/Chl-a increased from the VDG coast to Melville Island and was higher in Darwin Harbour but lower in the VDG wet samples. The VDG dry season dataset was characterized by higher PSC (Figures 11A–D), while the VDG wet and DH samples were higher in PPC. The PPC/PSC ratio provides a photo-physiologic index for phytoplankton cells. Environmental stresses, such as high light or low nutrient availability, are usually associated with higher PPC, thus resulting in higher PPC/PSC ratios. A low PPC/PSC ratio would in turn be associated with phytoplankton cells receiving low light levels in high-nutrient surface waters. However, the PPC/PSC ratio also varies between phytoplankton taxonomic groups, as phytoplankton cells exhibit a variety of tolerances and adaptations to light and nutrient exposure. Overall, the VDG samples had lower PPC/PSC ratios (~0.68) during the dry season than during the wet season (~1.50), which is due to limited light penetration from high turbidity levels. In contrast, the PPC/PSC ratios were generally high (~1.55) for the Darwin Harbour samples, likely due to a better light penetration through the water column in this system at the time of our sampling (Figure 6).
Cyanobacterium Trichodesmium sp. inhabits tropical waters, and in low wind stress conditions it produces large surface blooms that can be monitored from space (McKinna, 2014). Blooms of Trichodesmium sp. are known to occur in the region, although the dynamic coastal environment of the VDG may not favor its optimum growth, due to water column mixing. Trichodesmium sp. patches were seen at five stations over 3 days during the September 2013 field campaign, and high counts (>200 units/L) of cyanobacterial cells were found at one station in the eastern embayment of the Gulf, thus confirming previous findings from remote sensing observations of Blondeau-Patissier et al. (2014) that these cyanobacteria blooms occur regularly between August and October in the VDG-DH region.
The absorption coefficient of phytoplankton, aphy(440), was found to decrease from the coast to the center of the Gulf and was higher in the inner Harbour, but there was no significant difference in aphy(440) between the dry and wet season samples. There was a significant correlation between aphy(440) and Chl-a (R2 = 0.55; p < 0.001; N = 50; Figure 12B; Table 5), and no significant difference was found between the relationship derived from our dataset and that of Bricaud et al. (2010) (p > 0.1) or Bricaud et al. (2004) (p > 0.1). There was no significant seasonal variation in aphy(440/676) (Figure 12A; Table 3), and no significant difference was found between the model derived for this dataset and that of Bricaud et al. (1995) (N = 50; p > 0.05), therefore inferring that any of these models can be used in the VDG and/or DH (Figure 12). A significant difference (p < 0.005) however, was found for aphy*(440) between locations (Figure 12C; Table 3), thus reflecting the difference in phytoplankton composition between the VDG and DH.
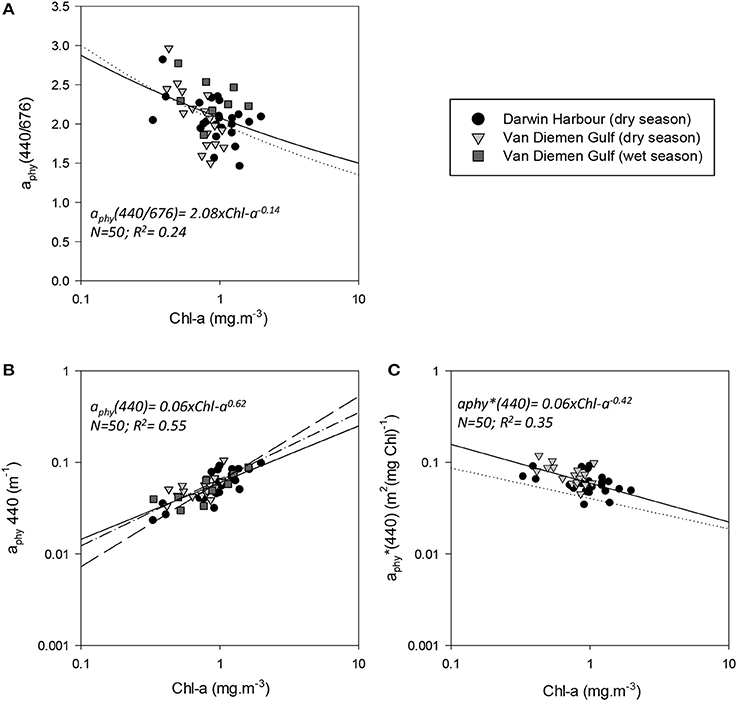
Figure 12. Relationships between phytoplankton and Chl-a. Reference models from Bricaud et al. (1995) (A–C) dotted line; Bricaud et al. (2004) (B) dash-dot line, and Bricaud et al. (2010) long dash line are shown.
Nutrients, in particular nitrate and ammonium, have the greatest potential to limit phytoplankton growth in coastal marine systems (Malerba et al., 2015). For our study regions, nutrient concentrations sampled during the dry season 2013 were much higher in the VDG in comparison to DH: mean ammonium and phosphate concentrations were almost twice those recorded in DH, while nitrate was three times greater in the VDG (Figure 14; Table 4). DH is a nitrogen depleted environment (Wolanski et al., 2006) and nitrate showed an increasing concentration gradient from the inner Harbour (~0.06 μmol.L−1; N = 5) to the outer Harbour (~0.1 μmol.L−1; N = 6; Figures 1B, 14), consistent with the principle that oceanic waters coming into the harbor are richer in nutrient content.
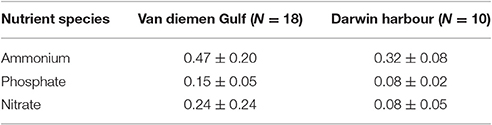
Table 4. Nutrient budget for the two regions (in μmol.L−1) as sampled during the 2013 dry season field campaign.
Summary of Results
Poor correlation (R2 < 0.2) was found between DOC and aCDOM(400) or salinity, as well as between salinity and aCDOM or Secchi depths, and between POC and TSS with Chl-a. A mild correlation (0.2 < R2 < 0.4) was found between Secchi depths and tidal range or temperature or TSS, between aP(440) and TSS and Chl-a and also between aCDOM(440) and Chl-a. A moderate correlation (0.4 < R2 < 0.6) was found between TSS and temperature, and between the tidal range and aNAP slopes. A moderate to strong correlation (0.6 < R2 < 1.0) was found between Secchi depths and aNAP(440) and aTot(440). A very good optical closure was found between ac-s measurements and the filter pads for the total absorption coefficient [aTot(412–555); R2 = 0.9]. The backscattering bbp(555) and scattering bp(555) coefficients were highly correlated (R2 > 0.8). DOC was found to be significantly different between seasons and locations. While CDOM was found to be higher during the wet season, TSS concentrations were found to be higher during the dry season in the VDG, especially for stations along the coast. DH (dry season) was composed of a mixed assemblage of CDOM and NAP. No data was available for the wet season months in DH. Chl-a and the backscattering coefficient bbp(555) did not show any statistical difference between seasons or locations, which is in contrast to c(555) and the backscattering ratio which varied seasonally and spatially.
Discussion
A Complex Environment
Effect of Local and Seasonal Forcing
The major processes controlling the optical properties in DH and the VDG are mainly the wind speed and direction during the dry season, and the tides year round. In addition, the river discharges in this region are controlled by seasonal rainfall and thus add to the complexity of this coastal system by increasing land-sourced CDOM delivery to the coastal waters. The coastal waters of Northern Australia have a tidal range that is amongst the largest in the world for a coastline facing an open ocean. For our dataset, the tidal range varied from 1 to 6 m. Stations located in DH (dry season only; N = 24) were mostly sampled during neap tides, with a mean tidal range of 2.05 ± 1.04 m. In the VDG however, the tidal ranges were 20% higher at the time of our dry season sampling (4.05 ± 1.15 m; N = 16) than during the wet season sampling (3.30 ± 0.78 m; N = 12), partly explaining the higher concentrations in TSS, from resuspension, found during the dry season. The strong tidal currents in combination with the complex, shallow bathymetry caused the high spatial variability observed in most of the surface measurements from site to site (e.g., Figure 2) as a result of localized, small scale up- and downwelling processes. Previous modeling studies have shown that Darwin Harbour's hydrodynamics are driven mainly by tides, with the wind and seasonal river inputs playing somewhat smaller roles (Li et al., 2012). In particular, Li et al. (2014) reported that the dynamics of TSS in DH vary with the spring-neap tidal cycle, with the whole water column being well-mixed during spring tides. For our study, the DH stations were sampled during the clearest conditions (neap tides) and thus our DH dataset may not be the most representative of this environment. However, it provides an interesting comparison with the VDG that is further discussed in the Section Challenges for Remote Sensing of Water Quality in the NMR.
In addition to tidal movement, another physical forcing explaining the higher TSS concentrations in the VDG during the dry season are the prevailing south-easterly winds occurring at this time of the year. These trade winds, when acting in phase with the tidal currents, significantly enhance resuspension. While the recorded wind speeds were very low during the wet season field campaign (<2 m.s−1; W-SW), winds of up to 10 m.s−1 occurred during the dry season sampling. Webster and Ford (2010) found that wind-induced waves in combination with tidal currents contributed to higher concentrations of sediment in Keppel Bay, a shallow embayment adjacent to the Fitzroy estuary in sub-tropical Queensland; In the North Sea, Hommersom et al. (2009) also found that TSS showed large short-term spatial variability due to the tidal energy, in combination with winds. These studies align with our findings that the combination of tidal energy, shallow depths, and strong winds is the main physical process controlling the increased TSS concentrations found during the dry season in the VDG.
The Alligator Rivers are directly connected to the VDG (Figure 1A), and their freshwater flows are substantial during the first 4 months of the year due to the highly seasonal rainfall. Their discharges, loaded with terrestrial material, are trapped within the coastal boundary layer, a body of turbid inshore water. Very little mixing occurs between the turbid coastal boundary layer and the rest of the Gulf. Hence we sampled much higher concentrations of sediment material along the coast in comparison to the middle of the Gulf (Figure 2). In addition the entire coastal area between DH and the Cobourg Peninsula (Figure 1A) is dominated by mangroves and tidal flats that are also known to play a key role in the sediment redistribution (Li et al., 2014). An explanation for the surprisingly low contribution of non-algal particles and TSS found for the wet season samples in the VDG is the river runoff being largely filtered through most of the Kakadu National Park wetlands (20,000 km2) prior to reaching the coast (Figure 1A; e.g., Pusey et al., 2015). The seasonal variability in river runoff also directly results in significant difference in salinity between seasons. The large amount of runoff reaching the coastal waters at the end of the wet season (~April), which coincided with the timing of our VDG 2012 wet season field campaign (Table 1A), explains the lower salinity observed during this seasonal sampling. Terrestrial runoff plays a role in CDOM characterization, by changing its slopes and concentrations. Higher aCDOM(440) values were observed during the wet season but surprisingly, these concentrations were not found to be significantly different from the dry season. Neither was a relationship found between aCDOM and salinity, but it has to be stressed that the CDOM dataset for the wet season was limited (N = 10), with only four stations having salinities lower than 28 PSU. Further seasonal sampling, in particular during the wet season and in DH, is required.
Our results showed that there was, statistically, no spatial (VDG vs. DH) or seasonal (dry vs. wet) differences in Chl-a concentrations. But within the VDG however, there was an inshore-offshore Chl-a gradient: stations close to the Alligator Rivers and Mary River featured Chl-a from 1.3 up to 2.8 mg.m−3, steadily decreasing to 0.5 mg.m−3 in the Dundas Strait (Figures 1, 2A). This distribution, which was not necessarily reflected in the other properties (beside possibly CDOM; i.e., Figure 2), is associated with the nutrient stock being concentrated mostly along the coastline and in the eastern embayment of the Gulf (VDG) due to the presence of the boundary layer that allows phytoplankton to grow (Figure 14). In DH, a similar mechanism occurs whereby the upper harbor is characterized by a longer water residence time (exceeding 20 days; Williams et al., 2006) in comparison to the inner section (Figure 14). It takes up to 22 days for the nutrients located in the upper section of the harbor to reach the sea (DHAC, 2010).
Chl-a is an indicator of phytoplankton biomass and light availability is undeniably playing a central role in the phytoplankton production in this study region: while it was found that phytoplankton production is highest in the wet season (e.g., Blondeau-Patissier et al., 2014), it is limited during the dry season possibly because of the high turbidity from the water column mixing, generated by both the shallow bathymetry and strong, dry seasonal winds, which will limit light penetration. This as reflected by lower PPC/PSC ratios and lower Chl-a concentrations found in the center of the VDG during the dry season (Figure 2A). Wet season river discharges release large amounts of nutrients and, together with the release of CDOM, are likely to fuel the primary productivity (e.g., Burford et al., 2011).
Previous studies on subtropical estuarine systems of the South East Australian coast have shown the pronounced effect of short-timescale variability in dissolved and particulate matter (particle size, composition) due to the spring-neap tidal cycle (Oubelkheir et al., 2006), stressing the need to take into account the tidal phase in the sampling strategy. Shi et al. (2011) demonstrated that the magnitude of the spring-neap tidal cycle on the variations of satellite-derived Kd(490) and TSS was comparable to the seasonal effect observed in their coastal region of SE Asia. The tidal range in their study region was comparable (~3 m) to that observed during our study of the VDG. Oubelkheir et al. (2014) also emphasized the role of short-term processes, such as wind stress and tides, as key drivers of the dissolved and particulate material in the shallow and dynamic subtropical environment of Moreton Bay (SE Queensland). In our study, the sampling strategy was primarily to ensure our stations had a large spatial distribution rather than to sample the small-scale temporal variability due to the tides, thus the tidal phase was not taken into account. This should be addressed in future field campaigns in this region, as the spring-neap tidal cycles affect both the properties sampled in the field and satellite-derived ocean color products.
A System Driven by CDOM and NAP
Characteristic of coastal waters, most optical properties and some of the biogeochemical concentrations sampled during these three field campaigns cover a large range of variability (Table 2). While aNAP(440) (coefficient of variation = 252%), atot(555) (CV = 159%), and bbp(555) (CV = 167%) are the IOPs that varied most across seasons and locations, aphy(440/676) (15%) and Chl-a (45%) were amongst those parameters that varied the least. Our results highlight that the optical properties of our coastal system (VDG in particular) was mostly driven by NAP during the dry season and CDOM during the wet season, with little influence of phytoplankton on the total absorption budget at 440 nm. Sources of NAP include phytoplankton bio-products and non-algal detritus and we concluded that NAP in the VDG did not originate from phytoplankton but rather from sediment. This is supported by the weak correlation of NAP with both Chl-a (R2 = 0.33; N = 55) and aphy (R2 < 0.10; N = 52), while being significantly correlated with TSS (R2 ~ 0.50; N = 55). The important (~84%) contributions of aCDOM(440) and aNAP(440) masked the contribution due to phytoplankton, which at ~16% was below the contribution of aphy(440) to the total absorption budget (20–60%) obtained in European coastal waters by Babin et al. (2003b).
For our study, it was found that only ~10% of the phytoplankton cells counted during the 2013 dry field campaign were viable, thus indicating that the productivity must be due to a contribution from the microbial population in this system. The UV spectroscopic characteristics of the DOC sampled in the VDG during the dry season of 2013 (low absorbance at 350 nm) are consistent with organic matter that has been subjected to bacterial degradation (Figure 13). Our results therefore suggest that the DOC of the dry season samples may have a different chemical character from the DOC delivered during the wet season. The size of the DOC fraction in the samples remained stable, indicating possible shifts in microbial community structure, which would be expected in a tropical environment. Analysis of the FDOM from the EEM also suggested that during the dry season, the material was composed mostly (~70%) of aromatic organic carbon (Weishaar et al., 2003) with a relatively constant spectral slope (0.029 ± −0.003), therefore inferring that only a small fraction of the DOC was derived from terrestrial sources (Fichot and Benner, 2012). The underlying assumption that CDOM properties can be inferred from DOC concentrations (Shanmugam, 2011; Hestir et al., 2015) was, however, not verified in this dataset. Other recent studies also reported the complete lack of relationship between DOC and CDOM (e.g., Nelson and Siegel, 2013) because the controlling factors for DOC and CDOM were different (Yamashita et al., 2013).
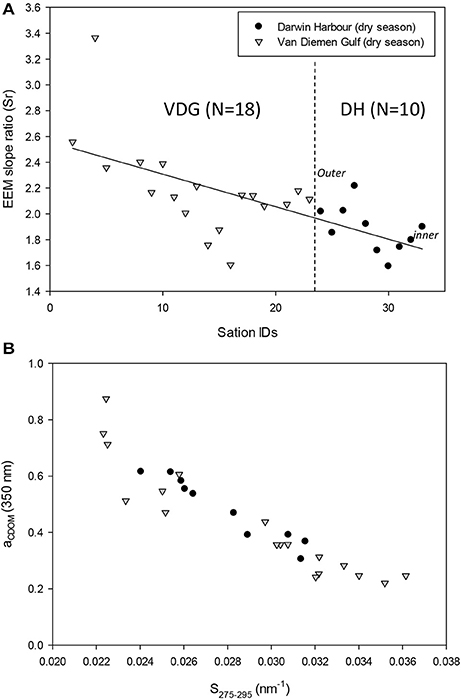
Figure 13. (A) EEM spectral slope ratios (Sr) showing a decline through the course of the 2013 dry season field campaign from the VDG to DH and (B) relationship between aCDOM and the EEM spectral slope in the UV.
Regional Differences during the Dry Season
The waters of the VDG were found to have a higher scattering component than the waters of DH, largely contributing to higher beam attenuation during the dry season in particular. This result is consistent with the higher TSS concentrations found in the VDG (dry) in comparison to DH (e.g., Figure 2B). The two environments were sampled over different tidal conditions, as the sampling in DH only occurred during neap tides. The fetch length—much larger in the VDG—and the seasonal forcing are most likely explaining the significant differences between the two locations. The VDG is ~130 km wide from the shore to the tip of the Cobourg Peninsula (Figure 1), thus offering much more ocean surface for the wind to generate sea surface roughness and resuspension. The harbor in comparison, is 15 km wide, mostly protected from the wind and its entrance is the section the most influenced by incoming waves from the ocean.
There were distinct differences in phytoplankton pigments, composition and cell counts between the samples collected in the VDG and those collected in DH (Figure 1). From cell counts and identification during the 2013 dry season field campaign, diatoms were present at 23 of the 33 stations sampled in the VDG during the dry season. This microphytoplankton dominance was also observed by Burford et al. (1995) in the neighboring Gulf of Carpentaria, suggesting possible similarities between the two gulfs; picophytoplankton however, was predominantly present in DH. It can be inferred that at the time of the 2013 field sampling, the higher number of cyanobacteria cells indicates a marine influence in DH. There was a low number of phytoplankton cell counts for most samples (~250 cells/L) overall, possibly due to the low productivity at this time of year (e.g., Blondeau-Patissier et al., 2014). In contrast, a greater diversity in phytoplankton cells was found in the Gulf. This is explained by the higher levels of nutrients being available in the VDG while DH's primary production is limited, mostly by nitrogen (Burford et al., 2008; Figure 14; Table 4). Differences in nutrient concentrations between the two locations was expected because the oceanic and VDG waters are known to be richer in nutrients in comparison to DH (Wolanski et al., 2006). Nitrate and phosphate concentrations are relatively low in the VDG (Table 4) but silicate is mostly present, explaining the large dominance of diatoms in the VDG (Condie and Dunn, 2006).
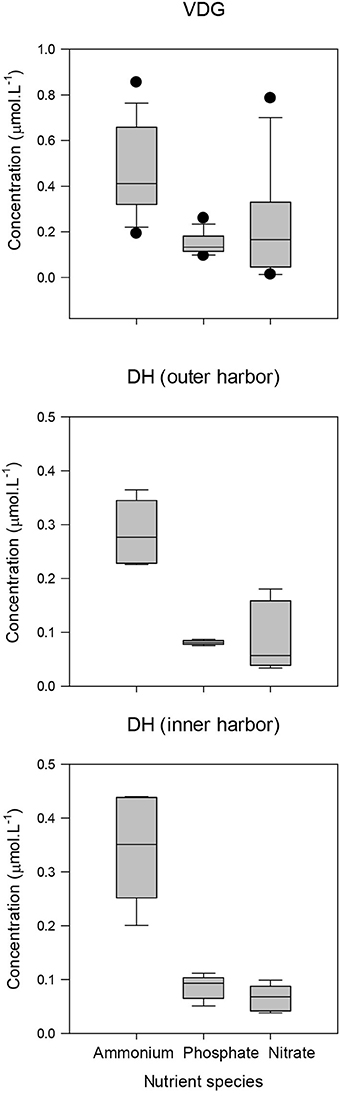
Figure 14. Boxplots of the nutrient budget for VDG and DH (inner and outer harbor). Note change of scale.
CDOM was not found to be different between the two locations, yet it has an inshore-offshore pattern (Figure 2C) with an evident decrease from the inner (0.17 m−1) to the outer (0.08 m−1) harbor for DH. We hypothesize that during the wet season, the larger amount of CDOM delivered from river runoff would compare differently to that of DH, as the amount discharged into the Gulf (e.g., East Alligator River discharge: 7 GL/yr) is much larger than the amount of CDOM that would discharged in DH (e.g., Elizabeth River discharge: 3 GL/yr). The relative contributions of the three absorption components, namely aphy(λ), aNAP(λ), and aCDOM(λ), were investigated in this study and showed that DH was mostly characterized by approximately equal contributions of aNAP(λ) and aCDOM(λ), while aNAP(λ) was predominant in the VDG. The role of SNAP is poorly understood but this parameter is often found to be stable across marine environments (Matsuoka et al., 2011). This was not the case in this study as SNAP(λ) was significantly different between the two regions with significantly higher slopes in the VDG. This difference is likely related to the particle assemblage characterizing the two regions, also reflected in (555). In contrast, the dominance of organic material during the wet season months is consistent with an enhanced phytoplankton productivity, as reported in Blondeau-Patissier et al. (2014). In the Gulf of Carpentaria, Burford and Rothlisberg (1999) also reported higher integrated primary production (~955 mg.C.m−2.day−1) during the wet season months, therefore supporting this finding. Both bp555 (R2 = 0.97; N = 48) and bbp555 (R2 = 0.80; N = 36) were found to strongly co-vary with c555 in DH and VDG, with the high b/c ratio (>90%) emphasizing that standard ocean color algorithms would likely fail in these waters, hence supporting the necessity to use a regional algorithm with an (S)IOP-based parameterization for the derivation of accurate water quality products in VDG and DH. Table 5 provides a list of selected relationships between key (S)IOP and concentrations.
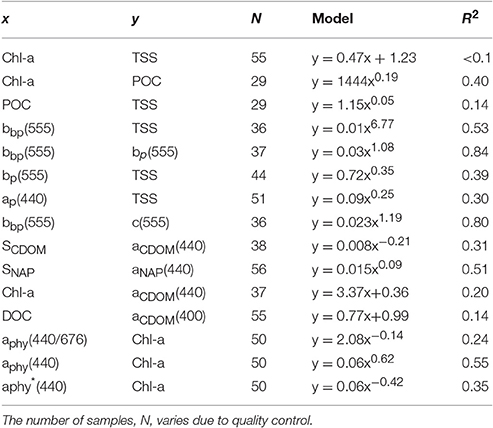
Table 5. Summary of selected relationships.
Challenges for Remote Sensing of Water Quality in the NMR
The effect of tidal currents on the spatial variability of suspended sediments can easily be observed from space using satellite observations. Figure 15 shows the two MODIS-Aqua (NASA) images covering the study region at a 250-m resolution during the 2013 dry season field campaign. Tidal currents are stronger during spring tides resulting in a more contrasted spatial distribution of suspended sediments, in comparison to neap cycles. This highlights yet another challenge in these highly dynamic environments: the scaling difference—while the satellite integrates over a larger area, the ground measurements represent point observations and their direct comparability, with respect to the satellite observations, may be questioned.
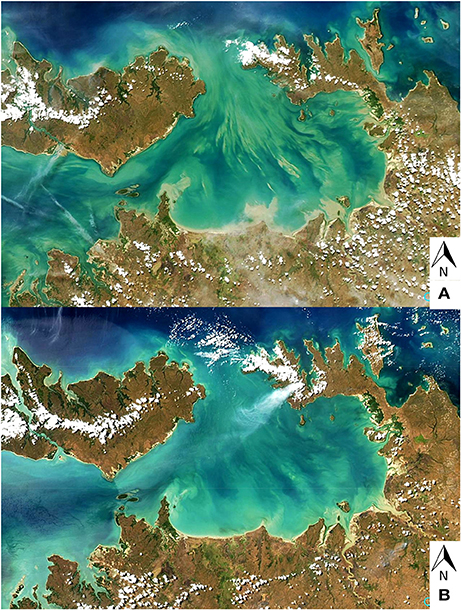
Figure 15. Large spatial variability of suspended sediment depending on the tidal energy: MODIS-Aqua 250-m resolution images during the dry season 2013 field campaign. (A) 12 September 2013 (spring tide) and (B) 14 September 2013 (neap tide).
A previous study on the dynamics of phytoplankton blooms in the VDG from the MERIS mission (Blondeau-Patissier et al., 2014) found that an increase in TSS was occurring predominantly during the dry season. This observation is supported by the findings of the present work (Tables 2, 3). MERIS sensor estimates of dry season TSS concentrations from the 2014 satellite study were much lower (4 ~ 10 mg.L−1) when compared to the results from these field samples. A total of 10 stations (with associated biogeochemical measurements) from the dry (N = 4) and wet (N = 6) season field trips in the VDG were located within the water mass cluster selected for the satellite study (see Figure 5B of Blondeau-Patissier et al., 2014). For these station locations, in situ TSS was found to increase from an overall average of 4 mg.L−1 during the wet season to 30 mg.L−1 during the dry season. This ~10-fold increase in TSS concentrations between seasons was observed in the MERIS satellite study, but it is important to recall that only few (N = 4) dry season stations in the VDG were used for this comparison. Conversely, in situ Chl-a concentrations weakly increased from 0.6 to ~0.75 mg.L−1. We can only interpret this comparison with caution for at least two reasons: first, because of the limited in situ dataset used for this exercise, and second because of the seasonal dominance of CDOM and NAP in this system which will inevitably hamper accurate satellite retrievals, of Chl-a in particular. This discrepancy also highlights the need to parameterize a region-specific remote sensing algorithm for the NMR. A seasonal parameterization, based on the wet and dry season in situ optical observations presented in this study, has been applied to MODIS-Aqua imagery of the VDG (Schroeder et al., 2015).
In recent years, ocean color remote sensing has provided a powerful means for studying ocean biogeochemistry and ecosystems over large spatial scales (Gardner et al., 2006; Tang, 2011; Swirgon and Stramska, 2015). Both the dissolved and particulate fractions of organic carbon can affect light penetration, and thus, optical properties may be used as proxies for DOC and POC (Pan et al., 2014), but satellite retrievals of these parameters may be a major challenge in the NMR because of their poor correlation with any of the variables measured. It is known that the use of optical proxies for satellite retrieval of POC is not straightforward because of the highly variable relationships between parameters (e.g., Cetinić et al., 2012). In the VDG, the maximum POC concentrations were found to be much higher than in other coastal systems, such as Chesapeake Bay (Fisher et al., 1998). For this study, POC was found to be strongly correlated with Chl-a (R2 = 0.40; N = 29) and less so with TSS (R2 = 0.14; N = 29), probably due to the composition of both the POC and the phytoplankton community (Zhu et al., 2006; Wang et al., 2009; MacIejewska and Pempkowiak, 2014a,b).
Of particular interest from a coastal ecosystem-based management point of view is the development of ecological indicators from ocean color remote sensing, such as seasonal cycle of phytoplankton biomass, spatial distribution of phytoplankton types or the delineation of ecological provinces (Platt and Sathyendranath, 2008). These require accurate in situ bio-optical measurements of phytoplankton absorption and chlorophyll to be used for remote sensing algorithm parameterization and validation. Long-term (>10 years) satellite-time series are now commonly used to assess trends in the productivity of coastal and ocean regions, and it is always stressed that well-calibrated ocean color sensors and algorithms are paramount to these estimates (e.g., Signorini et al., 2015). First and foremost, sea-truth measurements must be performed as closely as possible—both spatially and temporally—to the satellite observations if they are to be used for the validation of remote sensing algorithms. In highly dynamic coastal environments such as those of this study, it is recommended that in situ measurements be used only from samples collected within less than ±30 min of the satellite overpass to minimize bias (Martinez-Vicente et al., 2003). Independent of the match-up, the choice of the satellite algorithm, as well as its parameterization, is also an important factor. Aurin and Dierssen (2012) tested the performance of four semi-analytical algorithms at retrieving optical and biogeochemical properties in the complex waters of Long Island Sound (North Atlantic), a coastal system very similar to our region because of its comparable high proportion of CDOM and NAP and its low (<20%) phytoplankton contribution to the total absorption. The quasi-analytical algorithm (QAA; e.g., Lee et al., 2010) was found to perform better [in comparison to the three other models tested, namely, a linear matrix inversion (LMI)-type algorithm, GSM and C99] because both SNAP and SCDOM were relatively stable in space and time. This is not the case for SNAP in our study.
Concluding Remarks
The continental shelf of the NMR is the widest on the Australian continent, it is also one of the most pristine coastal environments worldwide (Morrison and Delaney, 1996; Halpern et al., 2008). Currently, the Northern Territory has no specific coastal management legislation or coastal climate change policy in place. Catchments of this region and the coastal marine environment are highly connected, yet the VDG lacks a coastal environmental monitoring program extending beyond the boundary of the well-managed Kakadu National Park. Therefore, long-term monitoring of key bio-physical coastal water quality parameters of the VDG, from in situ and satellite observations, would be of benefit to the regional environmental management. But, to date, the lack of in situ optical datasets in the NMR has limited the derivation of regional ocean color satellite algorithms for this region.
The dataset presented in this study fills this gap and is the first collected in the tropical, optically complex coastal waters of VDG and DH. Results from this study generally show that these two regions are separate coastal environments with different optical characteristics. The VDG was found to be mostly dominated by CDOM during the wet season and NAP during the dry season, while DH has a mixed absorption budget. The phytoplankton populations are also different, with the VDG being characterized by bigger phytoplankton cells (diatoms) in comparison to DH, due primarily to differences in nutrient stocks (Table 4) and light availability. The strong, south-easterly winds and the tidal energy are a combination that increases water turbidity in the Gulf during the dry season, thus limiting light penetration and hence phytoplankton growth. This study did not allow for a detailed assessment of the seasonal effect on optical properties and concentrations in DH. Additional field observations during the wet season would be necessary to seasonally characterize this environment.
From a remote sensing point of view, algorithm developments should focus on the synergistic use of new geostationary satellites such as the recently launched (October 2014) Advanced Himawari Imager (AHI) onboard Himawari-8 (Japan Meteorological Agency, JMA) in combination with polar-orbiting sensors. Geostationary instruments offer far greater temporal imaging resolution—up to 10 min intervals using Himawari-8—and have therefore the potential to resolve the bio-optical variability due to semi-diurnal tidal cycles. The performance of a seasonally parameterized MODIS-Aqua algorithm at retrieving CDOM, NAP, and Chl concentrations in the VDG is evaluated in Schroeder et al. (2015). This regional algorithm is based on the aLMI approach of Brando et al. (2012) and the dataset presented in this study was used for its parametrization.
Author Contributions
DB and TS conceived the idea of the study, collected the samples, designed, organized, and participated to the 2012 wet and 2013 dry season campaigns; DB designed and collected the samples of the 2012 dry season campaign, designed and wrote the manuscript, created all the plots, and performed all the numerical data analysis; TS provided Figure 15; LC helped organize the logistic for all the field sampling, expertly analyzed the datasets of spectrophotometric absorptions and bio-geo concentrations in the laboratory, and provided comments on the manuscript; TS and VB provided valuable comments on all versions of the manuscript; DP contributed to the design of the 2013 dry season campaign, collected, and analyzed (a) the nutrient samples and (b) the phytoplankton cell counts, and contributed to the interpretation of the results related to phytoplankton and nutrient budgets; PF analyzed the EEM dataset and provided very valuable comments on the manuscript; DW provided the tidal heights modeled for each station and contributed to some of the interpretation of the results from his expert knowledge of the region; DD provided guidance on the IOP analysis and valuable comments to earlier versions of this manuscript; JA, NT, and MT participated, and helped organize the logistic of at least one of the three field campaigns, and expertly deployed the complex optical instrumentation necessary to collect the dataset used in this paper. All co-authors have approved the manuscript to be published.
Funding
This research was funded by the North Australia Marine Research Alliance (NAMRA) and the Australian Government's National Environmental Research Program (NERP). VB was supported by the European Union (FP7-People Co-funding of Regional, National, and International Programmes, GA no. 600407) and the CNR RITMARE Flagship Project. In-kind support was provided by the CSIRO and the Australian Institute of Marine Science (AIMS).
Conflict of Interest Statement
The authors declare that the research was conducted in the absence of any commercial or financial relationships that could be construed as a potential conflict of interest.
Acknowledgments
The authors would like to thank Dr. Arnold G. Dekker (CSIRO), for valuable comments on the manuscript prior to its submission, Dr. A. Bricaud (LOV, Villefranche-sur-mer) for assistance with the selection of phytoplankton spectra suitable for this analysis, Dr. Ian Leiper (Charles Darwin University) for help with ArcGIS and some of the field sampling in Darwin Harbour, and Ms. Julie Haines (CSIRO Adelaide, Waite Campus) for the analysis of the DOC and POC samples. This research was funded by the North Australia Marine Research Alliance (NAMRA) and the Australian Government's National Environmental Research Program (NERP). VB was supported by the European Union (FP7-People Co-funding of Regional, National, and International Programmes, GA no. 600407) and the CNR RITMARE Flagship Project. In-kind support was provided by the CSIRO and the Australian Institute of Marine Science (AIMS). We also would like to thank Dr. Edward Butler (AIMS, Darwin Office) for facilitating our participation to the dry season field campaign aboard RV Solander. We thank the captain (Mr. Christopher Davis), cruise leader (Mr. Marcus Stowar) and the entire crew of the RV Solander (AIMS), as well as Mr. Steve Compain (Arafura Bluewaters Charters), for providing great working conditions and route flexibility during our field sampling. We also wish to thank Dr. Edward Butler (AIMS), Dr. Simon Townsend (AHU) and the technical services at CSIRO, Charles Darwin University, AIMS (Darwin office) and the Aquatic Health Unit (Northern Territory Government) for making their laboratory facilities available to us during this research: in particular Mrs. Rebecca Edwards and Mrs. Heidi Franklin (CSIRO), Mrs. Kirsty McAllister (AIMS), Mrs. Ellie Hayward, Mr. Matthew Gray (Fieldwork Support, CDU), and Mrs. Julia Fortune, Mr. Matthew Majid (Fieldwork Support, AHU). A 1 month visit to the Laboratoire d'Océanographie de Villefranche (LOV, CNRS/UPMC) for collaborative work between the primary author and DD has helped us progress in the data processing required for this study. Travels from Australia to France were supported by a travel grant for early career researchers (Scientific Mobility Program 2013; French Embassy, Canberra, Australia), a proposal written by both DB and DD. We acknowledge the use of Rapid Response imagery from the Land, Atmosphere Near real-time Capability for EOS (LANCE) system operated by the NASA/GSFC/Earth Science Data and Information System (ESDIS) with funding provided by NASA/HQ. Finally, the authors are grateful to the two external reviewers, and the Specialty Chief Editor of Frontiers in Marine Science for providing constructive comments to the manuscript.
Footnotes
1. ^BOM Bureau of Met., 73 year statistics (1941–1974) http://www.bom.gov.au, Climate statistics for Australian locations: Darwin Airport.
References
Acevedo-Trejos, E., Brandt, G., Steinacher, M., and Merico, A. (2014). A glimpse into the future composition of marine phytoplankton communities. Front. Mar. Sci. 1:15. doi: 10.3389/fmars.2014.00015
Acker, J., Lyon, P., Hoge, F., Shen, S., Roffer, M., and Gawlikowski, G. (2009). Interaction of hurricane katrina with optically complex water in the gulf of mexico: interpretation using satellite-derived inherent optical properties and chlorophyll concentration. IEEE Geosci. Remote Sens. Lett. 6, 209–213. doi: 10.1109/LGRS.2008.2007658
Agustí, S., and Duarte, C. M. (2013). Phytoplankton lysis predicts dissolved organic carbon release in marine plankton communities. Biogeosciences 10, 1259–1264. doi: 10.5194/bg-10-1259-2013
Andutta, F. P., Wang, X. H., Li, L., and Williams, D. (2014). “Hydrodynamics and sediment transport in a macro-tidal estuary: Darwin harbour, Australia,” in Estuaries of Australia in 2050 and Beyond, ed E. Wolanski (Dordrecht: Springer), 111–129.
Aurin, D. A., and Dierssen, H. M. (2012). Advantages and limitations of ocean color remote sensing in CDOM-dominated, mineral-rich coastal and estuarine waters. Remote Sens. Environ. 125, 181–197. doi: 10.1016/j.rse.2012.07.001
Babin, M., Morel, A., Fournier-Sicre, V., Fell, F., and Stramski, D. (2003a). Light scattering properties of marine particles in coastal and oceanic waters as related to the particle mass concentration. Limnol. Oceanogr. 48, 843–859. doi: 10.4319/lo.2003.48.2.0843
Babin, M., Stramski, D., Ferrari, G. M., Claustre, H., Bricaud, A., Obolensky, G., et al. (2003b). Variations in the light absorption coefficients of phytoplankton, nonalgal particles, and dissolved organic matter in coastal waters around Europe. J. Geophys. Res. 108, 3211. doi: 10.1029/2001JC000882
Bauer, J. E., Cai, W.-J., Raymond, P. A., Bianchi, T. S., Hopkinson, C. S., and Regnier, P. A. G. (2013). The changing carbon cycle of the coastal ocean. Nature 504, 61–70. doi: 10.1038/nature12857
Bauer, J. E., Druffel, E. R. M., Wolgast, D. M., and Griffin, S. (2002). Temporal and regional variability in sources and cycling of DOC and POC in the northwest Atlantic continental shelf and slope. Deep Sea Res. Part II Top. Stud. Oceanogr. 49, 4387–4419. doi: 10.1016/S0967-0645(02)00123-6
Blondeau-Patissier, D., Brando, V. E., Oubelkheir, K., Dekker, A. G., Clementson, L. A., and Daniel, P. (2009). Bio-optical variability of the absorption and scattering properties of the Queensland inshore and reef waters, Australia. J. Geophys. Res. 114, C05003. doi: 10.1029/2008JC005039
Blondeau-Patissier, D., Dekker, A. G., Schroeder, T., and Brando, V. E. (2011). Thematic Findings: Surface Phytoplankton Blooms and Phytoplankton Biomass in Coastal Waters. State of the Environment 2011 Committee, Australia State of the Environment 2011. Independent Report to the Australian Government Minister for Sustainability, Environment, Water, Population and Communities, DSEWPaC, Canberra, ACT, 410–411.
Blondeau-Patissier, D., Schroeder, T., Brando, V. E., Maier, S. W., Dekker, A. G., and Phinn, S. (2014). ESA-MERIS 10-year mission reveals contrasting phytoplankton bloom dynamics in two tropical regions of Northern Australia. Remote Sens. 6, 2963–2988. doi: 10.3390/rs6042963
Blough, N. V., and Del Vecchio, R. (2002). “Chromophoric DOM in the coastal environment,” in Biogeochemistry of Marine Dissolved Organic Matter, 1st Edn., eds D. A. Hansell and C. A. Carlson (San Diego, CA: Academic Press), 509–546.
Boss, E., Pegau, W. S., Lee, M., Twardowski, M., Shybanov, E., Korotaev, G., et al. (2004). Particulate backscattering ratio at LEO 15 and its use to study particle composition and distribution. J. Geophys. Res. 109:C01014. doi: 10.1029/2002JC001514
Bowen, B. W., Rocha, L. A., Toonen, R. J., and Karl, S. A. (2013). The origins of tropical marine biodiversity. Trends Ecol. Evol. 28, 359–366. doi: 10.1016/j.tree.2013.01.018
Brando, V. E., Dekker, A. G., Park, Y.-J., and Schroeder, T. (2012). An adaptive semi-analytical inversion of ocean colour radiometry in optically complex waters. Appl. Opt. 51, 2808–2833. doi: 10.1364/AO.51.002808
Bricaud, A., Babin, M., Claustre, H., Ras, J., and Tieche, F. (2010). Light absorption properties and absorption budget of Southeast Pacific waters. J. Geophys. Res. 115:19. doi: 10.1029/2009JC005517
Bricaud, A., Babin, M., Morel, A., and Claustre, H. (1995). Variability in the chlorophyll-specific absorption coefficients of natural phytoplankton: analysis and parameterization. J. Geophys. Res. 100, 13321–13332.
Bricaud, A., Claustre, H., Ras, J., and Oubelkheir, K. (2004). Natural variability of phytoplanktonic absorption in oceanic waters: influence of the size structure of algal populations. J. Geophys. Res. 109, C11010. doi: 10.1029/2004JC002419
Burford, M. A., Alongi, D. M., McKinnon, A. D., and Trott, L. A. (2008). Primary production and nutrients in a tropical macrotidal estuary, Darwin Harbour, Australia. Estuar. Coast. Shelf Sci. 79, 440–448. doi: 10.1016/j.ecss.2008.04.018
Burford, M. A., Revill, A. T., Palmer, D. W., Clementson, L., Robson, B. J., and Webster, I. T. (2011). River regulation alters drivers of primary productivity along a tropical river-estuary system. Mar. Freshw. Res. 62, 141–151. doi: 10.1071/MF10224
Burford, M. A., Revill, A. T., Smith, J., and Clementson, L. (2012a). Effect of sewage nutrients on algal production, biomass and pigments in tropical tidal creeks. Mar. Pollut. Bull. 64, 2671–2680. doi: 10.1016/j.marpolbul.2012.10.008
Burford, M. A., and Rothlisberg, P. C. (1999). Factors Limiting phytoplankton production in a tropical continental shelf ecosystem. Estuar. Coast. Shelf Sci. 48, 541–549. doi: 10.1006/ecss.1999.0471
Burford, M. A., Rothlisberg, P. C., and Wang, Y. (1995). Spatial and temporal distribution of tropical phytoplankton species and biomass in the Gulf of Carpentaria, Australia. Mar. Ecol. Prog. Ser. 118, 255–266. doi: 10.3354/meps118255
Burford, M. A., Webster, I. T., Revill, A. T., Kenyon, R. A., Whittle, M., and Curwen, G. (2012c). Controls on phytoplankton productivity in a wet–dry tropical estuary. Estuar. Coast. Shelf Sci. 113, 141–151. doi: 10.1016/j.ecss.2012.07.017
Cetinić, I., Perry, M. J., Briggs, N. T., Kallin, E., D'Asaro, E. A., and Lee, C. M. (2012). Particulate organic carbon and inherent optical properties during 2008 North Atlantic Bloom Experiment. J. Geophys. Res. 117:C06028. doi: 10.1029/2011JC007771
Claustre, H., Morel, A., Babin, M., Cailliau, C., Marie, D., Marty, J. C., et al. (1999). Variability in particle attenuation and chlorophyll fluorescence in the Tropical Pacific: scales, patterns, and biogeochemical implications. J. Geophys. Res. 104, 3401–3422. doi: 10.1029/98JC01334
Clementson, L. A. (2013). “The CSIRO method,” in The Fifth SeaWiFS HPLC Analysis Round-Robin Experiment (SeaHARRE-5), eds S. B. Hooker, L. Clementson, C. S. Thomas, L. Schlüter, M. Allerup, J. Ras, H. Claustre, C. Normandeau, J. Cullen, M. Kienast, W. Kozlowski, M. Vernet, S. Chakraborty, S. Lohrenz, M. Tuel, D. Redalje, P. Cartaxana, C. R. Mendes, V. Brotas, S. G. Prabhu Matondkar, S. G. Parab, A. Neeley, and E. Skarstad Egeland (Greenbelt, MD: Goddard Space Flight Center; NASA).
Clementson, L. A., Parslow, J. S., Turnbull, A. R., and Bonham, P. I. (2004). Properties of light absorption in a highly coloured estuarine system in south-east Australia which is prone to blooms of the toxic dinoflagellate Gymnodinium catenatum. Estuar. Coast. Shelf Sci. 60, 101–112. doi: 10.1016/j.ecss.2003.11.022
Condie, S. A. (2011). Modeling seasonal circulation, upwelling and tidal mixing in the Arafura and Timor Seas. Cont. Shelf Res. 31, 1427–1436. doi: 10.1016/j.csr.2011.06.005
Condie, S. A., and Dunn, J. R. (2006). Seasonal characteristics of the surface mixed layer in the Australasian region: implications for primary production regimes and biogeography. Mar. Freshw. Res. 57, 569–590. doi: 10.1071/MF06009
CSIRO (2009). Water in the Van Diemen region of the Timor Sea Drainage. A report to the Australian Government from the CSIRO Northern Australia Sustainable Yields Project, CSIRO Water for a Healthy Country Flagship, 363–452.
DHAC (2010). Darwin Harbour Advisory Committee: Ecosystem Research Group. Palmerston, NT: Darwin Harbour Advisory Committee.
D'Sa, E. J., Miller, R. L., and McKee, B. A. (2007). Suspended particulate matter dynamics in coastal waters from ocean color: application to the northern Gulf of Mexico. Geophys. Res. Lett. 34:L23611. doi: 10.1029/2007GL031192
Fabiano, M., Povero, P., Donavero, R., and Misic, C. (1999). Particulate organic matter composition in a semienclosed Periantarctic system: the Straits of Magellan. Sci. Mar. 63, 89–98. doi: 10.3989/scimar.1999.63s189
Fichot, C. G., and Benner, R. (2011). A novel method to estimate DOC concentrations from CDOM absorption coefficients in coastal waters. Geophys. Res. Lett. 38:L03610. doi: 10.1029/2010GL046152
Fichot, C. G., and Benner, R. (2012). The spectral slope coefficient of chromophoric dissolved organic matter (S275–295) as a tracer of terrigenous dissolved organic carbon in river-influenced ocean margins. Limnol. Oceanogr. 57, 1453–1466. doi: 10.4319/lo.2012.57.5.1453
Fichot, C. G., and Benner, R. (2014). The fate of terrigenous dissolved organic carbon in a river-influenced ocean margin. Glob. Biogeochem. Cycles 28:2013GB004670. doi: 10.1002/2013GB004670
Fichot, C. G., Lohrenz, S. E., and Benner, R. (2014). Pulsed, cross-shelf export of terrigenous dissolved organic carbon to the Gulf of Mexico. J. Geophys. Res. 119, 1176–1194. doi: 10.1002/2013jc009424
Fisher, T., Hagy, J., and Rochelle-Newall, E. (1998). Dissolved and particulate organic carbon in Chesapeake Bay. Estuaries 21, 215–229. doi: 10.2307/1352470
Gardner, W. D., Mishonov, A. V., and Richardson, M. J. (2006). Global POC concentrations from in-situ and satellite data. Deep Sea Res. Part II Top. Stud. Oceanogr. 53, 718–740. doi: 10.1016/j.dsr2.2006.01.029
Hallegraeff, G. M., Bolch, C. J. S., Hill, D. R. A., Jameson, I., LeRoi, J. M., McMinn, A., et al. (2010). Algae of Australia: Phytoplankton of Temperate Coastal Waters. Canberra, ACT: CSIRO; Australian Biological Resources Study.
Hallegraeff, G. M., and Jeffrey, S. W. (1984). Tropical phytoplankton species and pigments in continental shelf waters of north and north-west Australia. Mar. Ecol. Prog. Ser. 20, 59–74. doi: 10.3354/meps020059
Halpern, B. S., Walbridge, S., Selkoe, K. A., Kappel, C. V., Micheli, F., D'Agrosa, C., et al. (2008). A global map of human impact on marine ecosystems. Science 319, 948–952. doi: 10.1126/science.1149345
Hansell, D. A., and Carlson, C. A. (2001). Marine dissolved organic matter and the carbon cycle. Oceanography 14, 41–49. doi: 10.5670/oceanog.2001.05
Hasle, G. (1978). “The inverted microscope method,” in Phytoplankton Manual, ed A. Sournia (Paris: UNESCO), 88–96.
Helms, J. R., Stubbins, A., Ritchie, J. D., Minor, E. C., Kieber, D. J., and Mopper, K. (2008). Absorption spectral slopes and slope ratios as indicators of molecular weight, source, and photobleaching of chromophoric dissolved organic matter. Limnol. Oceanogr. 53, 955–969. doi: 10.4319/lo.2008.53.3.0955
Hestir, E. L., Brando, V., Campbell, G., Dekker, A., and Malthus, T. (2015). The relationship between dissolved organic matter absorption and dissolved organic carbon in reservoirs along a temperate to tropical gradient. Remote Sens. Environ. 156, 395–402. doi: 10.1016/j.rse.2014.09.022
Hommersom, A., Peters, S., Wernand, M. R., and de Boer, J. (2009). Spatial and temporal variability in bio-optical properties of the Wadden Sea. Estuar. Coast. Shelf Sci. 83, 360–370. doi: 10.1016/j.ecss.2009.03.042
Ilahude, A. G., and Mardanis, K. (1990). On the hydrology and productivity of the northern Arafura Sea. Netherland J. Sea Res. 25, 573–583. doi: 10.1016/0077-7579(90)90079-V
IOCCG (2000). “Remote Sensing of Ocean Colour in Coastal, and Other Optically-Complex, Waters,” in Reports of the International Ocean-Colour Coordinating Group, ed S. Sathyendranath (Dartmouth, NS: Bedford Institute).
Jennerjahn, T. C. (2012). Biogeochemical response of tropical coastal systems to present and past environmental change. Earth Sci. Rev. 114, 19–41. doi: 10.1016/j.earscirev.2012.04.005
Kishino, M., Takahashi, M., Okami, N., and Ichimura, S. (1985). Estimation of the spectral absorption coefficients of phytoplankton in the sea. Bull. Mar. Sci. 37, 634–642.
Le, C., Lehrter, J. C., Hu, C., Schaeffer, B., MacIntyre, H., Hagy, J. D., et al. (2015). Relation between inherent optical properties and land use and land cover across Gulf Coast estuaries. Limnol. Oceanogr. 60, 920–933. doi: 10.1002/lno.10065
Lee, Z. P., Arnone, R., Hu, C. M., Werdell, P. J., and Lubac, B. (2010). Uncertainties of optical parameters and their propagations in an analytical ocean color inversion algorithm. Appl. Opt. 49, 369–381. doi: 10.1364/AO.49.000369
Leymarie, E., Doxaran, D., and Babin, M. (2010). Uncertainties associated to measurements of inherent optical properties in natural waters. Appl. Opt. 49, 5415–5436. doi: 10.1364/AO.49.005415
Li, L., Wang, X. H., Andutta, F., and Williams, D. (2014). Effects of mangroves and tidal flats on suspended-sediment dynamics: observational and numerical study of Darwin Harbour, Australia. J. Geophys. Res. 119, 5854–5873. doi: 10.1002/2014jc009987
Li, L., Wang, X. H., Williams, D., Sidhu, H., and Song, D. (2012). Numerical study of the effects of mangrove areas and tidal flats on tides: a case study of Darwin Harbour, Australia. J. Geophys. Res. 117, C06011–C06012. doi: 10.1029/2011jc007494
Loisel, H., Meriaux, X., Berthon, J.-F., and Poteau, A. (2007). Investigation of the optical backscattering to scattering ratio of marine particles in relation to their biogeochemical composition in the eastern English Channel and southern North Sea. Limnol. Oceanogr. 52, 739–752. doi: 10.4319/lo.2007.52.2.0739
Loisel, H., Mériaux, X., Poteau, A., Artigas, L. F., Lubac, B., Gardel, A., et al. (2009). Analyze of the inherent optical properties of French Guiana coastal waters for remote sensing applications. J. Coast. Res. 56, 1532–1536.
Lyon, P. E. (2010). “Inherent Optical properties in the wakes of Tropical Cyclones/Storms/Depressions: 1997 through 2006,” in The 2010 AGU Ocean Sciences Meeting AGU (Washington, DC).
MacIejewska, A., and Pempkowiak, J. (2014a). DOC and POC in the southern Baltic Sea. Part II – evaluation of factors affecting organic matter concentrations using multivariate statistical methods. Oceanologia. 57, 168–176. doi: 10.5697/oc.56-3.523
MacIejewska, A., and Pempkowiak, J. (2014b). DOC and POC in the water column of the southern Baltic. Part I. Evaluation of factors influencing sources, distribution and concentration dynamics of organic matter. Oceanologia 56, 523–548. doi: 10.5697/oc.56-3.523
Malerba, M. E., Connolly, S. R., and Heimann, K. (2015). An experimentally validated nitrate–ammonium–phytoplankton model including effects of starvation length and ammonium inhibition on nitrate uptake. Ecol. Modell. 317, 30–40. doi: 10.1016/j.ecolmodel.2015.08.024
Martinez-Vicente, V., Tilstone, G. H., Blondeau-Patissier, D., and Menezes, A. (2003). “Validation of MERIS geophysical products in open ocean and coastal waters of the southern North Sea and western English Channel,” in MAVT: ESA (Frascati), 11.
Matsuoka, A., Hill, V., Huot, Y., Babin, M., and Bricaud, A. (2011). Seasonal variability in the light absorption properties of western Arctic waters: parameterization of the individual components of absorption for ocean color applications. J. Geophys. Res. 116, C02007. doi: 10.1029/2009JC005594
McKee, D., Chami, M., Brown, I., Calzado, V. S., Doxaran, D., and Cunningham, A. (2009). Role of measurement uncertainties in observed variability in the spectral backscattering ratio: a case study in mineral-rich coastal waters. Appl. Opt. 48, 4663–4675. doi: 10.1364/AO.48.004663
McKinna, L. I. W. (2014). Three decades of ocean-color remote-sensing Trichodesmium spp. in the World's oceans: a review. Progr. Oceanogr. 131, 177–199. doi: 10.1016/j.pocean.2014.12.013
Mitchell, B. G. (1990). “Algorithms for determining the absorption coefficient of aquatic particulates using the quantitative filter technique (QFT),” in Proceedings of Ocean Optics X, SPIE (Orlando, FL), 137–148.
Morel, A. (1988). Optical modeling of the upper ocean in relation to its biogenous matter content (Case 1 waters). J. Geophys. Res. 93, 10749–10768. doi: 10.1029/JC093iC09p10749
Morrison, R. J., and Delaney, J. R. (1996). Marine pollution in the Arafura and Timor Seas. Mar. Pollut. Bull. 32, 327–334. doi: 10.1016/0025-326X(96)00004-5
Nelson, N. B., and Siegel, D. A. (2013). The Global distribution and dynamics of chromophoric dissolved organic matter. Annu. Rev. Mar. Sci. 5, 447–476. doi: 10.1146/annurev-marine-120710-100751
Neukermans, G., Ruddick, K., Loisel, H., and Roose, P. (2012). Optimization and quality control of suspended particulate matter concentration measurement using turbidity measurements. Limnol. Oceanogr. 10, 1011–1023. doi: 10.4319/lom.2012.10.1011
Oubelkheir, K., Clementson, L., Webster, I., Ford, P., Dekker, A. G., Radke, L., et al. (2006). Using inherent optical properties to investigate biogeochemical dynamics in a tropical macrotidal coastal system. J. Geophys. Res. 111, C07021. doi: 10.1029/2005JC003113
Oubelkheir, K., Ford, P. W., Clementson, L. A., Cherukuru, N., Fry, G., and Steven, A. D. L. (2014). Impact of an extreme flood event on optical and biogeochemical properties in a sub-tropical coastal peri-urban embayment (Eastern Australia). J. Geophys. Res. 119, 6024–6045. doi: 10.1002/2014JC010205
Pan, D., Liu, Q., and Bai, Y. (2014). Review and suggestions for estimating particulate organic carbon and dissolved organic carbon inventories in the ocean using remote sensing data. Acta Oceanol. Sin. 33, 1–10. doi: 10.1007/s13131-014-0419-4
Pegau, W. S., Gray, D., and Zaneveld, J. R. V. (1997). Absorption and attenuation of visible and near-infrared light in water: dependence on temperature and salinity. Appl. Opt. 36, 6035–6046. doi: 10.1364/AO.36.006035
Pitarch, J., Volpe, G., Colella, S., Santoleri, R., and Brando, V. (2016). Absorption correction and phase function shape effects on the closure of apparent optical properties. Appl. Opt. 55, 8618–8636. doi: 10.1364/AO.55.008618
Platt, T., and Sathyendranath, S. (2008). Ecological indicators for the pelagic zone of the ocean from remote sensing. Remote Sens. Environ. 112, 3426–3436. doi: 10.1016/j.rse.2007.10.016
Pusey, B. J., Kennard, M. J., Larson, H. K., Alsop, Q., Hammer, M., and Buckle, D. J. (2015). Estuarine fishes of the South Alligator River, Kakadu National Park, northern Australia. Mar. Freshw. Res. 67, 1797–1812. doi: 10.1071/MF15221
Romero-Ibarra, N., and Silverberg, N. (2011). The contribution of various types of settling particles to the flux of organic carbon in the Gulf of St. Lawrence. Cont. Shelf Res. 31, 1761–1776. doi: 10.1016/j.csr.2011.08.006
Röttgers, R., McKee, D., and Woźniak, S. B. (2013). Evaluation of scatter corrections for ac-9 absorption measurements in coastal waters. Methods Oceanogr. 7, 21–39. doi: 10.1016/j.mio.2013.11.001
Roy, S., Sathyendranath, S., Bouman, H., and Platt, T. (2013). The global distribution of phytoplankton size spectrum and size classes from their light-absorption spectra derived from satellite data. Remote Sens. Environ. 139, 185–197. doi: 10.1016/j.rse.2013.08.004
Ryle, V. D., Mueller, H. R., and Gentien, P. (1981). Automated Analysis of Nutrients in Tropical Sea Waters. Technical bulletin Oceanography series No. 3. AIMS Oceanography Series Tech. Bulletin, Towsnville, QLD.
Sathyendranath, S., Stuart, V., Nair, A., Oka, K., Nakane, T., Bouman, H., et al. (2009). Carbon-to-chlorophyll ratio and growth rate of phytoplankton in the sea. Mar. Ecol. Prog. Ser. 383, 73–84. doi: 10.3354/meps07998
Schroeder, T., Brando, V., Blondeau-Patissier, D., Clementson, L. A., Anstee, J. M., and Thapar, N. (2015). Remote Sensing Methods to Map and Monitor the Condition of Coastal Habitats and Other Surrogates for Biodiversity, Part B: Water Quality Mapping of the Van Diemen Gulf, Image Processing and Data Analysis. Brisbane, QLD: CSIRO Oceans & Atmosphere Flagship.
Schroeder, T., Dekker, A., and Rathbone, C. E. (2009). Remote Sensing for Light Attenuation Mapping in the North Marine Region. CSIRO Wealth from Oceans Flagship Report to the Department of the Environment, Water, Heritage and the Arts, CSIRO Land and Water, Canberra, ACT.
Schroeder, T., Devlin, M. J., Brando, V. E., Dekker, A. G., Brodie, J. E., Clementson, L. A., et al. (2012). Inter-annual variability of wet season freshwater plume extent into the Great Barrier Reef lagoon based on satellite coastal ocean colour observations. Mar. Pollut. Bull. 65, 210–223. doi: 10.1016/j.marpolbul.2012.02.022
Shanmugam, P. (2011). New models for retrieving and partitioning the colored dissolved organic matter in the global ocean: implications for remote sensing. Remote Sens. Environ. 115, 1501–1521. doi: 10.1016/j.rse.2011.02.009
Shi, W., Wang, M., and Jiang, L. (2011). Spring-neap tidal effects on satellite ocean color observations in the Bohai Sea, Yellow Sea, and East China Sea. J. Geophys. Res. 116:C12032. doi: 10.1029/2011JC007234
Signorini, S. R., Franz, B. A., and McClain, C. R. (2015). Chlorophyll variability in the oligotrophic gyres: mechanisms, seasonality and trends. Front. Mar. Sci. 2:1. doi: 10.3389/fmars.2015.00001
Snyder, W. A. R., Arnone, A., Davis, C. O., Goode, W., Gould, R. W., Ladner, S., et al. (2008). Optical scattering and backscattering by organic and inorganic particulates in U.S. coastal waters. Appl. Opt. 47, 666–677. doi: 10.1364/AO.47.000666
Story, R., Galloway, R., McAlpine, J., Aldrick, J., and Williams, M. (1969). Lands of the Alligator Rivers Area, Northern Territory. Land Research Series. Melbourne, VIC: CSIRO.
Swirgon, M., and Stramska, M. (2015). Comparison of in situ and satellite ocean color determinations of particulate organic carbon concentration in the global ocean. Oceanologia 57, 25–31. doi: 10.1016/j.oceano.2014.09.002
Tilstone, G., Peters, S., van der Woerd, H., Eleveld, M., Ruddick, K., Schoenfeld, W., et al. (2012). Variability in specific-absorption properties and their use in a semi-analytical Ocean Colour Algorithm for MERIS in North Sea and Western English Channel coastal waters. Remote Sens. Environ. 118, 320–338. doi: 10.1016/j.rse.2011.11.019
Twardowski, M. S., Boss, E., MacDonald, J. B., Pegau, W. S., Barnard, A. H., and Zaneveld, J. R. V. (2001). A model for estimating bulk refractive index from the optical backscattering ratio and the implications for understanding particle composition in case I and case II waters. J. Geophys. Res. 106, 14129–14142. doi: 10.1029/2000JC000404
Uitz, J., Claustre, H., Morel, A., and Hooker, S. B. (2006). Vertical distribution of phytoplankton communities in open ocean: an assessment based on surface chlorophyll. J. Geophys. Res. 111:C08005. doi: 10.1029/2005JC003207
Vantrepotte, V., Danhiez, F.-P., Loisel, H., Ouillon, S., Mériaux, X., Cauvin, A., et al. (2015). CDOM-DOC relationship in contrasted coastal waters: implication for DOC retrieval from ocean color remote sensing observation. Opt. Express 23, 33–54. doi: 10.1364/OE.23.000033
Vidussi, F., Claustre, H., Manca, B. B., Luchetta, A., and Marty, J. C. (2001). Phytoplankton pigment distribution in relation to upper thermocline circulation in the eastern Mediterranean Sea during winter. J. Geophys. Res. 106, 19939–19956. doi: 10.1029/1999JC000308
Wang, X. J., Behrenfeld, M., Le Borgne, R., Murtugudde, R., and Boss, E. (2009). Regulation of phytoplankton carbon to chlorophyll ratio by light, nutrients and temperature in the Equatorial Pacific Ocean: a basin-scale model. Biogeosciences 6, 391–404. doi: 10.5194/bg-6-391-2009
Webster, I. T., and Ford, P. W. (2010). Delivery, deposition and redistribution of fine sediments within macrotidal Fitzroy Estuary/Keppel Bay: Southern Great Barrier Reef, Australia. Cont. Shelf Res. 30, 793–805. doi: 10.1016/j.csr.2010.01.017
Weishaar, J. L., Aiken, G. R., Bergamaschi, B. A., Fram, M. S., Fujii, R., and Mopper, K. (2003). Evaluation of specific ultraviolet absorbance as an indicator of the chemical composition and reactivity of dissolved organic carbon. Environ. Sci. Technol. 37, 4702–4708. doi: 10.1021/es030360x
Whitmire, A. L., Boss, E., Cowles, T. J., and Pegau, W. S. (2007). Spectral variability of the particulate backscattering ratio. Opt. Express 15, 7019–7031. doi: 10.1364/OE.15.007019
Williams, D. (2009). Dredging of Sand from Darwin Harbour, Hydrographic and Marine Life. Part 1 Hydrodynamics and Sediment Transport. Darwin, NT: Australian Institute of Marine Science.
Williams, D., Wolanski, E., and Spagnol, S. (2006). “Hydrodynamics of Darwin harbour,” in The Environment in Asia Pacific Harbours, ed E. Wolanski (Dordrecht: Springer), 461–476.
Wolanski, E., McKinnon, D. A., Williams, D., and Alongi, D. M. (2006). “An estuarine ecohydrology model of Darwin Harbour, Australia,” in The Environment in Asia Pacific Harbours, ed E. Wolanski (Dordrecht: Springer), 477–488.
Woodroffe, C. D., Mulrennan, M. E., and Chappell, J. (1993). Estuarine infill and coastal progradation, southern van diemen gulf, northern Australia. Sediment. Geol. 83, 257–275. doi: 10.1016/0037-0738(93)90016-X
Yamashita, Y., Nosaka, Y., Suzuki, K., Ogawa, H., Takahashi, K., and Saito, H. (2013). Photobleaching as a factor controlling spectral characteristics of chromophoric dissolved organic matter in open ocean. Biogeosciences 10, 7207–7217. doi: 10.5194/bg-10-7207-2013
Zaneveld, J. R. V., Kitchen, J. C., and Moore, C. (1994). “The scattering error correction of reflecting-tube absorption meters,” in Proceedings of SPIE Ocean Optics XII, ed S. Ackleson (Bergen), 44–55.
Zhu, Z. Y., Zhang, J., Wu, Y., and Lin, J. (2006). Bulk particulate organic carbon in the East China Sea: tidal influence and bottom transport. Prog. Oceanogr. 69, 37–60. doi: 10.1016/j.pocean.2006.02.014
Keywords: coastal waters, tropical waters, Northern Australia, optical properties, water quality, seasonal variability
Citation: Blondeau-Patissier D, Schroeder T, Clementson LA, Brando VE, Purcell D, Ford P, Williams DK, Doxaran D, Anstee J, Thapar N and Tovar-Valencia M (2017) Bio-Optical Properties of Two Neigboring Coastal Regions of Tropical Northern Australia: The Van Diemen Gulf and Darwin Harbour. Front. Mar. Sci. 4:114. doi: 10.3389/fmars.2017.00114
Received: 01 December 2016; Accepted: 10 April 2017;
Published: 15 May 2017.
Edited by:
Tiit Kutser, Estonian Marine Institute, University of Tartu, EstoniaCopyright © 2017 Blondeau-Patissier, Schroeder, Clementson, Brando, Purcell, Ford, Williams, Doxaran, Anstee, Thapar and Tovar-Valencia. This is an open-access article distributed under the terms of the Creative Commons Attribution License (CC BY). The use, distribution or reproduction in other forums is permitted, provided the original author(s) or licensor are credited and that the original publication in this journal is cited, in accordance with accepted academic practice. No use, distribution or reproduction is permitted which does not comply with these terms.
*Correspondence: David Blondeau-Patissier, david.blondeau-patissier@csiro.au