Model Simulations of a Mesocosm Experiment Investigating the Response of a Low Nutrient Low Chlorophyll (LNLC) Marine Ecosystem to Atmospheric Deposition Events
 Kostas P. Tsiaras1*
  Sylvia Christodoulaki2,3
  George Petihakis2 Constantin Frangoulis2 George Triantafyllou1
- 1Institute of Oceanography, Hellenic Centre for Marine Research, Anavyssos, Greece
- 2Institute of Oceanography, Hellenic Centre for Marine Research, Heraklion, Greece
- 3Department of Chemistry, University of Crete, Heraklion, Greece
Atmospheric deposition of nitrogen and phosphorus represents an important source of nutrients, enhancing the marine productivity in oligotrophic areas, e.g., the Mediterranean. A comprehensive biogeochemical model (ERSEM) was setup and customized to simulate a mesocosm experiment, where dissolved inorganic nitrogen and phosphorus by means of atmospheric dust (single addition/SA and repetitive addition/RA in three successive doses) was added in controlled tanks and compared with a control (blank), all with Cretan Sea (Eastern Mediterranean) water. Observations on almost all components of the pelagic ecosystem in a ten-day period allowed investigating the effect of atmospheric deposition and the pathways of the added nutrients. The model was able to reasonably capture the observed variability of different ecosystem components and reproduce the main features of the experiment. An enhancement of primary production and phytoplankton biomass with added nutrients was simulated, in agreement with observations. A significant increase of bacterial production was also reproduced, while the model underestimated the observed increase and variability in bacterial biomass, but this deviation could be partly removed considering a lower carbon conversion factor from cell abundance data. A slightly stronger overall response was simulated with the single dust addition, compared to the repetitive that showed a few days delay. The simulated carbon pathways indicated that nutrient additions did not modify the microbial food web structure, but just increased its trophic status. Changes in model assumptions and parameter set that were necessary to reproduce the observed variability in the mesocosm experiment were discussed through a series of sensitivity simulations. Bacterial production was assumed to be mostly affected by the in situ produced labile organic matter, while it was further stimulated by the addition of inorganic nutrients, adopting a function of external nutrient concentrations for bacteria nutrient limitation. The effective increase in phytoplankton nutrient uptake rate was necessary, in order to reproduce the observed primary production, under such low nutrient concentrations, as also the increase of the grazers growth rate. The model was thus tuned to better work under very low nutrient concentrations, such as those found in the Eastern Mediterranean.
Introduction
The atmospheric deposition of trace elements in the marine environment plays a major role in low-nutrient low-chlorophyll (LNLC) regions, such as the Mediterranean Sea (Jickells et al., 2005; Krom et al., 2010). Particularly the deposition of nitrogen (mainly nitrate and ammonium) and phosphorus (phosphate) represents an important source of essential nutrients for the growth of phytoplankton and bacteria, enhancing the marine productivity in these oligotrophic areas (Christodoulaki et al., 2013). The Mediterranean Sea is of particular interest for both its marine and atmospheric environment. Especially the Eastern Mediterranean sub-basin is characterized by very low nutrient levels and is globally one of the least productive seas (Azov, 1991; Krom et al., 1991, 2004; Thingstad and Rassoulzadegan, 1995; Bethoux et al., 1998; Crise et al., 1999; Van Wambeke et al., 2002). Moreover, the Mediterranean atmosphere, characterized by high photochemical activity, is a crossroad for air masses of distinct origin, affected by both natural and anthropogenic emissions that interact chemically, leading to the formation of nutrients, such as nitrogen compounds (Vrekoussis et al., 2006; Finlayson-Pitts, 2009). Dust aerosols, transported from the African continent in the form of non-continuous dust pulses over the Mediterranean atmosphere, are also affecting the area as carriers of nutrients, such as iron (Fe) and phosphorus (P) (Gallisai et al., 2014). Interaction of these aerosols with acid gasses from anthropogenic sources causes reduced pH and increases the fraction of bioavailable Fe and P in the dust laden air masses (Nenes et al., 2011).
There are very few studies investigating the effect of dust additions in the Mediterranean Sea experimentally. Previous efforts based on mesoscale field studies in the frame of ADIOS European Program (Heussner et al., 2003), as well as microcosms experiments (e.g., Herut et al., 2005) in the Eastern Mediterranean, have examined the biogeochemical response of Mediterranean waters to atmospheric deposition and its fate in different ecosystem compartments, but an accurate understanding of the ecosystem dynamics and the underlying biogeochemical processes is still lacking. Recently, a holistic approach was attempted for the Western Mediterranean oligotrophic marine waters, through two mesocosm experiments (DUNE 2008 and 2010, Guieu et al., 2014), with no explicit description of the fate and impact of dust constituents onto surface seawater biochemistry, with some exceptions (Laghdass et al., 2011; Giovagnetti et al., 2013; Pulido-Villena et al., 2014; Ridame et al., 2014).
In May 2014, a mesocosm experiment was carried out at the HCMR facilities to understand the complex ecosystem functioning in the Eastern Mediterranean Sea and the effect of atmospheric aerosol deposition. Ambient atmospheric dust samples were added in a number of controlled tanks previously filled with subsurface water from the Cretan Sea. These treatments with additions of primary limiting nutrients (phosphate, nitrate), in the form of environmental dust, were compared with a control (blank), allowing to investigate the effect of the atmosphere on the Mediterranean marine system and the pathways of these added nutrients in the pelagic ecosystem. This experiment is a holistic studying approach of atmosphere-ocean as a single system, for the Eastern Mediterranean Sea.
Biogeochemical processes and interactions between living and non-living components of the ecosystem are difficult to describe and understand using observations alone, as these provide static distributions of the ecosystem components, but cannot capture the dynamics lying underneath the rates and processes controlling these distributions (e.g., Fennel and Neumann, 2004). Biogeochemical models are particularly useful in providing a better understanding of these dynamics and complete missing data in a dynamically consistent way. Moreover, models can be used to test and efficiently analyze the relative importance of different factors and processes of the ecosystem.
Mesocosm experiments are of particular significance, as they may offer frequent observations of various ecosystem components from sea water samples, under controlled environmental conditions, providing adequate information to increase our understanding of the marine ecosystem functioning. These observations can also be used to test thoroughly and validate biogeochemical models. Implementing ecological models to study the dynamics of mesocosms has been successful in many instances (Watts and Bigg, 2001, and references therein).
In the present study, for the first time to our knowledge, a mesocosm experiment is combined with a marine biogeochemical model to investigate the effect of atmospheric aerosol deposition, as source of inorganic nutrients (nitrogen and phosphorus), on the Cretan Sea (Eastern Mediterranean) marine productivity, and ecosystem functioning. The results from the mesocosm experiment are used to analyze the marine ecosystem processes, triggered by the atmospheric aerosol deposition, enabling the integration and parameterization of these processes into the marine biogeochemical model. After the necessary tuning and validation, the model is used to improve our understanding of the ecosystem response to nutrient additions, describing the nutrient uptake by organisms, the triggered food web interactions and how these are translated regarding carbon and nutrient fluxes.
In section Materials and methods, a brief description of the biogeochemical model and the mesocosm experimental setup is provided. In section Reference simulation, the model results, simulating the mesocosm experiment, are presented in conjunction with the observations, investigating the effect of atmospheric deposition on productivity and ecosystem dynamics. In section Model sensitivity simulations, model modifications, necessary in order to reproduce the observed variability in the mesocosm treatments and the model sensitivity to different parameters are discussed, through a series of sensitivity simulations.
Materials and Methods
Model Description/Setup
A 0-D biogeochemical model was developed to simulate the evolution and dynamics of the pelagic marine ecosystem, as this was observed in the mesocosm experiment within a 10-day period. The model is based on the European Regional Seas Ecosystem Model (ERSEM, Baretta et al., 1995), a generic comprehensive model that has been successfully implemented across a wide range of coastal and open ocean ecosystems, including the Mediterranean (Allen et al., 2002; Petihakis et al., 2002, 2015; Tsiaras et al., 2014). ERSEM follows a functional group approach, describing the marine ecosystem with different groups based on their functional role and size classes. The pelagic plankton food web (see Figure 1) is described by four phytoplankton groups (diatoms, nanophytoplankton, picophytoplankton, dinoflagellates), bacteria and three zooplankton groups (heterotrophic nanoflagellates/HNAN, microzooplankton, and mesozooplankton). A schematic diagram of the model trophic interactions among different groups is shown in Figure 1. The pelagic model also includes particulate and dissolved organic matter (produced by the mortality, excretion and lysis of primary and secondary producers, and utilized by bacteria), along with dissolved inorganic nutrients (nitrate, ammonia, phosphate, silicate). Each plankton group has dynamically varying C/N/P pools and carbon dynamics are loosely coupled to the dynamics of nitrogen and phosphorus. The uptake of dissolved inorganic nutrients by phytoplankton is regulated based on the difference between external and internal nutrient pools, following a Droop kinetics formulation (Droop, 1974). The model configuration and parameter set have been adopted from Petihakis et al. (2002). The initial food web matrix and plankton maximum growth rates were slightly modified by Tsiaras et al. (2014), while the bacteria sub-model has also been revised (Petihakis et al., 2015) from the one in Petihakis et al. (2002), allowing for a more realistic representation of the dissolved organic matter (DOM) pool. In the present study, a few additional changes in the model parameter set and formulations were needed, as further hereafter described, to achieve a better fit of the model simulations with in situ measurements from the mesocosm experiment. The model parameter values are given in Supplementary Material (Tables A1–A3 in Supplementary Material), while the attributes of sensitivity model simulations are shown in Table 1.
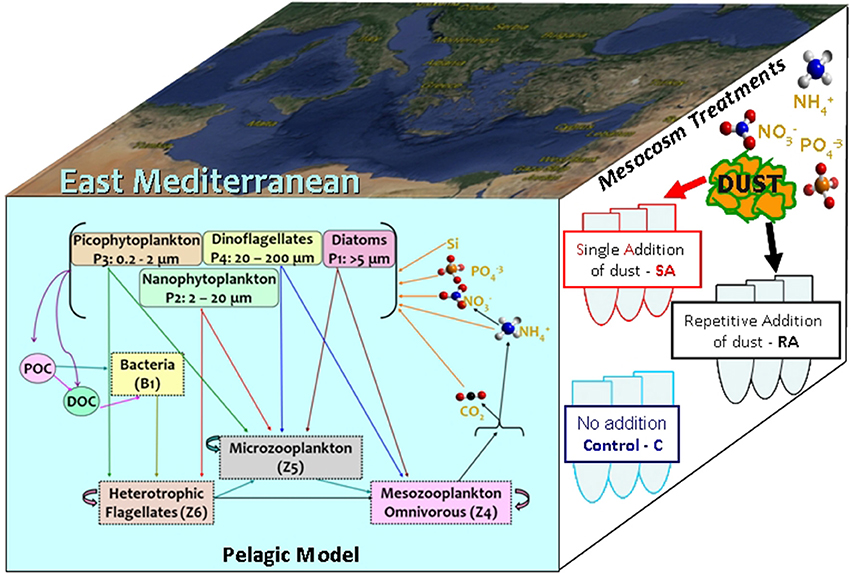
Figure 1. Model schematic indicating the plankton food web interactions. A schematic of the mesocosm treatments and the study area are also shown.
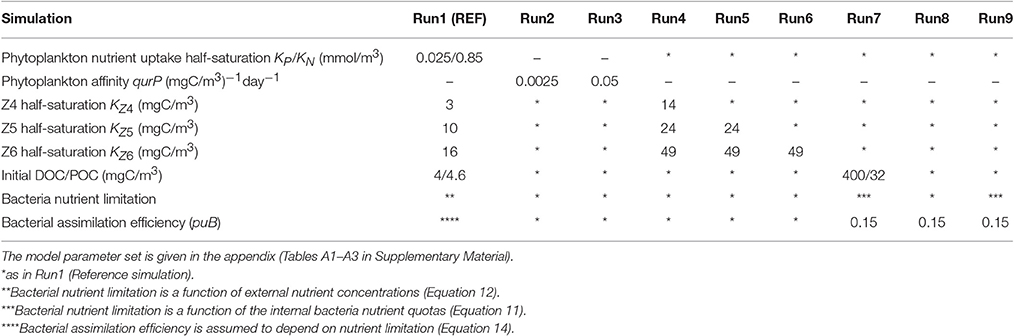
Table 1. Attributes of model simulations.
A constant temperature (20°C) was adopted in the model, equal to the one measured on the mesocosm tanks. Light conditions were assumed to be those of the ambient water in the area of the collected samples, while settling velocity for particulate organic matter was assumed close to zero, as continuous stirring was applied in the mesocosm tanks. Dissolved inorganic nutrients and biomasses of different plankton groups were initialized taking the average of three replicate measurements of the mesocosm water samples prior to the addition of dust. Initial dissolved (DOM) and particulate (POM) organic matter constituents (carbon, nitrogen, phosphorus) were also based on the measurements, but adopting much lower initial DOM/POM concentrations, representing the most labile fraction of organic matter, resulted in a significantly better agreement of the simulated bacteria variability with observations, as discussed below. Three simulations were performed, mimicking the mesocosm treatments (for mesocosm setup and experimental design see below section Model sensitivity simulations and Pitta et al., 2017): (a) Control, without any addition of dust, (b) Single Addition (SA), adding the amount of phosphate and nitrate corresponding to the total amount of dust (4 g), added in the beginning of the experiment, and (c) Repetitive Addition (RA), where the total amount of phosphate and nitrate was portioned (1+2+1 = 4 g dust) and added in the first 3 days of the experiment. The initial phosphate and nitrate of the control experiment were practically increased by 30 and 100% respectively in the SA and RA (in three portions) experiments.
Mesocosm Experiment Data
The experiment was performed between the 10 and 19th May 2014, using 9 mesocosms of 3 m3, filled with subsurface seawater (10 m depth) collected ~5 nm north of Heraklion, Greece. Details of water collection and transfer, as well as of mesocosm's filling can be found in Pitta et al. (2017). The mesocosms were submerged in a 150 m3 concrete tank, with running sea surface water that kept the mesocosms at 20.2 ± 0.3°C throughout the experiment. Three mesocosms received 4 g of Saharan dust as a single addition (SA), three others received three consecutive additions (1, 2, 1 g of Saharan dust) on the first 3 days (repetitive addition, RA) and finally, three mesocosms were kept without any addition as control (C). The repetitive addition was found a reasonable practical choice within the limited time frame of the experiment in order to mimic the recurrence pattern of Saharan dust events in the Eastern Mediterranean, where successive dust deposition events may occur over a period of several days (Gaetani and Pasqui, 2014; Lagaria et al., 2017). SA and RA treatments had a final dust concentration of 1.3 mg L−1. Water sampling from the mesocosms was made in order to determine: (a) inorganic nutrients, dissolved organic nitrogen, particulate and total organic carbon, size fractionated Chl-a, viruses, bacteria, Prochlorococcus, Synechococcus, picoeukaryotes (autotrophic and heterotrophic), bacterial production, primary production (approximately daily), (b) nanoflagellates (autotrophic and heterotrophic), dinoflagellates (autotrophic and mixotrophic), ciliates (heterotrophic and mixotrophic), diatoms, coccolithophores (approximately every other day), and (c) metazoans (at the start and end of the experiment). Details on sampling and analysis protocols of these parameters, as well as the literature carbon conversion factors used to convert raw biological data to carbon can be found in Pitta et al. (2017) and Lagaria et al. (2017). Most of the measured plankton variables mentioned above (except bacteria and diatoms) did not have a direct correspondence with the model's state variables (see Figure 1). To create a correspondence, some variables had to be split into subgroups based on their size (e.g., dinoflagellates >20 μm and dinoflagellates <20 μm) and/or trophic functioning (e.g., autotrophic and heterotrophic nanoflagellates). These size and trophic sub-divisions were made by the scientists that provided the data. In the measured plankton samples, some mixotrophic organisms were identified. Larger size (>20 μm) mixotrophs biomass was very small, while smaller size (<20 μm) mixotrophs biomass was comparable to autotrophic nanophytoplankton (~40% on average) and much lower (~20% on average) than picophytoplankton. Model simulations showed that including mixotrophs as part of nanophytoplankton did not have a noticeable effect on dissolved inorganic nutrients and other plankton groups simulated evolution. Therefore, it was decided to exclude mixotrophs in the model-data correspondence to avoid unnecessary complexity in the model analysis, since this particular type of organism is currently not represented in the model's functional groups.
Results
Reference Simulation
Comparison with Data/Effect of Dust Addition
In Figure 2, the model simulated results are shown against the observations for the three mesocosm treatments (control without any addition of dust, single addition/SA and repetitive addition/RA). These include dissolved inorganic nutrients, Chlorophyll-a (Chl-a), net primary production, biomass of picophytoplankton and nanophytoplankton that represents more than 93% of the total phytoplankton, bacterial production and biomass, as well as the biomass of heterotrophic nanoflagellates (HNAN), microzooplankton and mesozooplankton.
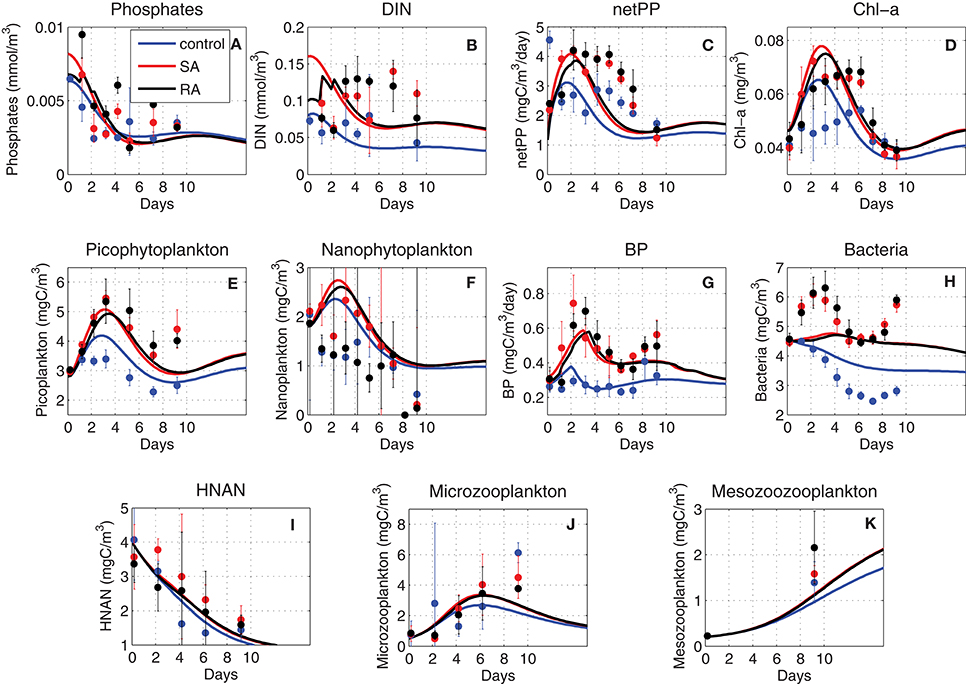
Figure 2. Model simulated (A) phosphate (mmol/m3), (B) dissolved inorganic nitrogen (DIN, mmol/m3), (C) net primary production (netPP, mgC/m3/day), (D) Chl-a (mg/m3), (E) picophytoplankton biomass (mgC/m3), (F) nanophytoplankton biomass (mgC/m3), (G) bacterial production (BP, mgC/m3/day), (H) bacteria biomass (mgC/m3), and (I) HNAN biomass (mgC/m3), (J) microzooplankton biomass (mgC/m3), (K) mesozooplankton biomass (mgC/m3), for the three (Control = blue line, Single Addition/SA = red line and Repetitive Addition/RA = black line) treatments, against observations. The standard deviation of measurements from three replicates is indicated.
As expected, the dust addition in SA and RA treatments provoked an increase in both dissolved inorganic nitrogen (DIN = nitrate + ammonium) and phosphorus (phosphate, PO4) observed concentrations (Figures 2A,B), as compared to the control experiment. This difference was larger for DIN, as the amount of nitrogen added with the dust is much higher (+100% of the initial DIN concentration) compared to phosphorus (+30% of the initial PO4 concentration). A decreasing trend can be seen for the observed DIN concentration of the control treatment and particularly for PO4 (all treatments), which is related to the nutrient uptake by phytoplankton and bacteria. Interestingly, the measured DIN concentration in the addition treatments shows an increasing trend, suggesting a potential nitrogen excess due to a stronger phosphorus limitation. The model captured the observed decreasing trend of PO4 and control DIN concentration, but with slightly lower concentrations by day-10 (Figures 2A,B). The higher increase in DIN (as compared to PO4) in the addition treatments (SA/RA) was also simulated. However, the observed increasing trend of DIN in SA/RA was not simulated, even though an increasing DIN/DIP ratio from ~13 on day-1, indicative of nitrogen and phosphorus co-limitation, to ~35 on day-10, suggesting a stronger phosphorus limitation, was simulated (not shown) in agreement with the observations. One can also notice that the model PO4 in the addition treatments presented a slightly stronger decrease after day-5, as compared to the control, which can be explained by the larger nutrient uptake from the increased phytoplankton biomass (Figures 2E,F), resulted from the nutrient enrichment by the dust additions. This stronger simulated decrease in PO4 led to a slightly lower mean PO4 in SA/RA over the 10-day period (Figure 3), in contrast with the observations that show an overall PO4 increase in the addition treatments. We should note, however, that the observed PO4 in the control treatment appears occasionally (day-5, -9) higher than SA/RA after day-4, which is in agreement with the model results.
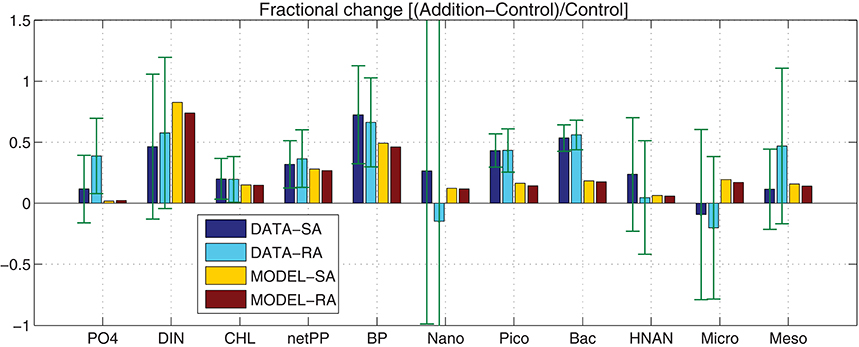
Figure 3. Model simulated (MODEL-SA, MODEL-RA) and observed (DATA-SA, DATA-RA) mean fractional change [(Addition − Control)/Control] for phosphate, DIN, Chl-a, net primary production (netPP), bacterial production (BP), biomass of nanophytoplankton (Nano), picophytoplankton (Pico), bacteria (Bac), HNAN, microzooplankton (Micro), and mesozooplankton (Meso). The standard deviation in the observed fractional change is indicated. This was computed using the 10-day average of the mean (μ) and standard deviation (σ) from the three replicate measurements of the Addition (A) and Control (C) treatments as: (Stuart and Ord, 1998).
Following the enrichment with dissolved inorganic nutrients, the simulated net primary production (netPP) appears enhanced in the dust addition treatments (Figure 2C), in agreement with the observations, even though their simulated decline starts a bit sooner (~day-3) compared to the observed (~day-6). The overall 10-day simulated increase in netPP in SA/RA (~+25%) is slightly smaller than the observed one (Figure 3). The SA netPP presents a slightly higher increase, as compared to RA, in the model simulation. This result seems reasonable, considering that in SA, added nutrients are available to phytoplankton from the start of the experiment, giving more time to stimulate the production of biomass, as compared to RA, where the same added amount is portioned on a 3-day period. Interestingly, the observations show the opposite, with RA showing a slightly higher overall increase of primary production, as compared to SA. The observed difference between SA and RA, however, might be considered relatively small (<10%, Figure 3), considering their standard deviation (from the three replicates), making it difficult to conclude safely that RA presents a higher production.
The simulated evolution of picophytoplankton biomass, showing a peak at ~day-3 and a secondary increase after day-8 that is mostly related to the decrease of its predator, HNAN (Figure 2I), is in good agreement with the observations, except a slight overestimation in the control treatment (Figure 2E). Both observations and model results show a higher picophytoplankton biomass in SA/RA treatments. The simulated nanophytoplankton biomass appears slightly overestimated (Figure 2F), showing a similar pattern to picophytoplankton, but with a slightly steeper decline after day-3, which may be attributed to the predation pressure exerted by increasing microzooplankton (Figure 2J). The same pattern is depicted from observations in the SA experiment. The observed evolution of nanophytoplankton biomass appears less clear in the control and RA experiments, with the latter showing the lowest biomass values. The observed Chl-a, dominated by picophytoplankton (Lagaria et al., 2017), is reasonably well-reproduced by the model, except an overestimation in the control treatment and a slight time-lag of its peak (Figure 2D). This deviation might be related to the observed time variability of phytoplankton Chl-a:C ratio, showing higher values between day-4 and -8, in the control treatment (Lagaria et al., 2017), which explains the measured Chl-a increase during this period. This observed variability cannot be captured by the model, which adopts a fixed Chl-a:C ratio.
The observed bacterial production (BP) presented a significant increase in the addition treatments, showing peaks between day-2 (SA) and day-3 (RA), a decline on day-6 and an increasing trend afterward (Figure 2G). The same growing trend at the end could also be seen in the control BP that was otherwise relatively constant until day-7. A similar pattern was followed by the observed bacterial biomass, except for an initial decrease in the control, until day-7 (Figure 2H). Therefore, bacterial production and biomass appeared closely coupled to phytoplankton biomass, particularly picophytoplankton that showed a very similar evolution. This was to a point expected, as both picophytoplankton and bacteria are prey for HNAN. As the latter decreased throughout the 10-day period (Figure 2I), its predation on picophytoplankton and bacteria was relaxed, allowing for their biomass increase at the end of the experiment. This top-down control, however, cannot explain the significant stimulation of BP in SA/RA that appeared to drive also the bacterial biomass increase. Another strong coupling mechanism is the production of dissolved organic carbon by phytoplankton that bacteria rely on for their growth. As later discussed in the model sensitivity section, on the short time scale (~days) of the experiment, one may assume that bacterial production is mostly affected by the labile organic matter in situ produced/excreted by plankton, rather than the semi-labile organic carbon that is decomposed on a longer time-scale. The increase in phytoplankton due to the nutrient enrichment with dust additions may thus explain the observed increase in BP. Under the assumption of bacteria utilizing mainly in situ produced dissolved organic carbon (see later discussion in section Bacterial dynamics), the model was able to reproduce the observed BP variability and particularly its increase in SA/RA experiments (Figure 2G). An overall BP increase of about +40% was simulated in SA/RA relative to the control, which was slightly smaller, as compared to the observed increase (+65%) in BP (Figure 3). The simulated bacterial biomass has a similar pattern with the observed, but shows a much weaker variability (Figure 2H). We should note however that the observed bacterial biomass initial increase (~1 mgC/m3/day) would probably require about twice the observed BP (~0.5 mgC/m3/day), even ignoring bacteria mortality and predation losses. This suggests that the conversion factor (20 mgC/cell, Lee and Fuhrman, 1987) used to calculate carbon biomass from bacteria cell abundance might be a bit overestimated. Indeed, the bacteria variability was much better reproduced by the model (not shown), when the observed bacteria biomass (and its initial value used in the model simulations) was decreased by some factor.
The model reasonably captured the evolution of other heterotrophs (HNAN, microzooplankton, mesozooplankton). A continuous decrease in HNAN with time was simulated in agreement with the observations (Figure 2I). The model HNAN was slightly higher in SA/RA, as compared to the control, while observations suggested a stronger HNAN overall increase in SA (Figure 3). The observed increase in both microzooplankton and mesozooplankton was well-reproduced by the model that also simulated a decrease of microzooplankton mainly after the end of the experiment, related to the predation by mesozooplankton (Figure 2J). Again, as in most cases, the model simulated an overall higher biomass in SA, followed by RA, for both microzooplankton and mesozooplankton (Figure 3).
In order to investigate the overall effect of the dust addition in the two different treatments, both in terms of observations (DATA-SA & DATA-RA) and model simulations (MODEL-SA & MODEL-RA), the fractional change of the Addition with respect to the Control treatment [(Addition − Control)/Control] was computed (Figure 3). Considering the standard deviation from the three replicates, overall there are no significant differences in the observations between the single (SA) and repetitive (RA) addition treatments, both showing a positive change, with the exception of nanophytoplankton, where the repetitive addition results in a negative fractional change in contrast to the single addition, which is positive and microzooplankton that shows a negative change in both SA/RA. In contrast with the observations, the model results show a positive change in all cases. The model produces a smaller positive change for autotrophs, bacteria and grazers, compared to the observations, with the exception of HNAN in RA, showing a slightly higher positive change than the observed.
The model skill in reproducing the observed variability (Figure 2) for different variables may be graphically summarized in a quantitative way using taylor (Taylor, 2001) and target (Jolliff et al., 2009) diagrams (Figure 4). In the taylor diagram, one can see the model skill for different variables regarding correlation, standard deviation (as an index of variability) and RMS error against the observations, while the target diagram also indicates the model bias and unbiased RMS error. From the two diagrams, one can identify some model variables (mesozooplankton, PO4, Chl-a) presenting relatively good scores in all skill indexes (correlation r > 0.6, STD ~1, BIAS < 0.5). Nanophytoplankton presents a good correlation (r ~0.7) and the correct variability (STD ~0.8), but is slightly biased, as indicated in the target diagram. Picophytoplankton, bacterial production and biomass show good correlation and bias scores, but have relatively small variability, particularly the bacterial biomass. Net primary production is a bit out of phase with the observed one (Figure 2C), which results in its poor correlation and RMS error. DIN appears with a slightly negative correlation, as the model fails to capture the observed increasing trend at the end of the experiments (Figure 2B).
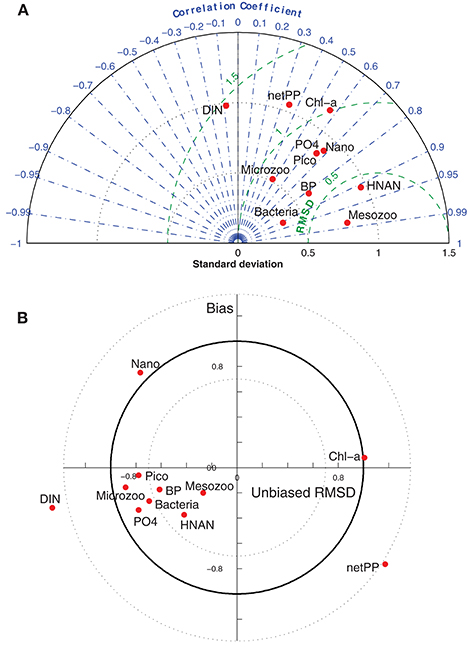
Figure 4. (A) Taylor and (B) target diagrams indicating the correlation coefficient, standard deviation (STD), RMS error and the model bias (Bias), unbiased RMS error respectively, for model simulated PO4, DIN, Chl-a, net primary production (netPP), bacterial production (BP), and biomass of nanophytoplankton (Nano), picophytoplankton (Pico), bacteria, HNAN, microzooplankton (Microzoo), and mesozooplankton (Mesozoo) from all treatments against available observations. Both diagrams are normalized by the standard deviation of the observed data (e.g., STD = 1 means that the model has the same standard deviation with data).
Carbon Fluxes/Fate of Added Nitrogen and Phosphorus
Models are excellent tools in exploring processes which are difficult or impossible to monitor and measure in the field. To investigate the impact of nutrient additions in terms of carbon flows within the food web and the possible differences between the two addition treatments, the corresponding carbon fluxes and their fractional change [(Addition − Control)/Control] were computed (Figure 5). In most cases, there was an initial increase in the carbon fluxes, followed by a gentler decrease. Slightly different from the dominant evolution, is the continuously decreasing flux from bacteria to heterotrophic nanoflagellates (B1Z6), related to the decreasing biomass of both Z6 and bacteria (Figure 2), while the flux from microzooplankton to the higher predator of the food web, mesozooplankton (Z5Z4) followed an increasing trend. Overall, in both treatments, there was an increase in the carbon flux from prey to predator but depending on the time scale of the process, this increase settled back to normal (in this case the control run) toward the end of the period. Smaller heterotrophs reacted faster to the dust addition, taking advantage of their relatively higher growth rates and the increasing abundance of their prey (P2Z6, P3Z6), followed by bigger animals such as microzooplankton (P2Z5, P3Z5, Z6Z5), while the 10 days experimental period did not seem to be enough for the biggest ones (mesozooplankton) to converge to the control. In all cases, the single addition treatment resulted in a small but visible initially higher carbon flux, converging after day 4 or 5 with the repeated addition treatment, which seemed to have a couple of days delay. The same dominant trend (initial increase, more gradual decrease) was visible in the fractional change of fluxes from phytoplankton to heterotrophs (P2Z5, P2Z6, P3Z5, P3Z6). This was maximized before day-5 at around +50%, with a small time-lag between SA and RA, before these started settling back to the control. This was not the case for bacteria (B1Z6) and mesozooplankton (Z5Z4), where SA/RA did not appear to converge back to the control.
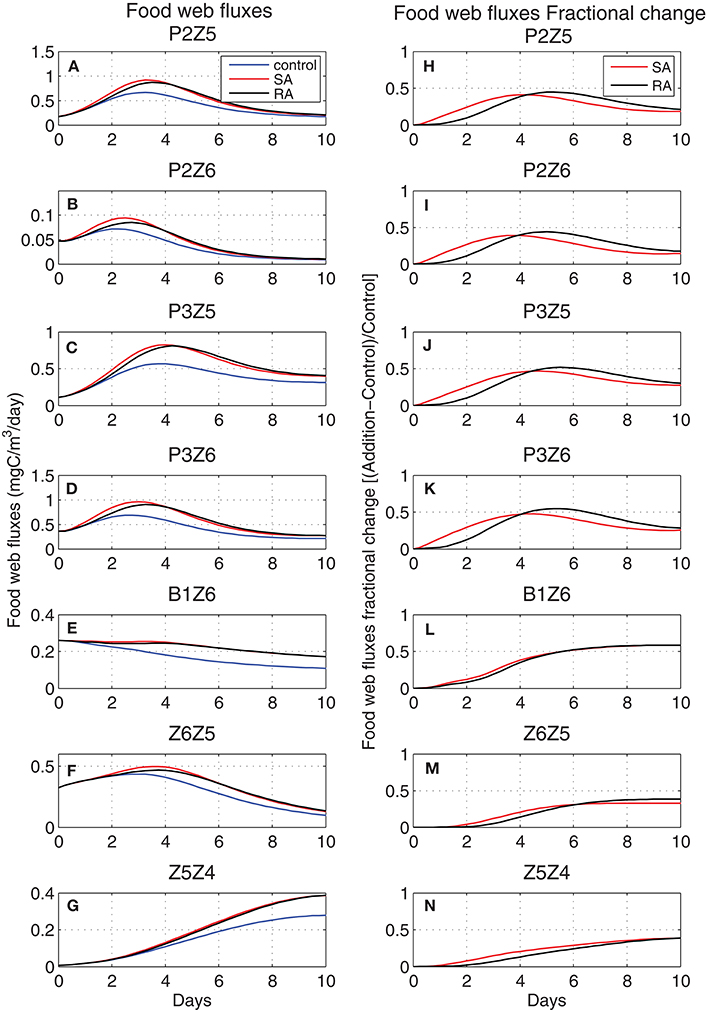
Figure 5. Evolution of food web carbon fluxes (left, mgC/m3/day) for (A) P2Z5, (B) P2Z6, (C) P3Z5, (D) P3Z6, (E) B1Z6, (F) Z6Z5, (G) Z5Z4 in Control (blue line) and Addition (SA red line, RA black line) treatments and respectively their fractional change [(Addition − Control)/Control] (right) (H–N). P2, nanophytoplankton; P3, picophytoplankton; B1, bacteria; Z6, HNAN; Z5, microzooplankton; Z4, mesozooplankton (see Figure 1).
From the mean food web fluxes (Figure 6), model results showed that most of the carbon flowed from small phytoplankton and in particular from picophytoplankton (P3) to the smaller heterotrophs (Z6 & Z5). Although mean fluxes in the addition treatments were higher compared to the control run, there was no change in the pattern. This supports the argument that the dust addition has not modified the food web structure i.e., causing a shift from a microbial food web to a more classical food web, dominated by large phytoplankton-zooplankton, but just increased the trophic status (less oligotrophic), with more carbon circulating in the entire food web. Thus, the increase of different fluxes (SA/RA-Control, Figure 6) appears proportional to each flux magnitude. The two major pathways of carbon, further stimulated by the dust additions, were those from the photosynthetic P3 and bacteria to the smallest heterotrophic nanoflagellates (P3Z6, BZ6), and the second and greater channel from the small phytoplankton to microzooplankton (P2Z5 & P3Z5). Besides these two main channels, smaller pathways were the predation processes within the zooplankton groups (Z6Z5, Z6Z4, Z5Z4).
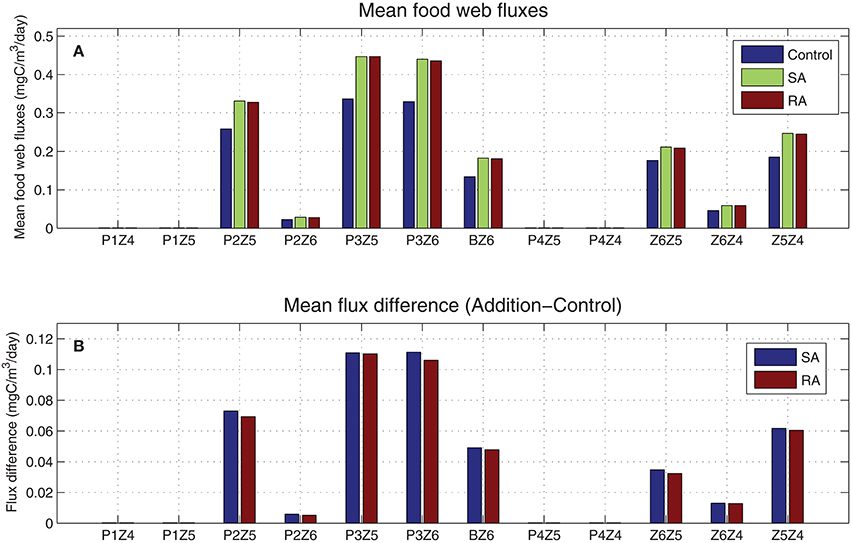
Figure 6. (A) Simulated mean food web carbon fluxes for addition (SA/RA) and control treatments (mgC/m3/day) and (B) their difference (SA/RA-Control). P1, diatoms; P2, nanophytoplankton; P3, picophytoplankton; P4, dinoflagellates; B, bacteria; Z6, HNAN; Z5, microzooplankton; Z4, mesozooplankton (see Figure 1).
To investigate the fate of the added nitrogen and phosphorus, the evolution of the (Addition − Control) difference in different nitrogen and phosphorus pools (dissolved inorganic, particulate and dissolved organic, phytoplankton, bacteria, and zooplankton) was computed (Figure 7). This nicely illustrates the transfer of added nitrogen/phosphorus as this passed from one pool to the other. Initially the difference was zero in all pools except for the dissolved inorganic (PO4, DIN). These were quickly reduced, taken up by phytoplankton, which was the first to increase, showing a peak on day-3 and decreasing afterward due to nutrient limitation and predation by zooplankton. Nitrogen and phosphorus were then directed to zooplankton that followed phytoplankton with a time-lag (~4 days). Bacteria, stimulated by the organic matter produced by phytoplankton/zooplankton, also took a major part of nitrogen and phosphorus pools, consuming dissolved organic nitrogen and phosphorus that appear to decrease. Particulate organic pools were initially reduced, being smaller in the addition treatments, as phytoplankton mortality is a function of nutrient limitation. After day-3 they gradually built up from mortality losses of all plankton groups. At the end of the 20-day period, some of the phosphorus pools (PO4, phytoplankton-P DOP, bacteria) appeared to be settling back to the control (Addition − Control = 0), with the added phosphorus remaining mostly in the form of POP and zooplankton-P. For nitrogen, the largest pool remained in the form of DIN, given its excess over DIP (DIN/DIP ~35), with the increase of phytoplankton-N pool being related to luxury uptake. The other pools (bacteria, PON, zooplankton-N) followed a similar pattern as in phosphorus.
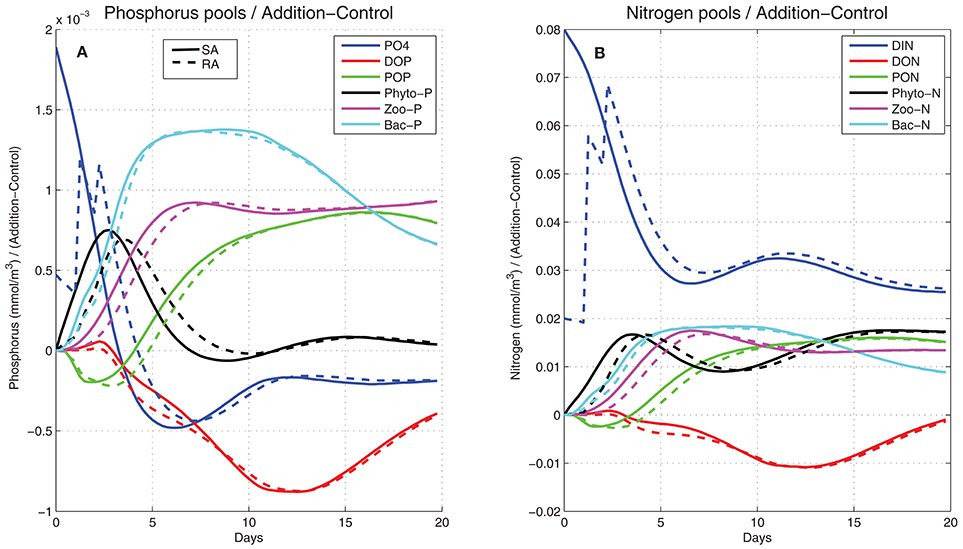
Figure 7. Simulated difference between the addition (SA, continuous line; RA dashed line) and control treatments in (A) phosphorus and (B) nitrogen pools (mmol/m3) in the form of dissolved inorganic (blue line), dissolved organic (red line), particulate organic (green line), phytoplankton (black line), zooplankton (magenta line), and bacteria (cyan line).
Model Sensitivity Simulations
A few changes in the model parameter set and formulations were needed, before this could capture the observed variability in the mesocosm experiment. These changes in the model are discussed below through a series of sensitivity experiments related to three main model components: (a) phytoplankton (nutrient uptake rates and formulation), (b) zooplankton (grazing half-saturation parameter values), and (c) bacteria (initial DOM pool, bacteria nutrient limitation, bacterial efficiency).
Phytoplankton/Nutrient Uptake
In ERSEM, the nutrient uptake is constrained by a maximum uptake rate (V0) that depends on the dissolved inorganic nutrients external concentration and phytoplankton affinity. In the case of phosphorus uptake (PO4) this is:
with qurP being the specific affinity for phosphorus uptake (Table A1 in Supplementary Material), while this is regulated by the amount of nutrient that is necessary for the cell to address its needs for growth and intracellular storage:
where runP is the phytoplankton net production (photosynthesis-excretion-respiration), qpPmax is the maximum phosphorus internal quota (qpPmax = 2 × Redfield ratio, Table A1 in Supplementary Material) and PhytoC, PhytoP are the carbon and phosphorus phytoplankton pools respectively. The actual nutrient rate is then taken as:
With this formulation and the adopted specific affinity parameter values [qurP = 0.0025 (mgC/m3)−1 day−1], the simulated phytoplankton nutrient uptake was quite low, as V0 (Equation 1) was constrained by the very low initial nutrient concentrations of the mesocosms (~0.005 mmol/m3 PO4, ~0.1 mmol/m3 DIN). This reduced nutrient uptake resulted in a close to zero primary production (Figure 8, Run2), as it quickly leads to a sub-optimal phytoplankton internal stoichiometry that triggered an increased carbon excretion and cell lysis, as adopted in ERSEM formulation (Baretta-Bekker et al., 1997):
where sumP is the carbon uptake, seoPmax is the maximum fraction excreted, sdoP is the lysis rate and Qlim is the Droop nutrient limitation function of internal cell quotas (qpP, qnP), which in the case of phosphorus is:
with qpPmax/qpPmin being the maximum/minimum phosphorus internal quotas.
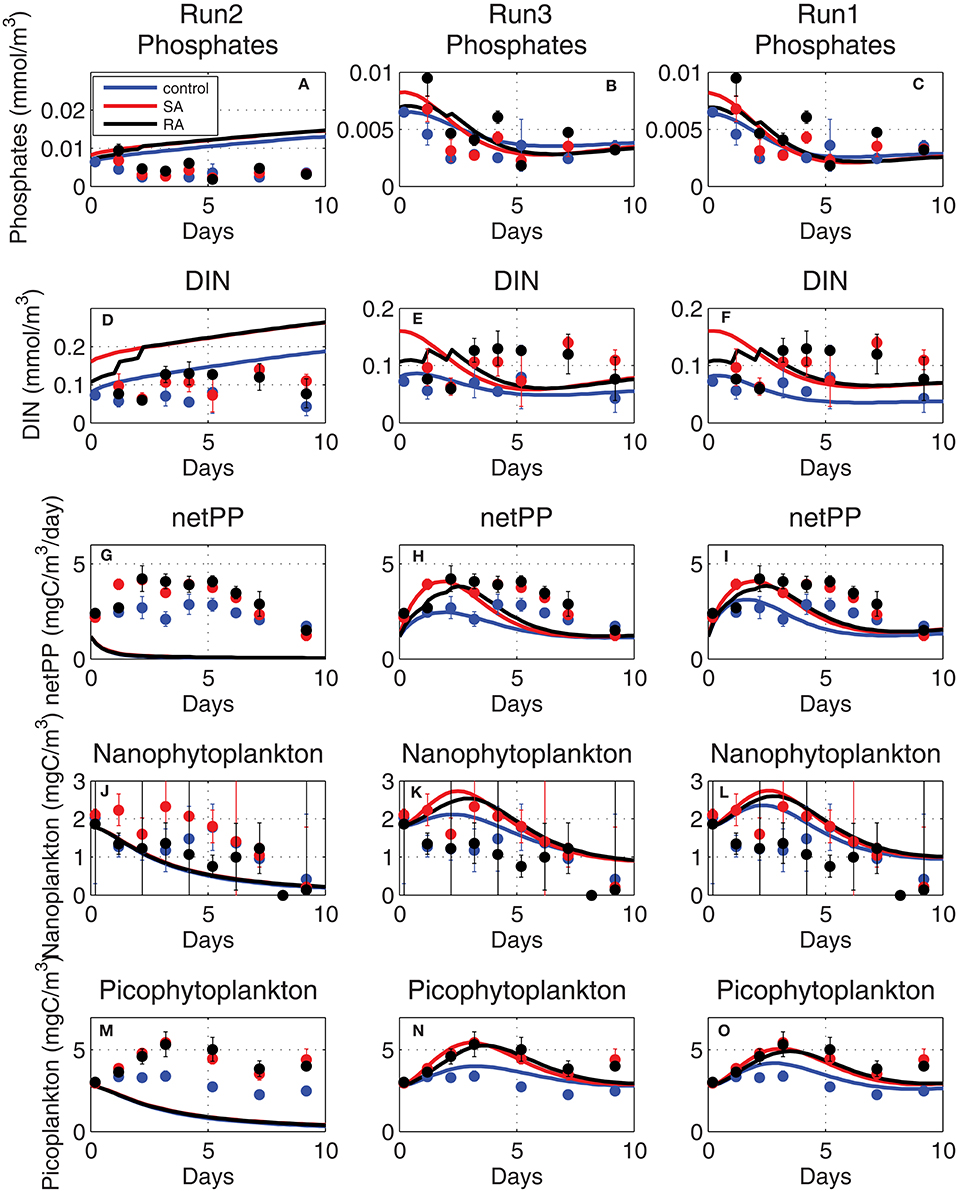
Figure 8. Evolution of (A–C) phosphate (mmol/m3), (D–F) dissolved inorganic nitrogen (DIN, mmol/m3), (G–I) net primary production (netPP, mgC/m3/day), biomass of (J–L) nanophytoplankton (mgC/m3) and (M–O) picophytoplankton (mgC/m3), simulated adopting old phytoplankton affinity (Equation 1, Run2), higher (fitted) affinity (Equation 1, Run3), and with the Michaelis-Menten kinetics (Equation 7, Run1) adopted formulation (see Table 1 for simulations attributes).
In order for simulated net primary production and phytoplankton biomass to approach the observed values in the mesocosm experiment, much higher affinity parameters [qurP × 20 ~0.05 (mgC/m3)−1day−1] were necessary (Figure 8, Run3). An even better agreement of simulated results, particularly in terms of dissolved inorganic nutrients that were slightly reduced toward observations, was found when nutrient uptake rates were assumed to follow the classic Michaelis-Menten kinetics as in Geider et al. (1998):
where sumP is the carbon specific maximum growth rate, qpPred is the Redfield phosphorus quota, Kp is the half-saturation (fitted parameter) for phosphorus uptake and Qmax = (qpPmax − qpP)/(qpPmax − qpPmin), with qpPmax/qpPmin being the maximum/minimum phosphorus internal quotas (see Table A1 in Supplementary Material). Qmax approaches zero when the phytoplankton internal phosphorus quota Q is maximum (= qpPmax), resulting in the decline of nutrient uptake. When Equation (7) was used for nutrient uptake instead of Equation (3), the simulated net primary production better reproduced the observed evolution, showing a slightly more extended peak (Figure 8, Run1), while simulated inorganic nutrients got closer to the slightly lower observed values, particularly for phosphate. This is related to the use of the Michaelis-Menten sigmoid function in Equation (7) that results in a more gradual decrease of nutrient uptake and the steepest decrease of nutrients, as compared to those simulated when the linear function Equation (1) is used.
The phytoplankton affinity, defined as the initial slope of nutrient uptake at very low nutrient concentrations (PO4 + Kp~Kp) can be calculated from Equation (7) as qurP~Vmax/Kp, which gives 0.11 and 0.13 (mgC/m3)−1day−1 for nanophytoplankton and picophytoplankton, respectively. These are slightly higher than the fitted affinity parameters [0.05–0.0625 (mgC/m3)−1day−1] using the original ERSEM formulation and much higher than the previously adopted affinity parameters [0.0025 (mgC/m3)−1day−1].
Zooplankton (Grazing Half-Saturation Parameter)
The prey uptake by Zi zooplankton heterotrophic groups (Z4 = mesozooplankton, Z5 = microzooplankton, Z6 = heterotrophic nanoflagellates, see Figure 1) in ERSEM is described by a Holling-II type function:
where KZi is a half-saturation constant (where the uptake rate is half its maximum value) and is the total available amount of food from different sources:
with suij being the preference of Zi group on different preys Fj and min foodZi another half-saturation constant used to prevent from exhausting a prey food source when this is scarce, as compared to some minimum food requirement (see Tables A2, A3). The total amount of food is thus calculated from Equation (8), based on the preference and the relative availability of different preys. In order to correctly simulate the observed biomass of zooplankton groups, the half-saturation constant (KZi) parameters were decreased from their initial values (KZ4 = 14, KZ5 = 24, KZ6 = 49 mgC/m3, see Table 1). As shown in Figure 9U, mesozooplankton was initially significantly underestimated (Run4, see Table 1). Adopting a lower half-saturation (KZ4 = 3 mgC/m3), the simulated mesozooplankton biomass in Run5 approached the observations (Figure 9V) but the biomass of its prey, microzooplankton, was decreased (Figure 9R). Decreasing also the microzooplankton half-saturation constant (KZ5 = 10 mgC/m3) in Run6, the microzooplankton underestimation was removed (Figure 9S), mesozooplankton was further increased (Figure 9W), but an underestimation was now found for heterotrophic nanoflagellates (Figure 9O). This was finally removed (Figure 9P) in Run1 when the respective half-saturation constant was also decreased (KZ6 = 16 mgC/m3), showing also a slightly better agreement for microzooplankton and mesozooplankton (Figures 9T,X). This series of sensitivity experiments illustrates the prey-predator trophic relations. One may notice, for example, the increase in bacteria in Run6 (Figures 9I–L), following the decrease of their predator, HNAN (Figures 9M–P), or the increase in nanophytoplankton (Figures 9A–D) and picophytoplankton (Figures 9E–H) in Run4/Run5 due the relatively low microzooplankton biomass (Figures 9Q–T).
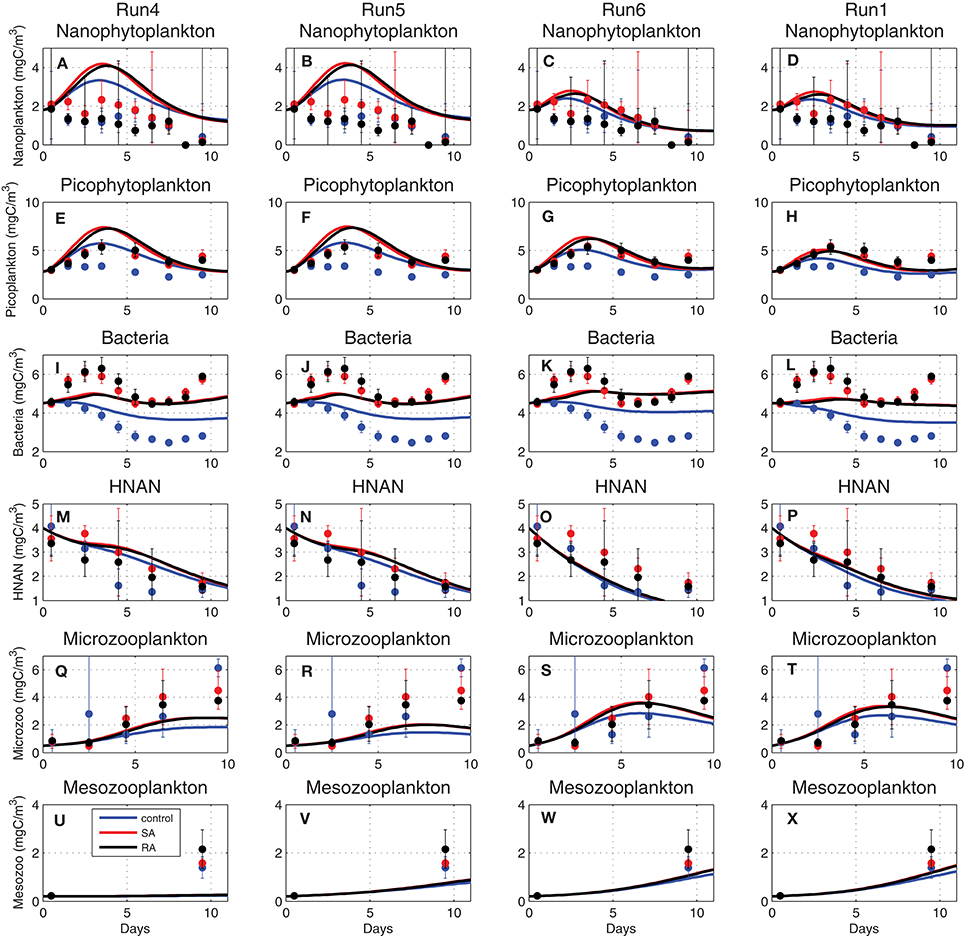
Figure 9. Evolution of (A–D) nanophytoplankton, (E–H) picophytoplankton, (I–L) bacteria, (M–P) HNAN, (Q–T) microzooplankton, and (U–X) mesozooplankton biomass (mgC/m3) simulated by Run4, Run5, Run6, and Run1, adopting different half-saturation constants for zooplankton uptake (see Table 1 for simulations attributes).
Bacterial Dynamics
The observed variability in the mesocosm experiment was characterized by a significant enhancement of bacterial production and biomass in the two addition treatments (SA, RA), as compared to the control mesocosms. This increased bacterial productivity, triggered by dust additions, appeared to be closely coupled to the phytoplankton productivity increase. The ERSEM bacteria sub-model in Petihakis et al. (2002) has been revised by Petihakis et al. (2015), following Anderson and Williams (1998) and Petihakis et al. (2009), allowing for a better representation of the DOM pool, which was particularly important in the presence of significant lateral inputs (e.g., rivers, Black Sea Water) of DOM. The uptake of DOM by bacteria is described by:
where sumB is the maximum bacterial growth rate, f(T) is the growth temperature dependence, f(O2) the oxygen limitation, (NLim, PLim) is the nutrient limitation on nitrogen/phosphorus and CLim the limitation on available DOC. The bacteria nutrient limitation (NLim, PLim) is assumed to depend on the intracellular nitrogen (N/C) and phosphorus (P/C) bacteria quotas (qnB, qpB), compared to the maximum internal quotas (qnBmax, qpBmax):
Alternatively, the bacteria nutrient limitation may be assumed to be a function of external nutrient concentrations, as adopted by Blackford et al. (2004):
Where DON/DOP is dissolved organic phosphorus/nitrogen and KN/PBac is a half-saturation constant.
The carbon limitation (Clim) is described by:
where DOC represents labile and semi-labile DOC and KDOC is a half-saturation constant (Table A2).
When the DOC pool was initialized from the mesocosm measurements (~400 mgC/m3 Figure 10E, Run7), the simulated bacterial production/biomass overall mean was consistent with the measured values, but the model was not able to reproduce the observed variability and particularly the strong differentiation of the addition treatments in relation to the control (Figures 10A,I, Run7). DOC is produced by mortality, excretion and lysis of primary and secondary producers and is mostly labile that is readily available for bacteria. Semi-labile DOC takes longer to decompose by bacteria and can accumulate with time. One can assume that the initial measured DOC pool was mostly semi-labile, while bacterial production on the short (~days) time scale of the experiment was primarily affected by labile organic matter, as the one produced/excreted by plankton biomass. To test this hypothesis, the initial DOC pool was significantly decreased (~3 mgC/m3 Figures 10F–H), considering only its labile component, as also the half-saturation for DOC uptake (KDOC = 4 mgC/m3). Indeed, in this case, bacterial production presented an increase in the addition treatments (Figure 10D, Run9), being closely coupled to the enhanced plankton biomass that released additional DOC. The simulated bacterial production presented a slightly weaker variability, as compared to the observed that showed a stronger and slightly earlier peak in the addition treatments, as well as a higher increasing trend at the end of the 10-day period. Moreover, the model failed to reproduce the observed early peak of bacterial biomass in the addition treatments (Figure 10L, Run9). The simulated bacterial production and biomass were further improved (Figures 10C,K, Run8) when bacterial nutrient limitation was assumed to be a function of external nutrient concentrations (Equation 12), rather than the bacteria internal quotas (Equation 11). In this case, bacterial production appeared to be directly stimulated by the addition of inorganic nutrients, showing an earlier peak on day-3, in agreement with observations, as well as a stronger differentiation between the addition and control treatments. The simulated bacterial biomass, despite the weaker variability, now showed a similar pattern with observations, initially increasing in SA/RA and decreasing in the control (Figure 10K). The simulated bacterial production was still slightly underestimated in the SA/RA treatments. Given its strong sensitivity to the bacterial assimilation efficiency parameter (see next section Model parameter sensitivity), a final model improvement was explored, adopting a variable bacterial assimilation efficiency, depending on nutrient limitation. Specifically, a function of nutrient limitation (NPlim, Equation 12) was introduced in the computation of bacterial respiration as:
where UB is the bacterial growth rate (Equation 10), puB/puBo is the bacteria assimilation efficiency parameter at sufficient/low oxygen (Table A2), eO2 is the relative oxygen saturation, RBb is the temperature dependent basal respiration (RBb = srsB*f(T), Table A2) and
The introduced function of nutrient limitation varied between 0.91 and 1.14 in the control and between 0.95 and 1.24 in SA/RA treatments and effectively resulted in a slightly stronger variability of Bacterial Growth Efficiency (BGE~(UB − RB)/UB), depending on nutrient limitation. This model modification lead to a higher bacterial production and biomass in the addition treatments (Figures 10B,J) that were characterized by a relaxed nutrient limitation, improving the model fit with observations.
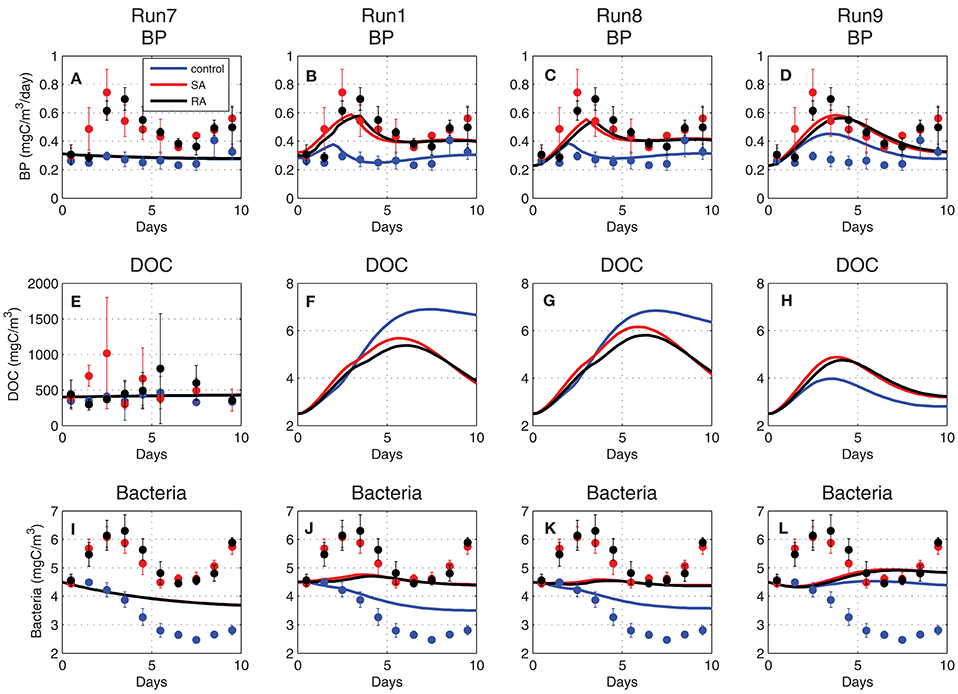
Figure 10. Evolution of (A–D) bacterial production (BP, mgC/m3/day), (E–H) dissolved organic carbon (DOC, mgC/m3), and (I–L) bacterial biomass (mgC/m3) simulated in Run7, Run1, Run8, and Run9 (see Table 1 for simulation attributes).
Model Parameter Sensitivity
A minimum set of parameters/formulations of the existing model were carefully revised, as discussed in the previous section in order to obtain an optimum fit with the observations. The rest of model parameters and formulations were kept fixed to their old values, as their modification did not show any significant improvement. To test the model sensitivity to different parameters, a series of sensitivity experiments were performed, adopting a 10% increase in the value of chosen parameters (see Tables A1, A2 in Supplementary Material for their definition and reference value). The output from these sensitivity simulations with modified parameter values was then compared to the reference simulation, computing the fractional change [(sensitivity − reference)/reference] for different variables. As shown in Figure 11, dissolved inorganic nutrients were mostly affected by phytoplankton maximum growth rate (sumP) and half-saturation coefficients for nutrient uptake (KP, KN). An increase in sumP results in the increase of phytoplankton growth rate and thus, to the decrease of nutrients, while an increase in KP/KN results in a reduction of nutrient uptake rate (see Equation 7). Phytoplankton biomass (p2c, p3c) is mostly sensitive to sumP, as well as to the lysis rate (sdoP) and particularly to the grazing half-saturation constants (KZ5, KZ6) that affect their predation by zooplankton (z5c, z6c, see Equation 8). An increase in KZ5 results in the increase in nanophytoplankton (p2c) and heterotrophic nanoflagellates (z6c), the main preys of microzooplankton (z5c), while increasing KZ6 mainly affects picophytoplankton (p3c). Finally, increasing KZ4 mainly affects mesozooplankton and to a lesser degree its preys z5c and z6c. Bacterial production is among the most sensitive model variables, particularly affected by bacterial assimilation efficiency (puB), growth rate (sumB) and basal respiration (srsB), as well as to the half-saturation for DOC uptake (KDOC). It is also sensitive to the first order breakdown rate from POC to DOC (fr6r1, Petihakis et al., 2015) and the maximum DOC phytoplankton excretion rate under nutrient limitation (seoPmax), both related to the supply of DOC that is necessary for bacteria to grow. Bacterial biomass depends on the same parameters but appears much less sensitive.
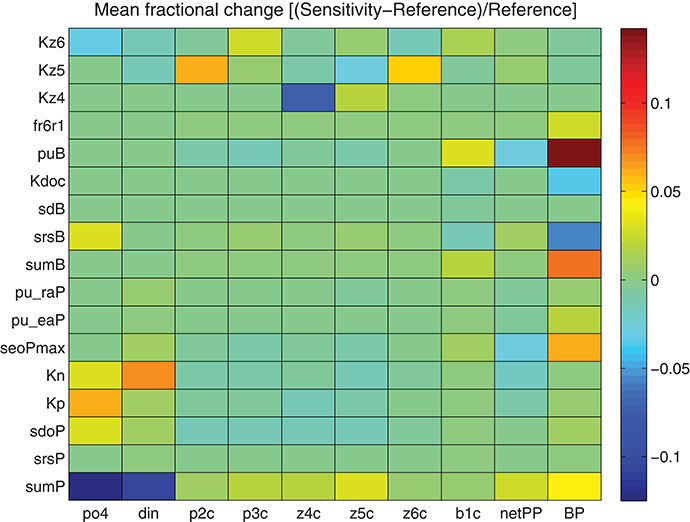
Figure 11. Mean fractional change [(Sensitivity − Reference)/Reference) of model simulated PO4, DIN, nanophytoplankton (p2c), picophytoplankton (p3c), mesozooplankton (z4c), microzooplankton (z5c), HNAN (z6c), bacteria (b1c), net primary production (netPP), and bacterial production (BP) adopting a 10% increase of different model parameters (see Tables A1, A2 in Supplementary Material for their definition and reference values).
Discussion and Concluding Remarks
Among the primary goals of the present study was to thoroughly test and improve the biogeochemical model parameterizations, given the significant amount of available observations on most components of the modeled system that presented a rare opportunity. Often one attempts to validate a model using in situ data collected from a few stations in the area of interest. However, hydrodynamic processes, such as advection and mixing, normally confound the temporal change related to biogeochemical processes with spatial changes, in a manner that is difficult to discern. Therefore, the degree of mismatch between a calculation and a field observation cannot be safely assigned to a failure of the theory, as formulated by the model or to inadequate field observations. Mesocosm experiments include most of the marine environmental factors (light, temperature etc), providing a realistic description of the ecosystem, while they remove the effect of hydrodynamics, random fluctuations and patchiness, offering a way to test the biogeochemical model formulations and its ability to reproduce the ecosystem dynamics. On the other hand, biogeochemical models are usually designed to be generic in order to describe the ecosystem functioning across a wide range of environmental conditions from coastal to open sea and/or from more productive to oligotrophic conditions, found in the area of interest. Mesocosms represent a more local part of the ecosystem. Given the great diversity of plankton organisms, the mesocosm plankton communities enclosed from the field may still be too complicated for testing biological models, except in respect to their most general features (e.g., Steele and Frost, 1977). Biogeochemical models are therefore not intended to provide a perfect fit with mesocosm observations, but the description of the ecosystem main features, while maintaining their generic nature.
Atmospheric deposition of nitrogen and phosphorus represents an important source of nutrients, enhancing the marine productivity in oligotrophic areas, such as the Mediterranean. Within ADAMANT project, a mesocosm experiment was carried out (Lagaria et al., 2017; Pitta et al., 2017), adding dissolved inorganic nitrogen and phosphorus by means of atmospheric dust (single addition and repetitive addition in three successive doses) in controlled tanks with Cretan Sea water and compared with control (blank) tanks. Observations on almost all components of the pelagic ecosystem on a 10-day period allowed investigating the effect of atmospheric deposition and the pathways of the added nutrients in the marine ecosystem. In the present study, a comprehensive biogeochemical model was setup and customized to simulate the mesocosm experiment. After certain modifications and the necessary tuning, the model was able to reasonably capture the observed variability of different ecosystem components and reproduce the main features of the experiment. In agreement with the observations, model results indicated an enhancement of primary production and phytoplankton biomass with added nutrients. A significant increase was also simulated for bacterial production. Its stimulation was found to be mainly related to the in situ produced dissolved organic matter, as well as to the relaxed nutrient limitation in the addition treatments. The model was less successful with bacterial biomass, underestimating its observed increase and variability. However, this model deviation could be partly removed if the measured biomass was decreased by some factor i.e., considering a smaller conversion factor from cell abundance that might be more appropriate in oligotrophic seas, such as the Mediterranean. The model also reasonably captured the evolution of other heterotrophs, characterized by the decrease of heterotrophic nanoflagellates and the increase of microzooplankton and mesozooplankton. The model results indicated that the impact of the single dust addition event in the marine system was slightly stronger than three successive smaller ones, which is consistent with the general ecosystem stable state theory (Scheffer et al., 2001; Collie et al., 2004). However, this difference was relatively small, not being able to be verified by observations, considering the standard deviation of replicate measurements.
Model results were used to identify the main carbon pathways and to investigate the impact of nutrient additions in terms of carbon flows within the food web. The dust addition did not modify the food web structure that was dominated by fluxes from picophytoplankton/bacteria to heterotrophic nanoflagellates and particularly from nanophytoplankton/picophytoplankton to microzooplankton, but just increased its trophic status, with more carbon circulating in the entire food web. Model results were also used to track the fate of the added nitrogen/phosphorus. These were initially channelled from the dissolved inorganic pools to phytoplankton, followed by zooplankton with a time-lag, with bacteria consuming the produced dissolved organic nitrogen/phosphorus and all contributing to the build-up of particulate organic pool through mortality losses.
In the Cretan Sea, primary production is increased during winter and early spring (Siokou-Frangou et al., 2002) due to intense winter mixing that supplies the euphotic zone with nutrients from the deeper layers. The mesocosm experiments were carried out during the stratification period (May), when inorganic nutrient concentrations at the Cretan Sea surface layer are extremely low and dust atmospheric deposition is the only source of nutrients sustaining primary production, along with nutrient recycling (Christodoulaki et al., 2013). The plankton response to atmospheric dust additions, captured by the mesocosm experiments and model simulations, may thus be considered representative of this period, when the effect of atmospheric deposition is mostly demonstrated. In the near future (2030), nutrient inputs with atmospheric deposition in the Eastern Mediterranean are expected to increase for nitrogen and remain similar for phosphorus, as estimated by Duce et al. (2008) and Mahowald et al. (2008), based on global chemistry-transport model calculations. Given the P-limited characteristics of the Eastern Mediterranean marine ecosystem, such changes are expected to have a limited effect on plankton biomass stocks, but may contribute to a further increase of N:P ratio and a stronger P-limitation (Christodoulaki et al., 2016).
In order to correctly reproduce the observed variability in the mesocosm experiment, certain model assumptions, along with few changes in the model parameter set and formulations were necessary. These were discussed through a series of sensitivity simulations. Noticing the strong coupling of the observed bacterial production to phytoplankton biomass, it was assumed that on the short (~days) time scale of the experiment, bacteria were primarily affected by labile organic matter as the one in situ produced/excreted by plankton biomass, rather than semi-labile that is decomposed on a longer time-scale. The simulated variability of bacteria was further improved adopting a function of external nutrient concentrations for nutrient limitation of their growth, rather than their internal stoichiometry. In this way, bacterial production was directly stimulated by the addition of inorganic nutrients, showing a similar to phytoplankton early peak, in agreement with observations. A final model improvement was explored, adopting variable bacterial assimilation efficiency (BGE), depending on nutrient limitation. Such dependence is consistent with field data studies, suggesting that BGE varies according to the trophic richness of the ecosystem (del Giorgio and Cole, 1998). The simulated bacterial biomass reproduced the observed pattern in the addition and control treatments, but showed a much weaker variability. This model deviation could be partly removed if the measured biomass (and its initial value used in the model simulations) was decreased by some factor. Bacteria carbon biomass was converted from cell abundance using a conversion factor of 20 mgC/cell based on Lee and Fuhrman (1987), which, although widely used, is known to lead in overestimations (as much as 330%) in oligotrophic seas, such as the Mediterranean, where values of 12.4 ± 6.3 mgC/cell have been suggested (Fukuda et al., 1998). Another source of uncertainty in the simulated bacteria biomass was the effect of viral lysis that is not explicitly represented in the model.
Another important change in the model that was found necessary in order to reproduce the observed primary production, was the effective increase of phytoplankton nutrient uptake rate, either by increasing phytoplankton affinity parameter (× 20) or by adopting Michaelis-Menten kinetics with properly tuned half-saturation constants. The higher adopted phytoplankton affinity values are closer to those reported in recent reviews of experimental data (e.g., Tambi et al., 2009), also showing an inverse relationship with size (e.g., Edwards et al., 2012). Particularly for the Mediterranean, Tanaka et al. (2004) estimates for affinity were ~0.8–2 (mgC/m3)−1day−1 for picophytoplankton and ~0.06–0.24 (mgC/m3)−1day−1 for autotrophic flagellates, while Moutin et al. (2002) has reported a dependence of phytoplankton affinity on nutrient limitation conditions, showing an increasing trend in the Eastern oligotrophic conditions. Phytoplankton affinity reflects its efficiency to grow in oligotrophic environments, such as the Eastern Mediterranean. In less nutrient-limiting conditions, such as the North Sea, where ERSEM was initially tested, the model sensitivity to the phytoplankton affinity parameters is expected to be much weaker. Furthermore, given the limitations measuring very low nutrient concentrations, particularly with older methods characterized by relatively high detection limits, it was difficult to validate correctly the model simulated productivity under nutrient-depleted conditions, when using old in situ data. Therefore, the simulated integrated primary production might be in reasonable agreement with in situ data, but a model underestimation in near-surface nutrient depleted waters might be unnoticed. Indeed, in previous implementations with a 3-D ERSEM model version in the Mediterranean (e.g., Petihakis et al., 2002, 2015; Tsiaras et al., 2014) the simulated integrated primary production was in reasonable agreement with observations, while near-surface nutrients/production during stratified periods might be overestimated/underestimated.
Finally, the growth rate of heterotrophic nanoflagellates, microzooplankton and mesozooplankton was effectively increased by decreasing their feeding half-saturation constants, as their biomass was initially underestimated. This model modification, combined with the increased phytoplankton nutrient uptake has implications mainly on dissolved inorganic nutrients that are now relaxed to lower concentrations. With the new model configuration (higher nutrient uptake/higher grazing pressure), simulated phytoplankton with the 3-D biogeochemical model might be similar, at least on a seasonal scale, but nutrient concentrations are expected to be lower and probably closer to observations in nutrient depleted waters. We should note however that in the present study the model was tuned to the oligotrophic Cretan Sea conditions. Therefore, changes in the model formulation/parameterization for its 3-D Mediterranean implementation will require careful testing to ensure that this maintains its generic character, describing the ecosystem functioning across a wide range of environmental conditions. The model simulated heterotrophs should also be further validated, as available field data has been very scarce, particularly on microzooplankton and heterotrophic nanoflagellates and collected mostly from more productive areas, such as the N. Aegean.
Author Contributions
KT designed the study and model simulations, made the figures, and wrote the manuscript. SC contributed in the discussions of the study, figures preparation, and writing of the manuscript. GP contributed in the design and discussions of the study and writing of the manuscript. CF collated observational data and contributed in the discussions of the study and writing of the manuscript. GT contributed in the discussions of the study and writing of the manuscript.
Conflict of Interest Statement
The authors declare that the research was conducted in the absence of any commercial or financial relationships that could be construed as a potential conflict of interest.
Acknowledgments
This research has been co-financed by the European Union (European Social Fund–ESF) and Greek national funds through the Operational Program “Education and Lifelong Learning” of the National Strategic Reference Framework (NSRF) Research Funding Program: THALES (ADAMANT–Atmospheric Deposition And MediterraneAN sea water producTivity), Investing in knowledge society through the European Social Fund. We would like to thank Dr. P. Pitta (HCMR) for the helpful comments on the manuscript. We also thank all scientists from HCMR that analyzed and provided data from the mesocosm experiment: S. Zivanovic, E. Dafnomili, and M. Tsapakis (inorganic nutrients), K. Violaki (dissolved organic carbon), A. Lagaria and S. Psarra (primary production and phytoplankton abundance), N. Papageorgiou and P.D. Dimitriou (Chl-a), A. Giannakourou (bacterial production), A. Tsiola (heterotrophic bacteria and cyanobacteria abundance), M. Kagiorgi (nanoflagellates and microzooplankton counts), S. Mpatziakas (mesozooplankton counts), and P. Pitta for organizing the mesocosm experiment and dataset.
Supplementary Material
The Supplementary Material for this article can be found online at: https://www.frontiersin.org/article/10.3389/fmars.2017.00120/full#supplementary-material
References
Allen, J. I., Somerfield, P. J., and Siddorn, J. (2002). Primary and bacterial production in the Mediterranean Sea: a modelling study. J. Mar. Syst. 33–34, 473–495. doi: 10.1016/S0924-7963(02)00072-6
Anderson, T. R., and Williams, P. J. I. B. (1998). Modelling the seasonal cycle of dissolved organic carbon at Station E1 in the English Channel. Estuar. Coast. Shelf Sci. 46, 93–109. doi: 10.1006/ecss.1997.0257
Baretta, J. W., Ebenhoh, W., and Ruardij, P. (1995). The European regional seas ecosystem model, a complex marine ecosystem model. Netherlands J. Sea Res. 33, 233–246. doi: 10.1016/0077-7579(95)90047-0
Baretta-Bekker, J. G., Baretta, J. W., and Ebenhoh, W. (1997). Microbial dynamics in the marine ecosystem model ERSEM II with decoupled carbon assimilation and nutrient uptake. J. Sea Res. 38, 195–211. doi: 10.1016/S1385-1101(97)00052-X
Bethoux, J. P., Morin, P., Chaumery, C., Connan, O., Gentili, B., and Ruiz-Pino, D. (1998). Nutrients in the Mediterranean Sea, mass balance and statistical analysis of concentrations with respect to environmental change. Mar. Chem. 63, 155–169. doi: 10.1016/S0304-4203(98)00059-0
Blackford, J. C., Allen, J. I., and Gilbert, F. J. (2004). Ecosystem dynamics at six contrasting sites: a generic modelling study. J. Mar. Syst. 52, 191–215. doi: 10.1016/j.jmarsys.2004.02.004
Christodoulaki, S., Petihakis, G., Kanakidou, M., Mihalopoulos, N., Tsiaras, K., and Triantafyllou, G. (2013). Atmospheric deposition in the Eastern Mediterranean, A driving force for ecosystem dynamics. J. Mar. Syst. 109–110, 78–93. doi: 10.1016/j.jmarsys.2012.07.007
Christodoulaki, S., Petihakis, G., Mihalopoulos, N., Tsiaras, K., Triantafyllou, G., and Kanakidou, M. (2016). Human-driven atmospheric deposition of N and P controls on the East Mediterranean marine ecosystem. J. Atmos. Sci. 73, 1611–1619. doi: 10.1175/JAS-D-15-0241.1
Collie, J. S., Richardson, K., and Steele, J. H. (2004). Regime shifts: can ecological theory illuminate the mechanisms? Prog. Oceanogr. 60, 281–302. doi: 10.1016/j.pocean.2004.02.013
Crise, A., Allen, J. I., Baretta, J., Crispi, G., Mosetti, R., and Solidoro, C. (1999). The Mediterranean pelagic ecosystem response to physical forcing. Prog. Oceanogr. 44, 219–243. doi: 10.1016/S0079-6611(99)00027-0
del Giorgio, P. A., and Cole, J. (1998). Bacterial growth efficiency in natural aquatic systems. Annu. Rev. Ecol. Syst. 28, 503–541. doi: 10.1146/annurev.ecolsys.29.1.503
Droop, M. R. (1974). The nutrient status of algal cells in continuous culture. J. Mar. Biol. Assoc. UK. 54, 825–855. doi: 10.1017/S002531540005760X
Duce, R. A., LaRoche, J., Altieri, K., Arrigo, K. R., Baker, A. R., Capone, D. G., et al. (2008). Impacts of atmospheric anthropogenic nitrogen on the open ocean. Science 320, 893–897. doi: 10.1126/science.1150369
Edwards, K. F., Thomas, M. K., Klausmeier, C. A., and Litchman, E. (2012). Allometric scaling and taxonomic variation in nutrient utilization traits and maximum growth rate of phytoplankton. Limnol. Oceanogr. 57, 554–566. doi: 10.4319/lo.2012.57.2.0554
Fennel, W., and Neumann, T. (2004). Introduction to the Modelling of Marine Ecosystems. Amsterdam: Elsevier (Oceanographic Series).
Finlayson-Pitts, B. J. (2009). Reactions at surfaces in the atmosphere: integration of experiments and theory as necessary (but not necessarily sufficient) for predicting the physical chemistry of aerosols. Phys. Chem. Chem. Phys. 11, 7760–7779. doi: 10.1039/b906540g
Fukuda, R., Ogawa, H., Nagata, T., and Koike, I. (1998). Direct determination of carbon and nitrogen contents of natural bacterial assemblages in marine environments. Appl. Environ. Microbiol. 64, 3352–3358.
Gaetani, M., and Pasqui, M. (2014). Synoptic patterns associated with extreme dust events in the Mediterranean Basin. Reg. Environ. Change 14, 1847–1860. doi: 10.1007/s10113-012-0386-2
Gallisai, R., Peters, F., Volpe, G., Basart, S., and Baldasano, J. M. (2014). Saharan dust deposition may affect phytoplankton growth in the Mediterranean Sea at ecological time scales. PLoS ONE 9:e110762. doi: 10.1371/journal.pone.0110762
Geider, R. J., MacIntyre, H. L., and Kana, T. M. (1998). A dynamic regulatory model of phytoplankton acclimation to light, nutrients and temperature. Limnol. Oceanogr. 43, 679–694. doi: 10.4319/lo.1998.43.4.0679
Giovagnetti, V., Brunet, C., Conversano, F., Tramontano, F., Obernosterer, I., Ridame, C., et al. (2013). Assessing the role of dust deposition on phytoplankton ecophysiology and succession in a low-nutrient low-chlorophyll ecosystem: a mesocosm experiment in the Mediterranean Sea. Biogeosciences 10, 2973–2991. doi: 10.5194/bg-10-2973-2013
Guieu, C., Dulac, F., Ridame, C., and Pondaven, P. (2014). Introduction to project DUNE, a DUst experiment in a low Nutrient, low chlorophyll Ecosystem. Biogeosciences 11, 425–442. doi: 10.5194/bg-11-425-2014
Herut, B., Zohary, T., Krom, M., Mantoura, R. F. C., Pitta, P., Psarra, S., et al. (2005). Response of east Mediterranean surface water to Saharan dust: on-board microcosm experiment and field observations. Deep Sea Res. II 52, 3024–3040. doi: 10.1016/j.dsr2.2005.09.003
Heussner, S., Charrière, B., and ADIOS Consortium (2003). “A basin-wide survey of the impact of atmospheric deposition of pollutants and nutrients on the open Mediterranean Sea (ADIOS),” in The Impact of Human Activities on the Marine Environment Quality and Health: the EC Impacts Cluster: Proceedings of the First Workshop, eds P. Caumette, C. Eccles, P. Garrigues, M. Krom, and P. Lebaron (Pau), 31–47.
Jickells, T. D., An, Z. S., Andersen, K. K., Baker, A. R., Bergametti, G., Brooks, N., et al. (2005). Global iron connections between desert dust, ocean biogeochemistry, and climate. Science 308, 67–71. doi: 10.1126/science.1105959
Jolliff, J., Kindle, J., and Shulman, I. (2009). Summary diagrams for coupled hydrodynamic-ecosystem model skill assessment. J. Mar. Syst. 76, 64–82. doi: 10.1016/j.jmarsys.2008.05.014
Krom, M. D., Emeis, K. C., and Van Cappellen, P. (2010). Why is the Eastern Mediterranean phosphorus limited? Prog. Oceanogr. 85, 236–244. doi: 10.1016/j.pocean.2010.03.003
Krom, M. D., Kress, N., and Brenner, S. (1991). Phosphorus limitation of primary productivity in the eastern Mediterranean Sea. Limnol. Oceanogr. 36, 424–432. doi: 10.4319/lo.1991.36.3.0424
Krom, M., Herut, B., and Mantoura, C. F. R. (2004). Nutrient budget for the Eastern Mediterranean: implications for phosphorus limitation. Limnol. Oceanogr. 49, 1582–1592. doi: 10.4319/lo.2004.49.5.1582
Lagaria, A., Mandalakis, M., Mara, P., Papageorgiou, N., Pitta, P., Tsiola, A., et al. (2017). Phytoplankton response to Saharan dust depositions in the Eastern Mediterranean Sea: a mesocosm study. Front. Mar. Sci. 3:287. doi: 10.3389/fmars.2016.00287
Laghdass, M., Blain, S., Besseling, M., Catala, P., Guieu, C., and Obernosterer, I. (2011). Effects of Saharan dust on the microbial community during a large in situ mesocosm experiment in the NW Mediterranean Sea. Aquat. Microb. Ecol. 62, 201–213. doi: 10.3354/ame01466
Lee, S., and Fuhrman, J. A. (1987). Relationships between biovolume and biomass of naturally derived marine bacterioplankton. Appl. Environ. Microbiol. 53, 1298–1303.
Mahowald, M. N., Jickells, T. D., Baker, A. R., Artaxo, P., Benitez-Nelson, C. R., Bergametti, G., et al. (2008). Global distribution of atmospheric phosphorus sources, concentrations and deposition rates, and anthropogenic impacts. Global Biogeochem. Cycles. 22:GB4026. doi: 10.1029/2008GB003240
Moutin, T., Thingstad, T. F., Van Wanbeke, F., Marie, D., Slawyk, G., Raimbault, P., et al. (2002). Does competition for nanomolar phosphate supply explain the predominance of the cyanobacterium Synechococcus? Limnol. Oceanogr. 47, 1562–1567. doi: 10.4319/lo.2002.47.5.1562
Nenes, A., Krom, M. D., Mihalopoulos, N., Van Cappellen, P., Shi, Z., Bougiatioti, A., et al. (2011). Atmospheric acidification of mineral aerosols: a source of bioavailable phosphorus for the oceans. Atmos. Chem. Phys. 11, 6265–6272. doi: 10.5194/acp-11-6265-2011
Petihakis, G., Triantafyllou, G., Allen, I. J., Hoteit, I., and Dounas, C. (2002). Modelling the spatial and temporal variability of the Cretan Sea ecosystem. J. Mar. Syst. 36, 173–196. doi: 10.1016/S0924-7963(02)00186-0
Petihakis, G., Triantafyllou, G., Tsiaras, K., Korres, G., Pollani, A., and Hoteit, I. (2009). Eastern Mediterranean biogeochemical flux model–Simulations of the pelagic ecosystem. Ocean Sci. 5, 29–46. doi: 10.5194/os-5-29-2009
Petihakis, G., Tsiaras, K., Triantafyllou, G., Kalaroni, S., and Pollani, A. (2015). Sensitivity of the N. Aegean Sea ecosystem to Black Sea Water inputs. Mediterr. Mar. Sci. 15, 790–804. doi: 10.12681/mms.955
Pitta, P., Kanakidou, M., Mihalopoulos, N., Christodoulaki, S., Dimitriou, P. D., Frangoulis, C., et al. (2017). Saharan dust deposition effects on the microbial food web in the Eastern Mediterranean: a study based on a mesocosm experiment. Front. Mar. Sci. 4:117. doi: 10.3389/fmars.2017.00117
Pulido-Villena, E., Baudoux, A.-C., Obernosterer, I., Landa, M., Caparros, J., Catala, P., et al. (2014). Microbial food web dynamics in response to a Saharan dust event: results from a mesocosm study in the oligotrophic Mediterranean Sea. Biogeosciences 11, 5607–5619. doi: 10.5194/bg-11-5607-2014
Ridame, C., Dekaezemacker, J., Guieu, C., Bonnet, S., L'Helguen, S., and Malien, F. (2014). Contrasted Saharan dust events in LNLC environments: impact on nutrient dynamics and primary production. Biogeosciences 11, 4783–4800. doi: 10.5194/bg-11-4783-2014
Scheffer, M., Carpenter, S., Foley, J. A., Folke, C., and Walker, B. (2001). Catastrophic shifts in ecosystems. Nature 413, 591–596. doi: 10.1038/35098000
Siokou-Frangou, I., Bianchi, M., Christaki, U., Christou, E. D., Giannakourou, A., Gotsis, O., et al. (2002). Carbon flow in the planktonic food web along a gradient of oligotrophy in the Aegean Sea (Mediterranean Sea). J. Mar. Syst. 33–34, 335–353. doi: 10.1016/S0924-7963(02)00065-9
Steele, J. H., and Frost, B. W. (1977). The structure of plankton communities. Philos. Trans. R. Soc. Lond. Sci. 280, 485–534. doi: 10.1098/rstb.1977.0119
Stuart, A., and Ord, J. K. (1998). Kendall's Advanced Theory of Statistics, Vol. 1: Distribution Theory, 6th Edn. London: Arnold.
Tambi, H., Flaten, G. A. F., Egge, J. K., Bodtker, G., Jacobsen, A., and Thingstad, T. F. (2009). Relationships between phosphate affinities and cell size and shape in various bacteria and phytoplankton. Aquat. Microb. Ecol. 57, 311–320. doi: 10.3354/ame01369
Tanaka, T., Rassoulzadegan, F., and Thingstad, T. F. (2004). Orthophosphate uptake by heterotrophic bacteria, cyanobacteria, and autotrophic nanoflagellates in Villefranche Bay, northwestern Mediterranean: vertical,seasonal, and short-term variations of the competitive relationship for phosphorus. Limnol. Oceanogr. 49, 1063–1072. doi: 10.4319/lo.2004.49.4.1063
Taylor, K. K. E. (2001). Summarizing multiple aspects of model performance in a single diagram. J. Geophys. Res. Atmos. 106, 7183–7192. doi: 10.1029/2000JD900719
Thingstad, T. F., and Rassoulzadegan, F. (1995). Nutrient limitations, microbial food webs, and ‘biological C-pumps’: suggested interactions in a P-limited Mediterranean. Mar. Ecol. Prog. Ser. 117, 299–306. doi: 10.3354/meps117299
Tsiaras, K., Petihakis, G., Kourafalou, V., and Triantafyllou, G. (2014). Impact of the river nutrient load variability on the N. Aegean ecosystem functioning over the last decades. J. Sea Res. 86, 97–109. doi: 10.1016/j.seares.2013.11.007
Van Wambeke, F., Christaki, U., Giannakourou, A., Moutin, T., and Souvermezoglou, E. (2002). Longitudinal and vertical trends of bacterial limitation by phosphorus and carbon in the Mediterranean Sea. Microb. Ecol. 43, 119–133. doi: 10.1007/s00248-001-0038-4
Vrekoussis, M., Liakakou, E., Mihalopoulos, N., Kanakidou, M., Ctutzen, P. J., and Lelieveld, J. (2006). Formation of HNO3 and NO3− in the anthropogenically-influenced eastern Mediterranean marine boundary layer. Geophys. Res. Lett. 33, L05811. doi: 10.1029/2005GL025069
Keywords: model, mesocosm, atmospheric deposition, marine ecosystem, Mediterranean
Citation: Tsiaras KP, Christodoulaki S, Petihakis G, Frangoulis C and Triantafyllou G (2017) Model Simulations of a Mesocosm Experiment Investigating the Response of a Low Nutrient Low Chlorophyll (LNLC) Marine Ecosystem to Atmospheric Deposition Events. Front. Mar. Sci. 4:120. doi: 10.3389/fmars.2017.00120
Received: 30 September 2016; Accepted: 13 April 2017;
Published: 04 May 2017.
Edited by:
Tatiana Margo Tsagaraki, University of Bergen, NorwayReviewed by:
Rodrigo Riera, Centro de Investigaciones Medioambientales del Atlántico (CIMA, S.L.), SpainChristopher Kenneth Algar, Marine Biological Laboratory, USA
Copyright © 2017 Tsiaras, Christodoulaki, Petihakis, Frangoulis and Triantafyllou. This is an open-access article distributed under the terms of the Creative Commons Attribution License (CC BY). The use, distribution or reproduction in other forums is permitted, provided the original author(s) or licensor are credited and that the original publication in this journal is cited, in accordance with accepted academic practice. No use, distribution or reproduction is permitted which does not comply with these terms.
*Correspondence: Kostas P. Tsiaras, ktsiaras@hcmr.gr