Hydrogen Peroxide Cycling in High-Temperature Acidic Geothermal Springs and Potential Implications for Oxidative Stress Response
 Margaux M. Meslé
 Jacob P. Beam
 Zackary J. Jay
 Brynna Bodle
  Eric Bogenschutz
 William P. Inskeep
- Department of Land Resources and Environmental Sciences, and Thermal Biology Institute, Montana State University, Bozeman, MT, USA
Hydrogen peroxide (H2O2), superoxide (), and hydroxyl radicals (OH•) are produced in natural waters via ultraviolet (UV) light-induced reactions between dissolved oxygen (O2) and organic carbon, and further reaction of H2O2 and Fe(II) (i.e., Fenton chemistry). The temporal and spatial dynamics of H2O2 and other dissolved compounds [Fe(II), Fe(III), H2S, O2] were measured during a diel cycle (dark/light) in surface waters of three acidic geothermal springs (Beowulf Spring, One Hundred Springs Plain, and Echinus Geyser Spring; pH = 3–3.5, T = 68–80°C) in Norris Geyser Basin, Yellowstone National Park. In situ analyses showed that H2O2 concentrations were lowest (ca. 1 μM) in geothermal source waters containing high dissolved sulfide (and where oxygen was below detection) and increased by 2-fold (ca. 2–3 μM) in oxygenated waters corresponding to Fe(III)-oxide mat formation down the water channel. Small increases in dissolved oxygen and H2O2 were observed during peak photon flux, but not consistently across all springs sampled. Iron-oxide microbial mats were sampled for molecular analysis of ROS gene expression in two primary autotrophs of acidic Fe(III)-oxide mat ecosystems: Metallosphaera yellowstonensis (Archaea) and Hydrogenobaculum sp. (Bacteria). Expression (RT-qPCR) assays of specific stress-response genes (e.g., superoxide dismutase, peroxidases) of the primary autotrophs were used to evaluate possible changes in transcription across temporal, spatial, and/or seasonal samples. Data presented here documented the presence of H2O2 and general correlation with dissolved oxygen. Moreover, two dominant microbial populations expressed ROS response genes throughout the day, but showed less expression of key genes during peak sunlight. Oxidative stress response genes (especially external peroxidases) were highly-expressed in microorganisms within Fe(III)-oxide mat communities, suggesting a significant role for these proteins during survival and growth in situ.
Introduction
Hydrogen peroxide (H2O2) is a central reactive oxygen species (ROS) in the global cycle of oxygen (O2), and is thought to have been a precursor to O2 via abiotic reactions in early Earth (Slesak et al., 2012). ROS such as H2O2 and superoxide () may be produced in natural waters via UV (hν)-induced photochemical reactions between dissolved O2 and organic carbon (Wilson et al., 2000a,b). The absorption of light by appropriate chromophore(s) of DOC results in an excited-state intermediate (DOC*), which transfers electrons to O2 to form the superoxide radical (Equation 1), followed by disproportionation of H to form H2O2 (Equation 2, Wilson et al., 2000a,b).
The production of superoxide and hydrogen peroxide from photochemical reactions has important implications for the cycling of dissolved iron (Fe) and other trace elements adsorbed to Fe-oxide solid phases. Several studies have documented diel changes (i.e., changes with light intensity) in the concentrations of dissolved trace elements in stream water containing Fe and DOC (Wilson et al., 2000a,b; Miller et al., 2009). Once hydrogen peroxide is formed, hydroxyl radicals (OH•) are also produced via the reaction of H2O2 and ferrous iron [Fe(II)], (i.e., Fenton reaction, Equation 3), which can lead to the precipitation of highly-insoluble ferric iron [Fe(III)]-oxyhydroxides (Winterbourn, 1995; Wilson et al., 2000a; Kocar and Inskeep, 2003).
Fe(III) can then quickly react with superoxide to form Fe(II), creating a fast ROS turnover (Equation 4, Wilson et al., 2000a; Kocar and Inskeep, 2003). Fenton chemistry can also lead to the chemical decay of hydrogen peroxide and superoxide via the iron-catalyzed Haber-Weiss reaction (Equation 5), producing hydroxyl radicals in the presence of Fe(III) (Kehrer, 2000). In sulfide-rich waters, hydrogen peroxide reacts with hydrogen sulfide (H2S) to form elemental sulfur at low pH (Equation 6, Hoffmann, 1977).
Free radical reactions, whether abiotic (e.g., Fenton chemistry) or biochemical (e.g., aerobic metabolism), are important sources of internal ROS production in living organisms (Cannio et al., 2000), and these compounds can play important roles in DNA damage, cell signaling, and homeostasis (D'autréaux and Toledano, 2007; Galaris and Pantopoulos, 2008; Cornelis et al., 2011). Organisms of all domains of life (Archaea, Bacteria, and Eukarya) possess defense mechanisms against intra- and extracellular ROS. These detoxification enzymes participate directly in H2O2 and Fe cycling (Table 1), and are thought to work in concert to avoid oxidative stress (Pedone et al., 2004; Maaty et al., 2009). Metagenomes of Fe(III)-oxide microbial communities collected in high-temperature acidic geothermal springs of Yellowstone National Park (YNP, Wyoming, USA) have identified chemolithoautotrophic organisms contributing to the early development and production of these microbial mats (Inskeep et al., 2010, 2013; Kozubal et al., 2012; Beam et al., 2016). Curated sequences indicate the presence of numerous oxidative stress response genes (including those listed in Table 1) in two major populations. The rod-shaped bacteria Hydrogenobaculum spp. initiate biofilm attachment, and the iron-oxidizing archaea Metallosphaera yellowstonensis (strain MK1) are responsible for the oxidation of Fe(II) and subsequent accretion of Fe(III)-oxides (Macur et al., 2004; Kozubal et al., 2008; Takacs-Vesbach et al., 2013; Jennings et al., 2014; Beam et al., 2016). Oxygen is a key driver of microbial growth and subsequent mat morphology (Kempes et al., 2014), and its diffusion into the mat is the rate-limiting factor for Fe(III)-oxide mat formation (Beam et al., 2016). Microelectrode measurements of oxygen diffusion into the Fe(III)-oxide mats have revealed steep gradients of O2 (50-0 μM) from the aqueous-mat interface to ~1 mm depth (Bernstein et al., 2013). The top zone (~1 mm) of the Fe(III)-oxide microbial biofilms, which is in direct contact with the overlaying spring water, thus provides an excellent target microenvironment to study possible changes in ROS stress-related gene expression levels.
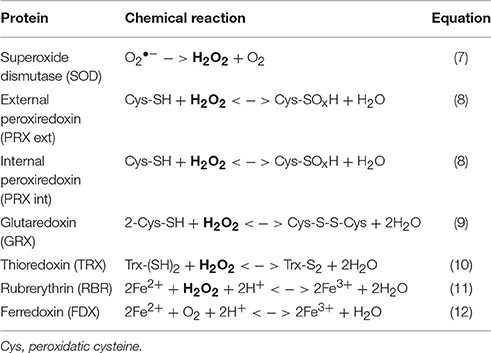
Table 1. Enzymes involved in the microbial cycling of hydrogen peroxide and iron.
The primary goals of this study were to evaluate changes in H2O2 concentrations in Fe(III)-oxide mat environments as a function of light intensity (diel cycle) and record the associated microbial response to oxidative stress based on the activity of key genes involved in H2O2 cycling. Specific objectives were to (i) measure H2O2 concentrations in the outflow channels of acidic geothermal springs as a function of photon flux, (ii) determine the spatiotemporal dynamics of dissolved H2O2, Fe(II), Fe(III), O2, and total sulfide (TS) concentrations occurring within the outflow channels of Fe(III)-oxide springs, and (iii) investigate the expression of key genes known to be involved in oxidative stress response in two of the primary autotrophic populations important in Fe(III)-oxide mat ecosystems. The concentrations of dissolved compounds were measured at different times (diel and seasonal), and at various transect positions within the outflow channels of several Fe(III)-oxide depositing springs in YNP. These geochemical measurements were complemented with in situ expression profiles of oxidative stress response genes in M. yellowstonensis strain MK1 and Hydrogenobaculum spp.
Materials and Methods
Sampling Sites
Three high-temperature acidic geothermal springs located in Norris Geyser Basin (NGB, YNP) were selected for this study due to their comparable water temperature and pH values (Figure 1, Table 2). Beowulf East Spring (BE, pH 3–3.1) and One Hundred Springs Plain (OSP, pH 3.4–3.7) were sampled on May 13 and July 23 2014, while Echinus Geyser Spring (ECH, pH 3.7–3.8) was sampled on April 10 2015. Aqueous pH was obtained on site using an Accumet™ AP85 portable pH and conductivity meter (ThermoFisher Scientific) and a single-point 4.01 buffer calibrated at spring temperatures. Temperature was measured using a thermocouple (Fluke). Geochemical analyses of spring water were performed at selected sampling points down the discharge channels: BE_a–e, OSP_a–c, ECH_a–c (Figure 1). Measurements of dissolved species were coupled with the collection of Fe(III)-oxide microbial mat samples at specific time points (before sunrise to after sunset) in BE, (6:15 a.m., 10 a.m., 2 p.m., 5:30 p.m., and 8:45 p.m.) and ECH (7 a.m., 1 p.m., and 6:30 p.m.) (Figure 1). Photon flux (μEinstein m−2 s−1) was measured over time using a portable light meter. All three geothermal source waters exhibited comparable pH (3–3.8) and temperature (74–86°C) values.
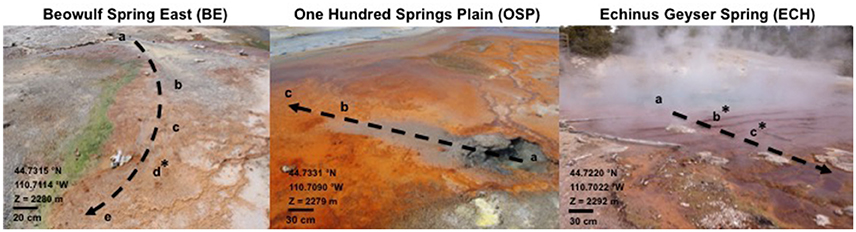
Figure 1. Site images and geochemical characteristics of Beowulf Spring East, One Hundred Springs Plain Spring, and Echinus Geyser Spring (all located in Norris Geyser Basin, Yellowstone National Park, WY, USA). a, source; b–e, other transect sampling points down channel. z, altitude. The dotted arrows indicate the direction of water flow along transect. *, Location of the Fe(III)-oxide mat samples collected for molecular studies.
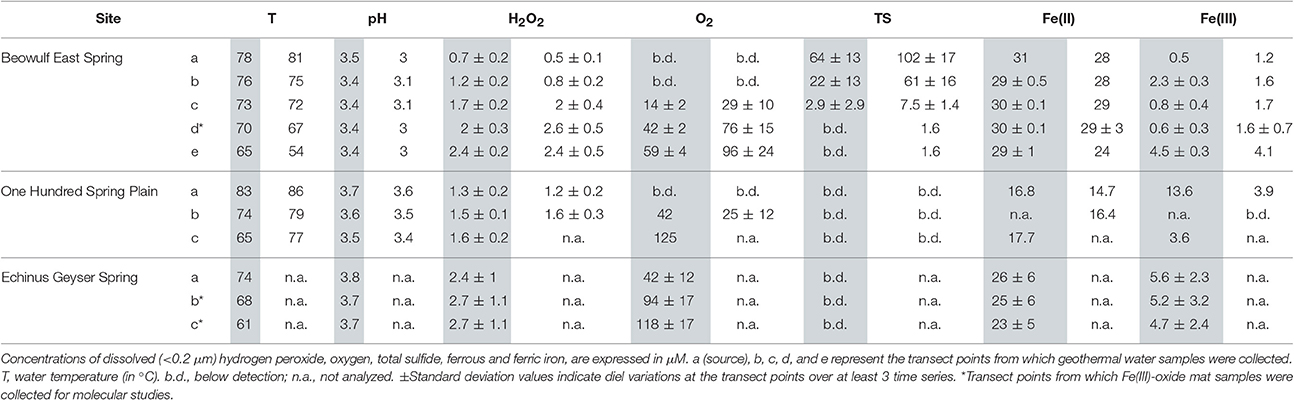
Table 2. In situ geothermal water chemistry in the outflow channels of Beowulf East Spring and 100 Springs Plain on May 13th (gray) and July 23rd (white) 2014; and Echinus Geyser during April 10th 2015 (gray).
Aqueous Geochemistry of Geothermal Springs
Several redox sensitive species were analyzed on site using sterile plastic syringes to sample the spring water along channel transects (Table 2). Concentrations of dissolved oxygen (μM) were measured using a modified version of the Winkler method (Macur et al., 2013). Briefly, a 60-mL syringe filled with geothermal spring water was capped immediately with a septum (zero headspace) to avoid ingassing of atmospheric O2, then treated with appropriate reagents and titrated against Na2S2O3. Ferrous and ferric iron were measured on site using a modified version of the Ferrozine method (To et al., 1999) employing a 5 mL filtered (0.2 μm) sample. Briefly, Ferrozine solution (1 g L−1) was added to replicate subsamples in the absence (Fe(II) only) and presence (total Fe) of excess hydroxylamine (0.25 M stock), which reduces all Fe(III) to Fe(II) prior to complexation with ferrozine. After addition of pH buffer (NH4 acetate, pH 7), colorimetric analyses were performed by measuring absorbance values at 562 nm. Ferric iron concentrations were then calculated as the difference between total soluble iron and ferrous iron. Total dissolved sulfide (TS) was assessed using the amine sulfuric acid method (APHA, 1998; Macur et al., 2013; Jay et al., 2014) with 7.5 mL of unfiltered samples [to avoid rapid degassing of H2S(aq) upon filtration].
Hydrogen Peroxide Analysis Using Acridinium Ester-Chemiluminescence (AE-CL)
A flow-injection analysis instrument [FeLume(II)] with chemiluminescence (CL) detection (Waterville Analytical, Waterville, ME) was used in the field for the determination of H2O2 concentrations in geothermal waters as described in prior reports (Miller et al., 2005; King et al., 2007). The CL detector was a Hamamatsu HC-135 photon counting PMT (Hamamatsu Corp., Bridgewater NJ) operated at the manufacturer's recommended voltage (700 V) for optimal signal/noise ratio for μM concentrations of hydrogen peroxide to avoid PMT saturation. Reagent solutions [i.e., 0.1 M sodium carbonate pH 11.3 and 0.5 M acridinium ester (AE) phosphate-buffered to pH 3] were prepared with MilliQ water treated with 3 mg L−1 catalase (Sigma). H2O2 standards (1, 3, 6, and 10 μM) were prepared from a 30% H2O2 stock solution (Sigma) diluted in catalase-treated MilliQ water. The standard curve included a 0 μM value obtained from catalase-treated MilliQ water only. A fresh working stock solution of H2O2 was prepared for each field campaign; the “lot analysis” guarantees a confidence ranging from 28 to 32% for 2 years (Sigma Chem. Co.). Standards ran as samples at different time intervals provided consistent results indicating an absence of significant decay during the course of the experiment. Triplicate spring water samples, collected with a clean syringe, were filtered (0.2 μm Millipore) into falcon tubes wrapped in Al-foil, and directly injected in the FeLume(II) instrument, which was operated in the field using a generator.
Iron-Oxide Mat Samples and Total RNA Extraction
The top ~1 mm of the Fe(III)-oxide mats was collected in Beowulf (BE_d) and Echinus (ECH_b and ECH_c) springs over time. The mat was removed from the spring channel using a sterile scalpel and flash-frozen with liquid nitrogen in a 50 mL falcon tube (in triplicate), then stored at −80°C. Total RNA extraction was performed on 1–2 g frozen iron mat. After homogenization and centrifugation at 5,000 g for 5 min at 4°C, 1 mL of RNApro™ Soil Lysis Solution from the Fast RNA Pro™ Soil-Direct kit (MP Biomedicals) was added to the pellet, gently mixed, and incubated at room temperature for 5 min. After centrifugation at 10,000 g for 10 min at 4°C, the supernatant was transferred to a new 15 mL tube, and 1 mL of TRI Reagent® (Sigma-Aldrich) was added. The homogenate was incubated for 5 min at room temperature and directly treated with Direct-zol™ RNA MiniPrep Kit (Zymo Research) following the manufacturer's instructions. The absence of DNA was verified by PCR on the RNA samples, targeting both bacterial and archaeal 16S rRNA genes. When necessary, DNase (Promega) treatment of RNA was performed for 30 min at 37°C, and overnight precipitation with 0.2 volumes of LiCl and 2.5 volumes of 100% ethanol. After centrifugation at 12,000 g for 15 min at 4°C, the pellet was washed with 70% ethanol, air dried, and re-suspended in Tris-EDTA buffer or RNase-free water before storage at −80°C. RNA quality and quantity was assessed with the Nanodrop ND-1000 Spectrophotometer (Thermo Scientific) and the RNA HS Assay Kit for the Qubit® Fluorometer (Life Technologies), respectively.
Primer Design for Oxidative Stress Response Genes
To investigate the expression of specific ROS stress response genes (Table 1, Equations 7–12) in organisms known to be important colonizers within active Fe-mat environments (Beam et al., 2016), primers were designed based on genome sequences of Metallosphaera yellowstonensis str. MK1 and Hydrogenobaculum spp. available in the Integrated Microbial Genomes and Microbiomes (IMG/M: https://img.jgi.doe.gov/cgi-bin/m/main.cgi) database (Table S1). Corresponding gene sequences from all available metagenome assemblies were aligned using Clustal W (EMBL-EDI) and Mega 6.06 (www.megasoftware.net), and primers were designed with the Primer-BLAST tool (NCBI, www.ncbi.nlm.nih.gov/tools/primer-blast), then tested with the OligoAnalyzer tool and synthesized (Integrated DNA Technologies).
cDNA Synthesis and Quantitative PCR (RT-qPCR)
Complementary DNA (cDNA) synthesis by reverse-transcription (RT) was performed following the iScript™ cDNA synthesis protocol (BIO-RAD) in a 20 μL reaction volume, using 5 μL of extracted RNA. cDNA was quantified with the Qubit® ssDNA Assay kit (Life Technologies). The 20 μL qPCR reaction was prepared with the SsoFast™ EvaGreen® Supermix (BIO-RAD) using 1 μL of cDNA and 500 nM primers. Amplification was achieved on a the Rotor-Gene 3000™ (Corbett Research) with the following program: hold 7 min at 95°C; 45 cycles of 10 s at 95°C, 30 s at the specific primer hybridization temperature (Table S1), and 30 s at 72°C; hold 5 min at 72°C. Melt curve analysis to detect the presence of primer dimers was performed after the final cycle by increasing the temperature from the hybridization temperature to 95° in 0.5°C increments every 10 s. Triplicate reactions were performed for each sample, as well as for the no-template control (nuclease-free water), a negative control (DNA from Pyrobaculum yellowstonensis strain WP30), and a positive control (DNA from Metallosphaera yellowstonensis strain MK1 isolated from YNP, and DNA previously extracted from YNP (Beam et al., 2016) containing Hydrogenobaculum spp. sequences). Absolute gene quantification was obtained against a standard curve prepared with direct 10-fold serial dilutions (10–108 copies/μL) of a specific cloned reference for each target gene. The PCR product was purified with the GenElute™ PCR Clean-up Kit (Sigma Aldrich) and integrated into a TOPO TA cloning vector (ThermoFisher Scientific). Absolute values were expressed as gene transcript number per ng of RNA extracted, and gene expression was then normalized to transcript numbers per cell, using the number of 16S rRNA copies detected for Metallosphaera and Hydrogenobaculum.
Statistical Analysis
Chemistry, light, and gene expression data were analyzed using analysis of variance (Two-Way ANOVA, General Linear Model) processed with the software Minitab 17 (PA, USA). p-values were obtained using α values of 0.05.
Results
Temporal and Spatial Hydrogen Peroxide Measurements in Acidic Geothermal Springs
Dissolved concentrations of H2O2 were measured at different times (from before sunrise to after sunset) within the outflow channels of three acidic, Fe(III)-oxide depositing geothermal springs in YNP. Beowulf and One Hundred Springs Plain (OSP) waters were sampled during clear days in May and July 2014, where photon flux (PF) ranged from near zero to 1,700–1,900 μE m−2 s−1 (Figure 2). As expected, the peak PF was higher in July (ca. 1,900 μE m−2 s−1) than in May (ca. 1,700 μE m−2 s−1). Samples from the outflow channel at Echinus Geyser were collected during a partially cloudy day with higher variations in PF, which peaked near 2,000 μE m−2 s−1 in the middle of the day (Figure 3).
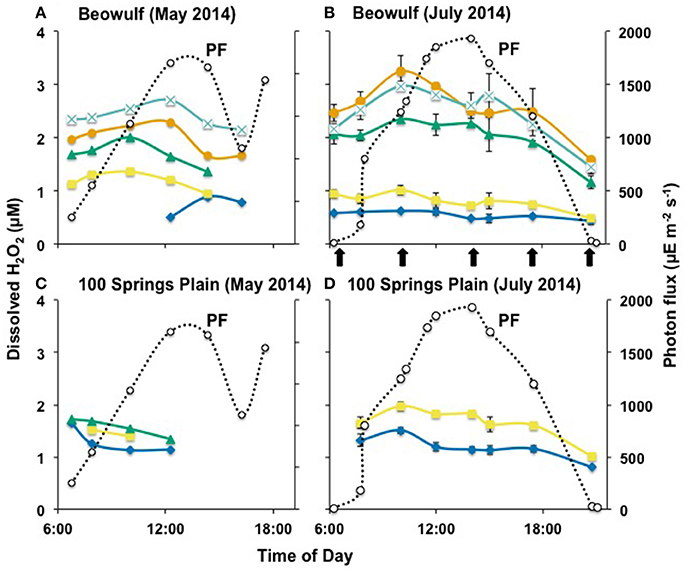
Figure 2. Hydrogen peroxide concentration over a diel cycle in Beowulf (A,B) and 100 Springs Plain (C,D). The error bars represent standard deviation values from the triplicate water analysis. a ( ), b (
 ), c (
 ), d (
 ), and e (
 ) indicate the transect points from which geothermal water samples were collected. PF: photon flux (
 ) expressed in microEinstein (μE) per square meter per second. The error bars represent standard deviation values from triplicate water analyses (July data only), and they are sometimes within the symbols. The arrows represent the temporal Fe(III)-oxide mat samples (BE_d only) for molecular study.
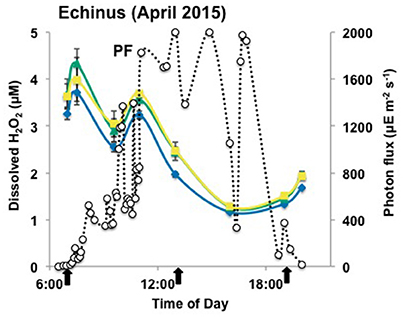
Figure 3. Hydrogen peroxide concentrations over a diel cycle in the outflow channel of Echinus Geyser Spring, on April 10th 2015. The error bars represent standard deviation values from the triplicate water analysis. ECH_a (), ECH_b (), and ECH_c () indicate the transect points from which geothermal water samples were collected. PF: photon flux () expressed in microEinstein (μE) per square meter per second. The error bars represent standard deviation values from triplicate water analyses, and they are sometimes within the symbols. The arrows represent the temporal Fe(III)-oxide mat samples (ECH_b and ECH_c only) for molecular studies.
In situ analyses of Beowulf spring waters showed that H2O2 concentrations ranged from 0.5 to 1.2 μM at transect positions a and b, which contained high levels of dissolved sulfide (~60–100 μM) (Table 2). Results indicate significantly higher H2O2concentrations in BE_b across the diel cycle compared to BE_a. Concentrations of H2O2 increased by nearly 3-fold (2–3 ± 0.5 μM) in aqueous samples taken down-channel (i.e., transect positions BE_d–e), which corresponded to increases in dissolved oxygen; this statistically different trend was observed during both sampling periods (Figures 2A,B). Small increases in H2O2 were also observed during peak photon flux in July at transect positions BE_c to BE_e, which are located down gradient from geothermal source waters (i.e., BE_a) where H2O2 levels remained constant over time. Statistical analyses (two-way ANOVA) indicated significant H2O2 variations with light and with channel location (p < 0.05).
Concentrations of H2O2 in the shorter outflow channel of 100 Springs Plain were nearly constant (1.2–1.6 ± 0.2 μM) across all sampling times (Figures 2C,D). However, these results indicated statistically different levels in OSP_a and OSP_b across the diel cycle in July 2015. No obvious differences in H2O2 concentrations were observed between May and July sampling dates in either BE or OSP (Figure 2).
Concentrations of H2O2 in samples from the Echinus Geyser outflow channel were similar at all transect positions (a–c), although small increases were noted down gradient (Figure 3). However, H2O2 levels dropped from 3 to 4 μM in the morning to values ranging from ~1 to 2 μM in the evening (Figure 3). As observed in Beowulf spring, statistical analyses (two-way ANOVA) of Echinus samples indicated significant H2O2 variations with light and with transect location (p < 0.05).
Temporal and Spatial Changes in Dissolved Oxygen
No dissolved O2 was detected in the presence of high sulfide at Beowulf transect positions BE_a and BE_b (Figure 4A). Dissolved O2 concentrations increased significantly as a function of distance from geothermal discharge, ranging from ~30 (±10) μM at BE_c to ~100 (±25) μM at BE_e (Table 2). Moreover, small increases in dissolved O2 at transect positions BE_c–e were also observed with increasing photon flux, prior to a slow decrease until evening. Statistical analyses (two-way ANOVA) confirmed a significant effect of light and transect position on O2 variation in the channel (p < 0.05).
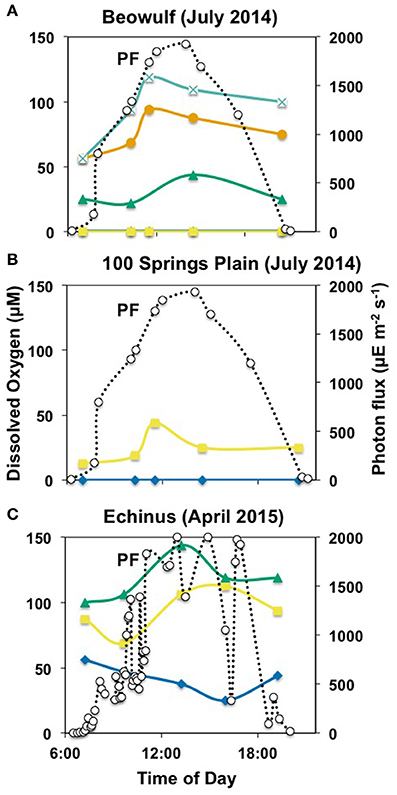
Figure 4. Concentrations of dissolved oxygen in acidic geothermal springs (BE, OSP and ECH) over a diel cycle on July 23rd 2014 (A,B) and April 10th 2015 (C). a (), b (), c (), d (), and e () indicate the transect points from which geothermal water samples were collected. PF: photon flux () expressed in microEinstein (μE) per square meter per second.
Dissolved O2 levels in 100 Springs Plain were also below detection at discharge (OSP_a) and reached ~ 25 (±12) μM in OSP_b (Figure 4B, Table 2). Dissolved O2 (DO) concentrations at OSP_b also increased with increased photon flux, prior to a slow decrease until evening, similar to observations in down channel positions of Beowulf Spring (Figures 2A,B).
Geothermal source waters of Echinus Geyser (ECH_a) were already oxygenated (~42 ± 12 μM), but DO still increased down channel to reach ~94 (±17) and 118 (±17) μM DO at ECH_b and ECH_c, respectively (Figure 4C and Table 2). Statistical analyses (two-way ANOVA) indicated a significant difference in O2 concentration at different transect locations (p < 0.05), but no positive correlation with light (p > 0.05).
Transcriptional Response to ROS Stress in Fe(III)-Oxide Microbial Mats
To evaluate possible microbial responses to oxidative stress in the oxygenated zone (top 1 mm) of iron oxide mats, expression analyses (RT-qPCR) were performed on specific genes involved in H2O2 cycling (Figures 5, 6). 16S rRNA gene copy numbers for both M. yellowstonensis and Hydrogenobaculum were higher in Fe-oxide mats from Beowulf (BE_d) during peak photon flux (near 2 p.m.). Metallosphaera populations increased by two orders of magnitude between 6 a.m. and 2 p.m. (~105–107 16S rRNA copies/ng RNA), then decreased back to ~105 copies/ng RNA by 6–9 p.m. (Figure 5A). 16S rRNA gene copy numbers for Hydrogenobaculum did not fluctuate as much over the same time period averaging ~105 copies/ng RNA. Genes coding for external PRX, RBR, and SOD exhibited the highest expression levels in M. yellowstonensis, while genes coding TRX, internal PRX, and FDX were the least expressed (Figure 6A). In Hydrogenobaculum, genes coding for SOD, RBR, and internal PRX were the three most expressed while TRX, FDX, and external PRX were the three least expressed (Figure 6B). While glutaredoxin transcript levels varied over the course of the day in Metallosphaera, they were stable in Hydrogenobaculum. Statistical analyses (two-way ANOVA) indicated significant differences in expression between genes and between species, as well as over time (p < 0.05) in BE_d.
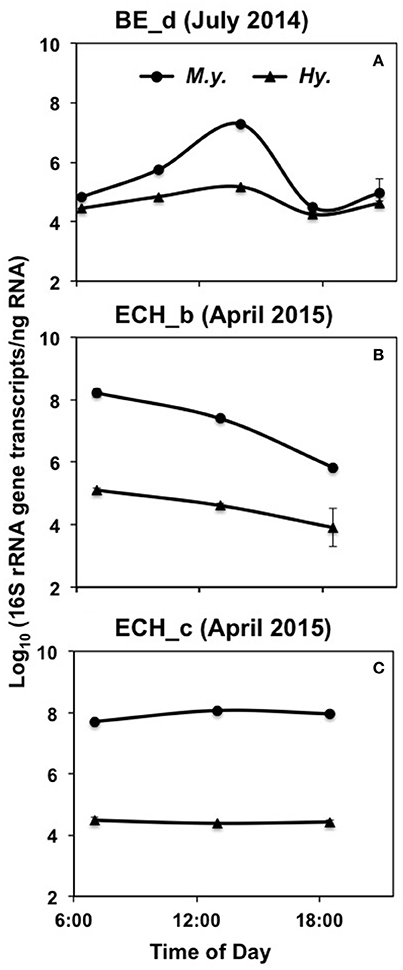
Figure 5. Absolute 16S rRNA gene expression in M. yellowstonensis str. MK1 (M.y.) and Hydrogenobaculum spp. (Hy.) over a diel cycle in the BE_D (A), ECH_B (B), and ECH_C (C) Fe(III)-oxide mats. The error bars represent standard deviation values from triplicate qPCR reactions and they are sometimes within the symbols.
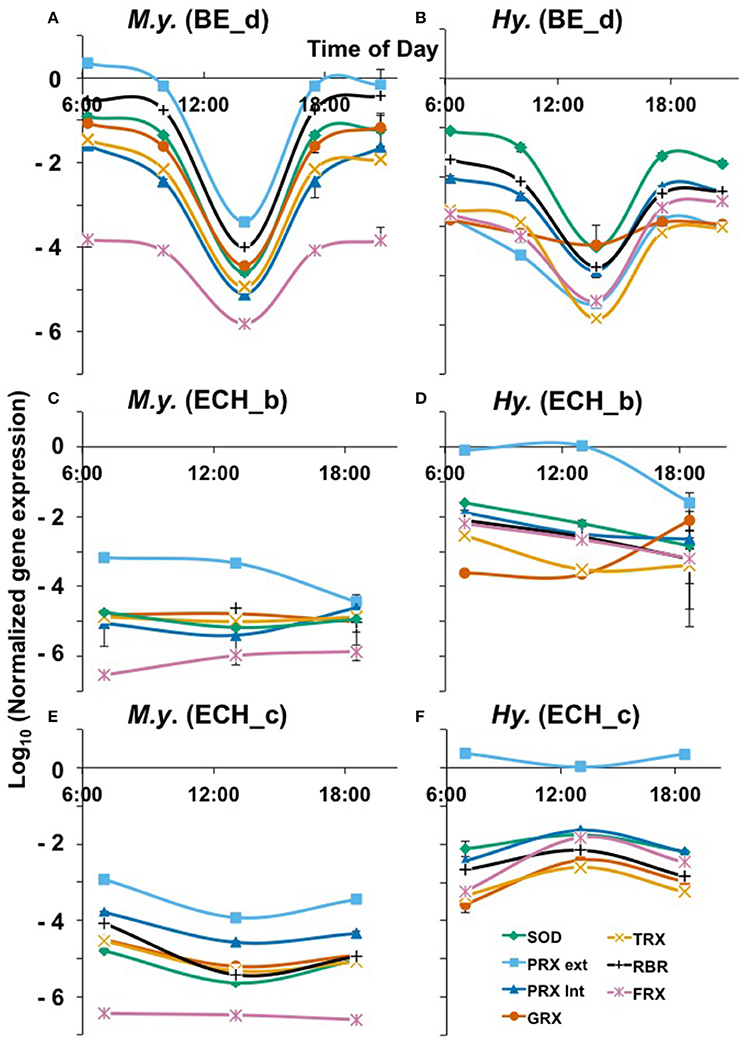
Figure 6. Oxidative stress response over a diel cycle of M. yellowstonensis str. MK1 (A,C,E) and Hydrogenobaculum spp. (B,D,F) in the BE_d (July 2014), ECH_b, and ECH_c (April 2015) Fe(III)-oxide mats. Normalized expression of specific genes involved in ROS cycling. SOD, superoxide dismutase; PRX ext, external peroxiredoxin; PRX int, internal peroxiredoxin; GRX, glutaredoxin; TRX, thioredoxin; RBR, rubrerythrin; FDX, ferredoxin (Table 1). The error bars represent standard deviation values from triplicate qPCR reactions and they are sometimes within the symbols.
M. yellowstonensis str. MK1 activity was higher in Echinus than in Beowulf iron mats averaging nearly 108 16S rRNA gene copies ng−1 RNA; population numbers were stable across the three temporal samplings at ECH_c, but declined to ~106 copies ng−1 RNA in ECH_b (Figures 5B,C). Hydrogenobaculum spp. activity remained nearly stable throughout the day near 105 transcripts ng−1 RNA, but was always lower than M. yellowstonensis activity. Only small changes in the expression of ROS stress response genes (less than one order of magnitude) were observed in Echinus Fe-oxide mats across time points from 7 a.m. to 6:30 p.m. (Figures 6C–F). Hydrogenobaculum exhibited a similar stress response pattern in ECH_b and ECH_c iron mats: genes coding SOD, external and internal PRX were the three most expressed, followed by RBR and FDX, while those coding TRX and GRX were the least expressed (Figures 6D,F). In M. yellowstonensis, the external PRX gene was also the most expressed at both sampling points, and FDX was the least expressed (Figures 6C,E). Genes coding SOD, internal PRX, GRX, TRX, and RBR were expressed at similar intermediate levels (ratio of ca. 10−5) at both ECH_b and ECH_c. Statistical analyses (two-way ANOVA) confirmed significant differences in expression between genes and between species (p < 0.05), and support observations that gene expression does not vary significantly over time (p > 0.05) in Echinus Geyser.
Discussion
Spatial and temporal changes in H2O2 and other dissolved chemical species were assessed over diel cycles in 2014 and 2015, and provide the first insight regarding concentrations of H2O2 in acidic Fe(III)-oxide depositing geothermal springs of YNP. Concentrations of H2O2 ranged from ~2 to 4 μM across all Fe-oxide sites, and were significantly lower in geothermal source waters and/or in the presence of dissolved sulfide. The similar concentrations of H2O2 was likely due to similar geochemistry across the three sites [e.g., Fe(II) ~30–40 μM, pH ~3–3.5, T ~68–80°C]. The observed range in H2O2 values in acidic geothermal systems is higher than previously observed in a limited set of thermal systems supporting phototrophic activity (<300 nM; Wilson et al., 2000a), and fall within values observed in rainwater (~6 μM; King et al., 2007), freshwater (~300 nM; King et al., 2007) or coastal waters (50–150 nM; Miller et al., 2005), but are considerably higher than values in the open ocean (~0.7 nM; King et al., 2007). The Fe-oxide mat systems sampled in the current study do not contain phototrophic organisms, although small increases in DO during peak photon flux may in part, be due to inputs from adjacent phototrophic systems.
Dissolved sulfide also plays an important role regulating concentrations of H2O2 in geothermal springs. Acidic geothermal springs often contain variable amounts of dissolved sulfide originating from hydrothermal source waters. The majority of dissolved sulfide at low pH is H2S(aq), which degasses rapidly as the outflow channel equilibrates with atmospheric O2 (Inskeep et al., 2005; Nordstrom et al., 2005). Dissolved H2S can react with H2O2 (Equation 6; Hoffmann, 1977) so it is expected that high sulfide waters will have lower H2O2 levels. For example, the source waters of Beowulf Spring were highly sulfidic (60–100 μM dissolved sulfide), while no sulfide was detected at the discharge of OSP Spring and Echinus Geyser Spring (Table 2). Dissolved sulfide concentrations declined considerably from 64 to 3 μM (May sampling) and from ~100 to 7 μM (July sampling) along the transect points BE_a to BE_c. Hydrogen peroxide levels were consistently lower (~1 μM) in the presence of high sulfide (e.g., BE_a, b), suggesting that high sulfide likely acts to minimize observed aqueous concentrations of H2O2 in acid-sulfate-chloride geothermal springs.
High levels of Fe(II) near 30–40 μM in all sites (one order of magnitude higher than observed H2O2 concentrations) may also regulate levels of H2O2 via abiotic reactions. In Fe-mats from Beowulf spring, diel data suggest that the Fenton reaction (Equation 3) may contribute to small increases in Fe(III) observed during peak photon flux. In many cases, increases in dissolved H2O2 were correlated with increases in O2. For example, dissolved O2 and H2O2 both increase down gradient in thermal outflow channels, and might indicate a common mechanism. Peak O2 concentrations occurring at peak photon flux also correlated with small increases in H2O2, which suggests that photochemical reactions (e.g., Equations 1, 2) may occur in these geothermal waters to generate greater amounts of H2O2. Small increases in H2O2 were indeed noted in the Beowulf and 100 Springs Plain outflow channels with increasing photon flux, yet in the oxygenated Echinus channel, higher concentrations of H2O2 were observed at dawn.
Increases in dissolved O2 down channel result from ingassing of atmospheric O2 over the Fe(III)-oxide mats (Bernstein et al., 2013; Beam et al., 2016). However, daytime increases of O2 (and H2O2) at peak photon flux may also suggest possible inputs from adjacent phototrophic systems into the flow channel. Similarly, the increase in O2 concentrations over the day down the Echinus (ECH_b and ECH_c) and 100 Springs Plain (OSP_b) channels could be explained by oxygen inputs from adjacent phototrophic algal communities (containing members of the Cyanidiales; Castenholz and McDermott, 2010; Reeb and Bhattacharya, 2010), which exist across temperature ranges from ~38 to 56°C, but are not present in sampling positions BE_a-e. Thus, despite a constant input of surface water from the landscape across a diel cycle, these inputs may contain more O2 during daytime hours as a result of phototrophic metabolism.
Increases in O2 during the day may in part be responsible for increases in microbial growth of M. yellowstonensis and Hydrogenobaculum, which are both aerobic (Kozubal et al., 2008; Takacs-Vesbach et al., 2013; Jennings et al., 2014). Higher 16S rRNA gene expression levels of Metallosphaera compared to Hydrogenobaculum in both environments (Figure 5) were consistent with higher relative abundances of Metallosphaera observed previously in the upper ~1 mm of mature Fe(III)-oxide mats, which also corresponds to the active O2-consuming layer (Beam et al., 2016). Given the large changes in ROS that may be expected in natural environments as a function of photon flux, it is highly likely that microorganisms vary the production of enzymes known to react with these highly labile redox-active species across a diel cycle. Reactions involving ROS and Fe can represent an environmental stress for both aerobic and anaerobic organisms, leading to oxidative damage of DNA, RNA, proteins, lipids, and cofactors (Henle and Linn, 1997; Cabiscol et al., 2000; Green and Paget, 2004; Maaty et al., 2009).
Normalized expression levels of genes potentially involved in oxidative stress exhibited very few consistent trends for a given organism across sites or temporal sampling, and/or between the two different autotrophs (Figure 6). For example, in Fe-mat samples from BE-d, Metallosphaera exhibited higher relative expression levels of ROS-related genes, and both organisms showed a significant decrease in expression levels during peak photon flux (~2 p.m.). However, results from Fe-mats sampled at ECH_b (or c) behaved differently where Hydrogenobaculum exhibited higher normalized expression for the majority of ROS-related genes than Metallosphaera (Figure 6). Moreover, no major changes in expression levels for either organism were observed over time in Fe-mats from Echinus Geyser. Small changes in normalized expression occurred for Metallosphaera and Hydrogenobaculum across the three sampling times in ECH_c, but the responses were not consistent between the two autotrophs.
Interestingly, both populations appeared to exhibit less oxidative stress during peak photon flux: normalized levels of all oxidative stress transcripts were lower at the 2 p.m. sampling time, although this was not consistent in Beowulf and Echinus outflow channels. In Beowulf Spring, photochemical reactions and subsequent Fenton chemistry may thus be responsible for H2O2 formation and decay during peak photon flux, while microbially mediated H2O2 cycling may occur in morning and evenings. More replication and experimentation including nightly sampling will be necessary to develop a mechanistic understanding of the relative roles of abiotic photochemical reactions versus microbial activity in the cycling of ROS in these geothermal environments. Expression analyses of specific ROS genes indicated that M. yellowstonensis exhibits more oxidative stress response than Hydrogenobaculum in Beowulf (Figures 6A,B), but the opposite trend was observed in Fe mats from Echinus Geyser (Figures 6C–F). Although the Metallosphaera population was found to be the most active in ECH_b and c Fe(III)-oxide mats (see 16S transcripts levels in Figures 6B,C), the Hydrogenobaculum population exhibited higher levels of normalized ROS gene expression.
The gene coding for external PRX (Equation 8) was the most expressed in Metallosphaera at all sites and in Hydrogenobaculum in ECH, which suggests that extracellular H2O2 is an important source of oxidative stress over a diel cycle in these Fe(III)-oxide mats. Relative expression data show similar transcript levels of SOD (Equation 7) and internal PRX (Equation 8) in both organisms at all sites, which may indicate co-expression of these two genes to coordinate the removal of ROS inside the cell, as previously observed in the archaeon Sulfolobus solfataricus where they form an enzymatic complex (Maaty et al., 2009). Normalized expression of these two genes is higher in M. yellowstonensis than in Hydrogenobaculum in BE_d, ECH_b, and ECH_c Fe(III)-oxide mats, which may reflect a higher level of internal oxidative stress in the bacterial population, and thus a higher cellular response to mitigate ROS. Higher FDX gene transcripts detected in Hydrogenobaculum at all sites also support this hypothesis, as ferredoxin is involved in maintaining intracellular redox potentials (Maaty et al., 2009). In Hydrogenobaculum spp., both rubrerythrin (11) and ferredoxin (Equation 12) enzymes (Weinberg et al., 2004) may participate equally in Fe cycling, as indicated by comparable expression levels at all sites. The very low normalized gene expression of FDX gene (ratio of ca. 10−6) compared to RBR gene in M. yellowstonensis str. MK1 at all sites (Figure 6), suggests that ferredoxin is not the main enzyme responsible for iron homeostasis in this organism. The very similar expression levels of genes coding for GRX and TRX in both microbial populations at all sites is not surprising, as the TRX/GRX multidomain protein is an ubiquitous thiol redox system in nature (Pedone et al., 2004; Reott et al., 2009).
This is the first study to report on the concentrations of H2O2 in acidic geothermal springs of YNP, and only one study has reported on peroxide levels in other high-temperature systems (Wilson et al., 2000a,b). Clearly, additional experimentation will be necessary to develop a mechanistic understanding of factors controlling H2O2 levels in geothermal waters of high Fe systems and the implications of spatiotemporal changes in H2O2 for other ROS such as the hydroxyl radical and superoxide. This study is also the first to report expression analyses of several oxidative stress response genes in situ, and has documented the expression of specific genes known to be involved in regulation of H2O2 and Fe species in two primary chemolithoautotrophs important in the formation of high-temperature Fe(III)-oxide mats. Several of the ROS stress response genes tested have been shown to be upregulated under high H2O2 levels (~30 μM) in controlled conditions using a Sulfolobus sp. (Maaty et al., 2009), however, the H2O2 values observed in acidic Fe-oxide environments were 10-fold lower, thus difficult to compare. Regarding the widespread genetic machinery across the three domains of life to cope with oxidative stress (Pedone et al., 2004; Maaty et al., 2009), our gene expression results might suggest a more constitutive response to ROS in Fe-mat populations, and more generally during aerobic metabolism.
Author Contributions
MM, JB, ZJ, BB, EB, and WI performed field experiments. MM, JB, and BB performed laboratory analyses. MM and WI wrote the manuscript.
Conflict of Interest Statement
The authors declare that the research was conducted in the absence of any commercial or financial relationships that could be construed as a potential conflict of interest.
Acknowledgments
The authors acknowledge support from the DOE-Pacific Northwest National Laboratory (subcontracts 112443 and 254840), the Department of Energy (DOE)-Joint Genome Institute Community Sequencing Program (CSP 787081, CSP701), and the National Science Foundation IGERT Program for support to JB and ZJ (NSF DGE 0654336). Work conducted by the Pacific Northwest National Laboratory (Foundational Scientific Focus Area) and the Joint Genome Institute (DOE-AC02-05CH11231) is supported by the Genomic Science Program, Office of Biological and Environmental Research (U.S. DOE). The authors appreciate assistance from W. King (Waterville Analytical) for advice in establishing protocols for analysis of hydrogen peroxide, and thank S. Sigler and D. Hallac (Center for Resources, YNP) for permitting this work in YNP (permit YELL-SCI-5068). WI appreciates support from the Montana Agricultural Experiment Station (Project 911300).
Supplementary Material
The Supplementary Material for this article can be found online at: https://www.frontiersin.org/article/10.3389/fmars.2017.00130/full#supplementary-material
References
APHA (1998). Standard Methods for the Examination of Water and Wastewater. Washington, DC: American Public Health Association.
Beam, J. P., Bernstein, H. C., Jay, Z. J., Kozubal, M. A., Jennings, R. D., Tringe, S. G., et al. (2016). Assembly and succession of iron oxide microbial mat communities in acidic geothermal springs. Front. Microbiol. 7:25. doi: 10.3389/fmicb.2016.00025
Bernstein, H. C., Beam, J. P., Kozubal, M. A., Carlson, R. P., and Inskeep, W. P. (2013). In situ analysis of oxygen consumption and diffusive transport in high-temperature acidic iron-oxide microbial mats. Environ. Microbiol. 15, 2360–2370. doi: 10.1111/1462-2920.12109
Cabiscol, E., Tamarit, J., and Ros, J. (2000). Oxidative stress in bacteria and protein damage by reactive oxygen species. Int. Microbiol. 3, 3–8.
Cannio, R., Fiorentino, G., Morana, A., Rossi, M., and Bartolucci, S. (2000). Oxygen: friend or foe? Archaeal superoxide dismutases in the protection of intra- and extracellular oxidative stress. Front. Biosci. 5, D768–D779. doi: 10.2741/cannio
Castenholz, R. W., and McDermott, T. R. (2010). The cyanidiales: ecology, biodiversity, and biogeography. Red Algae Genomic Age 13, 357–371. doi: 10.1007/978-90-481-3795-4_19
Cornelis, P., Wei, Q., Andrews, S. C., and Vinckx, T. (2011). Iron homeostasis and management of oxidative stress response in bacteria. Metallomics 3, 540–549. doi: 10.1039/c1mt00022e
D'autréaux, B., and Toledano, M. B. (2007). ROS as signalling molecules: mechanisms that generate specificity in ROS homeostasis. Nat. Rev. Mol. Cell Biol. 8, 813–824. doi: 10.1038/nrm2256
Galaris, D., and Pantopoulos, K. (2008). Oxidative stress and iron homeostasis: mechanistic and health aspects. Crit. Rev. Clin. Lab. Sci. 45, 1–23. doi: 10.1080/10408360701713104
Green, J., and Paget, M. S. (2004). Bacterial redox sensors. Nat. Rev. Microbiol. 2, 954–966. doi: 10.1038/nrmicro1022
Henle, E. S., and Linn, S. (1997). Formation, prevention, and repair of DNA damage by iron hydrogen peroxide. J. Biol. Chem. 272, 19095–19098. doi: 10.1074/jbc.272.31.19095
Hoffmann, M. R. (1977). Kinetics and mechanism of oxydation of hydrogen-sulfide by hydrogen-peroxide in acidic solution. Environ. Sci. Technol. 11, 61–66. doi: 10.1021/es60124a004
Inskeep, W. P., Ackerman, G. G., Taylor, W. P., Kozubal, M., Korf, S., and Macur, R. E. (2005). On the energetics of chemolithotrophy in nonequilibrium systems: case studies of geothermal springs in Yellowstone National Park. Geobiology 3, 297–317. doi: 10.1111/j.1472-4669.2006.00059.x
Inskeep, W. P., Jay, Z. J., Herrgard, M. J., Kozubal, M. A., Rusch, D. B., Tringe, S. G., et al. (2013). Phylogenetic and functional analysis of metagenome sequence from high-temperature archaeal habitats demonstrate linkages between metabolic potential and geochemistry. Front. Microbiol. 4, 95. doi: 10.3389/fmicb.2013.00095
Inskeep, W. P., Rusch, D. B., Jay, Z. J., Herrgard, M. J., Kozubal, M. A., Richardson, T. H., et al. (2010). Metagenomes from high-temperature chemotrophic systems reveal geochemical controls on microbial community structure and function. PLoS ONE 5:e9773. doi: 10.1371/journal.pone.0009773
Jay, Z. J., Rusch, D. B., Tringe, S. G., Bailey, C., Jennings, R. M., and Inskeep, W. P. (2014). Predominant acidilobus-like populations from geothermal environments in yellowstone national park exhibit similar metabolic potential in different hypoxic microbial communities. Appl. Environ. Microbiol. 80, 294–305. doi: 10.1128/AEM.02860-13
Jennings, R. M., Whitmore, L. M., Moran, J. J., Kreuzer, H. W., and Inskeep, W. P. (2014). Carbon dioxide fixation by metallosphaera yellowstonensis and acidothermophilic iron-oxidizing microbial communities from Yellowstone National Park. Appl. Environ. Microbiol. 80, 2665–2671. doi: 10.1128/AEM.03416-13
Kehrer, J. P. (2000). The Haber-Weiss reaction and mechanisms of toxicity. Toxicology 149, 43–50. doi: 10.1016/S0300-483X(00)00231-6
Kempes, C. P., Okegbe, C., Mears-Clarke, Z., Follows, M. J., and Dietrich, L. E. P. (2014). Morphological optimization for access to dual oxidants in biofilms. Proc. Natl. Acad. Sci. U.S.A. 111, 208–213. doi: 10.1073/pnas.1315521110
King, D. W., Cooper, W. J., Rusak, S. A., Peake, B. M., Kiddle, J. J., O'sullivan, D. W., et al. (2007). Flow injection analysis of H2O2 in natural waters using acridinium ester chemiluminescence: method development and optimization using a kinetic model. Anal. Chem. 79, 4169–4176. doi: 10.1021/ac062228w
Kocar, B. D., and Inskeep, W. P. (2003). Photochemical oxidation of As(III) in ferrioxalate solutions. Environ. Sci. Technol. 37, 1581–1588. doi: 10.1021/es020939f
Kozubal, M. A., Macur, R. E., Jay, Z. J., Beam, J. P., Malfatti, S. A., Tringe, S. G., et al. (2012). Microbial iron cycling in acidic geothermal springs of Yellowstone National Park: integrating molecular surveys, geochennical processes, and isolation of novel Fe-active microorganisms. Front. Microbiol. 3:109. doi: 10.3389/fmicb.2012.00109
Kozubal, M., Macur, R. E., Korf, S., Taylor, W. P., Ackerman, G. G., Nagy, A., et al. (2008). Isolation and distribution of a novel iron-oxidizing crenarchaeon from acidic geothermal springs in Yellowstone National Park. Appl. Environ. Microbiol. 74, 942–949. doi: 10.1128/AEM.01200-07
Maaty, W. S., Wiedenheft, B., Tarlykov, P., Schaff, N., Heinemann, J., Robison-Cox, J., et al. (2009). Something old, something new, something borrowed; how the thermoacidophilic archaeon sulfolobus solfataricus responds to oxidative stress. PLoS ONE 4:e6964. doi: 10.1371/journal.pone.0006964
Macur, R. E., Jay, Z. J., Taylor, W. P., Kozubal, M. A., Kocar, B. D., and Inskeep, W. P. (2013). Microbial community structure and sulfur biogeochemistry in mildly-acidic sulfidic geothermal springs in Yellowstone National Park. Geobiology 11, 86–99. doi: 10.1111/gbi.12015
Macur, R. E., Langner, H. W., Kocar, B. D., and Inskeep, W. P. (2004). Linking geochemical processes with microbial community analysis: successional dynamics in an arsenic-rich, acid-sulphate-chloride geothermal spring. Geobiology 2, 163–177. doi: 10.1111/j.1472-4677.2004.00032.x
Miller, G. W., Morgan, C. A., Kieber, D. J., King, D. W., Snow, J. A., Heikes, B. G., et al. (2005). Hydrogen peroxide method intercomparision study in seawater. Mar. Chem. 97, 4–13. doi: 10.1016/j.marchem.2005.07.001
Miller, M. P., McKnight, D. M., Chapra, S. C., and Williams, M. W. (2009). A model of degradation and production of three pools of dissolved organic matter in an alpine lake. Limnol. Oceanogr. 54, 2213–2227. doi: 10.4319/lo.2009.54.6.2213
Nordstrom, D. K., Ball, J. W., and McCleskey, R. B. (2005). “Ground water to surface water: Chemistry of thermal outflows in Yellowstone National Park,” in Geothermal Biology and Geochemistry of Yellowstone National Park, eds. W. P. Inskeep and T. R. McDermott (Bozeman, MT: Thermal Biology Institute, Montana State University), 73–94.
Pedone, E., Bartolucci, S., and Fiorentino, G. (2004). Sensing and adapting to environmental stress: the archaeal tactic. Front. Biosci. 9, 2909–2926. doi: 10.2741/1447
Reeb, V., and Bhattacharya, D. (2010). “The Thermo-acidophilic Cyanidiophyceae (Cyanidiales),” in Red Algae in the Genomic Age, eds. J. Seckbach and D. J. Chapman (Berlin: Springer), 409–426.
Reott, M. A., Parker, A. C., Rocha, E. R., and Smith, C. J. (2009). Thioredoxins in redox maintenance and survival during oxidative stress of Bacteroides fragilis. J. Bacteriol. 191, 3384–3391. doi: 10.1128/JB.01665-08
Slesak, I., Slesak, H., and Kruk, J. (2012). Oxygen and hydrogen peroxide in the early evolution of life on earth: in silico comparative analysis of biochemical pathways. Astrobiology 12, 775–784. doi: 10.1089/ast.2011.0704
Takacs-Vesbach, C., Inskeep, W. P., Jay, Z. J., Herrgard, M. J., Rusch, D. B., Tringe, S. G., et al. (2013). Metagenome sequence analysis of filamentous microbial communities obtained from geochemically distinct geothermal channels reveals specialization of three aquificales lineages. Front. Microbiol. 4:84. doi: 10.3389/fmicb.2013.00084
To, T. B., Nordstrom, D. K., Cunningham, K. M., Ball, J. W., and McCleskey, R. B. (1999). New method for the direct determination of dissolved Fe(III) concentration in acid mine waters. Environ. Sci. Technol. 33, 807–813. doi: 10.1021/es980684z
Weinberg, M. V., Jenney, F. E., Cui, X. Y., and Adams, M. W. W. (2004). Rubrerythrin from the hyperthermophilic archaeon Pyrococcus furiosus is a rubredoxin-dependent, iron-containing peroxidase. J. Bacteriol. 186, 7888–7895. doi: 10.1128/JB.186.23.7888-7895.2004
Wilson, C. L., Hinman, N. W., Cooper, W. J., and Brown, C. F. (2000a). Hydrogen peroxide cycling in surface geothermal waters of Yellowstone National Park. Environ. Sci. Technol. 34, 2655–2662. doi: 10.1021/es9906397
Wilson, C. L., Hinman, N. W., and Sheridan, R. P. (2000b). Hydrogen peroxide formation and decay in iron-rich geothermal waters: the relative roles of abiotic and biotic mechanisms. Photochem. Photobiol. 71, 691–699. doi: 10.1562/0031-8655(2000)0710691HPFADI2.0.CO2
Keywords: hydrogen peroxide, acidic geothermal springs, iron-oxide microbial mats, oxidative stress, autotrophs, diel cycle
Citation: Meslé MM, Beam JP, Jay ZJ, Bodle B, Bogenschutz E and Inskeep WP (2017) Hydrogen Peroxide Cycling in High-Temperature Acidic Geothermal Springs and Potential Implications for Oxidative Stress Response. Front. Mar. Sci. 4:130. doi: 10.3389/fmars.2017.00130
Received: 19 August 2016; Accepted: 19 April 2017;
Published: 10 May 2017.
Edited by:
Julia M. Diaz, Skidaway Institute of Oceanography, USAReviewed by:
Emily J. Fleming, California State University, Chico, USAChristian Schlosser, GEOMAR Kiel, Germany
Bradley B. Tolar, Stanford University, USA
Copyright © 2017 Meslé, Beam, Jay, Bodle, Bogenschutz and Inskeep. This is an open-access article distributed under the terms of the Creative Commons Attribution License (CC BY). The use, distribution or reproduction in other forums is permitted, provided the original author(s) or licensor are credited and that the original publication in this journal is cited, in accordance with accepted academic practice. No use, distribution or reproduction is permitted which does not comply with these terms.
*Correspondence: William P. Inskeep, binskeep@montana.edu
†Present Address: Margaux M. Meslé, Center for Biofilm Engineering, Montana State University, Bozeman, MT, USA
Jacob P. Beam, Bigelow Laboratory, East Boothbay, ME, USA
Zackary J. Jay, Chemical and Biological Engineering, Montana State University, Bozeman, MT, USA
Eric Bogenschutz, University of Utah, Salt Lake City, UT, USA