A Comprehensive Survey of Pelagic Megafauna: Their Distribution, Densities, and Taxonomic Richness in the Tropical Southwest Indian Ocean
 Sophie Laran1*
  Matthieu Authier1 Olivier Van Canneyt1
  Ghislain Dorémus1 Pierre Watremez2 Vincent Ridoux1,3
- 1Observatoire PELAGIS, UMS 3462 Centre National de la Recherche Scientifique—Université de la Rochelle, La Rochelle, France
- 2Agence française pour la biodiversité, Brest, France
- 3Centre d'Etude Biologique de Chizé, UMR 7273 Centre National de la Recherche Scientifique—Université de La Rochelle, La Rochelle, France
The distribution and density of pelagic megafauna (marine mammals, seabirds, elasmobranches, and sea turtles) are important indicators of marine biodiversity, reflecting the condition of the underlying ecosystems. A dedicated aerial survey was conducted in the tropical Southwest Indian Ocean to map their distribution, the taxonomic diversity, and to estimate their densities to serve as a baseline for the area. This large survey across three ecological sub-regions revealed contrasting spatial distributions: maps of taxonomic richness of marine mammals and seabirds revealed different “hotspots” in the area. Densities were estimated for eight cetacean taxa with small and large Delphininae, or small Globicephalinae dominating, and for seven seabird taxa, with terns and noddies dominating. At the community level, the Southwest Indian Ocean megafauna was structured by the marine environment with strong differences between the Mozambique Channel and the Mascarene Islands, or between shelf and slope/oceanic habitats. Our results illustrate how multi-taxa aerial surveys are relevant and cost-effective monitoring tools for marine megafauna, allowing a community-wide approach.
Introduction
Marine megafauna, defined here as seabirds, marine mammals, sea turtles, and large elasmobranchs, share a number of major conservation issues worldwide. Most notably, these species are subjected to pressures from the increasing intensity of human activity in the ocean (Halpern et al., 2008). Because of their general demographic strategies based on high adult survival and low fecundity rates, marine megafauna are generally characterized by a low resilience, i.e., poor capacity to recover from stressors (Lewison et al., 2004). Owing to their comparatively large size and relative availability at the sea surface these animals can be more easily monitored than the vast majority of species inhabiting marine ecosystems, in particular in offshore waters. In addition, since they are considered to be sentinel species (Bossart, 2011) their status can inform on the status of whole ecosystem. Indeed marine megafauna could be considered as umbrella species (Zacharias and Roff, 2001; Branton and Richardson, 2011) because their effective conservation should incorporate the conservation of a suite of lower trophic level species and associated ecosystem services. Moreover, top predators can play a key role in maintaining biodiversity patterns by either top-down control or behaviorally mediated mechanisms (Heithaus et al., 2008). In spite of the fact that the animals' availability for detection at the surface needs to be corrected for in order to generate robust numerical data, aerial surveys nevertheless represent a good opportunity to work simultaneously on several taxa of marine megafauna.
Nearly half of the world's oceans lie in tropical regions which are generally oligotrophic ecosystems (Longhurst and Pauly, 1987). However, overall biodiversity (number of species) is higher at middle-to-tropical latitudes, particularly in oceanic habitats (Tittensor et al., 2010). Toothed cetaceans (odontocetes) are predicted be more diverse in waters from 30°N–30°S (Kaschner et al., 2011); shark diversity is higher at sub-tropical latitudes (Lucifora et al., 2011) and marine turtles' breeding range is restricted to tropical and sub-tropical habitats. On the other hand, seabirds are more diverse and more abundant in temperate to cold waters than they are in the tropics (Karpouzi et al., 2007). The Southwest (SW) Indian Ocean is considered a hotspot of biodiversity for marine megafauna (Bourjea et al., 2011; Le Corre et al., 2012). Some major conservation initiatives have been implemented in the area so far, such as the Indian Ocean Whale Sanctuary established by the IWC (International Whaling Commission), regional cooperation for the conservation of cetaceans and dugongs supported by the Indian Ocean Commission [consisting of Comoros, La Réunion (France), Madagascar, Mauritius, and the Seychelles], and the IOSEA Marine Turtles (MoU on the Conservation and Management of Marine Turtles and their Habitats of the Indian Ocean and South-East Asia). In order to make informed and timely conservation decisions, it is crucial to estimate megafauna richness and density in this region. In particular an informed baseline, even if it does not reflect a pristine state, is required to monitor and assess future ecosystem changes.
A number of previous studies on the distribution of cetaceans and other pelagic megafauna have been conducted in the wider area, especially since the Indian Ocean Whale Sanctuary was established in 1979 (Leatherwood and Donovan, 1991). Nevertheless, the number of surveys dedicated to cetaceans was considered disproportionately low in the region (Kaschner et al., 2012). To fill this knowledge gap, we used an efficient but comprehensive survey design. The first goal of this study was to establish a baseline map of the diversity and densities of marine mammals, seabirds, elasmobranchs, and turtles in the Southwest Indian Ocean. Our study was part of a larger initiative, the REMMOA (Recensement des Mammifères marins et autre Mégafaune pélagique par Observation Aérienne) surveys conducted in the Caribbean-Guiana, SW Indian Ocean, French Polynesia (Mannocci et al., 2013a,b, 2014) and Southwest Pacific. The rationales for developing such multi-taxon surveys using a standardized methodology were (i) to maximize cost-effectiveness and (ii) to collate information on a large range of taxa. A previous study investigated the preferences of three groupings of cetaceans and five groupings of seabirds using habitat modeling (Mannocci et al., 2013a). In this study we documented the taxonomic richness in several habitats of the SW Indian Ocean and used design-based density of 18 different groups of megafauna: 8 of cetaceans, 5 of seabirds, 3 of elasmobranchs, and 2 of turtles, to determine how their assemblage changed across this vast region.
Materials and Methods
Study Area and Survey Design
The region of interest is located in the SW Indian Ocean, from the Northern Seychelles Islands, to the Mascarene Islands, and the Mozambique Channel extending over 5 million km2 from latitude 2–24°S and longitude 40–60°E (Figure 1). It encompasses extensive parts of the Exclusive Economic Zone (EEZ) of the five countries of the Indian Ocean Commission (Comoros, Madagascar, Mauritius, La Réunion, and Seychelles). Our study area covered three distinct contrasting ecoregions of the Longhurst classification: the East African coastal province, the Indian South Subtropical Gyre, and the Indian Monsoon Gyre regions (Longhurst, 1998, Figure 1). Effort was split into six survey blocks totaling 1.4 million km2 that were selected on ecosystemic and logistical grounds (Figure 1; Table 1) with: (1) three survey blocks located along the west coast of Madagascar in the Eastern African ecoregion: the Northern Mozambique Channel block (NMC, 275,000 km2) around the Comoros Archipelago and the Glorieuses Islands (France) which was covered from mid-December to the beginning of January; the Central Mozambique Channel (CMC, 123,000 km2), which includes Juan de Nova Island (France) and the Southern Mozambique Channel (SMC, 153,000 km2) with Europa Island and Bassas da India atoll (France), both of which were covered from end of January to the beginning of February; (2) one survey block including in the Seychelles the Granitic Islands (central position on the Seychelles Bank) and north of Amirantes Islands, representing the productive Indian Monsoon Gyre (SE, 294,000 km2), all covered from end of March to beginning of April; and (3) the last two survey blocks covered the oligotrophic Indian South Subtropical Gyre from the end of February to the end of March: these spanned the Tromelin Island (France) to the East Coast of Madagascar (TM, 153,000 km2) and around the Mascarene Islands (MAS, 407,000 km2) including La Réunion (France) and the Island of Mauritius including its outer Island, St Brandon. Each block was sub-divided into bathymetric strata: shelf (<200 m), slope (from 200 to 2,000 m) and oceanic (>2,000 m) strata (Figure 1). This subdivision resulted in a total of 22 strata.
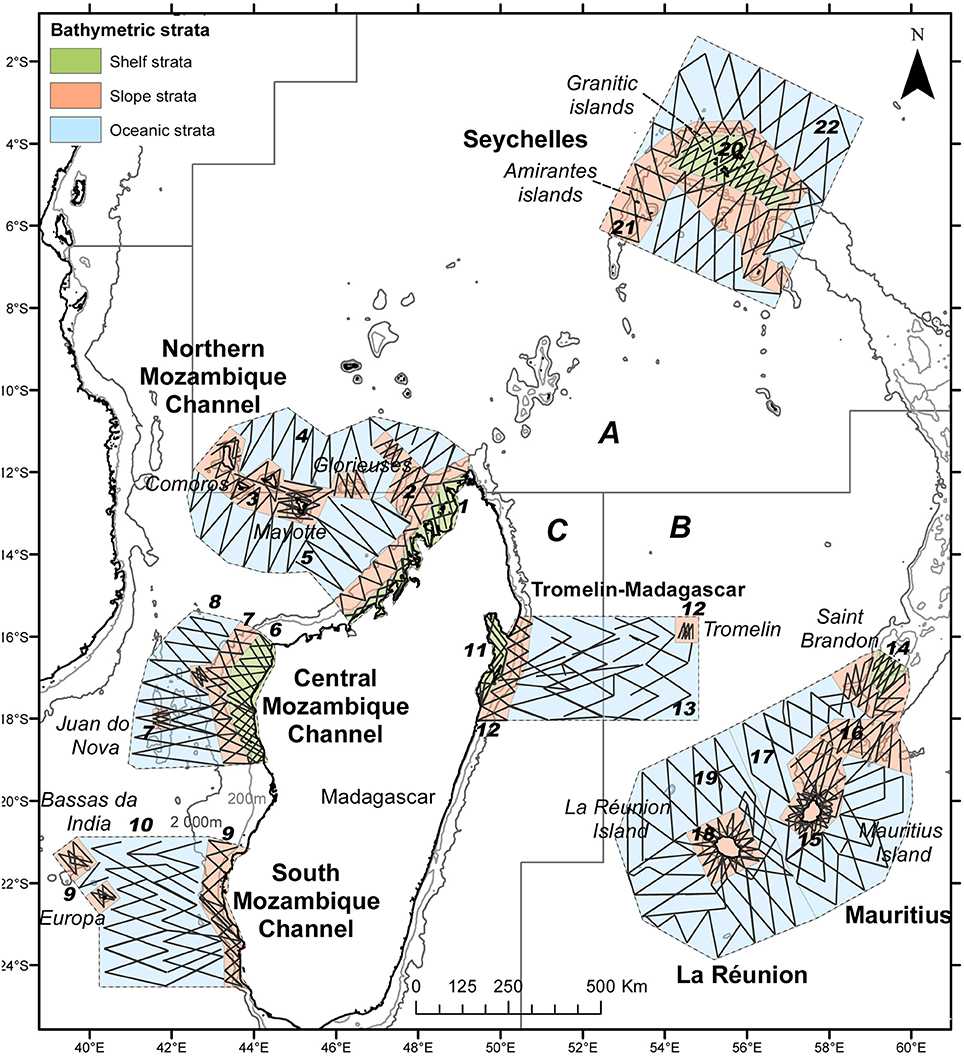
Figure 1. Study area and effort conducted during the REMMOA aerial survey in the SW Indian Ocean. Numbers refer to strata codes used for analysis and letters to the Longhurst Biogeographical Provinces (from http://www.marineregions.org) with A—the Indian Monsoon Gyres Province, B—the Indian South Subtropical Gyre Province, and C—the East Africa Coastal Province.
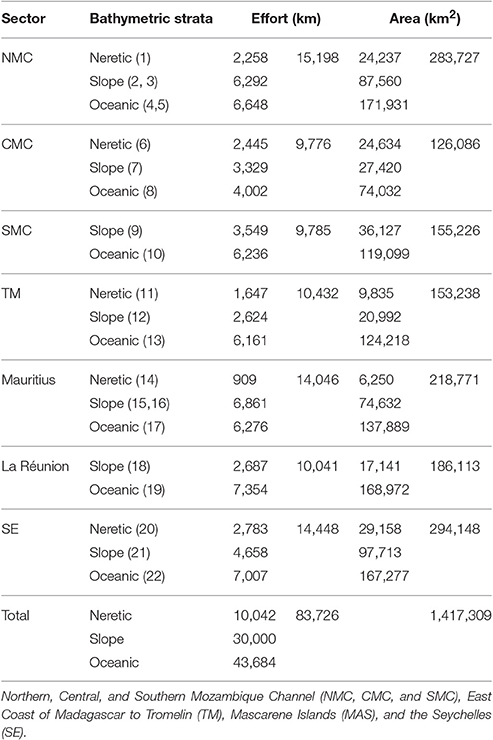
Table 1. Area of surveyed blocks and bathymetric strata, with corresponding effort selected for analysis.
The survey was conducted during the austral summer (December 2009–April 2010), in order to guarantee good conditions for aerial sighting detection. In consequence some species such as large migratory whales undertake annual migration to high latitude summer feeding areas and have been almost not encountered during the survey. But for some other highly migratory species the chosen survey period represents a key explanatory parameter in interpreting their distribution and relative abundance in each survey block.
A total survey line effort of c. 89,000 km was conducted among survey blocks and strata in such a way that habitats expected to have lower density of top predators (Chla-depleted oceanic waters) would receive proportionately more effort than habitats with high expected cetacean densities. In addition search effort was optimized with a zigzag track layout. To minimize logistical constraints for planes and increase effort, several transects were flown twice or more but only effort collected for two replicates of the same transect were retained for the analysis. No ethics approval was needed as the research did not involve animal subjects.
Aerial Survey Protocol
Surveys were carried out following a standard line-transect methodology (Buckland et al., 2001) with aircraft speed (167 km h−1/90 knots) and altitude (182 m/600 feet) similar to previous large-scale aerial surveys dedicated to marine mammals in European waters (Hammond et al., 2013) or to megafauna (e.g. Laran et al., in press). This approach represents a good compromise between safety constraints (related to low-level flights) and the choice to extend the survey to non-mammal taxa including seabirds, sea turtles, and large elasmobranchs. Nonetheless, seabird sightings were collected following a strip-transect methodology in order to minimize disrupting the attention of observers. Transects were flown using high-wing aircraft (BN2) equipped with bubble windows. The survey crew consisted of two trained observers searching with the naked eye and a navigator collecting data on a laptop computer equipped with “VOR” software developed for the aerial part of the SCANS-II survey (Hammond et al., 2013). The aircraft's position was recorded every 2 s using an on-board GPS device. Beaufort Sea state, glare severity, turbidity, cloud cover, and subjective sighting conditions (an overall subjective assessment of the detection conditions: good, moderate, or poor as for small Delphinids) were recorded at the beginning of each transect and whenever any of these parameters changed. A fourth, off duty crew member was also present to enable the rotation of crew members every hour to limit any loss of vigilance due to observer fatigue. Perpendicular distances obtained from clinometers were collected by observers for marine mammals, sea turtles, and elasmobranchs. For seabird data collected in strip transect mode, all encounters located within 200 m of the aircraft's track line (marked on the landing gear) were assumed to be detected. Species identification was made to the lowest taxonomic level whenever possible, but groupings were inevitable for several taxa that could not be told apart from the air. For marine mammals nine groups were considered: small Delphininae, large Delphininae, small Globicephalinae, Risso's dolphin, large Globicephalinae, beaked whale, sperm whale, Kogia spp., and dugongs (cf. Supplementary Table 2 for the list of species). For seabirds: seven groups comprised brown terns, gray terns, noddies, petrels and shearwaters, tropicbirds, boobies, frigatebirds (cf. Supplementary Table 3 for the list of species). Finally a “hard-shelled group,” mainly green turtles in the area (Bourjea, 2015) and leatherback turtles, were considered in addition to manta rays, unidentified rays, whale sharks, hammerhead sharks, and unidentified sharks (cf. Supplementary Table 4 for the list of species).
Data Analysis
Individuals encountered were mapped across the six survey blocks for the main taxa over a grid of 60 × 60 km to optimize homogenous effort among cells, in order to visualize their distribution as determined by the aerial survey in the region. From the detection data on each species in each cell, cumulative taxonomic richness was modeled with occupancy models (MacKenzie et al., 2002) over the entire region using averages of depth, slope, and distance to 200 m isobaths within each cell. Occupancy modeling was undertaken in order to better describe any hotspots for megafauna diversity in the area.
For density estimation, 83,726 km of line transect effort were retained for analysis. This effort was mainly conducted in slope (36%) and oceanic strata (52%) and under good sea state (95% of the effort in Beaufort conditions ≤3, 74% with Beaufort conditions of 0–2) thereby limiting variation in perception bias. The strip transect methodology for seabirds implied perfect detection within 2 × 200 m bands (i.e., one on either side of the aircraft). For other taxa, sightings with larger perpendicular distances were truncated (≈5% of sightings) and were excluded (Buckland et al., 2001). Detection curves and effective strip half-widths (esw) were estimated for eight marine mammal taxa, five elasmobranch taxa, the hard-shelled group, and leatherback sea turtles using Distance sampling software (Thomas et al., 2010). When the effect of meteorological conditions (sea state, glare severity, or subjective sighting condition) or group size were statically significant (at 5% level), Multiple Covariate Distance Sampling was used (Marques and Buckland, 2004). The best models were selected using the Akaike Information Criterion (AIC). Mean or regressed pod size against g(x) (when significant), was estimated for each survey block and each strata within a block, if significant (Z-Test).
Detection probability on the track line, g(0), is typically composed of the perception bias (the proportion of animals available for detection at the surface on the transect line but missed by the observers) and the availability bias (the proportion of animals present on the transect line but not available for detection at the visible subsurface or surface). We only corrected for the latter using crude estimates from the literature (Penguiness book web site, Ropert-Coudert and Kato, 2012): the average diurnal proportion of time spent at the surface for the different relevant species or groups of species were used as a correction factor for availability bias (Table 2 and Supplementary Table 1 for details).
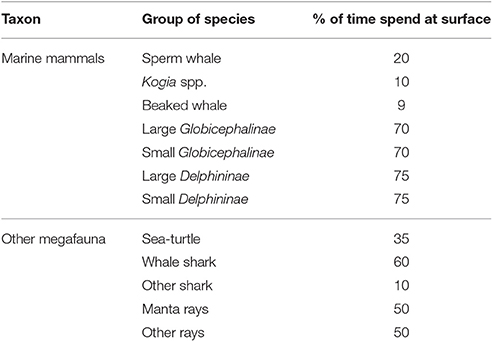
Table 2. Correction bias factor estimated for availability of taxonomic groups, from average proportion of time spend at surface collected in the literature (see Supplementary Table 1).
To examine regional patterns in the megafauna community we compared, as sampling stations, 22 spatial units corresponding to bathymetric strata with a sufficient amount of effort (i.e., >900 km) among the survey blocks (Figure 1; Table 1). For each stratum the community assemblage was investigated with Principal Component Analysis (PCA) using the ADE4 package for R, after centering and standardizing the estimated densities of 18 groups of megafauna: eight cetacean groups, five seabird groups, three groups of elasmobranchs, and two of turtles. Hammerhead sharks were included within the sharks group and manta rays with rays.
Results
A total of 1,148 sightings of marine mammals, 16,507 sightings of seabirds, 799 of turtles, and 328 sightings of elasmobranchs were recorded along a total transect length of 89,000 km (Supplementary Tables 2–4).
Marine Mammals
Nineteen marine mammal taxa were identified during the entire survey (Supplementary Table 2). The highest diversity was encountered in the North Mozambique Channel (NMC) and Seychelles (SE) blocks, with 14 taxa. Predicted occupancy over the entire region suggested hotspots of taxonomic richness in the Mozambique Channel and Seychelles with more than five taxa in most of the cells, compared to only 2–3 taxa on average in the Mascarene (MAS) and Tromelin (TM; Figure 2A) regions surveyed.
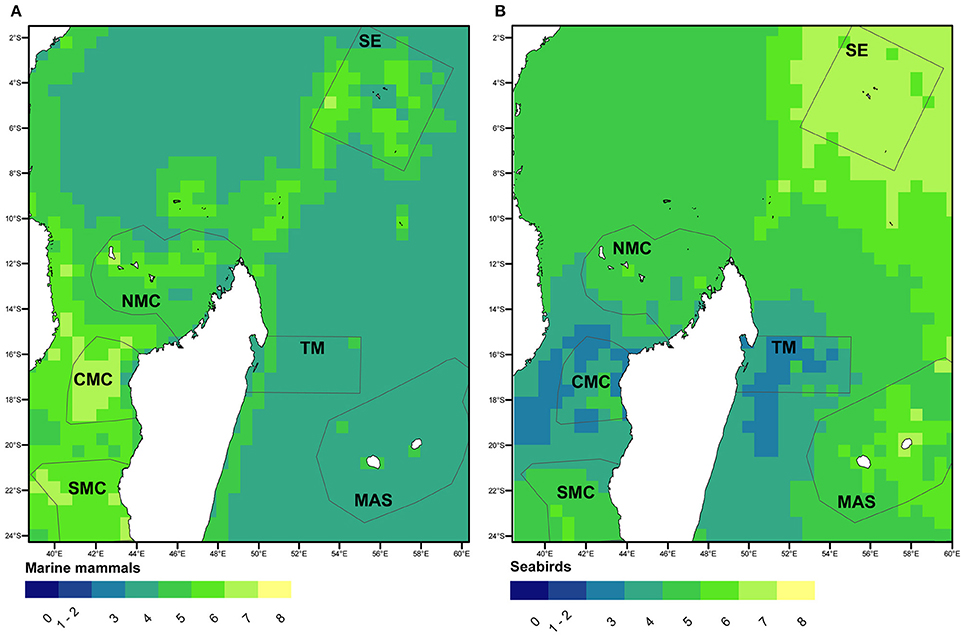
Figure 2. Predicted taxonomic richness from occupancy analyse of marine mammals (A) and seabirds (B) within and outside the survey blocks of the SW Indian Ocean.
Higher numbers of individuals per unit effort were also obtained in the Mozambique Channel and Seychelles (Figure 3A). There were substantial variations among survey blocks: Delphininae and Globicephalinae were more prevalent in the Mozambique Channel and the Seychelles than in the Mascarene. In contrast deep divers (i.e., sperm whales, Kogia spp. or beaked whales) did not show much difference between survey blocks (Supplementary Figure 1). The dugong (Dugong dugon) was recorded exclusively along the northwestern coast of Madagascar and one sighting in the Comoros (NMC).
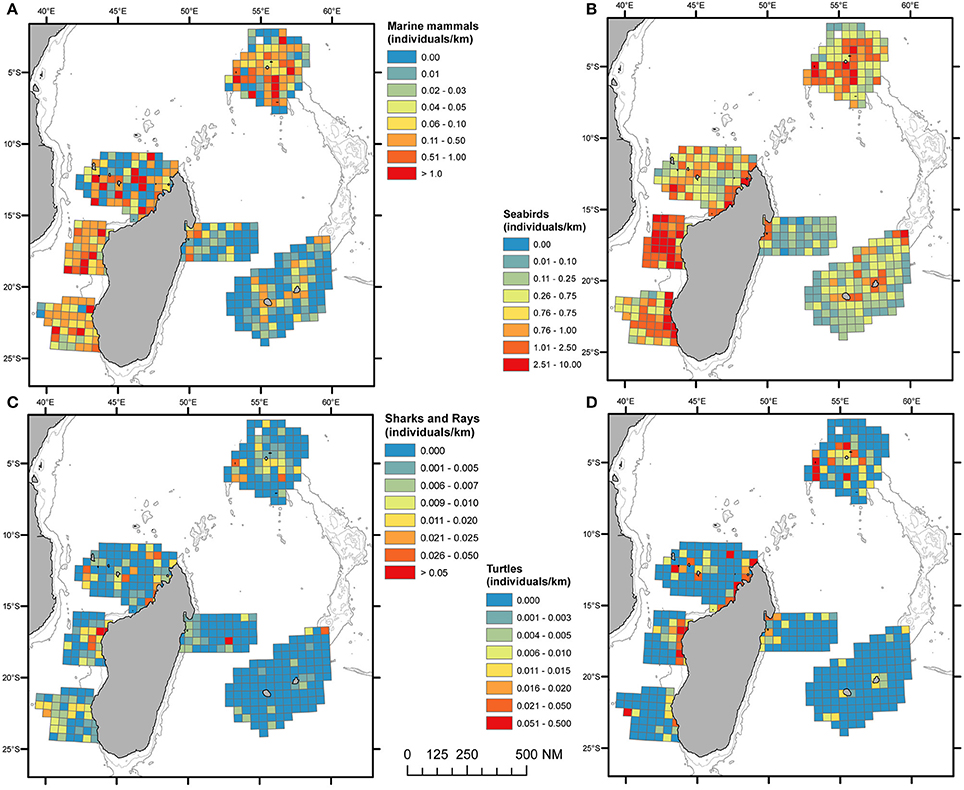
Figure 3. Spatial distribution of marine mammals (A), sea birds (B), elasmobranchs (C), and sea turtles (D), in the SW Indian Ocean. Each pooled on 60 × 60 km grid cell and given in individuals per kilometer. Cells accounting for a minimum effort of 50 km.
Across the eight detection functions derived for cetacean species, subjective sighting condition, and glare severity were the only two statistically significant covariates (Supplementary Figure 3). Higher densities of marine mammals (uncorrected for availability bias) were found in the Seychelles and Mozambique Channel blocks (Table 3). The density of Delphininae peaked at 0.10 individual km−2 in Mozambique Channel and Seychelles, with small Delphininae avoiding the SMC and large Delphininae the NMC. Small Globicephalinae reached densities >0.10 individual km2 in the NMC and CMC blocks, but densities of large Globicephalinae peaked in the Indian Monsoon Gyre survey block (SE; 0.07 individual km−2). Beaked whale densities showed less contrasting densities between survey blocks with a maximum occurrence in the Mozambique Channel. Densities of sperm whales peaked in the TM and SE survey blocks. Finally the density of Kogia was highest in the SE survey block (0.002 individual km−2).
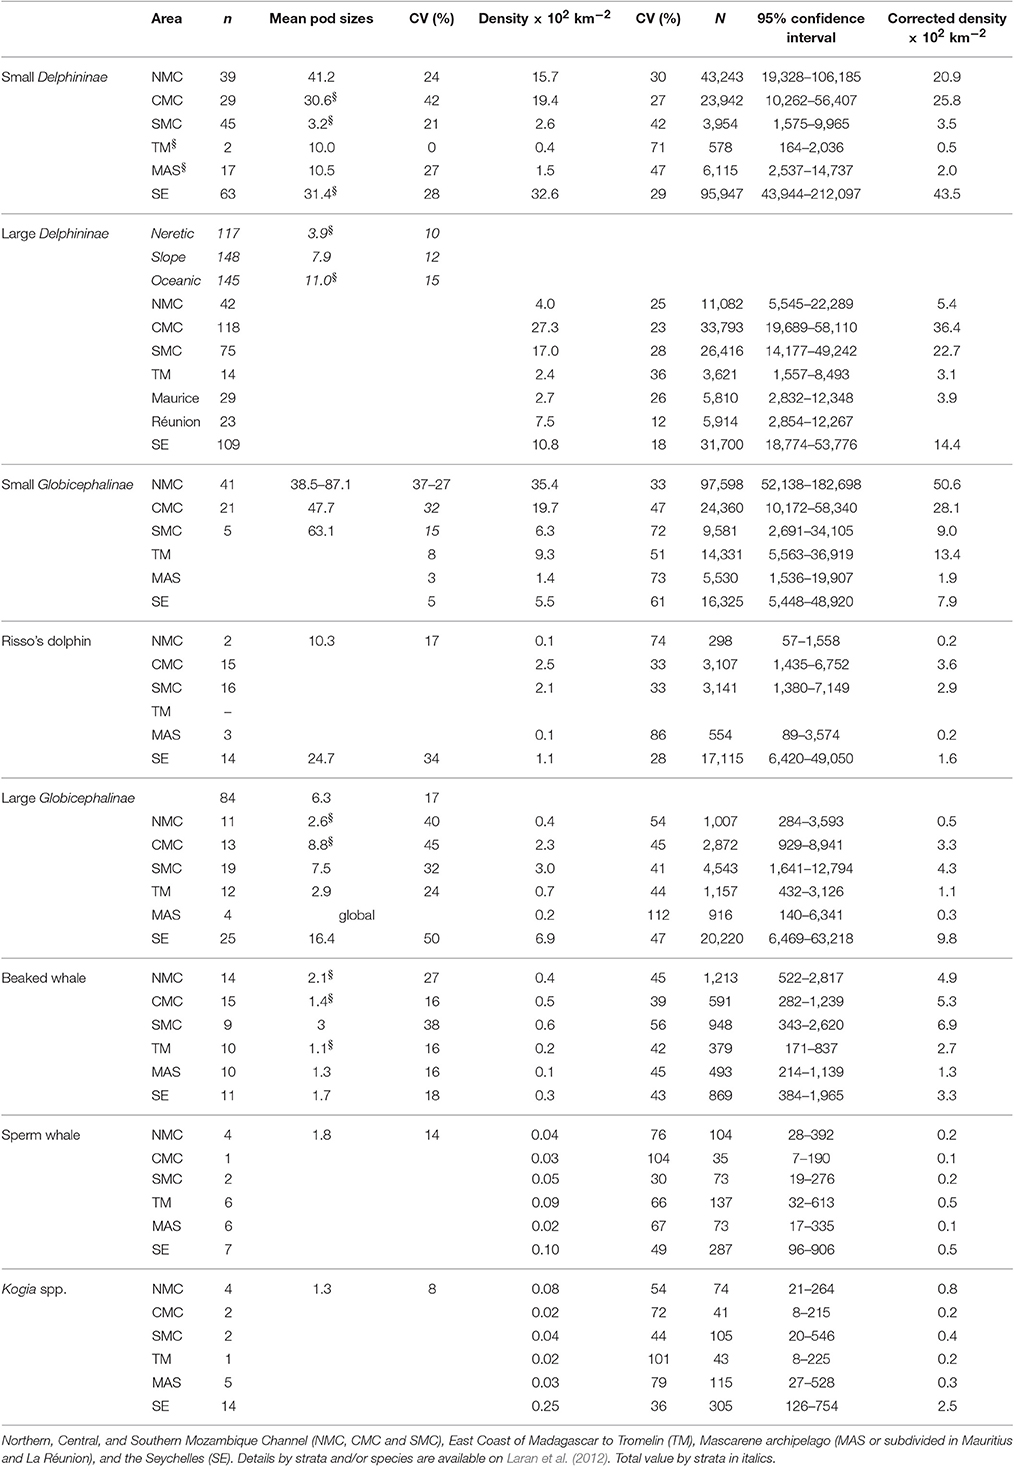
Table 3. Results obtained for cetaceans: sightings number (n) mean or regressed (marked with §) pod size, uncorrected densities with corresponding relative abundance (N) estimated per taxonomic group and survey blocks and corrected density considering different availability bias factor per species.
Seabirds
A total of 12 seabird species or groups of species were identified (Supplementary Table 3). Apart from the Hydrobatidae all groups were recorded in every survey block. Seabird taxonomic richness patterns contrasted with those of marine mammals (Figure 2B). Although, seabirds were abundant across the whole region occupancy modeling predicted the Seychelles as a hotspot, while the middle latitudes of Madagascar (CMC and TM) were a “colder” spot. With respect to sightings of seabirds, the highest number of individuals per unit of effort was encountered in the central Mozambique Channel (CMC; Figure 3B). Extensive variations were found between survey blocks for most taxa (Table 4, Supplementary Figure 2). “Brown” terns (Onychoprion spp.) were detected in all surveyed areas but peaked in CMC with a density of 4.3 individual km−2. “Gray” terns (Sterna spp., Thalasseus bergii, Gygis alba) were preferentially encountered in shelf waters off Madagascar while including G. alba in the Seychelles resulted in a more oceanic distribution pattern. “Gray” tern densities over the Mozambique Channel and the Seychelles survey blocks (0.5–0.9 individual km−2) were 10 times higher than east of Madagascar (Table 4). Noddies had their strongholds in Seychelles, while Procellariidae were the most abundant seabird grouping around La Réunion Island. Tropicbirds, boobies, and frigatebirds showed densities ≤0.05 individual km−2 at their highest levels.
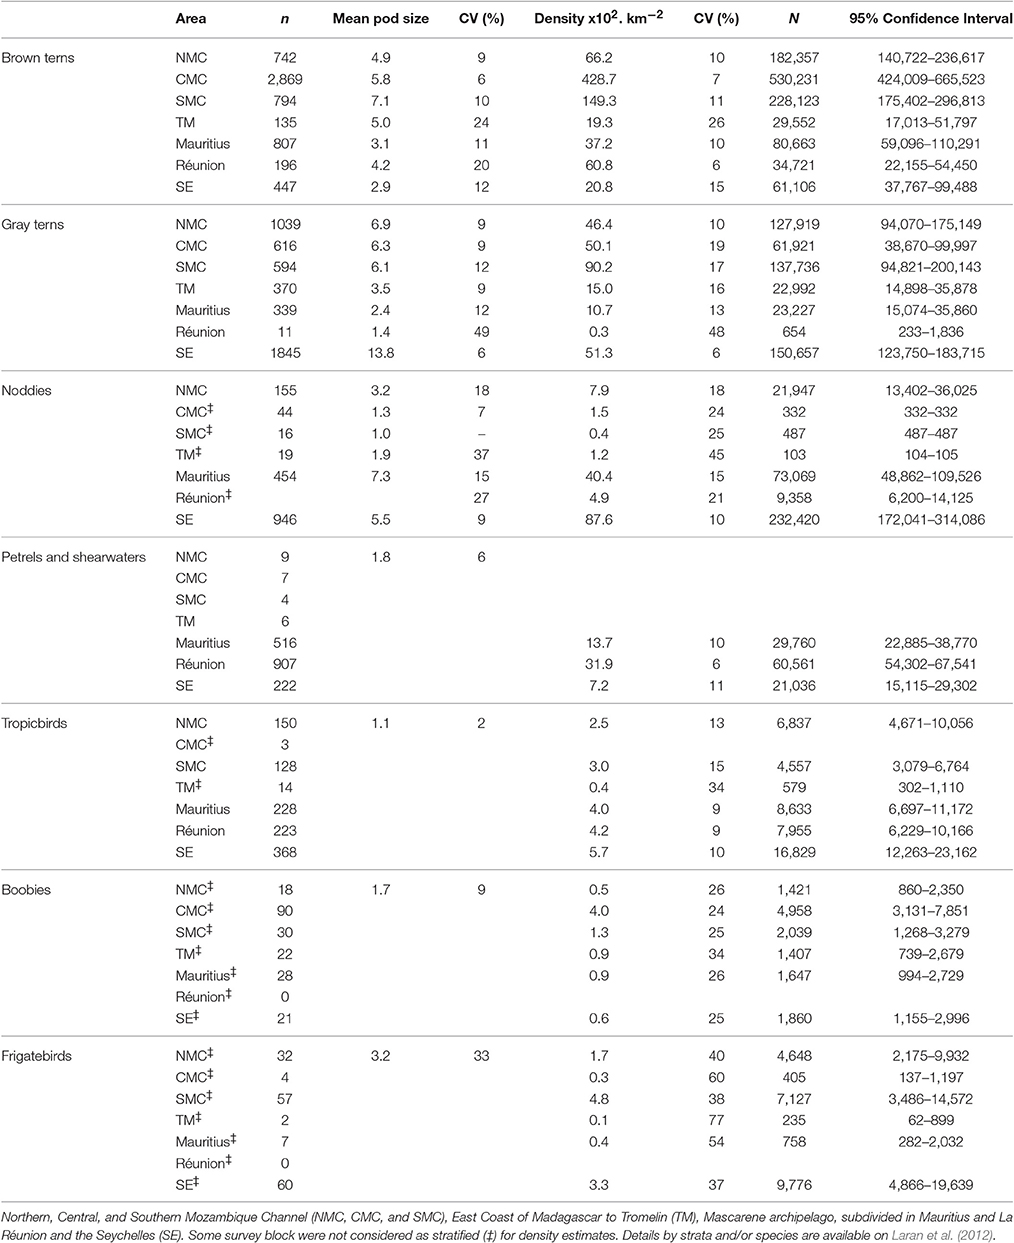
Table 4. Results obtained for seabirds: sightings number (n, within the strip of 200 m), mean pod size, densities and relative abundance (N) estimated per taxonomic group, and survey blocks.
Elasmobranchs and Sea Turtles
Only a few conspicuous taxa could be identified at the species or genus level from the air (e.g., whale sharks Rhyncodon typus, manta rays Manta birostris spp., or leatherback turtle Dermochelys coriacea; Supplementary Table 4). Five different detection functions were estimated for elasmobranchs and two for marine reptiles (Supplementary Figure 3).
Elasmobranchs were more frequently encountered in the Mozambique Channel and the Seychelles (Figure 3C). Whale sharks were only reported in the Central and North Mozambique Channel and east of Madagascar (TM), with densities (uncorrected for availability bias) of 0.05–0.1 × 10⁻² individual km−2 (Table 5). Hammerhead and “other sharks” were encountered in all survey blocks, with pooled estimated densities varying from almost nil in the Mascarene to 1.2 × 10⁻² individual km−2 in the Central Mozambique Channel. Manta and other rays were found in all survey blocks with maximum densities in the Mozambique Channel and the Seychelles (Table 5).
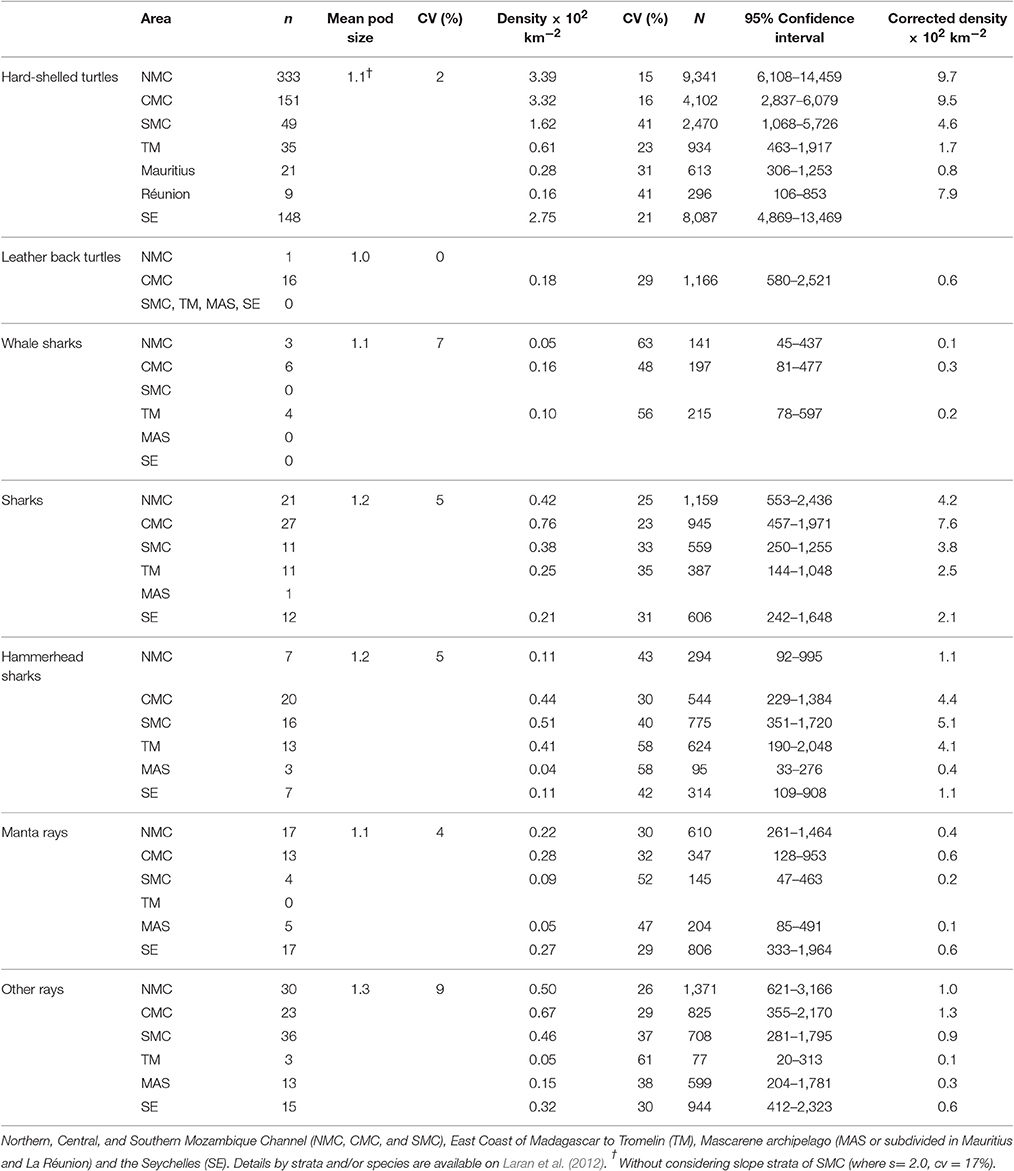
Table 5. Results obtained for elasmobranchs and turtles: sightings number (n), mean pod size, uncorrected densities with corresponding relative abundance (N) estimated per taxonomic group and survey blocks and corrected density considering different availability bias factor per group of species.
Leatherback turtles were almost only found in the Central Mozambique Channel where their density (uncorrected for availability bias) reached 0.18 × 10⁻² individual km−2, whereas hard-shelled turtles were encountered in all survey blocks, mostly in coastal waters (Figure 3D) and with maximum densities estimated in the North and Central Mozambique Channels (NMC and CMC, Table 5).
Megafauna Assemblages
In order to account for extensive inter-taxon differences in time spent visible at or close to the surface, corrections for availability bias were made for cetaceans, sharks, rays, and turtles. When considering cumulative corrected densities for all taxa, consistent general patterns emerged. The Central Mozambique Channel block emerged as the primary regional density hotspot for pelagic megafauna, ranking first for all general megafauna categories: cetaceans, seabirds, elasmobranchs and sea turtles (Figure 4). This region was followed in order of importance by the other blocks of the Mozambique Channel as well as the Seychelles. In contrast, survey blocks to the east of Madagascar always ranked low for any broad categories of megafauna. More nuanced results emerged when considering more specific sub-categories of megafauna, as seen for procellariids in the Mauritius and La Réunion survey blocks, or for sharks and hammerhead sharks in the East of Madagascar-Tromelin (Figure 4).
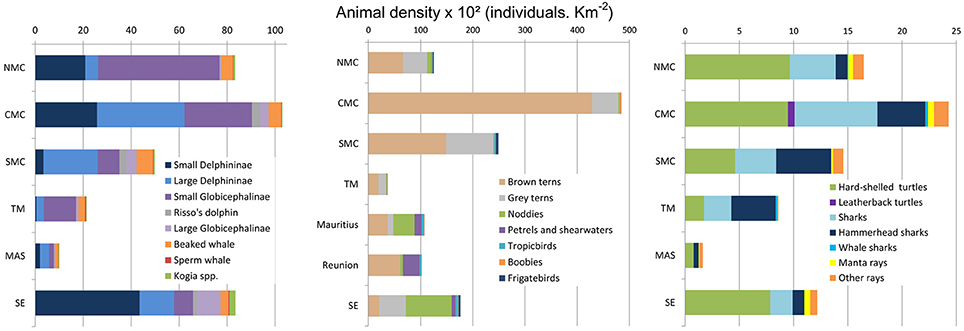
Figure 4. Cummulative densities across the 6 survey blocks of the SW Indian Ocean, corrected for availability bias considering averaged proportion of time spend at surface for cetaceans, turtles, sharks and rays; seabirds were not corrected (NMC, Northern Mozambique Channel; CMC, Comoros Archipelago and the Glorioso Islands and Central Mozambique Channel; SMC, Southern Mozambique Channel; TM, east coast of Madagascar to Tromelin Island; MAS, Mascarene Islands and SE, the Seychelles islands).
From the PCA conducted across the 22 stations (Figure 5) with densities of 18 distinct vertebrate taxa (corrected for availability, except for seabirds), the first axis (PC1; 23% of total variance) discriminated between two geographic groups: the eutrophic east of Madagascar (MAS and TM) associated with procellariids and tropicbird densities, and the oligotrophic Mozambique Channel and Seychelles associated with sharks and “brown” tern densities. PC2, which accounted for 21% of the variance. This was partly explained by an offshore-inshore gradient and it was negatively correlated with densities of Kogia spp., large Globicephalinae, Risso's dolphins, and small Delphininae but positively correlated with densities of elasmobranchs and sea turtles. The Mascarene Archipelago was discriminated from other strata and characterized by higher Procellariid and tropicbird densities. A high density of Kogia singled out the slope habitat around the Seychelles. Megafauna assemblages (with respect to their densities) were thus clearly structured across the SW Indian Ocean.
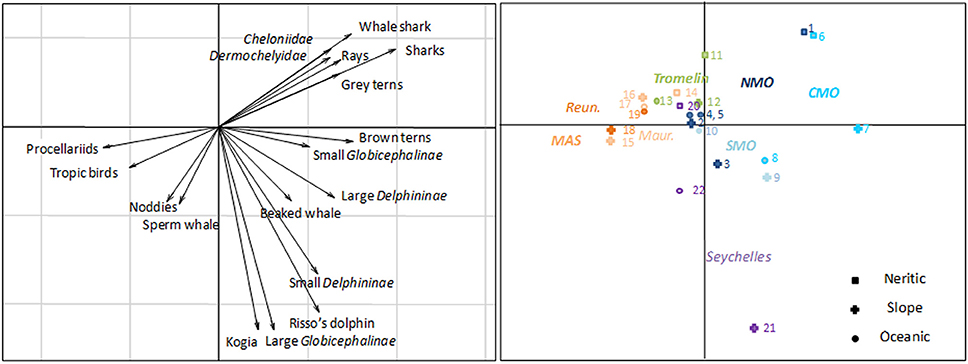
Figure 5. Result of the first two axes of the Principal Component Analysis obtained with the densities of 18 groups of megafauna over 22 different strata (see Figure 1 for strata codes) in the survey area of the SW Indian Ocean.
Discussion
We analyzed a comprehensive and methodologically homogeneous visual survey of megafauna to set a regional baseline for the distribution and density of marine mammals, seabirds, elasmobranchs, and sea turtles in the SW Indian Ocean. We found two largely distinct hotspots of taxonomic richness where marine mammals and seabirds are concerned. The megafauna assemblage as observed from the air seemed well structured by large ecoregion and habitat type.
This study provided a comprehensive overview of the distribution of marine mammals, sea birds, elasmobranches, and marine turtles in the study region during the austral summer. According to this research, the Central Mozambique Channel appears to be a regional hotspot for pelagic megafauna density whatever the taxon, followed by north and south of the Channel and the Seychelles. For marine mammals there were substantial variations in the density of Delphininae and Globicephalinae between survey blocks. Using densities of 18 distinct vertebrate taxa we clearly discriminated the eutrophic Mascarene Archipelago. Species assemblages appeared to clearly reflect broad ecoregions (East African, Indian South Subtropical Gyre, and Indian Monsoon Gyre; Longhurst 1998) as well as habitats (shelf, slope, and oceanic). Stronger discrimination was obtained with procellariids and tropicbirds, dominant in the oligotrophic Mozambique Channel. Conversely sharks and “brown” tern densities were highest in productive waters around the Seychelles Islands. The offshore-inshore gradient was characterized by densities of several groups of marine mammal offshore (e.g., Kogia spp., large Globicephalinae, Risso's dolphins, and small Delphininae), while densities of elasmobranchs and sea turtles dominated inshore. Our choice of the season (targeting a windless period and thereby optimizing sighting condition) had a substantial effect on the observed distribution of seasonal migratory species such as baleen whales, several species of seabird, marine turtles, or whale sharks: our results should be interpreted accordingly.
The use of aircraft as survey platforms, rather than vessels, was essential in order to cover extensive and representative parts of the different habitats within each survey block, and in a suitably short period of time (10–26 continuous days per survey block). In general, vessels and aircraft have fairly distinct pros and cons regarding their efficacy for marine species monitoring. Because of their moderate speed relative to the target species' own movements, sightings from vessels last longer and thus allow for better species identification, whereas a sighting only lasts a few seconds from an aircraft and does not always allow unequivocal species identification. However, offshore vessels' limited flexibility generally precludes a quick reaction to changing weather and sea conditions, resulting in a lower rate of platform usage in optimal detection conditions. But vessels can accommodate more observers on board and included more sophisticated protocols, particularly for estimating specific correction factors (e.g., for availability bias). In the case of the REMMOA survey programme, cost-related issues were key elements in the survey design and decision-making because of the vast geographical span of the project. In terms of detection probability, animals barely breaking the sea surface (e.g., beaked whales, Kogia spp., sea turtles, or elasmobranchs) might be better detected from the air than from a vessel, including by observing their presence just below the sea surface. Conversely, the detection of smaller and darker animals (numerous seabirds, in particular Hydrobatidae and Procellariids) might be lower from an aircraft flying at 600 feet. Such intuition and the experience obtained from these extensive surveys need to be considered, tested, and estimated in the future.
Correction of Specific Biases
In visual surveys of pelagic megafauna, potential survey biases are of at least three types: availability bias, perception bias, and responsive behavior. For the latter we made the assumption that, given altitude and speed of the aircraft, species could not react prior to being in the observers' field of vision. Regarding availability and perception biases, a double platform protocol could estimate both parameters for a selection of species, but this approach was not feasible during our survey. Except for seabirds, availability bias was tentatively corrected on the basis of dive pattern, using the average proportion of time spent close to the surface and considering that the sighting time-window (≈4 s) was instantaneous relative to the duration of most surface/dive cycles. Nevertheless, to improve the relative density estimates of several species, using availability bias from the scientific literature can be improved upon, for example by using dive pattern data (a function of season, bathymetry, time of the day, etc.).
Regarding perception bias, variations in detectability introduced by the sighting condition were dealt with through daily selection of transect lines to achieve excellent sighting conditions most of the time. Secondly the effect of weather-related covariates on detection functions, when statistically significant, was accounted for in six out of 14 taxa. Nevertheless, due to spatio-temporal heterogeneity in both dive patterns and bottom color, particularly in shallow waters, additional availability, and perception biases probably affect detection rate, particularly for sea turtles, dugongs (Hagihara et al., 2014), or coastal Delphininae. It is currently unclear whether these biases would on average be negative or positive.
For seabird data collected via strip transect methods, in the absence of an available and accepted methodology we did not attempt any correction and therefore our results should be considered as conservative estimates. Nonetheless, orders of magnitude of seabird densities across the three survey blocks of the Mozambique Channel (NMC, CMC, and SMC, 2.9 individual km−2) were similar to previous summer ship-survey estimates in the same area (Jaquemet et al., 2014).
Marine Mammals
The distribution observed for cetaceans generally concur with previous findings. Of the 25 species of odontocetes already encountered in the region (Marsh et al., 2003; Best, 2007; Kiszka et al., 2009a), we observed 18 during our survey. Cetacean studies in this area have mostly relied on vessel-based surveys in coastal areas and only a few have been conducted in offshore areas (Ballance and Pitman, 1998; Dulau-Drouot et al., 2008; Kiszka et al., 2008) and none of these previous surveys allow a comprehensive comparison with the present study. The distribution of the vulnerable dugong along the northwest coast of Madagascar was highlighted during this study, and a relative abundance of 100 dugongs was estimated without any correction factors incorporated (Laran et al., 2012). We also demonstrated the first occurrence of Kogia spp. in the central and south Mozambique Channel and of the common bottlenose dolphin around Tromelin Island.
Occupancy modeling predicted marine mammal diversity to peak south of the Mozambique Channel and, more moderately, around the Seychelles. Regarding marine mammal relative abundance, except for migratory baleen whales the present work provides a summer snapshot of taxonomic richness in the whole region. Salient results included the preponderance of Delphininae in the Central and South Mozambique Channel, especially the larger Delphininae species such as the bottlenose dolphin. The northern part of the Mozambique Channel was dominated by small Globicephalinae, mainly the melon-headed whale. In the East of Madagascar to Tromelin, the cetacean community composition was more even, with low densities for all taxa with the exception of sperm whales for which large summer aggregations have previously been reported north and east of Madagascar (Kasuya and Wada, 1991). Deep divers were found in all survey blocks with maximum densities in the Mozambique Channel for beaked whales and around the Seychelles for Kogia spp.
Seabirds
The SW Indian Ocean represents a region of major importance for seabirds with 31 breeding species accounting for an estimated 7.4 million pairs without considering non-reproductive segments of the populations or non-breeding species in the area. These are concentrated in the Seychelles, the Mozambique Channel and the Mascarene archipelago (Le Corre et al., 2012). The on-land distribution of the main breeding colonies can clearly explain most of our results. Most at-sea studies of seabirds in the SW Indian Ocean have relied on telemetry, and five major oceanic foraging hotspots are identified from which three include the major breeding colonies listed above (Le Corre et al., 2012). The comparison of seabird relative abundance at sea with colony counts is not straight forward nor easy, notably because breeding phenology varies between sites (Jaquemet et al., 2007). However, ranking our survey blocks according densities at sea is consistent with the ranking of the major breeding sites on the basis of colony counts; with Juan de Nova (Central Mozambique Channel) first, followed by Europa (South Mozambique Channel) and the Seychelles. However, our survey block in the north of the Mozambique Channel did not encompass the other major breeding site of Aldabra. A good correspondence between our Figure 2B was obtained with an earlier map of species richness obtained from the distribution of seven tracked species (Le Corre et al., 2012), except for northwest of Madagascar—Comoros and Seychelles, where we predicted a higher seabird taxonomic richness.
Conducting the survey in the summer had a significant impact on observed seabird distribution and density estimates, because of species—and sometimes site-specific breeding phenology and migration patterns. For example, around Europa sooty tern (Onychoprion fuscatus) winter density was estimated to 4.7 individual km−2 from a vessel (Jaquemet et al., 2005), while we obtained 1.5 individual km−2 during our summer aerial survey, but with a greater proportion of Sterna spp. (“gray” terns) than in the ship-based survey (Jaquemet et al., 2005). This could result either from a differential perception bias between dark- and light-backed species or from seasonal changes in their distribution. Nevertheless, in the Central Mozambique Channel our maximum density of “brown” terns (mainly sooty terns) accounted for 88% of the total seabird density in this survey block, in relative agreement with species composition of the main breeding site where sooty terns represent 99% of breeding seabirds (Le Corre and Jaquemet, 2005). Our estimates of “brown” tern relative abundance obtained in all survey blocks, except in the Seychelles where sooty terns breed from July to October then disperse, were strongly correlated (r2: 0.96) with the corresponding numbers of breeding pairs of sooty terns (Feare et al., 2007).
The main limitation of aerial surveys for seabirds lies in species identification: groupings based on visual similarity may lead to ecologically heterogeneous categories, or the main species encountered might also vary between survey blocks but this not be captured by broader group-based categorization.
Elasmobranchs and Sea Turtles
The present work provides the first large scale and synoptic survey for sea turtles and elasmobranchs in the SW Indian Ocean. Previous knowledge mostly came from surveys of sea turtle breeding beaches, coastal observations, or telemetry (Lauret-Stepler et al., 2007; Dalleau et al., 2012; Bourjea, 2015). For elasmobranchs, except for whale shark (Rowat et al., 2009), the main sources of data in the SW Indian Ocean have come from fisheries monitoring, local photo-identification programmes, and a few telemetry studies (Kiszka et al., 2009b). Most of these species are notoriously difficult to monitor from a vessel due to their generally inconspicuous surface behavior. Therefore, quantitative comparisons between regions or species are not readily feasible. However, higher densities of sharks and rays previously found in the Mozambique Channel (Couturier et al., 2012), or whale shark occurrence around the north of Madagadcar (Rowat, 2007) are consistent with some of our results. Similarly, the distribution of hard-shelled sea turtles observed during our survey is consistent with breeding sites in the area (Dalleau et al., 2012; Bourjea, 2015) or satellite tracking showing transit across the open ocean with clear preferences for foraging sites in shallow, euphotic coastal waters (Hays et al., 2014). By comparison, the sizeable densities of the critically endangered leatherback turtle encountered in the shelf strata of West coast of Madagascar confirm its coastal occurrence as observed along South African coast and Mozambique (Robinson et al., 2016). If individuals nesting in South Africa forage in the study area (Robinson et al., 2016) their relationships with known nesting sites need to be explored.
Conservation and Management Implications
The pelagic megafauna dealt with in this work included a variety of charismatic species that share a number of important conservation issues. Among the species encountered 13 are listed as critically endangered, endangered, vulnerable, or nearly threatened on the IUCN Red List, and nine are listed as data deficient (Supplementary Tables 2–4). Among marine mammals the populations of three species (Indo-Pacific bottlenose dolphin, Indo-Pacific humpback dolphin, and dugong) are either decreasing or fragmented in the SW Indian Ocean. And several species of seabirds are mostly restricted to the region, in particular two endemic petrels of La Réunion Island: the Barau's petrel (Pterodroma baraui) and the Mascarene petrels (Pseudobulweria aterrima).
Various anthropogenic threats have been identified for marine megafauna in in the SW Indian Ocean, such as incidental or direct catches in fisheries for marine mammals, elasmobranchs, or sea turtles (Kiszka et al., 2008; Cerchio et al., 2009; Amandé et al., 2010; Bourjea et al., 2014), the direct utilization of turtle and seabird eggs (Cheke, 2001), and underwater noise arising from oil, gas or other geophysical exploration (Southall et al., 2013). However, fisheries bycatch has been identified as the primary driver of population declines in several species of marine megafauna (e.g., elasmobranchs, mammals, seabirds, and turtles; Lewison et al., 2004). Heavy mortality in fisheries has dramatically reduced shark numbers in many locations (Zydelis et al., 2009). Worldwide more than 200,000 loggerhead turtles (Caretta caretta) and 50,000 leatherbacks were likely taken as pelagic long line bycatch in 2000 (Lewison et al., 2004). No bycatch estimates are currently available for all taxa of marine megafauna in the SW Indian Ocean; nevertheless, the Western Indian Ocean represent 13% of the reported global sea turtle bycatch (Wallace et al., 2010). In contrast, there is little bycatch of seabirds in the tropical SW Indian Ocean, presumably since most tropical seabirds feed upon small epipelagic prey and thus do not interact directly with fisheries (Le Corre et al., 2012). Nevertheless, seabird-specific threats include interactions with human activities on land (Le Corre et al., 2002), the introduction of alien predators into the breeding colonies (Dumont et al., 2010), plastic pollution (Wilcox et al., 2015), or interaction with tunas or cetaceans for foraging (Jaquemet et al., 2005) sometimes referred to as “near-obligate commensalism” (Au and Pitman, 1986) which could be at risk of disruption if tunas become overfished (Le Corre et al., 2012).
Conservation actions are often species-oriented because the ultimate measure of their efficacy is evaluated by assessing the conservation status of the species of interest. However, when it comes to the value of conservation strategies that deal with vast components of biodiversity at large geographical scales, metrics estimated at the community level are more relevant (Edgar et al., 2014). The present work provides baselines both for taxon-oriented approaches, acknowledging the intrinsic strengths and weaknesses (see Section Correction of Specific Biases) of the survey method, and for community-oriented metrics. The analysis of megafauna density assemblages across the SW Indian Ocean firstly reflected the general pattern of the three ecoregions of the Longhurst classification and, secondly, rough habitat distinctions based on bathymetry (shelf, slope/oceanic). Up to 44% of the observed variance in the study could be explained by these two parameters but there are many other factors, in addition to measurement error due to imperfect detection which might account for the remaining 56%. The existence of adequate breeding grounds in the vicinity of favorable foraging habitats (specific to seabirds and sea turtles), and spatial heterogeneity in historic human pressures could account for a large proportion of the remaining variance. The metrics describing pelagic megafauna in the tropical SW Indian Ocean would be extremely useful to monitor the long-term impacts of general management strategies, even if the present baseline does not depict a pristine condition.
There is increasing support for large scale marine protected areas (MPAs) as a tool for pelagic conservation (Game et al., 2009). In the SW Indian Ocean, a large MPA was implemented in 2010 around the Chagos Archipelago (60,000 km2) and more recently France extended the MPA of Mayotte to the EEZ of the Glorieuses Islands, representing another 110,000 km2. There is a trend to establish marine sanctuaries based on their marine megafauna, and particularly their mammal or bird fauna, and to use higher predators as ecological indicators or focal species (Hooker and Gerber, 2004). However, single-species conservation plans will probably not ensure the conservation all co-occurring species. Yet multi-species strategies, based on systematic selection procedures (e.g., a suite of “focal species”) offer more compelling evidence of their usefulness (Roberge and Angelstam, 2004) and value. Aerial surveys collecting data on different taxa over large areas and in rapid, repeatable time-frames can provide valuable knowledge with greater cost-effectiveness than single species monitoring.
Author Contributions
OV, GD conducted the field work and collected the data; VR, OV, and PW conceived the survey program; SL and VR planned the analysis approach; SL analyzed the data and took the lead writing the manuscript; MA produced the occupancy analysis and with VR contributed to revising the manuscript.
Conflict of Interest Statement
The authors declare that the research was conducted in the absence of any commercial or financial relationships that could be construed as a potential conflict of interest.
Acknowledgments
Permits have been obtained from civil aviation authorities of each surveyed countries, but at the time of the survey no special permit were required to fly in these areas in regards to possible disturbance of the animals; nevertheless, to not disturb large seabird colonies we did not fly over. The French Ministry in charge of the environment (Ministère de l'Ecologie, du Développement Durable, et de l'Energie, MEDDE) and the French Marine Protected Areas Agency (AAMP) funded the project. The Indian Ocean Commission, the Governments of all Member States (Comoros, La Réunion, Madagascar, Mauritius, and Seychelles) and the prefecture of the Terres Australes et Antarctiques Françaises considerably facilitated the regional approach conducted in the SW Indian Ocean. We thank all observers: Norbert Andrianarivelo, Adele Cadinouche, Violaine Dulau-Drouot, Rebecca Guezel, Aurelie Hermans, François-Xavier Mayer, Devis Monthy, Morgane Perri, Claire Pusineri, Yvette Razafindrakoto, and Anli Toilibou from organizations: CetaMada, Collectivité Départementale de Mayotte, Globice, Mauritius Marine Conservation Society, Megaptera, Naturalistes de Mayotte, and World Conservation Society, who were very professional in the air and friendly project mates on land. We are indebted to all aircraft crew members of Aerosotravia, France and Madagascar Trans Air, for their continuous high level of professionalism and enthusiasm despite hundreds of hours flying in strait lines over the ocean. We wish to thank J. Mourier for elasmobranch dive literature. Finally we are grateful to the two reviewers who provided valuable comments on the manuscript and Oliver Ó Cadhla for his early review and edit of the manuscript.
Supplementary Material
The Supplementary Material for this article can be found online at: https://www.frontiersin.org/article/10.3389/fmars.2017.00139/full#supplementary-material
Abbreviations
NMC, Northern Mozambique Channel block; CMC, Central Mozambique Channel; SMC, Southern Mozambique Channel; SE, Seychelles Islands; TM, East Coast of Madagascar to Tromelin Island; MAS, around the Mascarene Islands.
References
Amandé, M., Ariz, J., Chassot, E., Delgado de Molina, A., Gaertner, D., Murua, H., et al. (2010). Bycatch of the European purse seine tuna fishery in the Atlantic Ocean for the 2003-2007 period. Aquat. Living Resour. 23, 353–362. doi: 10.1051/alr/2011003
Au, D. W. K., and Pitman, R. L. (1986). Seabird interactions with dolphins and tuna in the eastern tropical Pacific. Condor 88, 304–317. doi: 10.2307/1368877
Ballance, L. T., and Pitman, R. L. (1998). Cetaceans of the Western Tropical Indian Ocean: distribution, relative abundance and comparisons with cetacean communities of two other tropical ecosystems. Mar. Mamm. Sci. 14, 429–459. doi: 10.1111/j.1748-7692.1998.tb00736.x
Best, P. B. (2007). Whales and Dolphins of the Southern African Subregion. Cambridge, UK; Cape Town: Cambridge University Press.
Bossart, G. D. (2011). Marine mammals as sentinel species for oceans and human health. Vet. Pathol. 43, 676–690. doi: 10.1177/0300985810388525
Bourjea, J. (2015). “Sea turtles; a review of status, distribution and interaction with fisheries in the Southwest Indian Ocean,” in Offshore Fisheries of the Southwest Indian Ocean: Their Status and the Impact on Vulnerable Species, eds R. Van der Elst and B. Everett (Durban: Oceanographic Research Institute), 325–349.
Bourjea, J., Ciccione, S., Lauret-Stepler, M., Marmoex, C., and Jean, C. (2011). Les îles Éparses: vingt-cinq ans de recherche sur les tortues marines. Bull. Soc. Herpétol. France 139–140, 95–111.
Bourjea, J., Clermont, S., Delgado, A., Ruiz, J., Ciccione, S., and Chavance, P. (2014). Marine turtle interaction with purse-seine fishery in the Atlantic and Indian oceans: lessons for management. Biol. Conserv. 178, 74–87. doi: 10.1016/j.biocon.2014.06.020
Branton, M., and Richardson, J. S. (2011). Assessing the value of the umbrella-species concept for conservation planning with meta-analysis. Conserv. Biol. 25, 9–20. doi: 10.1111/j.1523-1739.2010.01606.x
Buckland, S. T., Anderson, D. R., Burnham, K. P., Laake, J. L., Borchers, D. L., and Thomas, L. (2001). Introduction to Distance Sampling: Estimating Abundance of Biological Populations. Oxford: Oxford University Press.
Cerchio, S., Andrianarivelo, N., Razafindrakoto, Y., Mendez, M., and Rosenbaum, H. C. (2009). Coastal Dolphin Hunting in the Southwest of Madagascar: Status of Populations, Human Impacts and Conservation Actions. Report for the Internatioonal Whaling Commission SC/61/SM15.
Cheke, A. (2001). Booby Sula colonies in the Mascarene area (Indian Ocean): extinctions, myths, and colour morphs. Bull. Br. Orn. Club 121, 71–80.
Couturier, L. I., Marshall, A. D., Jaine, F. R., Kashiwagi, T., Pierce, S. J., Townsend, K. A., et al. (2012). Biology, ecology and conservation of the Mobulidae. J. Fish Biol. 80, 1075–1119. doi: 10.1111/j.1095-8649.2012.03264.x
Dalleau, M., Ciccione, S., Mortimer, J. A., Garnier, J., Benhamou, S., and Bourjea, J. (2012). Nesting phenology of marine turtles: insights from a regional comparative analysis on green turtle (Chelonia mydas). PLoS ONE 7:e46920. doi: 10.1371/journal.pone.0046920
Dulau-Drouot, V., Boucaud, V., and Rota, B. (2008). Cetacean diversity off La Reunion Island (France). J. Mar. Biol. Assoc. U.K. 88, 1263–1272. doi: 10.1017/s0025315408001069
Dumont, Y., Russell, J. C., Lecomte, V., and Le Corre, M. (2010). Conservation of endangered endemic seabirds within a multi-predator context: the Barau's petrel in Réunion Island. Nat. Resour. Model. 23, 381–436. doi: 10.1111/j.1939-7445.2010.00068.x
Edgar, G. J., Stuart-Smith, R. D., Willis, T. J., Kininmonth, S., Baker, S. C., Banks, S., et al. (2014). Global conservation outcomes depend on marine protected areas with five key features. Nature 506, 216–220. doi: 10.1038/nature13022
Feare, C. J., Jaquemet, S., and Le Corre, M. (2007). An inventory of Sooty Terns (Sterna fuscata) in the western Indian Ocean with special reference to threats and trends. Ostrich 78, 423–434. doi: 10.2989/OSTRICH.2007.78.2.49.129
Game, E. T., Grantham, H. S., Hobday, A. J., Pressey, R. L., Lombard, A. T., Beckley, L. E., et al. (2009). Pelagic protected areas: the missing dimension in ocean conservation. Trends Ecol. Evol. 24, 360–369. doi: 10.1016/j.tree.2009.01.011
Hagihara, R., Jones, R. E., Grech, A., Lanyon, J. M., Sheppard, J. K., and Marsh, H. (2014). Improving population estimates by quantifying diving and surfacing patterns: a dugong example. Mar. Mamm. Sci. 30, 348–366. doi: 10.1111/mms.12041
Halpern, B. S., Walbridge, S., Selkoe, K. A., Kappel, C. V., Micheli, F., D'Agrosa, C., et al. (2008). A global map of human impact on marine ecosystems. Science 319, 948–952. doi: 10.1126/science.1149345
Hammond, P. S., Mcleod, K., Berggren, P., Borchers, D. L., Burt, L., Ca-adas, A., et al. (2013). Cetacean abundance and distribution in European Atlantic shelf waters to inform conservation and management. Biol. Conserv. 164, 107–122. doi: 10.1016/j.biocon.2013.04.010
Hays, G. C., Mortimer, J. A., Ierodiaconou, D., and Esteban, N. (2014). Use of long-distance migration patterns of an endangered species to inform conservation planning for the world's largest marine protected area. Conserv. Biol. 28, 1636–1644. doi: 10.1111/cobi.12325
Heithaus, M. R., Frid, A., Wirsing, A. J., and Worm, B. (2008). Predicting ecological consequences of marine top predator declines. Trends Ecol. Evol. 23, 202–210. doi: 10.1016/j.tree.2008.01.003
Hooker, S. K., and Gerber, L. R. (2004). Marine reserves as a tool for ecosystem-based management: the potential importance of megafauna. Bioscience 54, 27–39. doi: 10.1641/0006-3568(2004)054[0027:MRAATF]2.0.CO;2
Jaquemet, S., Le Corre, M., Marsac, F., Potier, M., and Weimerskirch, H. (2005). Foraging habitats of the seabird community of Europa Island (Mozambique Channel). Mar. Biol. 147, 573–582. doi: 10.1007/s00227-005-1610-0
Jaquemet, S., Le Corre, M., and Quartly, G. D. (2007). Ocean control of the breeding regime of the sooty terns in the South-West Indian Ocean. Deep Sea Res. Part I Top. Stud. Oceanogr. 54, 130–142. doi: 10.1016/j.dsr.2006.10.003
Jaquemet, S., Ternon, J. F., Kaehler, S., Thiebot, J.-B., Dyer, B., Bemanaja, E., et al. (2014). Contrasted structuring effects of mesoscale features on the seabird community in the Mozambique Channel. Deep Sea Res. Part II Top. Stud. Oceanogr. 100, 200–211. doi: 10.1016/j.dsr2.2013.10.027
Karpouzi, V. S., Watson, R., and Pauly, D. (2007). Modelling and mapping resource overlap between seabirds and fisheries on a global scale: a preliminary assessment. Mar. Ecol. Prog. Ser. 343, 87–99. doi: 10.3354/meps06860
Kaschner, K., Quick, N., Jewell, R., Williams, R., and Harris, C. (2012). Global coverage of cetacean line-transect surveys: status quo, data gaps and future challenges. PLoS ONE 7:e44075. doi: 10.1371/journal.pone.0044075
Kaschner, K., Tittensor, D. P., Ready, J., Gerrodette, T., and Worm, B. (2011). Current and future patterns of global marine mammal biodiversity. PLoS ONE 6:e19653. doi: 10.1371/journal.pone.0019653
Kasuya, T., and Wada, S. (1991). “Distribution of large ceatceans in the Indian Ocean: data from Japonese sighting records November- March,” in Cetaceans and Cetacean Research in the Indian Ocean Sanctuary, eds S. Leatherwood and G. P. Donovan (Nairobi: Marine Mammal Technical Report, UNEP), 139–170.
Kiszka, J., Berggren, P., Rosenbaum, H. C., Cerchio, S., Rowat, D., Dulau-Drouot, V., et al. (2009a). Cetaceans in the Southwest Indian Ocean: A Review of Diversity, Distribution and Conservation Issue. Report SC/61/O18 Submitted to the Scientific Committee of the International Whaling Commission.
Kiszka, J., Jamon, A., and Wickel, J. (2009b). Les Requins Dans Les Iles de l'Océan Indien Occidental: Biodiversité, Distribution et Interactions Avec les Activités Humaines. Rapport de l'association Mayshark pour le WWF.
Kiszka, J., Muir, C., Poonian, C., Cox, T. M., Omar, A. A., Bourjea, J., et al. (2008). Marine mammal bycatch in the Southwest Indian Ocean: review and need for a comprehensive status assessment. Western Indian Ocean J. Mar. Sci. 7, 119–136.
Laran, S., Pettex, E., Authier, M., Blanck, A., David, L., Dorémus, G., et al. (in press). Seasonal distribution abundance of cetaceans within French waters: part I: the northwestern Mediterranean, including the Pelagos sanctuary. Deep Sea Res. Part II Top. Stud. Oceanogr. doi: 10.1016/j.dsr2.2016.12.011
Laran, S., Van Canneyt, O., Dorémus, G., Mannocci, L., Ridoux, V., and Watremez, P. (2012). Distribution et Abondance de la Mégafaune Marine Dans le Sud-Ouest de L'océan Indien Tropical. REMMOA- Océan Indien. Rapport final pour l'Agence des Aires Marines Protégées. PELAGIS Observatory, University of La Rochelle.
Lauret-Stepler, M., Bourjea, J., Roos, D., Pelletier, D., Ryan, P. G., Ciccione, S., et al. (2007). Reproductive seasonality and trend of Chelonia mydas in the SW Indian Ocean: a 20 yr study based on track counts. Endanger. Species Res. 3, 217–227. doi: 10.3354/esr003217
Leatherwood, S., and Donovan, G. P. (1991). Cetaceans and Cetacean Research in the Indian Ocean Sanctuary. Nairobi: UNEP.
Le Corre, M., Jaeger, A., Pinet, P., Kappes, M. A., Weimerskirch, H., Catry, T., et al. (2012). Tracking seabirds to identify potential Marine Protected Areas in the tropical western Indian Ocean. Biol. Conserv. 156, 83–93. doi: 10.1016/j.biocon.2011.11.015
Le Corre, M., and Jaquemet, S. (2005). Assessment of the seabird community of the Mozambique Channel and its potential use as indicator of tuna abundance. Estuar. Coast. Shelf Sci. 63, 421–428. doi: 10.1016/j.ecss.2004.11.013
Le Corre, M., Ollivier, A., Ribes, S., and Jouventin, P. (2002). Light-induced mortality of petrels: a 4-year study from Réunion Island (Indian Ocean). Biol. Conserv. 105, 93–102. doi: 10.1016/S0006-3207(01)00207-5
Lewison, R. L., Crowder, L. B., Read, A. J., and Freeman, S. A. (2004). Understanding impacts of fisheries bycatch on marine megafauna. Trends Ecol. Evol. 19, 598–604. doi: 10.1016/j.tree.2004.09.004
Lucifora, L. O., García, V. B., and Worm, B. (2011). Global diversity hotspots and conservation priorities for sharks. PLoS ONE 6:e19356. doi: 10.1371/journal.pone.0019356
MacKenzie, D. I., Nichols, J. D., Lachman, G. B., Droege, S., Andrew Royle, J., and Langtimm, C. A. (2002). Estimating site occupancy rates when detection probability are less than one. Ecology 83, 2248–2255. doi: 10.1890/0012-9658(2002)083[2248:ESORWD]2.0.CO;2
Mannocci, L., Catalogna, M., Dorémus, G., Laran, S., Lehodey, P., Massart, W., et al. (2014). Predicting cetacean and seabird habitats accross a productivity gradient in the South Pacific gyre. Prog. Oceanogr. 120, 383–398. doi: 10.1016/j.pocean.2013.11.005
Mannocci, L., Laran, S., Monestiez, P., Dorémus, G., Van Canneyt, O., Watremez, P., et al. (2013a). Predicting top predator habitats in the South West Indian Ocean. Ecography 36, 1–18. doi: 10.1016/j.pocean.2013.11.005
Mannocci, L., Monestiez, P., Bolanos-Jiménez, J., Dorémus, G., Jeremie, S., Laran, S., et al. (2013b). Megavertebrate communities from two contrasting ecosystems in the western tropical Atlantic. J. Mar. Syst. 111–112, 208–222. doi: 10.1016/j.jmarsys.2012.11.002
Marques, F. F. C., and Buckland, S. T. (2004). “Covariate models for the detection function,” in Advanced Distance Sampling, eds S. T. Buckland, D. R. Anderson, H. P. Burnham, J. L. Laake, D. L. Borchers, and L. Thomas (New York, NY: Oxford), 31–47.
Marsh, H., Penrose, H., and Eros, C. (2003). “A future for the Dugong?,” in Marine Mammals: Fisheries, Tourism and Management Issues, eds N. Gales, M. Hindell, and R. Kirkwood (Collingwood, VIC: CSIRO Publishing), 383–399.
Roberge, J.-M., and Angelstam, P. E. R. (2004). Usefulness of the umbrella species concept as a conservation tool. Conserv. Biol. 18, 76–85. doi: 10.1111/j.1523-1739.2004.00450.x
Robinson, N. J., Morreale, S. J., Nel, R., and Paladino, F. V. (2016). Coastal leatherback turtles reveal conservation hotspot. Sci. Rep. 6:37851. doi: 10.1038/srep37851
Ropert-Coudert, Y., and Kato, A. (2012). The Penguiness Book. World Wide Web electronic publication. Available online at: http://penguinessbook.scarmarbin.be/
Rowat, D. (2007). Occurrence of whale shark (Rhincodon typus) in the Indian Ocean: a case for regional conservation. Fish. Res. 84, 96–101. doi: 10.1016/j.fishres.2006.11.016
Rowat, D., Gore, M., Meekan, M. G., Lawler, I. R., and Bradshaw, C. J. A. (2009). Aerial survey as a tool to estimate whale shark abundance trends. J. Exp. Mar. Biol. Ecol. 368, 1–8. doi: 10.1016/j.jembe.2008.09.001
Southall, B. L., Rowles, T., Gulland, F., Baird, R. W., and Jepson, P. D. (2013). Final Report of the Independent Scientific Review Panel Investigating Potential Contributing Factors to a 2008 Mass Stranding of Melon-Headed Whales (Peponocephala Electra) in Antsohihy, Madagascar.
Thomas, L., Buckland, S. T., Rexstad, E., Laake, J. L., Strindberg, S., Hedley, S. L., et al. (2010). Distance software: design and analysis of distance sampling surveys for estimating population size. J. Appl. Ecol. 47, 5–14. doi: 10.1111/j.1365-2664.2009.01737.x
Tittensor, D. P., Mora, C., Jetz, W., Lotze, H. K., Ricard, D., Berghe, E. V., et al. (2010). Global patterns and predictors of marine biodiversity across taxa. Nature 466, 1098–1101. doi: 10.1038/nature09329
Wallace, B., Lewison, R. L., McDonald, S., McDonald, R., Kot, C. Y., Kelez, S., et al. (2010). Global patterns of marine turtle bycatch. Conserv. Lett. 3, 131–142. doi: 10.1111/j.1755-263X.2010.00105.x
Wilcox, C., Van Sebille, E., and Hardesty, B. D. (2015). Threat of plastic pollution to seabirds is global, pervasive, and increasing. Proc. Natl. Acad. Sci. U.S.A. 112, 11899–11904. doi: 10.1073/pnas.1502108112
Zacharias, M. A., and Roff, J. C. (2001). Use of focal species in marine conseration and management: a review and critique. Aquat. Conserv. Mar. Freshw. Ecosyst. 11, 59–76. doi: 10.1002/aqc.429
Keywords: aerial survey, megafauna, marine mammals, seabirds, sea turtles, elasmobranchs, densities, Western Indian ocean
Citation: Laran S, Authier M, Van Canneyt O, Dorémus G, Watremez P and Ridoux V (2017) A Comprehensive Survey of Pelagic Megafauna: Their Distribution, Densities, and Taxonomic Richness in the Tropical Southwest Indian Ocean. Front. Mar. Sci. 4:139. doi: 10.3389/fmars.2017.00139
Received: 20 January 2017; Accepted: 26 April 2017;
Published: 16 May 2017.
Edited by:
Graeme Clive Hays, Deakin University, AustraliaReviewed by:
Michele Thums, Australian Institute of Marine Science, AustraliaJérôme Bourjea, French Research Institute for Exploitation of the Sea (IFREMER), France
Copyright © 2017 Laran, Authier, Van Canneyt, Dorémus, Watremez and Ridoux. This is an open-access article distributed under the terms of the Creative Commons Attribution License (CC BY). The use, distribution or reproduction in other forums is permitted, provided the original author(s) or licensor are credited and that the original publication in this journal is cited, in accordance with accepted academic practice. No use, distribution or reproduction is permitted which does not comply with these terms.
*Correspondence: Sophie Laran, sophie.laran@univ-lr.fr