Advances in the Application of Genetics in Marine Turtle Biology and Conservation
 Lisa M. Komoroske
 Michael P. Jensen
 Kelly R. Stewart
 Brian M. Shamblin
 Peter H. Dutton
- 1Marine Mammal and Turtle Division, Southwest Fisheries Science Center, National Marine Fisheries Service, National Oceanic and Atmospheric Administration, La Jolla, CA, United States
- 2The Ocean Foundation, Washington, DC, United States
- 3Daniel B. Warnell School of Forestry and Natural Resources, University of Georgia, Athens, GA, United States
Marine turtles migrate across long distances, exhibit complex life histories, and occupy habitats that are difficult to observe. These factors present substantial challenges to understanding fundamental aspects of their biology or assessing human impacts, many of which are important for the effective conservation of these threatened and endangered species. The early development and application of genetic tools made important contributions to understanding marine turtle population and evolutionary biology, such as providing evidence of regional natal homing by breeding adults, establishing connectivity between rookeries and foraging habitats, and determining phylogeography and broad scale stock structure for most marine turtle species. Recent innovations in molecular technologies, statistical methods, and creative application of genetic tools have significantly built upon this knowledge to address key questions in marine turtle biology and conservation management. Here, we evaluate the latest major advances and potential of marine turtle genetic applications, including improved resolution and large-scale syntheses of population structure, connectivity and phylogeography, estimation of key demographic rates such as age to maturity and operational or breeding sex ratios, insight into reproductive strategies and behavior, and assessment of differential human impacts among populations. We then discuss remaining challenges and emerging capabilities, such as rapid, multiplexed genotyping, and investigation of the genomic underpinnings of adaptive variation afforded by high-throughput sequencing technologies.
Introduction
Complex behaviors and life histories have long made it challenging to assess key biological parameters and human impacts in marine turtle species. Long distance migrations between breeding and foraging grounds, differential use of neritic, oceanic, and terrestrial (beach) habitats across life stages, and divergent patterns among populations require researchers to creatively develop a wide diversity of approaches to answer even seemingly straightforward questions for these threatened and endangered species (Wyneken et al., 2013). After decades of multidisciplinary, collaborative research, a striking body of knowledge has been synthesized in marine turtle biology, yet some key questions remain unresolved (reviewed in Hamann et al., 2010; Rees et al., 2016). In parallel with innovations in other fields (e.g., animal telemetry and population modeling), advances in molecular genetics continue to play a central role in furthering our understanding of marine turtle biology.
Early studies using genetic tools in marine turtle research provided key evidence of regional natal homing by breeding adults, established connectivity between rookeries (i.e., nesting colonies) and foraging habitats, and defined phylogeography and broad scale stock structure for most species (reviewed in Jensen et al., 2013a). Recent innovations in molecular technologies and statistical methods, improved sampling efforts, and the creative application of genetic tools (Box 1) have significantly built upon this knowledge. Importantly, advances in marine turtle genetics include not only studies investigating population genetics or phylogeography directly, but also those leveraging genetic tools to quantify other biological parameters that are challenging to measure, such as age to reproductive maturity. Here we evaluate the latest major advances in marine turtle genetics (and now genomics) to address key remaining gaps in knowledge, identify remaining challenges, and highlight emerging developments with future applications. Rather than provide an exhaustive review of all genetic studies conducted, we focus on key and forthcoming advances as well as practical guidance, generating a valuable resource for marine turtle biologists that conveys how genetic tools may be used to address a wide diversity of evolutionary, ecological, and conservation management questions.
Box 1. Technological and analytical improvements.
Key methodological advances in the past decade underpin the growing capacity to tackle a diversity of questions in wildlife biology and conservation. Broadly, these developments offer improved resolution relative to early molecular markers and analyses, facilitate larger-scale spatial and temporal syntheses, and generate capability for novel applications. Here we provide a general overview within the context of recent and emerging marine turtle applications, emphasizing that there is not one universal “best” approach, but rather the most appropriate tools for particular research questions and conservation needs, budget, and biological contexts.
Expansion of molecular markers
The majority of marine turtle genetic studies to date have used mitochondrial DNA (mtDNA) control region (d-loop) as a molecular marker of choice because it is (1) generally fast and easy to sequence, (2) the principal non-coding region of mtDNA and often highly polymorphic, and (3) mtDNA is maternally inherited. These factors have made it a useful tool for many studies, including assessment of phylogenetic relationships, establishing broad population stock structure, and species identification of unknown individuals. However, this marker can have limited resolution, and some research questions require nuclear markers (i.e., inherited both maternally and paternally, such as studies of male-mediated gene flow). In the past decade, researchers have tackled these limitations via development of both (1) mtDNA markers complementary to the control region, and (2) informative nuclear markers.
For mtDNA, this began with the development of primers that target an extended control region sequence (i.e., 766 vs. 490 bp; Shamblin et al., 2012b), and recently extended to identification of diagnostic variants in other mtDNA regions (Shamblin et al., 2012a; Tikochinski et al., 2012) and whole mitogenome sequencing (Duchêne et al., 2012). In cases where there is not extensive haplotype sharing among rookeries, the extended control region sequence can effectively identify natal origin of foraging turtles (LeRoux et al., 2012). However, when overlaps in control region haplotypes among rookeries are prevalent, the addition of other mtDNA markers or complete mitogenomic sequencing can help resolve uncertainties (Shamblin et al., 2012a). Informative nuclear markers have also now been developed for all marine turtle species, offering finer-scale resolution in some biological contexts, and applicability to research questions about the male component of populations. This has included informative microsatellites (see Glossary; e.g., Aggarwal et al., 2004; Jensen et al., 2006; Shamblin et al., 2007, 2009, 2012c; Alstad et al., 2011; Roden and Dutton, 2011) and more recently, single nucleotide polymorphisms (SNPs; Roden et al., 2009; Hancock-Hanser et al., 2013; Hurtado et al., 2016). With many alleles at each locus, nuclear microsatellites can be employed for applications such as individual and familial genotyping (Selkoe and Toonen, 2006). However, laboratory analyses of microsatellites can be time and labor intensive, and although technical advances (e.g., multiplexing) have helped, scaling up in projects requiring analyses across thousands of samples can be challenging. Additionally, generating microsatellite data that is comparable across laboratories is problematic, which can impede large-scale stock structure and MSA syntheses. In contrast, SNPs typically have lower power per locus relative to microsatellites, but hundreds to thousands of SNP loci can now be rapidly and reliably quantified across large numbers of individuals (Campbell et al., 2015; Ali et al., 2016; Andrews et al., 2016). Additionally, SNPs in coding regions can be used to understand genotype and phenotype linkages and identify loci under selection if adequate genomic and budget resources are available (Hoban et al., 2016; Todd et al., 2016).
Transcriptomic and epigenetic markers have also recently been developed to understand biological processes in marine turtles. Measuring changes in gene expression may provide insight into the key genes and cellular pathways involved in physiological responses to environmental conditions or development cues, for example during sex determination in embryonic development or exposure to pollutants and environmental stressors (Sifuentes-Romero et al., 2013; Gomez-Picos et al., 2014; Díaz-Hernández et al., 2015; Tedeschi et al., 2016; Bentley et al., 2017). To date, most published studies in marine turtles have developed and applied functional genetic markers using quantitative PCR, targeting specific genes based on a priori knowledge from other taxa (e.g., Sox9, CIRBP, and aromatase). However, projects quantifying global gene expression (i.e., measuring all genes being expressed in a given sample) are underway, which can be used to address a diversity of research questions from comparative functional genomics of development to the physiological impacts of contaminants. Additionally, markers quantifying DNA methylation have been developed to investigate the role of epigenetics in these processes (Venegas et al., 2016). It is important to realize that these techniques provide the strongest biological insight when accompanied by companionate phenotypic information, and may require further validation for different species and environmental contexts to ensure accurate data interpretation (particularly in situ). Nonetheless, along with other emerging approaches (e.g., environmental DNA and DNA meta-barcoding), these techniques are rapidly becoming more common across wildlife taxa, and are well-poised to further our understanding of the genomic and cellular processes underlying physiological responses and adaptations in marine turtles.
High-throughput sequencing
High-throughput sequencing (HTS; also referred to as next generation sequencing, massively parallel sequencing or second-generation sequencing) is a category of approaches that employ massively parallel processing for DNA and RNA sequencing. These technologies are rapidly advancing, and detailed evaluation of these methodologies is available elsewhere (Morey et al., 2013; Reuter et al., 2015). However, there are a few key elements of HTS that are important to understand within the context of marine turtle genetic and genomic advances. First, in contrast to Sanger sequencing (which has been the most widely used method for almost four decades; Sanger et al., 1977) that produces each DNA sequence individually, HTS approaches rapidly generate millions of sequences simultaneously by employing massively parallel processing. Sanger sequencing is still useful for small-scale DNA sequencing projects, but HTS allows rapid sequencing across hundreds to thousands of loci and individuals. Secondly, HTS approaches are versatile. For example, in addition to DNA sequencing HTS techniques, RNA sequencing (RNA-Seq) can be employed to quantify gene expression (in lieu of lower throughput techniques such as quantitative PCR) and conduct functional genomics studies. Although to date HTS has been more widely used in other wildlife taxa (e.g., mammals and fish; Shafer et al., 2015; Cammen et al., 2016), in marine turtles HTS approaches have been used to construct the complete green turtle reference genome (Wang et al., 2013), generate mitogenomes of all seven marine turtle species for phylogenetic analyses (Duchêne et al., 2012), and discover SNPs for green, hawksbill and loggerhead turtles (Hancock-Hanser et al., 2013; Komoroske et al., 2016). While HTS approaches effectively eliminate bottlenecks in data production, challenges in data quality and interpretation can remain, particularly for wildlife species with limited genomic resources. However, continued decline of HTS costs coupled with development of complementary tools (e.g., targeted DNA/RNA library techniques and bioinformatic resources-see below) is greatly expanding accessibility for cost-effective use of HTS approaches in marine turtle research, and will likely become more common in the near future.
Quantitative analyses
Bayesian mixed stock analysis
Mixed stock analysis (MSA) has become a key tool for marine turtle research aiming to connect turtles sampled away from nesting beaches (e.g., foraging areas, migratory corridors, fisheries bycatch, or strandings) to their natal rookeries. Software packages like BAYES (Pella and Masuda, 2001) and the “mixed stock” R package (Bolker et al., 2007; Bolker, 2008) uses the frequencies of genetic markers for estimating the most likely proportions of “source populations” (rookeries) sampled in a “mixed population.” Robust MSA depends on three key factors: (1) a comprehensive sampling of potential source populations (rookeries), (2) suitable sample size of the mixed population and (3) strong genetic structure to differentiate between source populations. Common problems limiting MSA accuracy in marine turtles have been lack of detectable population structure and/or limited sampling among source rookeries, resulting in imprecise estimates surrounded by large levels of uncertainty. In such cases, it can be advantageous to use Bayesian approaches that allow the use of informed priors to influence the distribution of the relative baseline frequencies. Prior information based on biological knowledge guides the output in situations where genetic structure is weak between the baseline samples, such as shared haplotypes between rookeries. For marine turtles, the most commonly used priors are the relative size of source populations (assuming that larger rookeries are more likely to contribute) or the geographical distance between rookeries and foraging grounds (assuming that closer rookeries are more likely to contribute). This can greatly assist MSA, but there is an inherent danger with using priors because if these underlying assumptions are not true, the results may be erroneous. Additionally, MSA methods can differ in their underlying algorithms, so it is advisable for researchers to compare multiple methods as they can produce different results (e.g., see Jensen et al., 2016a). Researchers using MSA need to understand the strengths and limitations of their dataset and method, and make good arguments for the use of specific priors. Nonetheless, MSA is an effective tool for providing vital information on the geographical boundaries of marine turtle populations that is crucial to the conservation and management of these animals.
Assignment testing
Assignment testing methods can be used for a variety of wildlife applications by assigning individuals by probability to their source (see Manel et al., 2005 for method overview). Numerous programs have been developed and are best applied under differing biological and data conditions. One program, ONCOR (originally used for stock assignment of Pacific salmon), that analyzes genetic data and conducts simulations to make assignments (Kalinowski et al., 2007) was recently adapted and validated in leatherback turtles (Stewart et al., 2013). This approach was then adapted in combination with MSA to assign bycaught turtles to source nesting populations with high precision (Stewart et al., 2016). ONCOR is open source software that is user friendly and has good documentation, and has strong potential for future applications in other marine turtle populations and species. However, like MSA, an important caveat is that accurate assignment requires availability of robust baseline data for all possible source populations, and that the markers used can differentiate among them.
Open source software and reproducibility initiatives
There is an increasing diversity of open source software for genetic and genomic analyses, but programs are often developed by different research groups, resulting in discontinuity (e.g., dissimilar required data formats and variable levels of documentation) and making it time-consuming and frustrating for researchers to easily find and correctly implement them. Recent efforts to make tools more accessible via user-friendly, well-documented workflows have made significant strides in tackling these issues. For example, the National Evolutionary Synthesis Center sponsored a recent Hackathon that produced a suite of R packages for population genomics analyses, each of which are now publicly available for download and have corresponding documentation in a special issue of Molecular Ecology Resources (see Paradis et al., 2016 and original articles within this special issue). Similar barriers can hamper HTS analyses, often compounded by data scale issues (i.e., simple tasks that can be manually completed in small data sets require automation with “big data”). Well-documented and user-friendly bioinformatics tools and pipelines are becoming increasingly available, greatly assisted by open access online repositories such as GitHub and Dryad. These resources allow researchers to share both code and data, complimenting public genomic databases such as NCBI, the UCSC Genome Browser and Ensembl. For example, marine turtle mitogenome analysis, SNP discovery and genotyping scripts, as well as the complete green turtle reference genome, mitogenomes for all species, and targeted capture array probe sequences are now publically available (see data accessibility links in Duchêne et al., 2012; Hancock-Hanser et al., 2013; Wang et al., 2013).
Evolutionary History and Phylogeography
The taxonomy of marine turtles is now well-established based on both nuclear and mitochondrial genes (Naro-Maciel et al., 2008; Duchêne et al., 2012), yet population genetic and phylogeographic studies continue to reveal complex population structuring within each species. Such studies inform both broad scale contemporary patterns of geographic variation, as well as inferring historic patterns that led to the current distribution of genetic variation. Perhaps the most important advances to this field have been made through expanded sample collections that provide key insights informing designation of units to conserve on a global scale, such as Evolutionary Significant Units (ESUs), Distinct Population Segments (DPSs), and Regional Management Units (RMUs; see Box 2, Table 1 for definitions and applications of conservation units). As sample coverage continues to improve for all species in parallel with better analytical tools, marine turtle studies continue to explore questions of past glacial refuges (e.g., Hamabata et al., 2013; Naro-Maciel et al., 2014a), colonization routes (Dutton et al., 2014a; Shamblin et al., 2014; Gaos et al., 2016), and multiple colonization events that create such complexity in marine turtle phylogeographic patterns (e.g., Dethmers et al., 2006; Vargas et al., 2016). The field of marine turtle phylogeography will undoubtedly continue to advance in coming years with the development of genomic approaches and novel analytical tools. By offering insight into evolutionary history and patterns of biodiversity over geologic timescales, phylogeographic studies provide important context for effective conservation management. However, in accordance with the aims of this review, below we principally focus on describing the contemporary distribution of genetic variation within species that is directly used in marine turtle management and conservation frameworks.
Box 2. Marine turtle conservation units.
Conservation units are often defined at multiple hierarchical levels in globally distributed species, and it can be challenging to understand how each is used in management frameworks and decisions. Evolutionary Significant Units (ESU) and Distinct Population Segments (DPS) are below the species level and are shaped by processes over evolutionary timescales that result in global partitioning of genetic variation that are relatively easy to detect with genetic markers such as the mtDNA control region (Taylor et al., 2010). Status assessments for marine turtles under the US Endangered Species Act now seek to identify DPSs that would represent a significant loss of genetic diversity for the species were they to go extinct (USFWS NOAA, 1996). Regional management units (RMUs) are analogous to DPSs and also recognize broad global conservation units below the species level for marine turtles (Wallace et al., 2010b). The IUCN has also recognized the need to identify broad population units below the species level for conservation, and has listed these as “subpopulations” in a recent global Red List assessment for leatherback (Wallace et al., 2013) and loggerhead turtles (Casale and Tucker, 2015). These large-scale units are helpful for assessing conservation priorities from a global perspective, but in most cases, each ESU, DPS, or RMU comprises multiple demographically independent nesting populations, known as management units (MUs). MUs are defined on the basis of significant differences in mitochondrial haplotype and/or nuclear allele frequencies (Moritz, 1994), reflecting regional natal homing to nesting sites by females. As such, MUs represent discrete populations over ecological time frames and reflect the appropriate scale for monitoring population dynamics. These MUs may also be referred to as genetic stocks, and the level of connectivity between MUs characterizes the degree of population structure and vulnerability to threats, and the ease with which demographic structure can be detected with genetic markers. Demographically independent populations (DIPs) are characterized by a low level of differentiation that is harder to detect with mtDNA markers (Dutton et al., 2013), and failure to detect demographic independence when it exists may lead to inappropriate management policy (Taylor and Dizon, 1999). In marine turtles, there are recently published genetic studies that have not yet been incorporated into conservation unit delineations (e.g., Gaos et al., 2016). As these are integrated, further sampling gaps are resolved, and the application of finer-resolution markers increases, the number of MUs and DIPs will likely continue to increase in coming years for several species. Established broader scale conservation units (e.g., RMUs) are likely to only change modestly, mostly via additional sampling that reduces current uncertainty of turtle population distributions across foraging areas, breeding grounds, and migratory pathways. Nonetheless, in combination with other forthcoming studies (e.g., assessing connectivity via telemetry), new fine-scale genetic information will help refine population boundaries for management frameworks, such as designating of DPSs for several species that have not yet been conducted (Table 2). Additionally, these advances are likely to be particularly valuable for linking threats with demographically independent nesting population abundance trends (e.g., Stewart et al., 2016).
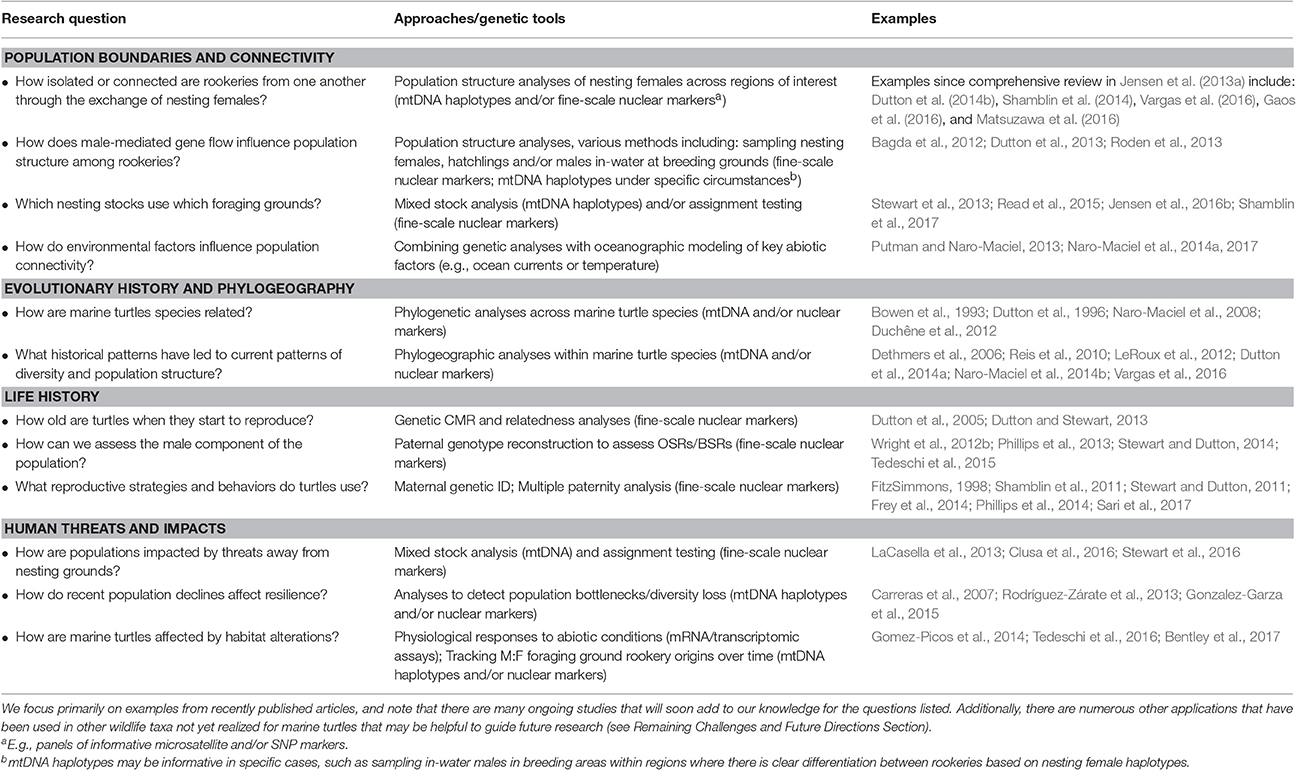
Table 1. Examples highlighting how genetic tools have been used to address key research questions in marine turtle biology and conservation.
Defining Population Boundaries and Connectivity
How Are Rookeries Connected to Each Other and Linked to Foraging Grounds?
Defining biologically relevant population units for monitoring and management is an important first step in conservation because different populations may have distinct habitat and ecological needs, be subject to differential threats, and be under different geopolitical and management jurisdictions. Given the complex life cycle of marine turtles, it's also essential to understand the spatial ecology of individuals representing each of these populations, or stocks (see Box 2, Table 2), as they disperse and migrate through oceanic and neritic foraging habitats. Because it is difficult to make direct observations to define population boundaries and migratory connectivity of marine turtles, genetic studies have played a pivotal role in achieving these goals.
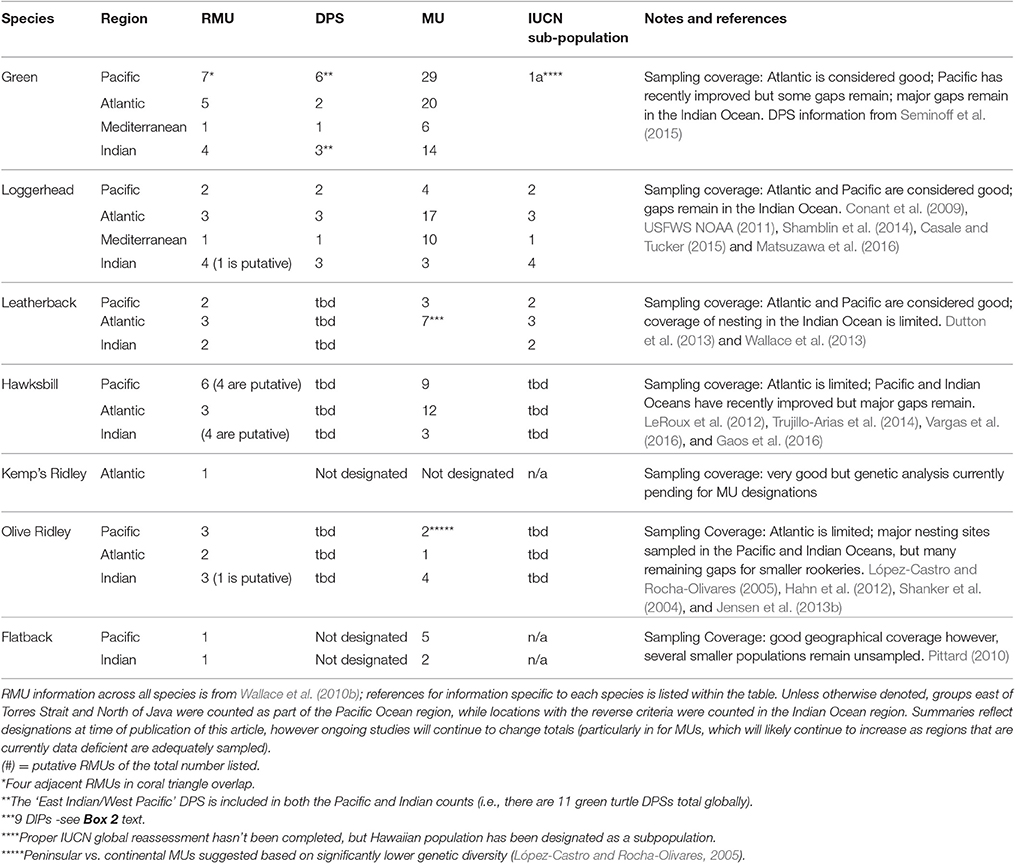
Table 2. Summary of the current status of different conservation unit designations for each marine turtle species.
Two key criteria for accurate assessment of population structure are: (1) sufficient power of the molecular markers to resolve differentiation present among populations, and (2) comprehensive and representative sampling of individuals and rookeries in each region to facilitate precise estimates of the fine-scale genetic differentiation among rookeries. Ideally, the latter includes genetic sampling of males as well as females at nesting grounds because nuclear gene flow via males represents the upper geographical scale of a population (NRC, 2010). These criteria are also important prerequisites for accurately assigning foraging turtles to their respective nesting populations to quantify connectivity. Thus, while early research delineated numerous major population boundaries, the recent development of high resolution markers and the expansion of worldwide sampling efforts have significantly improved our capacity to assess fine-scale population structure and connectivity (see Box 1). To illustrate these advances, here we focus on recent progress in green turtles, where these approaches have been particularly fruitful in resolving global stock structure and foraging ground connectivity (see Jensen et al., 2013a for a recent comprehensive review of stock structure for each species).
Global Green Turtle Stock Structure: What Have We Learned from Increased Sampling Efforts?
Nearly three decades ago, mitochondrial DNA (mtDNA) restriction site analysis of western Atlantic green turtles provided the first genetic evidence supporting the hypothesis of natal homing by nesting females (Bowen et al., 1989; Meylan et al., 1990). Since that time, considerable progress has been made in refining the global population structure for this species through improved sampling efforts and development of genetic tools with increased power to detect population structure (Figure 1, Box 1). First, sequencing of the mtDNA control region (490 bp) from nine Atlantic and Mediterranean rookeries detected 6-fold greater genetic diversity compared to previous RFLP data (Encalada et al., 1996), significantly improving stock structure resolution and identifying at least six management units (MUs; see Box 2 for additional discussion of conservation units). Further progress was then made by increasing sampling sizes and coverage in the Florida nesting aggregation, clearly demonstrating that Florida is genetically distinct from the Quintana Roo, Mexico rookery and identifying at least two MUs within Florida, separated by the St. Lucie Inlet (Shamblin et al., 2015a). Additional studies added novel rookeries and increased sample sizes regionally in the Atlantic, resulting in the recognition of a total of 12–13 MUs using mtDNA control region haplotypes (490 or 817 bp, see Box 1; Bjorndal et al., 2006; Formia et al., 2006; Ruiz-Urquiola et al., 2010; Shamblin et al., 2015b).
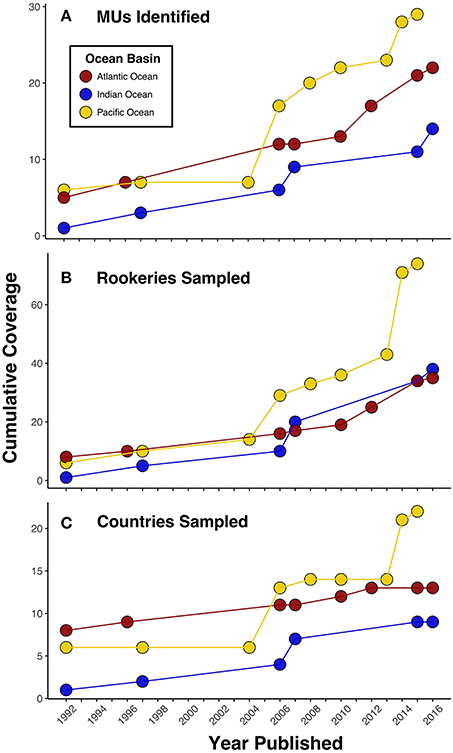
Figure 1. Progress in (A) management unit (MU) identification and genetic sampling by (B) rookeries and (C) countries for green turtles over the past 25 years in each ocean basin as measured by published studies. While trends among panels generally depict the same pattern, in some instances the number of MUs increases without corresponding new sampling locations. This highlights that increases in MU identification have resulted from both expanded sampling efforts and improvements in genetic marker resolution. These data also depict how MU delineation in the Atlantic was the first to advance, but there has been recent progress in the Indian and Pacific Oceans as well.
In contrast to the Atlantic, progress on delineating population boundaries in the Indian and Pacific Oceans has been slowed by challenges to carrying out comprehensive rookery sampling. With globally significant rookeries scattered throughout the Indian and Pacific Oceans that are often located at remote islands and atolls, sampling is difficult and requires long-term international collaborations (see also Social Dimensions section). However, more than two decades of focused efforts to advance the genetic sampling of green turtle rookeries across this region has started to bear fruit. The number of rookeries sampled has increased from 14 across six countries at the beginning of the millennium (Bowen et al., 1992; FitzSimmons et al., 1997) to more than 80 rookeries across 23 countries by 2016 (Figure 1), now covering the majority of the green turtle distribution across the regions (e.g., Hamabata et al., 2013; Dutton et al., 2014a,b; Jensen et al., 2016a). As a result, our ability to define population boundaries for Pacific green turtles has improved significantly. Dethmers et al. (2006) first pioneered large-scale Indo-Pacific green turtle population structure analyses, covering an impressive 27 rookeries identifying 17 MUs using mtDNA control region haplotypes (386 bp). Since then, studies including additional beaches in Taiwan (Cheng et al., 2008) and Japan (Nishizawa et al., 2011; Hamabata et al., 2013) have shown population differentiation between rookeries separated by no more than 150 km, identifying six new MUs in the Northwest Pacific. Recent regional analyses of Southwest and South-central Pacific green turtle rookeries also filled a significant gap across a large portion of the western Pacific and identified seven MUs (Dutton et al., 2014b; Read et al., 2015). In contrast, in the central and eastern Pacific only five MUs have been identified, with no genetic differentiation detected between neighboring rookeries in the Hawaiian archipelago (>500 km), the Revillagigedo Islands (~400 km), or between rookeries in the Galapagos and mainland Ecuador (>1,000 km) (Dutton et al., 2014a; Chaves et al., 2017).
Population Boundaries: When and How do Higher Resolution Markers Help Us?
Despite impressive progress in filling sampling gaps, questions about the scale of natal homing and demographic isolation of rookeries have persisted. Using data on mtDNA control region haplotypes, no population differentiation was detected between several green turtle rookery pairs despite being separated by several hundred kilometers. Examples included Aves Island and Suriname in the Northwest Atlantic (Encalada et al., 1996), the Brazilian archipelago rookeries of Fernando de Noronha and Atol das Rocas (Bjorndal et al., 2006), and the individual rookeries comprising the central and eastern Pacific stocks discussed above. Such observations provoke the important question: Is this apparent lack of population structure between rookeries within a region due to recent shared common ancestry, ongoing gene flow via female exchange across rookeries, or due to lack of resolution in the genetic markers employed? Haplotypes may be shared regionally or even across entire ocean basins, and may potentially obscure population boundaries (e.g., Formia et al., 2006). Further, even when rookeries are considered demographically isolated through haplotype frequency differences, haplotype sharing can lead to uncertainty around stock contributions in mixed stock analyses (MSA; see Box 1). These ambiguities can hinder defining appropriate population boundaries for management frameworks (see further discussion of conservation units in Box 2). In these circumstances, the use of additional genetic markers beyond traditional mtDNA control region sequences can provide insight, and in several cases have already been instrumental in the resolution of marine turtle population boundaries. Multiple marker types may reveal previously obscured population structure, and the ‘best’ marker depends on the biological context and evolutionary histories of the particular rookeries being investigated. To demonstrate this, we discuss examples of improvements in green turtle population structure resolution using a variety of genetic markers, several of which show further utility for other populations and species (see Box 1 for additional details on marker development).
Mitogenomic Sequencing and Mitochondrial Short Tandem Repeats
In green turtle rookeries of the western Atlantic, extensive sharing of four common mtDNA 490 bp control region haplotypes hampered assessments of population boundaries. In particular, within the eastern Caribbean, the large rookeries of Suriname and Aves Island are nearly fixed for haplotype CM-A5 (Encalada et al., 1996), which is also detected at low frequency in the Tortuguero, Costa Rica rookery (Bjorndal et al., 2005). These patterns made it unclear if there is mixing among females nesting at these rookeries, or if there is population structure undetected by this particular marker. To resolve this question, Shamblin et al. (2012a) sequenced nearly the entire 16,000 bp mitogenome from 20 individuals from these rookeries as well as Buck Island, US Virgin Islands (USVI) to detect informative variable positions outside of the standard control region sequence. They found four variants in other regions of the mitogenome that divided CM-A5 into three haplotypes that were regionally structured. Statistical analysis of the new haplotypes indicated that all four rookeries were demographically isolated from each other, and qualified as distinct MUs. It is not yet known if such informative mitogenomic variants are common for marine turtles, or if their presence is unique to these eastern Caribbean green turtles. Efforts are underway for green turtles in regions of the Pacific where haplotype sharing similarly confounds population structure assessment (A. Frey, pers. comm.). Such exploration could also be valuable in other species where refinement of methods to detect population differentiation is needed to meet management goals, such as leatherbacks that can share haplotypes across entire ocean basins (Dutton et al., 2007), and eastern Pacific olive ridleys in Costa Rican and Mexican rookeries that are undifferentiated based on traditional mtDNA control region sequences (López-Castro and Rocha-Olivares, 2005).
Much like the problem in the eastern Caribbean green turtles, one common mtDNA control region haplotype dominates Mediterranean rookery profiles (CM-A13), with only the Cyprus rookery being distinct from the others (Bagda et al., 2012). However, using a mitochondrial short tandem repeat (mtSTR) marker downstream of the standard control region sequence used for haplotype designation, Tikochinski et al. (2012) determined that this common haplotype could be subdivided into 33 variants. Examining differences in the frequencies of these mtSTR variants from the Israeli rookery compared to stranding's along the Israeli coast suggested that population structure is present among Mediterranean green turtle rookeries. In another example, Shamblin et al. (2015c) combined mtSTR markers with sequencing of the extended control region from two northern Brazil island rookeries that were previously undifferentiated (Fernando de Noronha and Atol das Rocas; Bjorndal et al., 2006). This allowed them to discern cryptic diversity and clearly demonstrate that the two rookeries were demographically distinct populations, and also provide novel population markers for future MSA studies. Though consistent sequencing of mtSTRs can be challenging due to technical methodological issues, further investigation may also prove useful for identification of fine-scale patterns in other populations and species where shared control region haplotypes are common.
Nuclear Markers
The application of maternally inherited mtDNA markers for defining population structure and connectivity is useful given that the scale of female natal homing is a key element in determining population boundaries. However, mtDNA markers only clarify the female portion of the story and can lack resolving power due to the slow rate of mitochondrial evolution inferred for turtle species. In contrast, nuclear markers incorporate male connectivity that is essential to delineate populations with greater accuracy, and can have increased statistical power, e.g., microsatellites and single nucleotide polymorphisms (SNPs; see Glossary and Box 1 for further details). Early studies found congruent or weaker patterns of population structure with nuclear markers relative to mtDNA, suggesting the presence of weak male natal homing behavior and/or mating during periods when individuals from different populations overlap at foraging sites (FitzSimmons et al., 1997; Roberts et al., 2004). More recent research employing a higher number of nuclear markers detected significant population differences across key green turtle rookeries in the Pacific, providing evidence that male-mediated gene flow between regional nesting stocks may be more limited than previously believed and facilitating clearer stock delineation (Roden et al., 2013). Several rookeries in Turkey also displayed different microsatellite allele frequencies (Bagda et al., 2012), suggesting there was underlying population structure not detected by mtDNA. These results correspond with recent findings in other species such as leatherbacks, where using mtDNA alone distinguished seven populations in the Atlantic, but using microsatellites it was clear that there were nine populations (Dutton et al., 2013). However, in western Atlantic green turtles, microsatellites discerned population structure that was congruent with but weaker than that identified by mtDNA control region sequences (Naro-Maciel et al., 2014a). Thus, while it is clear that combining mtDNA and nuclear markers can provide insight into male-mediated gene flow and population boundaries, patterns may differ between regions and species, and additional studies are needed to clarify their generality and context dependencies. As technological advances continue to improve researchers' abilities to generate robust nuclear data that are comparable across laboratories, nuclear markers are poised to complement mtDNA in further advancing our understanding of female and male natal homing and fine-scale population structure.
Green Turtle Habitat Connectivity: Which Nesting Stocks Use Which Foraging Grounds?
Along with other approaches such as flipper tagging, satellite telemetry, and stable isotope analysis, genetics have been instrumental in quantifying connectivity between rookeries and foraging grounds. Early work in the Atlantic recognized the importance of both ocean current patterns and natal homing behavior in shaping the distribution of juvenile green turtles at foraging sites (Luke et al., 2004; Bass et al., 2006). Recently, improved sampling efforts have coincided with advances in statistical analyses such as MSA to clarify how populations are linked to foraging habitats (see Box 1). This provides researchers and practitioners working in foraging grounds with knowledge about where the turtles are coming from, which is informative for public outreach engagement, identifying regional and international management partners, and integrating threats at nesting beaches and foraging grounds into risk assessments. This information also enables estimation of proportional contributions of each source nesting stock to the foraging population.
With the advancements defining rookery population structure across the Pacific, an increasing number of foraging grounds have now been analyzed using MSA across northern Australia (Dethmers et al., 2010), Southeast Asia (Jensen et al., 2016b; Joseph and Nishizawa, 2016), Southwest Pacific Ocean (Read et al., 2015; Jensen et al., 2016a), Northwest Pacific Ocean (Nishizawa et al., 2013), Central Pacific (Dutton et al., 2008; Naro-Maciel et al., 2014b), and the East Pacific (Amorocho et al., 2012; Chaves et al., 2017). These studies have shown considerable variation in results, with some foraging ground aggregations being composed mostly of turtles from the nearest stock (see Glossary) such as Hawaii, Aru, Gulf of Carpentaria, and the northern and southern Great Barrier Reef (Dutton et al., 2008; Dethmers et al., 2010; Jensen et al., 2016a), while other aggregations include significant numbers of turtles from distant stocks over 2,000 km away such as Palmyra, New Caledonia, Colombia and Japan (Amorocho et al., 2012; Nishizawa et al., 2013; Naro-Maciel et al., 2014b; Read et al., 2015). A similar pattern is evident in the Atlantic basin where transatlantic dispersal has been identified from Suriname to the West coast of Africa and from rookeries in western Africa to the Brazilian coast (Monzón-Argüello et al., 2010). While these studies have expanded our understanding of connectivity between rookeries and foraging areas, they do not provide information on migration routes or the factors that influence the dispersal of turtles. In recent years, multidisciplinary approaches have combined MSA and high-resolution ocean circulation modeling to further our understanding of marine turtle movement (e.g., Putman and Naro-Maciel, 2013; Naro-Maciel et al., 2017). These studies have revealed that while ocean currents play a vital role in the spatial distribution of turtles they do not always correlate with MSA results, suggesting that other factors such as swimming behavior play important roles in the distribution of turtles (Putman and He, 2013; Hays et al., 2014a; Naro-Maciel et al., 2014b, 2017; Christiansen et al., 2016).
Finally, MSA can also help identify how threats and conservation efforts in foraging areas may affect nesting populations and vice versa, and could allow scientists and managers to study changes in population composition over time (also see Human Impacts and Threat Assessment section). For example, a recent study of green turtles at six major feeding grounds along the Great Barrier Reef used MSA to show that fewer juvenile turtles (61, 52, and 47% at the three most northern foraging grounds, respectively) originated from the northern Great Barrier Reef nesting beaches when compared to adult turtles (91, 69, and 69%), supporting a hypothesis that hatching success at northern Great Barrier Reef rookeries has been declining since the mid-1990s (Jensen et al., 2016a).
Cautionary Tales: The Importance of Understanding MSA Limitations
While considerable progress has been made, it is important to recognize that knowledge gaps still exist, and efforts to sample new rookeries and employ higher resolution markers need to continue to enable accurate MSA. This is highlighted by the fact that orphan haplotypes (see Glossary) are still common, and several recent cases illustrate how misinterpretation of MSA results may lead to incorrect conclusions under such scenarios. In one instance, incomplete baseline sampling led to the potential misinterpretation of MSA results for foraging juveniles. CM-A13 is the dominant Mediterranean haplotype, and was detected among foraging juveniles in the Greater Caribbean region. This introduced the possibility of dispersal from the Mediterranean into the western Atlantic (Bjorndal and Bolten, 2008; Anderson et al., 2013). However, this haplotype was later found to occur at low frequency in the Florida nesting aggregation (Shamblin et al., 2015a). Analysis of the mtSTR for CM-A13 turtles nesting and foraging in Florida yielded a shared repeat haplotype that was not among the 33 described thus far from the Mediterranean (Tikochinski et al., 2012), revealing that the foraging turtles most likely originated locally within the Greater Caribbean region (Shamblin et al., 2015b). In a second example, in the northern Greater Caribbean region, CM-A1 and CM-A3 are the dominant haplotypes shared among the rookeries of Quintana Roo, Mexico; Guanahacabibes Peninsula, Cuba; and Florida rookeries (Encalada et al., 1996; Ruiz-Urquiola et al., 2010; Shamblin et al., 2015a). An MSA of juvenile green turtles in Texas foraging grounds suggested a large Florida rookery contribution based on the presence of these haplotypes at high frequencies (Anderson et al., 2013). Yet later analysis of the green turtle rookery at Rancho Nuevo, Tamaulipas, Mexico found CM-A1 and CM-A3 in the same frequencies as the central Florida MU, so the source of the majority of juveniles foraging in Texas remained unresolved using standard markers (Shamblin et al., 2015a, 2017). However, mitogenomic sequencing of the CM-A1 females nesting in Rancho Nuevo and Florida identified a single diagnostic mtDNA SNP between the two rookeries. This marker demonstrated that turtles nesting in Florida and Tamaulipas represented distinct populations. Subsequent MSA including the mtDNA SNP excluded Florida as a source of Texas foraging juveniles, and established the strong connectivity between this foraging aggregation and the newly proposed western Gulf of Mexico MU (Shamblin et al., 2017).
Delineating Population Boundaries: Best Practices and Remaining Challenges
The case studies discussed above for green turtles highlight several important insights for using genetics to inform our understanding of population boundaries and connectivity. First, the presence of multiple MUs along the Florida and Mexican coasts demonstrate the importance of sampling the complete geographic extent of a nesting aggregation to test for structure, rather than assuming none is present. Second, the CM-A13 story from the western Atlantic reinforces the importance of adequate rookery sampling to capture rare haplotypes that are present at low frequencies. Third, the Texas foraging aggregation example highlights that a low frequency of orphan haplotypes from a foraging aggregation does not necessarily imply that all potential source rookeries have been adequately sampled. As haplotypes are subdivided into ever-larger numbers of distinct genetic markers, there is also a greater need to increase sampling depth at rookeries and foraging aggregations to reduce sampling error. This includes sampling of males at breeding grounds, which is a frequently overlooked component necessary to estimate male-mediated gene flow and define population boundaries. Finally, taken collectively these examples clearly illustrate that there is not a “one size fits all” solution to potential genetic resolution issues. Efforts that have proven useful in some situations have failed to detect any additional structure in others, and finding the “best” approach for a specific biogeographical scenario may involve some trial and error.
In addition to the examples discussed above, many new genetic studies of nesting and foraging grounds in green turtles and other species are already underway, guaranteeing improvement of our understanding of marine turtle population boundaries and connectivity in the future. However, despite these advances, challenges in the interpretation of genetic data also remain. Turtle mitochondrial DNA evolves slowly relative to that of many other vertebrate species (Avise et al., 1992), so demographic isolation can sometimes outpace the rates of mutation and drift. This may diminish the ability of these genetic markers to detect such demographic changes, and consequently, apparent lack of population structure may reflect a lack of power of the markers employed rather than true panmixia, particularly at demographic levels. Additionally, genetic differentiation in marine turtles is typically not well correlated with geographic distance, so there is no universal benchmark that can predict the scale of structure across populations. In many cases, rookeries several hundreds of kilometers away are not genetically differentiated using traditional markers, but may not have significant contemporary demographic connectivity. Therefore, best practices entail understanding the strengths and limitations of each genetic dataset, and evaluating it along with data from complementary sources (e.g., flipper tag returns, telemetry, stable isotopes, oceanographic modeling, the relative population differentiation observed elsewhere for a species, etc.) to make inferences about population boundaries and connectivity. Integrating this information helps ensure that the best available science is used to inform management decisions. While genetic data are key components of these evaluations, in some cases there may be valid reasons to consider treating rookeries as demographically distinct for management, even in the absence of genetic evidence that they are isolated.
Life History
How Old Are Female Turtles When They Start to Reproduce?
Age to maturity (ATM) is one of the key parameters required for estimating how long recovery could take for depleted populations because it is needed to calculate generation time. Determining ATM is difficult in marine turtles due to challenges related to both longevity and life history, and both empirical and indirect approaches have been pursued. For example, coded wire tags were injected into juvenile Kemp's ridley turtles (Lepidochelys kempii), and recovered via dead stranded animals years later to estimate a minimum ATM of 10–14 years (Shaver and Caillouet, 1998; Caillouet et al., 2011). This was similar to an ATM using capture-mark-recapture (CMR) and skeletochronology in headstarted Kemp's (10–17 years; Snover et al., 2007), but longer than an estimate from captive animals (5–12 years; Bjorndal et al., 2014), suggesting that growth and maturity may differ in the wild. Skeletochronology has also shed light on ATM in green, loggerhead, and leatherback turtles (Avens et al., 2009; Turner Tomaszewicz et al., 2015), as have a small number of direct observational studies from headstarted turtles (e.g., Florida and Caribbean green turtles, Keske et al. (2016) and Bell et al. (2005), respectively), CMR via carapace punches in South African loggerheads (Tucek et al., 2014) or growth rates (Casale et al., 2009). The general consensus emerging from these studies, is that each species and perhaps each population may have different ATM ranges.
Techniques such as genetic CMR offer exciting new opportunities to directly measure ATM, however the process may require significant cost and long-term commitment of several decades, depending on the species. For example, Dutton and Stewart (2013) began a long-term genetic CMR effort in 2009 with leatherback hatchlings at Sandy Point National Wildlife Refuge (US Virgin Islands) with the goal of live-sampling every hatchling leaving the nesting beach. Genetic fingerprints developed through the use of microsatellites (Stewart and Dutton, 2011) were applied to DNA from the hatchling samples to identify each one individually, effectively serving as a lifelong genetic “tag.” Concurrently, they sampled and genetically fingerprinted each new nesting female at Sandy Point with the same microsatellite markers to identify when the former hatchlings return as nesting adults (Stewart and Dutton, 2011, 2014). The project continues annually, with new nesting females being compared with hatchling turtles that left the beach years earlier. To date, there have been no matches (K. Stewart and P. Dutton, unpublished data), but continual investigation using microsatellites in combination with new SNP markers should yield results that are informative for leatherback ATM estimation in the near future (albeit only for the female portion of the population). This genetic fingerprinting technique also has potential for estimating other parameters essential to accurate population models for conservation management, such as survivorship from hatchling stage to adulthood.
In addition, much else may be learned from knowing the genetic identities of thousands of individuals. For example, leatherback tissue samples from stranded animals, in-water captures and bycatch may all be genetically identified and compared to known individuals (through comparison to data from the larger stocks or from hatchlings sampled at Sandy Point). However, reliably detecting matches requires profiling a high proportion of the population, and for some species the turtles are too numerous or accessing all potential nesting habitat is not feasible. Given these constraints as well as the costs and required time investment, this approach is currently best applied under certain contexts, such as in smaller populations where turtles have high site fidelity, long-term project investment is feasible (including the capacity to store and track DNA samples for years to decades), and where there are clear research questions (Table 3). However, rapidly evolving high-throughput technologies with the capacity to analyze thousands of samples concurrently will make it more feasible to conduct mass-tagging experiments in the future, provided that infrastructural support is available.
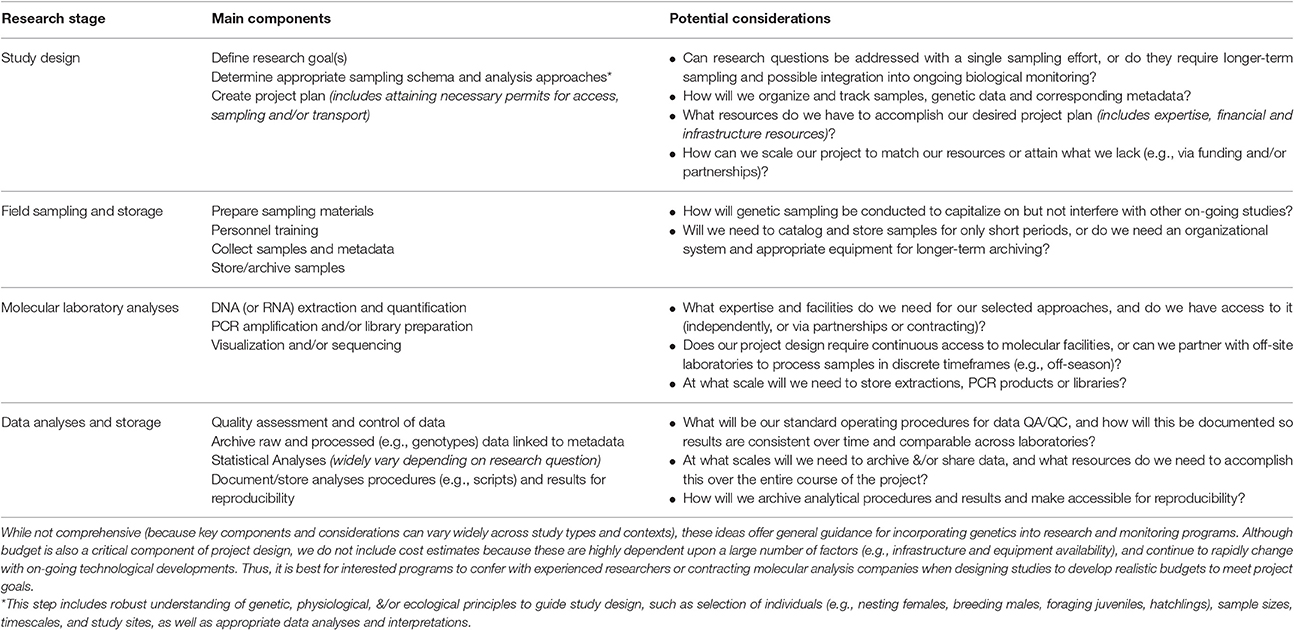
Table 3. Generalized summary of marine turtle genetic/genomic research to inform future project development.
How can Genetics Be Used to Assess the Male Component of the Population?
Genetic fingerprinting may also yield important information about a component of the adult marine turtle population that is rarely assessed, the males. Questions related to the sex ratios of breeding adults, mating patterns such as levels of multiple paternity, and male reproductive site fidelity may all be answered through intensive studies of nesting females and their hatchlings. By comparing maternal and hatchling leatherback genetic identities at Sandy Point, Stewart and Dutton (2011, 2014) were able to reconstruct the genetic identities of individual males contributing to each nest laid during several nesting seasons. Using this approach, males may be identified without being sampled directly (Wright et al., 2012a; Tedeschi et al., 2015; Sari et al., 2017). Then by comparing all male genetic identities within a nesting season, the number of successful breeding males may be determined, providing an annual population census for all males and females. However, it is important to note that these estimates represent the minimum number of breeding males, since all males may not successfully sire offspring due to mating and sperm competition. This work also requires consistent monitoring of females and nests directly because the maternal identity of each nest must be known to assess females and hatchlings and then by inference, the male identities.
In addition, the levels of multiple paternity at breeding sites are able to be determined with this approach targeting females and hatchlings. Multiple paternity has been detected in hawksbills (Phillips et al., 2013), loggerheads (Sari et al., 2017), leatherbacks (Stewart and Dutton, 2011), olive ridleys (Jensen et al., 2006), and green turtles (FitzSimmons, 1998), and the number of studies in this area is increasing. By tracking male identities over several nesting seasons, male remigration/breeding intervals may also be determined by recording how often a known male is detected in hatchling genetic signatures. However, to be successful, this approach requires consistent and comprehensive monitoring over time, and male turtles without any or fewer reproductive successes due to competition and other factors can be missed.
Nonetheless, this application of genetic fingerprinting has the potential to advance our understanding of how males contribute to nesting populations. Genetic studies on males may be undertaken in conjunction with other methods, such as satellite tracking (Hays et al., 2010, 2014b) to improve estimates of breeding sex ratios across populations and to answer questions about site fidelity and how rookeries are connected to form populations. By identifying males that have made reproductive contributions to each clutch, we can also assign individual hatchlings to fathers and assess the relative contributions by different fathers (for clutches with multiple paternity), and therefore gain insight on reproductive strategies and success for the males as well as the females (Stewart and Dutton, 2011). However, complementary studies sampling in-water males at breeding grounds are needed to assess the number of males in the population with no reproductive success (e.g., due to competition).
Operational sex ratios (OSRs) or breeding sex ratios (BSRs) are important to understand and monitor over time, particularly given growing concern that climate change will affect sand temperatures where marine turtle nests incubate and alter hatchling sex ratios. As clutches of hatchlings are generally female-biased (Wright et al., 2012a; Hays et al., 2014b), understanding how this translates to adult sex ratios is important for tracking effects over time and understanding climate change risks to nesting populations. To date, from the studies that looked at this ratio specifically, there does not appear to be a reduction in the proportion of males in breeding populations, despite there being female biases in the hatchling sex ratios. For example, Wright et al. (2012b) found 1.4 males for every female in a green turtle population, Stewart and Dutton (2011, 2014) found 1.4 males and 1 male (respectively) for every female in leatherback turtles, and Phillips et al. (2013) found 1.1 males for every female in a hawksbill population. In all of these studies, there were more males than females detected within the breeding population within a single year. Developing baselines for populations for OSRs or BSRs will be important for monitoring risk from climate change to populations over time.
What Reproductive Strategies and Behaviors Do Turtles Use?
Robust estimates of reproductive vital rates such as clutch frequency, the number of clutches a female lays in a given nesting season, and remigration interval (the number of years a female skips between nesting seasons) are important for monitoring and modeling population recovery. However, some females may disperse their nests beyond the limits of the areas of beach monitoring for tagging or observation, or there may be insufficient resources to conduct consistent monitoring, leading to missed turtles, sparse recapture data, and biased estimates of these key parameters. Shamblin et al. (2011) developed a technique to address this limitation by extracting maternal genomic DNA from freshly laid loggerhead eggs, permitting individual identification of females without the need to physically intercept them during the nesting process. This type of sampling allows genetic CMR on spatial scales that would be logistically impossible to replicate through traditional tagging approaches. A subpopulation-scale genetic CMR project has been underway since 2010 for loggerhead turtles nesting in the United States north of Florida to refine nesting female abundance estimates, assess reproductive parameters, determine the level of nest site fidelity, and calculate annual survival rates (www.seaturtle.org/nestdb/genetics). Nest sampling may also supplement traditional tagging approaches thus improving annual censuses of nesting populations where nesting females cannot be consistently observed. For example, Frey et al. (2014) used parentage analysis and genetic fingerprinting for a limited number of known Kemp's ridley mothers along with hatchlings from unidentified nests to assign mothers for every nest. They were able to reconstruct genotypes for the mothers that were not observed and match unknown nests to mothers that had been sampled. They found that the number of nesting females in Texas was likely to have been underestimated based solely on nest counts or on the number of known mothers.
Human Impacts and Threat Assessments
Though it is well-established that many different human threats impact marine turtles, it is challenging to link human activities to population level effects, which is often key information for conservation and management action (Wallace et al., 2011). For example, to understand how human-caused mortality in foraging grounds may influence population abundance declines, we must distinguish the impacts among nesting stocks. Tackling these problems is unquestionably multi-faceted, and the role of genetics in unraveling these complexities has continued to expand in recent years. Genetic tools have been used to quantify impacts over both short and long-term timescales, and are well-suited for many recently identified and emerging threats such as climate change.
How Are Populations Impacted by Threats Away from Nesting Grounds?
For threats occurring in foraging grounds or during migration transit, identification of natal origins is crucial to assess and compare impacts within and across populations. Advances in genetic marker resolution and analytical tools (see Box 1) have allowed recent studies to make substantial headway in accomplishing this goal. For example, LaCasella et al. (2013) used MSA on loggerhead turtles bycaught in the US pelagic longline fishery in the North Atlantic Northeast Distant (NED) region to estimate that over 99% of juveniles using NED habitat belong to the Northwest Atlantic DPS. Researchers have used comparable approaches to identify population sources of harvested green turtles in Malaysia (Joseph et al., 2014) and ghost fishing net mortalities of olive ridley turtles in Australia (Jensen et al., 2013b), however these studies were constrained by small sample sizes and shared or orphan haplotypes.
Employing finer resolution nuclear markers, Stewart et al. (2013) used an assignment testing method combined with mtDNA-based MSA to determine source populations of individual leatherbacks bycaught in the US western North Atlantic pelagic longline fishery (Stewart et al., 2016). This quantified differential natal stock origins of leatherbacks impacted across 11 geographical regions, shining a light on the disproportionate impact on Costa Rican leatherbacks—one of the only North Atlantic populations not experiencing significant nesting increases (Troëng et al., 2007). Similarly, Clusa et al. (2016) coupled genetic assignment with stable isotope analyses to determine that bycatch risk to foraging loggerhead turtles in the Mediterranean Sea is dependent on the geographical region of a fishery, rather than differential fishing gear types. Although MSA alone will continue to contribute to threat assessments (particularly when only mtDNA data are available), these examples highlight the increased power of combining MSA with assignment testing to understand the relative risks away from nesting beaches at finer scales. However, there are some location and species-specific limitations in the applicability of these approaches because in some cases microsatellites have not provided any added resolution relative to mtDNA markers (e.g., Northwest Atlantic loggerheads; Bowen et al., 2005).
While bycatch is one of the principal threats to marine turtle populations globally (Wallace et al., 2010a), genetic assignment has potential to inform assessments of other human impacts, such as boat strikes, poaching or marine macro-debris (e.g., ghost fishing nets), as well as additional conservation contexts such as identification of differential foraging habitat use among populations (e.g., for critical habitat assessments). These applications will be most biologically informative when comprehensive genetic characterization of all potential natal origin stocks has been conducted (see Social Dimensions Section below).
How Do Recent Population Declines Affect Marine Turtle Long-Term Resilience?
Many marine turtle populations have suffered large declines due to anthropogenic activities, and there is evidence that human-caused reductions began several centuries ago (Bjorndal and Jackson, 2003; McClenachan et al., 2006). Some populations have shown encouraging signs of recovery due to conservation actions in recent years, while others continue to remain low or further decrease (NRC, 2010). Marine turtles of today may be relics of historically larger and possibly biologically different populations, but it is unclear if or how such declines might impact population recovery and resiliency. One way that species declines (natural or human caused) can impact population resiliency is through the loss of genetic diversity underlying phenotypic variation, which may reduce adaptive potential and increase inbreeding impacts (Willi et al., 2006; Allendorf et al., 2013). For example, population bottlenecks have been shown to have strong negative impacts on hatching success in endangered birds (Heber and Briskie, 2010), and low major histocompatibility complex (MHC) genetic variation in Tasmanian devils (Sarcophilus harrisii) contributes to a high susceptibility to deadly transmissible cancers (Jones et al., 2004; Siddle et al., 2010). Longevity and other life history traits of marine turtles provide buffers from diversity loss relative to other taxa (e.g., if depletion does not persist over several generations, some populations can recover quickly without necessarily losing genetic diversity; Dutton et al., 1999), but it may also make it challenging to detect. Early research suggested that contemporary genetic bottlenecks in small nesting populations of Mediterranean loggerheads could be mitigated by male-mediated gene flow (Carreras et al., 2007). However, a recent study in olive ridley turtles in Mexico discerned a human-induced contemporary bottleneck across an entire metapopulation where strong impacts of a commercial fishery from 1960 to 1990 significantly reduced allelic diversity (Rodríguez-Zárate et al., 2013) as well as phenotypic variation of reproductive modes (i.e., solitary nesters vs. arribadas; Abreu-Grobois and Plotkin, 2008). Additionally, lower levels of genetic variation in younger vs. older turtles were recently reported in Yucatan peninsula hawksbills (Gonzalez-Garza et al., 2015), which is the largest nesting population in the Atlantic and critical for long-term hawksbill persistence (Mortimer and Donnelly, 2008). This work highlights that although marine turtles have buffers to maintain genetic diversity in the face of human-driven declines, they are not completely immune, and once it is lost it would likely take a long time to regenerate (i.e., low diversity may persist even as abundances of depleted populations recover).
These studies are an important first step in advancing our understanding of diversity loss and maintenance in marine turtles, but it is not yet known if or how such changes negatively impact marine turtle population resiliency, particularly in the face of other stressors such as disease and climate change. To our knowledge, only one study to date has investigated connections between genetic variation and phenotypic traits related to fitness in marine turtles, and there were no significant relationships between measures of reproductive success (i.e., clutch size, hatching success, and frequency of infertile eggs) and neutral nuclear loci in hawksbill turtles (Gonzalez-Garza et al., 2015). However, examination of functional genomic regions (MHC loci) in loggerhead turtles suggested that locally adapted pools of MHC alleles at the margins of the population distribution combined with male-mediated gene flow may be key to sustaining adaptive potential across the entire rookery (Stiebens et al., 2013a,b). As diversity is increasingly characterized across more marine turtle species and geographical regions (e.g., Ng et al., 2014; Vargas et al., 2016) and capacity to assess both neutral and adaptive genomic variation expands, our understanding of how human activities might impact marine turtle genomic diversity and ultimately long-term resiliency will continue to advance.
Emerging Applications for Threat Assessment: How Are Marine Turtles Affected by Habitat Alterations?
Habitat loss and degradation created by coastal development, pollution, climate change and other human activities increasingly threaten marine turtles at nesting and foraging grounds. In addition to direct mortalities, these may impact populations indirectly in ways that are much more difficult to quantify (such as altering population connectivity, demographic structure, or imparting sub-lethal impacts). Techniques such as MSA and assignment testing, passive maternal CMR via eggshell sampling, and gene expression assays have good potential to understand indirect consequences of human-caused habitat alteration. For instance, research is currently underway combining MSA and sex determination via hormone assays in foraging juvenile turtles to assess shifting sex ratios due to increasing sand temperatures at rookeries (M. Jensen and C. Allen, unpublished data). Tezak et al. (2017) also recently validated an immunohistochemical method to quantify protein expression of cold-induced RNA-binding protein (CIRBP) that reliably identifies hatchling sex, which could have potential for adaptation into a minimally invasive gene expression assay for hatchling sex determination. If possible, this may support rapid, direct monitoring of sex ratios over larger spatial and temporal scales, facilitating robust estimates of climate change impacts on this important demographic parameter. Functional genomics may also be useful in understanding underlying genomic and physiological processes and investigating sub-lethal impacts. For example, gene expression assays have recently been used to begin studying the effects of exposure to endocrine-disrupting pollutants in hatchling development (Gomez-Picos et al., 2014) and heritability of physiological stress responses to increased incubation temperatures under climate change (Tedeschi et al., 2016). Recently identified genes underlying thermal stress responses in marine turtle embryos also may serve as candidates to examine the adaptive capacity of different populations and species to cope with increasing nest incubation temperatures (Bentley et al., 2017).
Finally, human activities such sea wall construction and beach nourishment projects that restrict or remove access to key marine turtle reproductive habitats continue to increase as humans react to these threats themselves. These are occurring in concert with changes in habitat suitability due to warming and sea level rise (Pike, 2013), though it currently remains unclear how much plasticity or local adaptation exists in climatic niches across marine turtle populations (Mazaris et al., 2015). Evolutionary history tells us that extant marine turtles have found ways to persist in the face of large-scale climatic and habitat changes across millennia, and these strategies will likely help buffer impacts of ongoing environmental changes on marine turtle population viability. However, evidence of recent radiation and colonization events along with existence of many extinct marine turtle lineages also reminds us that evolutionary processes are dynamic, and that persistence is not guaranteed (Pritchard, 1997). We must also recognize that such habitat alterations are co-occurring with other human-caused stresses on marine turtle populations. Future research using approaches such as genetic CMR, assignment testing and functional genomics could be leveraged to track and understand changes due to these habitat changes over space and time at individual, rookery and population levels, possibly addressing questions such as: Under what contexts will turtles relocate to another rookery or lay eggs in sub-optimal or unviable conditions? How does this affect population connectivity and demographic structure? Do species exhibit local adaptation or broad plasticity in nesting climatic niches?
Social Dimensions
Collaborative Synthesis
It's common for researchers to conduct genetic studies of nesting populations with a local or regional focus. However, extensive dispersal and migrations of marine turtles across large geographical distances necessitates large-scale analyses and international collaboration to resolve connectivity and phylogeography questions. This is particularly important for identifying population “units to conserve” (see Box 2) and for conducting meaningful MSA and individual assignments that require a comprehensive rookery baseline dataset of potential natal stock sources. Lack of this information can significantly limit MSA and assignment inferences, and in some cases can lead to inaccurate interpretation of results (Shamblin et al., 2017). In the case of oceanic juvenile loggerheads foraging in the North Atlantic, baseline 817 bp haplotype data were initially lacking for several potentially contributing rookeries, preventing robust MSA. In 2009, NOAA-NMFS and the Archie Carr Center for Sea Turtle Research at the University of Florida convened an Atlantic-Mediterranean Loggerhead Genetics Working Group (LGWG) to bring together researchers and assess the state of knowledge of loggerhead turtle genetics in the Atlantic and Mediterranean basins. While each group was working on regional studies of loggerhead turtle stock structure, they did not individually have access to complete datasets for the whole Atlantic that is required for meaningful MSA. The LGWG provided a formal structure for individual sample and data holders to safely share data prior to publication of regional datasets to address data gaps and develop large-scale, synthetic stock structure analyses and facilitate robust MSA. The LGWG also recognized that the baseline would require continual updating as additional rookery data become available to maintain relevance for MSA in the future, and established a website to provide a forum to obtain updated results (Shamblin et al., 2014). These cooperative efforts represent significant advances in marine turtle biology and conservation, and directly enabled the assignments of animals bycaught in fisheries. Although such syntheses require substantial time commitments and large-scale international cooperation, continued efforts in other species and regions will be instrumental in facilitating comprehensive threat assessments and mitigation efforts. The reluctance or lack of capacity in many countries to deal with the bureaucratic burden of CITES has been an impediment to interchange of samples for larger-scale, comparable analyses, and is likely to continue without substantial investment in infrastructural support. However, opportunities may exist for establishing or expanding collaborations like the LGWG and for building regional capacity or a network of in-country laboratories to generate and share genetic data within existing frameworks such as the IUCN Marine Turtle Specialist Group, The State of the World's Sea Turtles (SWOT) working group, or in some cases bilateral collaborations (see Matsuzawa et al., 2016).
Public Engagement and Outreach
In addition to collaborative efforts within the scientific community, another advance has come from sharing results with stakeholders and the public in accessible platforms to promote citizen engagement to achieve goals in large-scale synthetic genetic projects. For example, the Northern Recovery Unit Loggerhead DNA Project is using genetic CMR that spans nearly all beach monitoring programs from the Florida-Georgia border through North Carolina. Representatives from these projects enter nesting data for each recorded clutch in an online nesting database maintained by seaturtle.org. Following individual assignment of each genetic sample, a turtle ID unique to each nesting female is uploaded into the database. This provides volunteers collecting samples for the genetics project real time feedback on female identity as samples are processed. Participants from each beach project have access to the nesting history for any female that has ever laid a clutch on their beach. This feedback mechanism has strongly contributed to volunteer engagement and buy-in, particularly when the project was in its infancy. There is also a summary webpage on the project available to the general public that highlights some basic demographic data at various spatial scales and includes some example nesting histories. A project of this scale simply would not be possible without the support and cooperation of the marine turtle management programs in the respective state agencies and the many organizations and volunteers that comprise the marine turtle nest monitoring networks in each state. Integrating collaborative initiatives with easy to use, standardized methods enables consistent data collection and maintenance across the subpopulation and facilitates large-scale analyses. As these online resources and social media tools for citizen science become more accessible, we anticipate increasing opportunities to use this approach across a variety of marine turtle genetics research applications.
Remaining Challenges and Future Directions
Lessons Learned and Best Practices
Several key themes emerge from the diverse examples discussed that are useful in guiding future projects using genetic tools for marine turtle biology and conservation research. First, there is not one best approach. Rather, it is most important to match the right tools to the research question and biological context, and for researchers employing genetics to understand the underlying theory to ensure appropriate inferences from their data (Karl et al., 2012). Particularly in conservation contexts, budget constraints often need to be considered, making it even more important to prioritize research and management goals to make sure they are in line with research study designs. Some conservation questions may be adequately addressed using traditional markers or without sampling every individual or location. However, it is also essential to recognize and pursue synergistic opportunities that can build capacity for future research and progress our state of knowledge. Many of the advances discussed here were made by combining banked specimens with new samples and/or re-analyzing samples with new genetic markers, demonstrating the importance of long-term biological collections. Insights of future studies using new technologies and/or evaluating spatiotemporal patterns will undoubtedly similarly rely on such resources, so while it is not always feasible to collect and store samples without a specific purpose, it is important to support these efforts when possible. Additionally, it can be difficult to justify using limited funds to develop resources that do not immediately address management questions (such as genome assemblies and annotation, new techniques or markers, pedigrees, and genetic linkage maps), but these resources open the door for a tremendous diversity of future studies highly relevant to conservation (e.g., well-annotated genomes and other molecular resources facilitate cost-effective studies of environmental adaptation and disease impacts in salmon and mammals; Miller et al., 2011; Epstein et al., 2016). By reaching out across disciplines, marine turtle biologists may likely find opportunities to partner with scientists in other academic fields as well as the biotechnology industry with expertise, interest and resources to develop these tools to build future capacity for marine turtle conservation genomics.
Secondly, undertaking large-scale or long-term sampling and monitoring programs such as the genetic fingerprinting projects in St. Croix and the Southeast US require substantial forethought of logistical coordination, standardized sample collection and storage, and data management. For programs embarking on incorporating genetic sampling into monitoring plans for the first time, learning from the challenges and best practices that have emerged from current genetic fingerprinting projects and long-term tagging databases, and investing time in developing infrastructure, training and data organization strategies can greatly facilitate project success (Table 3). Many of the examples detailed in this review also demonstrate the importance of working groups and international collaborations in determining global marine turtle population boundaries, life history strategies, and threat assessments. As we strive to put together the remaining pieces of these puzzles and address outstanding big questions in marine turtle biology and conservation, working together across boundaries will continue to be paramount to success.
Finally, we recognize that for many conservation programs, despite continued cost reductions and increasing technological accessibility (Box 1), it may still not be feasible to independently integrate genetic sampling and analyses into biological monitoring due to financial, expertise and infrastructure barriers. However, interested organizations may be able build partnerships and scale projects to capitalize on available resources (Table 3). For example, some programs may have capacity to collect and store samples, but lack funding or infrastructure to conduct analyses. These groups can develop sampling schemes best suited for their resources and biological questions by conferring with experienced researchers and using validated methods for collection and storage (e.g., Dutton and Stewart, 2013) in preparation for future analysis and funding opportunities. Organizations may also be able to build partnerships with other wildlife genetics researchers that have existing infrastructure and expertise to make costs feasible with existing resources or work collaboratively to seek funding together. While it certainly does not make sense for every program to conduct extensive genetic sampling, employing these and other creative strategies can help make these approaches and the knowledge they generate accessible to the broader marine turtle conservation research community.
Emerging Applications
As we look toward the future, what are the key remaining challenges, and how can we use genetics and genomics to address major unresolved questions in marine turtle biology, as well as emerging issues such as climate change? New studies creatively adapting traditional approaches will continue to play important roles, and there are also many exciting new techniques with great potential to expand our knowledge. Here, we highlight several promising avenues on the horizon, recognizing that there are many more possibilities that will likely emerge. First, integrating genetic tools with complementary data types (such as stable isotopes, skeletochronology, hormones, telemetry, unmanned aerial vehicles, and oceanographic modeling) has recently provided novel insight into marine turtle biology (Stewart et al., 2013; Naro-Maciel et al., 2014a). Many of these fields are undergoing revolutionary technological advances akin to those occurring in genomics, so the potential for combined novel applications will likely continue to grow into the future. For example, “landscape genomics,” a discipline integrating genetic and environmental data to understand how environmental factors shape population connectivity and adaptation, is almost two decades old and has contributed to a wide-range of conservation management applications (Manel and Holderegger, 2013). However, high-resolution environmental data resources in the oceans have been more limited compared to terrestrial ecosystems, so analogous studies in the marine environment have lagged behind. But recent advances have facilitated the rapid expansion of seascape genomics studies that have diverse applications in conservation and resource management contexts (Benestan et al., 2016; Selkoe et al., 2016). These integrative approaches have good potential in marine turtle studies for tackling emerging threats such as monitoring foraging grounds to detect early signs of recruitment decline, or tracking possible phenological and range shifts due to habitat alteration and climate change. Minimally invasive techniques that have been validated and are currently being employed in other marine wildlife may also prove to be useful in marine turtles, such as environmental DNA (eDNA) sampling to estimate presence of a particular species (Kelly et al., 2014), and gene expression profiling via blood sampling to evaluate sublethal impacts of environmental stressors such pollutants or capture stress (Morey et al., 2016). High-throughput sequencing (HTS; see Box 1) also holds promise for expanding our understanding of fundamental marine turtle ecology and evolution. The generation of genome-wide datasets open the door to phylogeographic and comparative genomic analyses that have yielded remarkable insight into evolutionary histories in other taxa (Cammen et al., 2016), but have not been possible in marine turtles due to data and genomic resource limitations. But beyond this, the versatility of HTS offers potential for a broad diversity of applications, such as genome-wide association studies (GWAS) to identify the genomic basis of key phenotypic traits (Korte and Farlow, 2013), rapid genotyping of individuals tracked over larger spatio-temporal scales (e.g., to identify phenotypic plasticity in key behaviors, such as nesting site fidelity or breeding intervals), or evaluating genomic signatures of introgression (Reis et al., 2009; Vilaça et al., 2012) and monitoring future hybridization events under changing demographic conditions (e.g., altered sex ratios under climate change).
Conclusions
Over the past several decades, genetics have helped answer an increasing diversity of research questions in marine turtle biology and conservation. Rapidly expanding genetic and genomic toolboxes will undoubtedly continue to expand our knowledge in coming years. By collaborating and integrating these innovations with those in complementary disciplines, marine turtle conservation biologists can leverage these tools to tackle the remaining and emerging challenges in marine turtle ecology, evolution and conservation management.
Author Contributions
LK, MJ, KS, BS, and PD developed the ideas, performed the literature searches, and wrote the manuscript.
Conflict of Interest Statement
The authors declare that the research was conducted in the absence of any commercial or financial relationships that could be construed as a potential conflict of interest.
Acknowledgments
Funding was provided by the National Oceanic and Atmospheric Administration, Southwest Fisheries Science Center, the Ocean Foundation to KS, the National Research Council of the National Academies of Science, Engineering and Medicine to LK, Ocean Associates Inc. to MJ, and the Daniel B. Warnell School of Forestry and Natural Resources at the University of Georgia to BS. The authors thank C. Turner Tomaszewicz and two reviewers for useful comments that improved the manuscript.
References
Abreu-Grobois, F. A., and Plotkin, P. (IUCN SSCMarine Turtle Specialist Group). (2008). Lepidochelys olivacea, Olive ridley. The IUCN Red List of Threatened Species 2008:e.T11534A3292503. Available online at: www.iucnredlist.org/pdflink.3292503
Aggarwal, R. K., Velavan, T. P., Udaykumar, D., Hendre, P. S., Shanker, K., Choudhury, B. C., et al. (2004). Development and characterization of novel microsatellite markers from the olive ridley sea turtle (Lepidochelys olivacea). Mol. Ecol. Notes 4, 77–79. doi: 10.1046/j.1471-8286.2003.00574.x
Ali, O. A., O'Rourke, S. M., Amish, S. J., Meek, M. H., Luikart, G., Jeffres, C., et al. (2016). Rad capture (Rapture): flexible and efficient sequence-based genotyping. Genetics 202, 389–400. doi: 10.1534/genetics.115.183665
Allendorf, F. W., Luikart, G., and Aitken, S. N. (eds). (2013). Conservation and the Genetics of Populations, 2nd Edn. Hoboken, NJ: Blackwell Publishing Limited.
Alstad, T. I., Shamblin, B. M., Bagley, D. A., Ehrhart, L. M., and Nairn, C. J. (2011). Isolation and characterization of tetranucleotide microsatellites from the leatherback turtle (Dermochelys coriacea). Conserv. Genet. Resour. 3, 457–460. doi: 10.1007/s12686-010-9378-z
Amorocho, D. F., Abreu-Grobois, F. A., Dutton, P. H., and Reina, R. D. (2012). Multiple distant origins for green sea turtles aggregating off Gorgona Island in the Colombian eastern Pacific. PLoS ONE 7:e31486. doi: 10.1371/journal.pone.0031486
Anderson, J. D., Shaver, D. J., and Karel, W. J. (2013). Genetic diversity and natal origins of green turtles (Chelonia mydas) in the western Gulf of Mexico. J. Herpetol. 47, 251–257. doi: 10.1670/12-031
Andrews, K. R., Good, J. M., Miller, M. R., Luikart, G., and Hohenlohe, P. A. (2016). Harnessing the power of RADseq for ecological and evolutionary genomics. Nat. Rev. Genet. 17, 81–92. doi: 10.1038/nrg.2015.28
Avens, L. A., Taylor, J. C., Goshe, L. R., Jones, T. T., and Hastings, M. (2009). Use of skeletochronological analysis to estimate the age of leatherback sea turtles Dermochelys coriacea in the western North Atlantic. Endanger. Species Res. 8, 165–177. doi: 10.3354/esr00202
Avise, J. C., Bowen, B. W., Lamb, T., Meylan, A. B., and Bermingham, E. (1992). Mitochondrial DNA evolution at a Turtle's Pace: evidence for low genetic variability and reduced microevolutionary rate in the testudines. Mol. Biol. Evol. 9, 457–473.
Bagda, E., Bardakci, F., and Türkozan, O. (2012). Lower genetic structuring in mitochondrial DNA than nuclear DNA among the nesting colonies of green turtles (Chelonia mydas) in the Mediterranean. Biochem. Syst. Ecol. 43, 192–199. doi: 10.1016/j.bse.2012.03.015
Bass, A. L., Epperly, S. P., and Braun-McNeill, J. (2006). Green turtle (Chelonia mydas) foraging and nesting aggregations in the Caribbean and Atlantic: impacts of currents and behabior on dispersal. J. Hered. 97, 346–354. doi: 10.1093/jhered/esl004
Bell, C. D., Parsons, J., Austin, T. J., Broderick, A. C., Ebanks-Petrie, G., and Godley, B. J. (2005). Some of them came home: the Cayman Turtle Farm headstarting project for the green turtle Chelonia mydas. Oryx 39, 137–148. doi: 10.1017/S0030605305000372
Benestan, L., Ferchaud, A. L., Hohenlohe, P. A., Garner, B. A., Naylor, J. P., Baums, I., et al. (2016). Conservation genomics of natural and managed populations: building a conceptual and practical framework. Mol. Ecol. 25, 2967–2977. doi: 10.1111/mec.13647
Bentley, B. P., Haas, B. J., Tedeschi, J. N., and Berry, O. (2017). Loggerhead sea turtle embryos (Caretta caretta) regulate expression of stress response and developmental genes when exposed to a biologically realistic heat stress. Mol. Ecol. 26, 2978–2992. doi: 10.1111/mec.14087
Bjorndal, K. A., and Bolten, A. B. (2008). Annual variation in source contributions to a mixed stock: implications for quantifying connectivity. Mol. Ecol. 17, 2185–2193. doi: 10.1111/j.1365-294X.2008.03752.x
Bjorndal, K. A., and Jackson, J. B. C. (2003). “Roles of Sea turtles in marine ecosystems: reconstructing the past,” in The Biology of Sea Turtles, Vol. 2, eds P. L. Lutz, J. A. Musick, and J. Wyneken (Boca Raton, FL: CRC Press), 259–273.
Bjorndal, K. A., Bolten, A. B., and Troëng, S. (2005). Population structure and genetic diversity in green turtles nesting at Tortuguero, Costa Rica, based on mitochondrial DNA control region sequences. Mar. Biol. 147, 1449–1457. doi: 10.1007/s00227-005-0045-y
Bjorndal, K. A., Bolten, A. B., Moreira, L., Bellini, C., and Marcovaldi, M. A. (2006). Population structure and diversity of Brazilian green turtle rookeries based on mitochondrial DNA sequences. Chelonian Conserv. Biol. 5, 262–268. doi: 10.2744/1071-8443(2006)5[262:PSADOB]2.0.CO;2
Bjorndal, K. A., Parsons, J., Mustin, W., and Bolten, A. B. (2014). Variation in age and size at sexual maturity in Kemp's ridley sea turtles. Endanger. Species Res. 25, 57–67. doi: 10.3354/esr00608
Bolker, B. (2008). Mixed Stock Analysis in R: Getting Started with the Mixedstock Package. Available online at: http://ftp.uni-bayreuth.de/math/statlib/R/CRAN/doc/vignettes/mixstock/mixstock.pdf
Bolker, B., Okayama, T., Bjorndal, K. A., and Bolten, A. B. (2007). Incorporating multiple mixed stocks in mixed stock analysis: “many-to-many” analyses. Mol. Ecol. 16, 685–695. doi: 10.1111/j.1365-294X.2006.03161.x
Bowen, B. W., Bass, A. L., Soares, L. S., and Toonen, R. J. (2005). Conservation implications of complex population structure: lessons from the loggerhead turtle (Caretta caretta). Mol. Ecol. 14, 2389–2402. doi: 10.1111/j.1365-294X.2005.02598.x
Bowen, B. W., Meylan, A. B., and Avise, J. C. (1989). An odyssey of the green sea turtle: ascension Island revisited. Proc. Natl. Acad. Sci. U.S.A. 86, 573–576. doi: 10.1073/pnas.86.2.573
Bowen, B. W., Meylan, A. B., Ross, J. P., Limpus, C. J., Balazs, G. H., and Avise, J. C. (1992). Global population structure and natural history of the green turtle (Chelonia mydas) in terms of matriarchal phylogeny. Evolution 46, 865–881. doi: 10.2307/2409742
Bowen, B. W., Nelson, W. S., and Avise, J. C. (1993). A molecular phylogeny for marine turtles: trait mapping, rate assessment, and conservation relevance. Proc. Natl. Acad. Sci. U.S.A. 90, 5574–5577. doi: 10.1073/pnas.90.12.5574
Caillouet, C. W., Shaver, D. J., Landry, A. M., Owens, D. W., and Pritchard, P. C. H. (2011). Kemp's Ridley sea turtle (Lepidochelys kempii) age at first nesting. Chelonian Conserv. Biol. 10, 288–293. doi: 10.2744/CCB-0836.1
Cammen, K. M., Andrews, K. R., Carroll, E. L., Foote, A. D., Humble, E., Khudyakov, J. I., et al. (2016). Genomic methods take the plunge: recent advances in high-throughput sequencing of marine mammals. J. Hered. 107, 481–495. doi: 10.1093/jhered/esw044
Campbell, N. R., Harmon, S. A., and Narum, S. R. (2015). Genotyping-in-thousands by sequencing (GT-seq): a cost effective SNP genotyping method based on custom amplicon sequencing. Mol. Ecol. Resour. 15, 855–867. doi: 10.1111/1755-0998.12357
Carreras, C., Pascual, M., Cardona, L., Aguilar, A., Margaritoulis, D., Rees, A. F., et al. (2007). The genetic structure of the loggerhead sea turtle (Caretta caretta) in the Mediterranean as revealed by nuclear and mitochondrial DNA and its conservation implications. Conserv. Genet. 8, 761–775. doi: 10.1007/s10592-006-9224-8
Casale, P., and Tucker, A. D (2015). Caretta caretta, Loggerhead Turtle. The IUCN Red List of Threatened Species 2015:e.T3897A83157651. Available online at: www.iucnredlist.org/pdflink.83157651
Casale, P., d'Astore, P. P., and Argano, R. (2009). Age at size and growth rates of early juvenile loggerhead sea turtles (Caretta caretta) in the Mediterranean based on length frequency analysis. Herp. J. 19, 29–35.
Chaves, J. A., Peña, M., Valdés-Uribe, J. A., Muñoz-Pérez, J. P., Vallejo, F., Heidemeyer, M., et al. (2017). Connectivity, population structure, and conservation of Ecuadorian green sea turtles. Endanger. Species Res. 32, 251–264. doi: 10.3354/esr00809
Cheng, I.-J., Dutton, P. H., Chen, C.-L., Chen, H.-C., Chen, Y.-H., and Shea, J.-W. (2008). Comparison of the genetics and nesting ecology of two green turtle rookeries. J. Zool. 276, 375–384. doi: 10.1111/j.1469-7998.2008.00501.x
Christiansen, F., Putman, N. F., Farman, R., Parker, D., Rice, M., Polovina, J., et al. (2016). Spatial variation in directional swimming enables juvenile sea turtles to reach and remain in productive waters. Mar. Ecol. Prog. Ser. 557, 247–259. doi: 10.3354/meps11874
Clusa, M., Carreras, C., Pascual, M., Gaughran, S. J., Piovano, S., Avolio, D., et al. (2016). Potential bycatch impact on distinct sea turtle populations is dependent on fishing ground rather than gear type in the Mediterranean Sea. Mar. Biol. 163, 1–10. doi: 10.1007/s00227-016-2875-1
Conant, T. A., Dutton, P. H., Eguchi, T., Epperly, S. P., Fahy, C. C., Godfrey, M. H., et al. (2009). Loggerhead Sea Turtle (Caretta caretta) 2009 Status Review under the U.S. Endangered Species Act. Report of the Loggerhead Biological Review Team to the National Marine Fisheries Service. Washington, DC.
Dethmers, K. E. M., Broderick, D., Moritz, C., FitzSimmons, N. N., Limpus, C. J., Lavery, S., et al. (2006). The genetic structure of Australasian green turtles (Chelonia mydas): exploring the geographical scale of genetic exchange. Mol. Ecol. 15, 3931–3946. doi: 10.1111/j.1365-294X.2006.03070.x
Dethmers, K. E. M., Jensen, M. P., FitzSimmons, N. N., Broderick, D., Limpus, C. J., and Moritz, C. (2010). Migration of green turtles (Chelonia mydas) from Australasian feeding grounds inferred from genetic analyses. Mar. Freshw. Res. 61, 1376–1387. doi: 10.1071/MF10084
Díaz-Hernández, V., Marmolejo-Valencia, A., and Merchant-Larios, H. (2015). Exogenous estradiol alters gonadal growth and timing of temperature sex determination in gonads of sea turtle. Dev. Biol. 408, 79–89. doi: 10.1016/j.ydbio.2015.05.022
Duchêne, S., Frey, A., Alfaro-Núñez, A., Dutton, P. H., Gilbert, M. T. P., and Morin, P. A. (2012). Marine turtle mitogenome phylogenetics and evolution. Mol. Phylogenet. Evol. 65, 241–250. doi: 10.1016/j.ympev.2012.06.010
Dutton, D., Dutton, P. H., Chaloupka, M., and Boulon, R. (2005). Increase of a Caribbean leatherback turtle (Dermochelys coriacea) nesting population linked to long-term nest protection. Biol. Cons. 126, 186–194. doi: 10.1016/j.biocon.2005.05.013
Dutton, P. H., and Stewart, K. (2013). A method for sampling hatchling sea turtles for the development of a genetic tag. Mar. Turt. Newsl. 138, 1–7.
Dutton, P. H., Balazs, G. H., LeRoux, R. A., Murakawa, S. K. K., Zárate, P., and Martínez, L. S. (2008). Composition of Hawaiian green turtle foraging aggregations: mtDNA evidence for a distinct regional population. Endanger. Species Res. 5, 37–44. doi: 10.3354/esr00101
Dutton, P. H., Bowen, B. W., Owens, D. W., Barragan, A., and Davis, S. K. (1999). Global phylogeography of the leatherback turtle (Dermochelys coriacea). J. Zool. 248, 397–409. doi: 10.1111/j.1469-7998.1999.tb01038.x
Dutton, P. H., Davis, S. K., Guerra, T., and Owens, D. W. (1996). Molecular phylogeny for marine turtles based on sequences of the ND4-Leucine tRNA and control regions of mitochondrial DNA. Mol. Phylogenet. Evol. 5, 511–521. doi: 10.1006/mpev.1996.0046
Dutton, P. H., Hitipeuw, C., Zein, M., Benson, S. R., and Al-Ghais, S. M. (2007). Status and genetic structure of nesting populations of leatherback turtles (Dermochelys coriacea) in the western Pacific. Chelonian Conserv. Biol. 6, 47. doi: 10.2744/1071-8443(2007)6[47:SAGSON]2.0.CO;2
Dutton, P. H., Jensen, M. P., Frey, A., LaCasella, E. L., Balazs, G. H., Zárate, P., et al. (2014a). Population structure and phylogeography reveal pathways of colonization by a migratory marine reptile (Chelonia mydas) in the central and eastern Pacific. Ecol. Evol. 4, 4317–4331. doi: 10.1002/ece3.1269
Dutton, P. H., Jensen, M. P., Frutchey, K., Frey, A., LaCasella, E. L., Balazs, G. H., et al. (2014b). Genetic stock structure of green turtle (Chelonia mydas) nesting populations across the Pacific islands. Pacific Sci. 68, 231–243. doi: 10.2984/68.4.1
Dutton, P. H., Roden, S. E., Stewart, K. R., LaCasella, E. L., Tiwari, M., Formia, A., et al. (2013). Population stock structure of leatherback turtles (Dermochelys coriacea) in the Atlantic revealed using mtDNA and microsatellite markers. Conserv. Genet. 14, 625–636. doi: 10.1007/s10592-013-0456-0
Encalada, S. E., Lahanas, P. N., Bjorndal, K. A., Bolten, A. B., Miyamoto, M. M., and Bowen, B. W. (1996). Phylogeography and population structure of the Atlantic and Mediterranean green turtle Chelonia mydas: a mitochondrial DNA control region sequence assessment. Mol. Ecol. 5, 473–483. doi: 10.1111/j.1365-294X.1996.tb00340.x
Epstein, B., Jones, M., Hamede, R., Hendricks, S., McCallum, H., Murchison, E. P., et al. (2016). Rapid evolutionary response to a transmissible cancer in Tasmanian devils. Nat. Commun. 7:12684. doi: 10.1038/ncomms12684
FitzSimmons, N. N. (1998). Single paternity of clutches and sperm storage in the promiscous green turtle (Chelonia mydas). Mol. Ecol. 7, 575–584. doi: 10.1046/j.1365-294x.1998.00355.x
FitzSimmons, N. N., Moritz, C., Limpus, C. J., Pope, L., and Prince, R. I. T. (1997). Geographic structure of the mitochondrial and nuclear gene polymorphisms in Australian green turtle populations and male-biased gene flow. Genetics 147, 1843–1854.
Formia, A., Godley, B. J., Dontaine, J.-F., and Bruford, M. W. (2006). Mitochondrial DNA diversity and phylogeography of endangered green turtle (Chelonia mydas) populations in Africa. Conserv. Genet. 7, 353–369. doi: 10.1007/s10592-005-9047-z
Frey, A., Dutton, P. H., Shaver, D., Walker, J., and Rubio, C. (2014). Kemp's ridley Lepidochelys kempii nesting abundance in Texas, USA: a novel approach using genetics to improve population census. Endanger. Species Res. 23, 63–71. doi: 10.3354/esr00565
Gaos, A. R., Lewison, R. L., Liles, M. J., Gadea, V., Altamirano, E., Henríquez, A. V., et al. (2016). Hawksbill turtle terra incognita: conservation genetics of eastern Pacific rookeries. Ecol. Evol. 6, 1251–1264. doi: 10.1002/ece3.1897
Gomez-Picos, P., Sifuentes-Romero, I., Merchant-Larios, H., Hernandez-Cornejo, R., Diaz-Hernandez, V., and Garcia-Gasca, A. (2014). Expression of aromatase in the embryonic brain of the olive ridley sea turtle (Lepidochelys olivacea), and the effect of bisphenol-A in sexually differentiated embryos. Int. J. Dev. Biol. 58, 733–741. doi: 10.1387/ijdb.140192ag
Gonzalez-Garza, B. I., Stow, A., Sanchez-Teyer, L. F., and Zapata-Perez, O. (2015). Genetic variation, multiple paternity, and measures of reproductive success in the critically endangered hawksbill turtle (Eretmochelys imbricata). Ecol. Evol. 5, 5758–5769. doi: 10.1002/ece3.1844
Hahn, A. T., Jensen, M., Bowen, B., Abreu-Grobois, A., de Castilhos, J. C., de Thoisy, B., et al. (2012). “Preliminary results on global genetic structure and phylogeography of olive ridleys (Lepidochelys olivacea),” in Proceedings of the Thirty-First Annual Symposium on Sea Turtle Biology and Conservation, eds T. T. Jones and B. P. Wallace (Silver Spring, MD; NOAA Technical Memorandum NMFS-SEFSC-631), 207.
Hamabata, T., Kamezaki, N., and Hikida, T. (2013). Genetic structure of green turtle (Chelonia mydas) peripheral populations nesting in the northwestern Pacific rookeries: evidence for northern refugia and postglacial colonization. Mar. Biol. 161, 495–507. doi: 10.1007/s00227-013-2352-z
Hamann, M., Godfrey, M. H., Seminoff, J. A., Arthur, K. E., Barata, P. C. R., Bjorndal, K. A., et al. (2010). Global research priorities for sea turtles: informing management and conservation in the 21st century. Endanger. Species Res. 11, 245–269. doi: 10.3354/esr00279
Hancock-Hanser, B. L., Frey, A., Leslie, M. S., Dutton, P. H., Archer, F. I., and Morin, P. A. (2013). Targeted multiplex next-generation sequencing: advances in techniques of mitochondrial and nuclear DNA sequencing for population genomics. Mol. Ecol. Resour. 13, 254–268. doi: 10.1111/1755-0998.12059
Hays, G. C., Christensen, A., Fossette, S., Schofield, G., Talbot, J., and Mariani, P. (2014a). Route optimisation and solving Zermelo's navigation problem during long distance migration in cross flows. Ecol. Lett. 17, 137–145. doi: 10.1111/ele.12219
Hays, G. C., Fossette, S., Katselidis, K. A., Schofield, G., and Gravenor, M. B. (2010). Breeding periodicity for male sea turtles, operational sex ratios, and implications in the face of climate change. Conserv. Biol. 24, 1636–1643. doi: 10.1111/j.1523-1739.2010.01531.x
Hays, G. C., Mazaris, A. D., and Schofield, G. (2014b). Different male vs. female breeding periodicity helps mitigate offspring sex ratio skews in sea turtles. Front. Mar. Sci. 1:43. doi: 10.3389/fmars.2014.00043
Heber, S., and Briskie, J. V. (2010). Population bottlenecks and increased hatching failure in endangered birds. Conserv. Biol. 24, 1674–1678. doi: 10.1111/j.1523-1739.2010.01553.x
Hoban, S., Kelley, J. L., Lotterhos, K. E., Antolin, M. F., Bradburd, G., Lowry, D. B., et al. (2016). Finding the genomic basis of local adaptation: pitfalls, practical solutions, and future directions. Am. Nat. 188, 379–397. doi: 10.1086/688018
Hurtado, L. A., De La Rosa-Reyna, X., Mateos, M., Shaver, D. J., Metz, R., Thiltges, J., et al. (2016). Thousands of SNPs in the critically endangered Kemp's Ridley sea turtle (Lepidochelys kempii) revealed by ddRAD-seq: opportunities for previously elusive conservation genetics research. Gulf Mex. Sci. 33, 214–218.
Jensen, M. P., Abreu-Grobois, F. A., Frydenberg, J., and Loeschcke, V. (2006). Microsatellites provide insight into contrasting mating patterns in arribada vs. non-arribada olive ridley sea turtle rookeries. Mol. Ecol. 15, 2567–2575. doi: 10.1111/j.1365-294X.2006.02951.x
Jensen, M. P., Bell, I. P., Limpus, C. J., Hamann, M., Ambar, S., Whap, T., et al. (2016a). Spatial and temporal genetic variation among size classes of green turtles (Chelonia mydas) provides information on oceanic dispersal and population dynamics. Mar. Ecol. Prog. Ser. 543, 241–256. doi: 10.3354/meps11521
Jensen, M. P., FitzSimmons, N. N., Dutton, P. H., and Michael, P. (2013a). “Molecular genetics of sea turtles,” in The Biology of Sea Turtles, Vol. 3, eds J. Wyneken, K. J. Lohmann, and J. A. Musick (Boca Raton, FL: CRC Press), 135–154.
Jensen, M. P., Limpus, C. J., Whiting, S. D., Guinea, M., Prince, R. I. T., Dethmers, K. E. M., et al. (2013b). Defining olive ridley turtle Lepidochelys olivacea management units in Australia and assessing the potential impact of mortality in ghost nets. Endanger. Species Res. 21, 241–253. doi: 10.3354/esr00521
Jensen, M. P., Pilcher, N. J., and FitzSimmons, N. N. (2016b). Genetic markers provide insight on origins of immature green turtles (Chelonia mydas) with biased sex ratios at two foraging grounds in Sabah, Malaysia. Endanger. Species Res. 31, 191–201. doi: 10.3354/esr00763
Jones, M. E., Paetkau, D., Geffen, E. L. I., and Moritz, C. (2004). Genetic diversity and population structure of Tasmanian devils, the largest marsupial carnivore. Mol. Ecol. 13, 2197–2209. doi: 10.1111/j.1365-294X.2004.02239.x
Joseph, J., and Nishizawa, H. (2016). Genetic structure and diversity of green turtles (Chelonia mydas) from two rookeries in the South China Sea. JSSM. 1, 41–47.
Joseph, J., Kuen, C. Y., Palaniappan, P. M., and Chark, L. H. (2014). Genetic investigation of green turtles (Chelonia mydas) harvested from a foraging ground at Mantanani, Sabah, Malysia. Herpetol. Conserv. Biol. 9, 516–523.
Kalinowski, S. T., Manlove, K. R., and Taper, M. L. (2007). ONCOR: a Computer Program for Genetic Stock Identification. Bozeman, MT: Montana State University. Available online at http://www.montana.edu/kalinowski/Software/ONCOR.htm
Karl, S. A., Toonen, R. J., Grant, W. S., and Bowen, B. W. (2012). Common misconceptions in molecular ecology: echoes of the modern synthesis. Mol. Ecol. 21, 4171–4189. doi: 10.1111/j.1365-294X.2012.05576.x
Kelly, R. P., Port, J. A., Yamahara, K. M., and Crowder, L. B. (2014). Using environmental DNA to census marine fishes in a large mesocosm. PLoS ONE 9:e86175. doi: 10.1371/journal.pone.0086175
Keske, C. L., Bagley, D. A., Meylan, A. B., Mott, C. R., Bresette, M. J., Ehrhart, L. M., et al. (2016). Tag returns of adult green turtles from Florida's headstart program (1971–1988). Mar. Turt. Newsl. 149, 12–13.
Komoroske, L. M., Frey, A., Hancock-Hanser, B., Morin, P., Archer, F. I., Roden, S., et al. (2016). Targeted next generation sequencing approaches for genotyping marine turtles. The 36th International Sea Turtle Symposium. Lima.
Korte, A., and Farlow, A. (2013). The advantages and limitations of trait analysis with GWAS: a review. Plant Meth. 9:29. doi: 10.1186/1746-4811-9-29
LaCasella, E. L., Epperly, S. P., Jensen, M. P., Stokes, L., and Dutton, P. H. (2013). Genetic stock composition of loggerhead turtles Caretta caretta bycaught in the pelagic waters of the North Atlantic. Endanger. Species Res. 22, 73–84. doi: 10.3354/esr00535
LeRoux, R. A., Dutton, P. H., Abreu-Grobois, F. A., Lagueux, C. J., Campbell, C. L., Delcroix, E., et al. (2012). Re-examination of population structure and phylogeography of hawksbill turtles in the Wider Caribbean using longer mtDNA sequences. J. Hered. 103, 806–820. doi: 10.1093/jhered/ess055
López-Castro, M. C., and Rocha-Olivares, A. (2005). The panmixia paradigm of eastern Pacific olive ridley turtles revised: consequences for their conservation and evolutionary biology. Mol. Ecol. 14, 3325–3334. doi: 10.1111/j.1365-294X.2005.02652.x
Luke, K. E., Horrocks, J. A., LeRoux, R. A., and Dutton, P. H. (2004). Origins of green turtle (Chelonia mydas) feeding aggregations around Barbados, West Indies. Mar. Biol. 144, 799–805. doi: 10.1007/s00227-003-1241-2
Manel, S., and Holderegger, R. (2013). Ten years of landscape genetics. Trends Ecol. Evol. 28, 614–621. doi: 10.1016/j.tree.2013.05.012
Manel, S., Gaggiotti, O. E., and Waples, R. S. (2005). Assignment methods: matching biological questions with appropriate techniques. Trends Ecol. Evol. 20, 136–142. doi: 10.1016/j.tree.2004.12.004
Matsuzawa, Y., Kamezaki, N., Ishihara, T., Omuta, K., Takeshita, H., Goto, K., et al. (2016). Fine scale genetic population structure of loggerhead turtles in the Northwest Pacific. Endanger. Species Res. 30, 83–93. doi: 10.3354/esr00724
Mazaris, A. D., Vokou, D., Almpanidou, V., Türkozan, O., and Sgardelis, S. P. (2015). Low conservatism of the climatic niche of sea turtles and implications for predicting future distributions. Ecosphere 6, 169. doi: 10.1890/ES15-00053.1
McClenachan, L. E., Jackson, J. B., and Newman, M. J. H. (2006). Conservation implications of historic sea turtle nesting beach loss. Front. Ecol. Environ. 4, 290–296. doi: 10.1890/1540-9295(2006)4[290:CIOHST]2.0.CO;2
Meylan, A. B., Bowen, B. W., and Avise, J. C. (1990). A genetic test of the natal homing versus social facilitation models for green turtle migration. Science 248, 724–727. doi: 10.1126/science.2333522
Miller, K. M., Li, S., Kaukinen, K. H., Ginther, N., Hammill, E., Curtis, J. M. R., et al. (2011). Genomic signatures predict migration and spawning failure in wild canadian salmon. Science 331, 214–217. doi: 10.1126/science.1196901
Monzón-Argüello, C., Lopez-Jurado, L. F., Rico, C., Marco, A., Lopez, P., Hays, G., et al. (2010). Evidence from genetic and Lagrangian drifter data for transatlantic transport of small juvenile green turtles. J. Biogeogr. 37, 1752–1766. doi: 10.1111/j.1365-2699.2010.02326.x
Morey, J. S., Neely, M. G., Lunardi, D., Anderson, P. E., Schwacke, L. H., Campbell, M., et al. (2016). RNA-Seq analysis of seasonal and individual variation in blood transcriptomes of healthy managed bottlenose dolphins. BMC Genomics 17:720. doi: 10.1186/s12864-016-3020-8
Morey, M., Fernández-Marmiesse, A., Castiñeiras, D., Fraga, J. M., Couce, M. L., and Cocho, J. A. (2013). A glimpse into past, present, and future DNA sequencing. Mol. Genet. Metab. 110, 3–24. doi: 10.1016/j.ymgme.2013.04.024
Moritz, C. (1994). Defining “evolutionarily significant units” for conservation. Trends Ecol. Evol. 9, 373–375. doi: 10.1016/0169-5347(94)90057-4
Mortimer, J. A., and Donnelly, M. (IUCN SSC Marine Turtle Specialist Group). (2008). Eretmochelys imbricata, Hawksbill Turtle. The IUCN Red List of Threatened Species 2008: e.T8005A12881238.
Naro-Maciel, E., Gaughran, S. J., Putman, N. F., Amato, G., Arengo, F., Dutton, P. H., et al. (2014b). Predicting connectivity of green turtles at Palmyra Atoll, central Pacific: a focus on mtDNA and dispersal modelling. J. R. Soc. Interface 11:20130888. doi: 10.1098/rsif.2013.0888
Naro-Maciel, E., Hart, K. M., Cruciata, R., and Putman, N. F. (2017). DNA and dispersal models highlight constrained connectivity in a migratory marine megavertebrate. Ecography. 40, 586–597. doi: 10.1111/ecog.02056
Naro-Maciel, E., Le, M., FitzSimmons, N. N., and Amato, G. (2008). Evolutionary relationships of marine turtles: a molecular phylogeny based on nuclear and mitochondrial genes. Mol. Phylogenet. Evol. 49, 659–662. doi: 10.1016/j.ympev.2008.08.004
Naro-Maciel, E., Reid, B. N., Alter, S. E., Amato, G., Bjorndal, K. A., Bolten, A. B., et al. (2014a). From refugia to rookeries: phylogeography of Atlantic green turtles. J. Exp. Mar. Bio. Ecol. 461, 306–316. doi: 10.1016/j.jembe.2014.08.020
Ng, C. K., Dutton, P. H., Chan, S. K., Cheung, K., Qiu, J., and Sun, Y. (2014). Characterization and Conservation Concerns of Green Turtles (Chelonia mydas) Nesting in Hong Kong, China. Pacific Sci. 68, 231–243. doi: 10.2984/68.2.5
Nishizawa, H., Abe, O., Okuyama, J., Kobayashi, M., and Arai, N. (2011). Population genetic structure and implications for natal philopatry of nesting green turtles Chelonia mydas in the Yaeyama Islands, Japan. Endanger. Species Res. 14, 141–148. doi: 10.3354/esr00355
Nishizawa, H., Naito, Y., Suganuma, H., Abe, O., Okuyama, J., Hirate, K., et al. (2013). Composition of green turtle feeding aggregations along the Japanese archipelago: implications for changes in composition with current flow. Mar. Biol. 160, 2671. doi: 10.1007/s00227-013-2261-1
NRC (National Research Council) (2010). Assessment of Sea-Turtle Status and Trends: Integrating Demography and Abundance. Washington, DC: National Academies Press.
Paradis, E., Gosselin, T., Grünwald, N. J., Jombart, T., Manel, S., and Lapp, H. (2016). Towards an integrated ecosystem of R packages for the analysis of population genetic data. Mol. Ecol. Resour. 33, 1–4. doi: 10.1111/1755-0998.12636
Pella, J., and Masuda, M. (2001). Bayesian methods for analysis of stock mixtures from genetic characters. Fish. Bull. 99, 151–167. doi: 10.1111/1755-0998.12636
Phillips, K. P., Jorgensen, T. H., Jolliffe, K. G., Jolliffe, S.-M., Henwood, J., and Richardson, D. S. (2013). Reconstructing paternal genotypes to infer patterns of sperm storage and sexual selection in the hawksbill turtle. Mol. Ecol. 22, 2301–2312. doi: 10.1111/mec.12235
Phillips, K. P., Mortimer, J. A., Jolliffe, K. G., Joregensen, T. H., and Richardson, D. S. (2014). Molecular techniques reveal cryptic life history and demographic processes of a critically endangered marine turtle. J. Exp. Mar. Bio. Ecol. 455, 29–37. doi: 10.1016/j.jembe.2014.02.012
Pike, D. A. (2013). Climate influences the global distribution of sea turtle nesting. Global Ecol. Biogeogr. 22, 555–566. doi: 10.1111/geb.12025
Pittard, S. D. (2010). Genetic Population Structure of the Flatback Turtle (Natator Depressus): A Nuclear and Mitochondrial DNA Analysis. Thesis, University of Canberra ACT 2601.
Pritchard, P. C. H. (1997). “Evolution, Phylogeny, and current status,” in The Biology of Sea Turtles, eds J. A. Musick and P. L. Lutz. (Boca Raton, FL: CRC Press), 1–28.
Putman, N. F., and He, R. (2013). Tracking the long-distance dispersal of marine organisms : sensitivity to ocean model resolution. J. R. Soc. Interface 10:20120979. doi: 10.1098/rsif.2012.0979
Putman, N. F., and Naro-Maciel, E. (2013). Finding the ‘lost years’ in green turtles : insights from ocean circulation models and genetic analysis. Proc. R. Soc. B Biol. Sci. 280:20131468. doi: 10.1098/rspb.2013.1468
Read, T. C., Fitzsimmons, N. N., Wantiez, L., Jensen, M. P., Keller, F., Chateau, O., et al. (2015). Mixed stock analysis of a resident green turtle, Chelonia mydas, population in New Caledonia links rookeries in the South Pacific. Wildl. Res. 42, 488–499. doi: 10.1071/WR15064
Rees, A., Alfaro-Shigueto, J., Barata, P., Bjorndal, K., Bolten, A., Bourjea, J., et al. (2016). Are we working towards global research priorities for management and conservation of sea turtles? Endanger. Species Res. 31, 337–382. doi: 10.3354/esr00801
Reis, E. C., Soares, L. S., Lobo-Hajdu, G., and Lôbo-Hajdu, G. (2009). Evidence of olive ridley mitochondrial genome introgression into loggerhead turtle rookeries of Sergipe, Brazil. Conserv. Genet. 11, 1587–1591. doi: 10.1007/s10592-009-9973-2
Reis, E. C., Soares, L. S., Vargas, S. M., Santos, F. R., Young, R. J., Bjorndal, K. A., et al. (2010). Genetic composition, population structure and phylogeography of the loggerhead sea turtle: colonization hypothesis for the Brazilian rookeries. Conserv. Genet. 11, 1467–1477. doi: 10.1007/s10592-009-9975-0
Reuter, J. A., Spacek, D. V., and Snyder, M. P. (2015). High-throughput sequencing technologies. Mol. Cell 58, 586–597. doi: 10.1016/j.molcel.2015.05.004
Roberts, M. A., Schwartz, T. S., and Karl, S. A. (2004). Global population genetic structure and male-mediated gene flow in the green sea turtle (Chelonia mydas): analysis of microsatellite loci. Genetics 166:1857. doi: 10.1534/genetics.166.4.1857
Roden, S. E., and Dutton, P. H. (2011). Isolation and characterization of 14 polymorphic microsatellite loci in the leatherback turtle (Dermochelys coriacea) and cross-species amplification. Conserv. Genet. Resour. 3, 49–52. doi: 10.1007/s12686-010-9284-4
Roden, S. E., Dutton, P. H., and Morin, P. A. (2009). Characterization of single nucleotide polymorphism markers for the green sea turtle (Chelonia mydas). Mol. Ecol. Resour. 9, 1055–1060. doi: 10.1111/j.1755-0998.2009.02573.x
Roden, S. E., Morin, P. A., Frey, A., Balazs, G. H., Zárate, P., Cheng, I.-J., et al. (2013). Green turtle population structure in the Pacific: new insights from single nucleotide polymorphisms and microsatellites. Endanger. Species Res. 20, 227–234. doi: 10.3354/esr00500
Rodríguez-Zárate, C. J., Rocha-Olivares, A., and Beheregaray, L. B. (2013). Genetic signature of a recent metapopulation bottleneck in the olive ridley turtle (Lepidochelys olivacea) after intensive commercial exploitation in Mexico. Biol. Conserv. 168, 10–18. doi: 10.1016/j.biocon.2013.09.009
Ruiz-Urquiola, A., Riverón-Giró, F. B. F., Pérez-Bermúdez, E., Abreu-Grobois, F. A., González-Pumariega, M., James-Petric, B., et al. (2010). Population genetic structure of greater Caribbean green turtles (Chelonia mydas) based on mitochondrial DNA sequences, with an emphasis on rookeries from southwestern Cuba. Rev. Investig. Mar. 31, 33–52.
Sanger, F., Nicklen, S., and Coulson, A. R. (1977). DNA sequencing with chain-terminating inhibitors. Proc. Natl. Acad. Sci. U.S.A. 74, 5463–5467. doi: 10.1073/pnas.74.12.5463
Sari, F., Koseler, A., and Kaska, Y. (2017). First observation of multiple paternity in loggerhead sea turtles, Caretta caretta, nesting on Dalyan Beach, Turkey. J. Exp. Mar. Bio. Ecol. 488, 60–71. doi: 10.1016/j.jembe.2016.11.018
Selkoe, K. A., and Toonen, R. J. (2006). Microsatellites for ecologists: a practical guide to using and evaluating microsatellite markers. Ecol. Lett. 9, 615–629. doi: 10.1111/j.1461-0248.2006.00889.x
Selkoe, K. A., D'Aloia, C. C., Crandell, E. D., Iacchei, M., Liggins, L., Puritz, J. B., et al. (2016). A decade of seascape genetics: contributions to basic and applied marine connectivity. Endanger. Species Res. 554, 1–19. doi: 10.3354/meps11792
Seminoff, J. A., Allen, C. D., Balazs, G. H., Dutton, P. H., Eguchi, T., Haas, H., et al. (2015). Status Review of the Green Turtle (Chelonia mydas) under the U.S. Endangered Species Act. NOAA Technical Memorandum, NOAA-NMFS-SWFSC-539. Silver Spring, MD, 1–571.
Shafer, A. B. A., Wolf, J. B. W., Alves, P. C., Bergström, L., Bruford, M. W., Brännström, I., et al. (2015). Genomics and the challenging translation into conservation practice. Trends Ecol. Evol. 30, 78–87. doi: 10.1016/j.tree.2014.11.009
Shamblin, B. M., Bagley, D. A., Ehrhart, L. M., and Nairn, C. J. (2015b). Mitochondrial repeat haplotypes suggest origins for CM-A13. Mar. Turt. Newsl. 146, 11–13.
Shamblin, B. M., Bagley, D. A., Ehrhart, L. M., Desjardin, N. A., Martin, R. E., Hart, K. M., et al. (2015a). Genetic structure of Florida green turtle rookeries as indicated by mitochondrial DNA control region sequences. Conserv. Genet. 16, 673–685. doi: 10.1007/s10592-014-0692-y
Shamblin, B. M., Berry, B. E., Lennon, D. M., Bagley, D. A., Ehrhart, L. M., and Nairn, C. J. (2012c). Tetranucleotide microsatellite loci from the endangered green turtle (Chelonia mydas). Conserv. Genet. Resour. 6, 12–14. doi: 10.1007/s12686-012-9643-4
Shamblin, B. M., Bjorndal, K. A., Bolten, A. B., Hillis-Starr, Z. M., Lundgren, I., Naro-Maciel, E., et al. (2012a). Mitogenomic sequences better resolve stock structure of southern Greater Caribbean green turtle rookeries. Mol. Ecol. 21, 2330–2340. doi: 10.1111/j.1365-294X.2012.05530.x
Shamblin, B. M., Bolten, A. B., Abreu-Grobois, F. A., Bjorndal, K. A., Cardona, L., Carreras, C., et al. (2014). Geographic patterns of genetic variation in a broadly distributed marine vertebrate: new insights into loggerhead turtle stock structure from expanded mitochondrial DNA sequences. PLoS ONE 9:e85956. doi: 10.1371/journal.pone.0085956
Shamblin, B. M., Bolten, A. B., Bjorndal, K. A., Dutton, P. H., Nielsen, J. T., Abreu-Grobois, F. A., et al. (2012b). Expanded mitochondrial control region sequences increase resolution of stock structure among North Atlantic loggerhead turtle rookeries. Mar. Ecol. Prog. Ser. 469, 145–160. doi: 10.3354/meps09980
Shamblin, B. M., Dodd, M. G., Williams, K. L., Frick, M. G., Bell, R., and Nairn, C. J. (2011). Loggerhead turtle eggshells as a source of maternal nuclear genomic DNA for population genetic studies. Mol. Ecol. Resour. 11, 110–115. doi: 10.1111/j.1755-0998.2010.02910.x
Shamblin, B. M., Dutton, P. H., Bjorndal, K. A., Bolten, A. B., Naro-Maciel, E., Santos, A. J. B., et al. (2015c). Deeper mitochondrial sequencing reveals cryptic diversity and structure in Brazilian green turtle rookeries. Chelonian Conserv. Biol. 14, 167–172. doi: 10.2744/CCB-1152.1
Shamblin, B. M., Dutton, P. H., Shaver, D. J., Bagley, D. A., Putman, N. F., Mansfield, K. L., et al. (2017). Mexican origins for the Texas green turtle foraging aggregation: a cautionary tale of incomplete baselines and poor marker resolution. J. Exp. Mar. Bio. Ecol. 448, 111–120. doi: 10.1016/j.jembe.2016.11.009
Shamblin, B. M., Faircloth, B. C., Dodd, M. G., Bagley, D. A., Ehrhart, L. M., Dutton, P. H., et al. (2009). Tetranucleotide markers from the loggerhead sea turtle (Caretta caretta) and their cross-amplification in other marine turtle species. Conserv. Genet. 10, 577–580. doi: 10.1007/s10592-008-9573-6
Shamblin, B. M., Faircloth, B. C., Dodd, M. G., Wood-Jones, A., Castleberry, S. B., Carroll, J. P., et al. (2007). Tetranucleotide microsatellites from the loggerhead sea turtle (Caretta caretta). Mol. Ecol. Notes 7, 784–787. doi: 10.1111/j.1471-8286.2007.01701.x
Shanker, K., Ramadevi, J., Choudhury, B. C., Singh, L., and Aggarwal, R. K. (2004). Phylogeography of olive ridley turtles (Lepidochelys olivacea) on the east coast of India: implications for conservation theory. Mol. Ecol. 13, 1899–1909. doi: 10.1111/j.1365-294X.2004.02195.x
Shaver, D. J., and Caillouet, C. J. Jr. (1998). More Kemp's ridley turtles return to South Texas to nest. Mar. Turt. Newsl. 82, 1–5.
Siddle, H. V., Marzec, J., Cheng, Y., Jones, M., and Belov, K. (2010). MHC gene copy number variation in Tasmanian devils: implications for the spread of a contagious cancer. Proc. R. Soc. Lond. B Biol. Sci. 277, 2001–2006. doi: 10.1098/rspb.2009.2362
Sifuentes-Romero, I., Merchant-Larios, H., Milton, S. L., Moreno-Mendoza, N., Díaz-Hernández, V., and García-Gasca, A. (2013). RNAi-mediated gene silencing in a gonad organ culture to study sex determination mechanisms in sea turtle. Genes 4, 293–305. doi: 10.3390/genes4020293
Snover, M. L., Hohn, A. A., Crowder, L. B., and Heppell, S. S. (2007). “Age and growth in Kemp's ridley sea turtles: evidence from mark recapture and skeletochronology,” in Biology and Conservation of Ridley Turtles, ed P. Plotkin (Baltimore, MD: Johns Hopkins University Press), 89–105.
Stewart, K. R., and Dutton, P. H. (2011). Paternal genotype reconstruction reveals multiple paternity and sex ratios in a breeding population of leatherback turtles (Dermochelys coriacea). Conserv. Genet. 12, 1101–1113. doi: 10.1007/s10592-011-0212-2
Stewart, K. R., and Dutton, P. H. (2014). Breeding sex ratios in adult leatherback turtles (Dermochelys coriacea) may compensate for female-biased hatchling sex ratios. PLoS ONE 9:e88138. doi: 10.1371/journal.pone.0088138
Stewart, K. R., James, M. C., Roden, S. E., and Dutton, P. H. (2013). Assignment tests, telemetry and tag-recapture data converge to identify natal origins of leatherback turtles foraging in Atlantic Canadian waters. J. Anim. Ecol. 82, 791–803. doi: 10.1111/1365-2656.12056
Stewart, K. R., LaCasella, E. L., Roden, S. E., Jensen, M. P., Stokes, L. W., Epperly, S. P., et al. (2016). Nesting population origins of leatherback turtles caught as bycatch in the U.S. pelagic longline fishery. Ecosphere 7:e01272. doi: 10.1002/ecs2.1272
Stiebens, V. A., Merino, S. E., Roder, C., Chain, F. J. J., Lee, P. L. M., and Eizaguirre, C. (2013a). Living on the edge: how philopatry maintains adaptive potential. Proc. Biol. Sci. 280:20130305. doi: 10.1098/rspb.2013.0305
Stiebens, V., Merino, S. E., Chain, F. J. J., and Eizaguirre, C. (2013b). Evolution of MHC class I genes in the endangered loggerhead sea turtle (Caretta caretta) revealed by 454 amplicon sequencing. BMC Evol. Biol. 13:95. doi: 10.1186/1471-2148-13-95
Taylor, B. L., and Dizon, A. E. (1999). First policy then science: why a management unit based solely on genetic criteria cannot work. Mol. Ecol. 8, S11–S16. doi: 10.1046/j.1365-294x.1999.00797.x
Taylor, B. L., Martien, K., and Morin, P. A. (2010). “Identifying units to conserve using genetic data,” in Marine Mammal Ecology and Conservation—A Handbook of Techniques, eds I. L. Boyd, W. D. Bowen, and S. J. Iverson (Oxford: Oxford University Press), 306–344.
Tedeschi, J. N., Mitchell, N. J., Berry, O., Whiting, S., and Meekan, M. (2015). Reconstructed paternal genotypes reveal variable rates of multiple paternity at three rookeries of loggerhead sea turtles (Caretta caretta) in western Australia. Aust. J. Zool. 62, 454–462. doi: 10.1071/zo14076
Tedeschi, J. N., Kennington, W. J., Tomkins, J. L., Berry, O., Whiting, S. D., Meekan, M. G., et al. (2016). Heritable variation in heat shock gene expression: a potential mechanism for adaptation to thermal stress in embryos of sea turtles. Proc. R. Soc. B Biol. Sci. 283:20152320. doi: 10.1098/rspb.2015.2320
Tezak, B. M., Guthrie, K., and Wyneken, J. (2017). An immunohistochemical approach to identify the sex of young marine turtles. Anat. Rec. doi: 10.1002/ar.23589. [Epub ahead of print].
Tikochinski, Y., Bendelac, R., Barash, A., Daya, A., Levy, Y., and Friedmann, A. (2012). Mitochondrial DNA STR analysis as a tool for studying the green sea turtle (Chelonia mydas) populations: the Mediterranean Sea case study. Mar. Genomics 6, 17–24. doi: 10.1016/j.margen.2012.01.002
Todd, E. V., Black, M. A., and Gemmell, N. J. (2016). The power and promise of RNA-seq in ecology and evolution. Mol. Ecol. 25, 1224–1241. doi: 10.1111/mec.13526
Troëng, S., Harrison, E., Evans, D., de Haro, A., and Vargas, E. (2007). Leatherback turtle nesting trends and threats at Tortuguero, Costa Rica. Chelonian Conserv. Biol. 6, 117–122. doi: 10.2744/1071-8443(2007)6[117:LTNTAT]2.0.CO;2
Trujillo-Arias, N., Amorocho, D. F., López-Álvarez, D., and Mejía-Ladino, L. M. (2014). Relaciones filogeograficas de algunas colônias de alimentacion y anida- cion de la tortuga carey (Eretmochelys imbricata) en el Pacifico y Caribe Colombianos. Bol. Invest. Mar. Cost. 43, 159–182.
Tucek, J., Nel, R., Girondot, M., and Hughes, G. (2014). Age-size relationship at reproduction of South African female loggerhead turtles Caretta caretta. Endanger. Species Res. 23, 167–175. doi: 10.3354/esr00562
Turner Tomaszewicz, C. N., Seminoff, J. A., Avens, L. A., Goshe, L. R., Peckham, S. H., Rguez-Baron, J. M., et al. (2015). Age and residency duration of loggerhead turtles at a North Pacific bycatch hotspot using skeletochronology. Biol. Conserv. 186, 134–142. doi: 10.1016/j.biocon.2015.03.015
USFWS and NOAA (1996). Policy regarding the recognition of distinct vertebrate population segments under the endangered species act. Fed. Regist. 61, 4722–4725.
USFWS and NOAA (2011). Endangered and threatened species; determination of nine distinct population segments of loggerhead sea turtles as Endangered or Threatened. 76 Fed. Reg. 184, 58868–58952.
Vargas, S. M., Jensen, M. P., Ho, S. Y. W., Mobaraki, A., Broderick, D., Mortimer, J. A., et al. (2016). Phylogeography, genetic diversity, and management units of hawksbill turtles in the Indo-Pacific. J. Hered. 107, 199–213. doi: 10.1093/jhered/esv091
Venegas, D., Marmolejo-Valencia, A., Valdes-Quezada, C., Govenzensky, T., Recillas-Targa, F., and Merchant-Larios, H. (2016). Dimorphic DNA methylation during temperature-dependent sex determination in the sea turtle Lepidochelys olivacea. Gen. Comp. Endocrinol. 236, 35–41. doi: 10.1016/j.ygcen.2016.06.026
Vilaça, S. T., Vargas, S. M., Lara-Ruiz, P., Molfetti, É., Reis, E. C., Lôbo-Hajdu, G., et al. (2012). Nuclear markers reveal a complex introgression pattern among marine turtle species on the Brazilian coast. Mol. Ecol. 21, 4300–4312. doi: 10.1111/j.1365-294X.2012.05685.x
Wallace, B. P., DiMatteo, A. D., Bolten, A. B., Chaloupka, M. Y., Hutchinson, B. J., Abreu-Grobois, F. A., et al. (2011). Global conservation priorities for marine turtles. PLoS ONE 6:e24510. doi: 10.1371/journal.pone.0024510
Wallace, B. P., DiMatteo, A. D., Hurley, B. J., Finkbeiner, E. M., Bolten, A. B., Chaloupka, M. Y., et al. (2010b). Regional management units for marine turtles: a novel framework for prioritizing conservation and research across multiple scales. PLoS ONE 5:e15465. doi: 10.1371/journal.pone.0015465
Wallace, B. P., Lewison, R. L., McDonald, S. L., McDonald, R. K., Kot, C. Y., Kelez, S., et al. (2010a). Global patterns of marine turtle bycatch. Conserv. Lett. 3, 131–142. doi: 10.1111/j.1755-263X.2010.00105.x
Wallace, B. P., Tiwari, M., and Girondot, M. (2013). Dermochelys coriacea, Leatherback. The IUCN Red List of Threatened Species 2013:e.T6494A43526147.
Wang, Z., Pascual-Anaya, J., Zadissa, A., Li, W., Niimura, Y., Huang, Z., et al. (2013). The draft genomes of soft-shell turtle and green sea turtle yield insights into the development and evolution of the turtle-specific body plan. Nat. Genet. 45, 701–706. doi: 10.1038/ng.2615
Willi, Y., Van Buskirk, J., and Hoffmann, A. A. (2006). Limits to the adaptive potential of small populations. Annu. Rev. Ecol. Evol. Syst. 37, 433–458. doi: 10.1146/annurev.ecolsys.37.091305.110145
Wright, L. I., Fuller, W. J., Godley, B. J., McGowan, A., Tregenza, T., and Broderick, A. C. (2012a). Reconstruction of paternal genotypes over multiple breeding seasons reveals male green turtles do not breed annually. Mol. Ecol. 21, 3625–3635. doi: 10.1111/j.1365-294X.2012.05616.x
Wright, L. I., Stokes, K. L., Fuller, W. J., Godley, B. J., McGowan, A., Snape, R., et al. (2012b). Turtle mating patterns buffer against disruptive effects of climate change. Proc. Biol. Sci. 279, 2122–2127. doi: 10.1098/rspb.2011.2285
Wyneken, J., Lohmann, K., and Musick, J. A. (2013). The Biology of Sea Turtles, Vol. 3. Boca Raton, FL: CRC Press.
Glossary
Genetic bottleneck: A loss of genetic diversity due to a severe reduction of population size.
Microsatellite: Tandem repeats of short DNA sequences, usually in pairs, triplets, or quadruplets that are used as neutral markers for identifying individuals, inferring parentage, or assigning individuals to specific populations.
Nuclear vs. mitochondrial DNA: In the marine turtle context, nuclear DNA is inherited from both parents while mitochondrial DNA is transmitted from mother to offspring. The divergent modes of inheritance as well as rates and mechanisms of mutation make it important to consider which type of marker is appropriate for the question being addressed.
Orphan haplotype: A mitochondrial DNA variant described from a foraging area but with no known nesting population of origin.
Panmixia: Random mating within a breeding population; no genetic structure. In a marine turtle context, it can also mean sufficient female movement among rookeries such that the rookeries would behave as part of the same population.
Phylogeography: The study of the geographical distribution of genetic lineages, generally attempting to explain contemporary patterns through inferring historical processes.
Polymorphic: Variable, often used in the context of nuclear markers where informative allelic variation is present.
Rookery: Marine turtle nesting beach colony. Definition and usage in the literature varies and can create confusion; can refer to one isolated nesting beach or several adjacent nesting beaches. These are often delimited a priori based on physical proximity, not based on data quantifying demographic or population connectivity. One or more rookeries typically make up a genetic stock or management unit (MU), based on genetic and complementary data, and several stocks/MUs make up larger units like DPS or RMU. (see further discussion of conservation units in Box 2).
SNP: Single Nucleotide Polymorphism (pronounced “snip”), sequence variation at a specific position in a DNA sequence.
Stock: Demographically independent nesting populations (DIPs), defined by genetic and complementary data. While this term can be used differently in the literature among taxa and disciplines (e.g., fisheries science), in the context of marine turtles it is considered synonymous with management unit (MU). To avoid confusion, in this review we primarily refer to “MUs,” but use “stock” where necessary (e.g., in discussions of marine turtle applications of Mixed Stock Analysis (MSA), which was originally developed for fisheries applications).
Keywords: sea turtle, population genetics, wildlife genomics, management units, conservation management
Citation: Komoroske LM, Jensen MP, Stewart KR, Shamblin BM and Dutton PH (2017) Advances in the Application of Genetics in Marine Turtle Biology and Conservation. Front. Mar. Sci. 4:156. doi: 10.3389/fmars.2017.00156
Received: 01 March 2017; Accepted: 08 May 2017;
Published: 07 June 2017.
Edited by:
E. Christien Michael Parsons, George Mason University, United StatesReviewed by:
Gail Schofield, Deakin University, AustraliaAntonios D. Mazaris, Aristotle University of Thessaloniki, Greece
Copyright © 2017 Komoroske, Jensen, Stewart, Shamblin and Dutton. This is an open-access article distributed under the terms of the Creative Commons Attribution License (CC BY). The use, distribution or reproduction in other forums is permitted, provided the original author(s) or licensor are credited and that the original publication in this journal is cited, in accordance with accepted academic practice. No use, distribution or reproduction is permitted which does not comply with these terms.
*Correspondence: Lisa M. Komoroske, lisa.komoroske@noaa.gov