Net Community Metabolism and Seawater Carbonate Chemistry Scale Non-intuitively with Coral Cover
 Heather N. Page
 Travis A. Courtney
 Andrew Collins2
  Eric H. De Carlo
 Andreas J. Andersson
- 1Scripps Institution of Oceanography, University of California, San Diego, San Diego, CA, United States
- 2Pacific Marine Environmental Laboratory, National Oceanic and Atmospheric Administration, Seattle, WA, United States
- 3Department of Oceanography, University of Hawaii at Manoa, Honolulu, HI, United States
Coral cover and reef health have been declining globally as reefs face local and global stressors including higher temperature and ocean acidification (OA). Ocean warming and acidification will alter rates of benthic reef metabolism (i.e., primary production, respiration, calcification, and CaCO3 dissolution), but our understanding of community and ecosystem level responses is limited in terms of functional, spatial, and temporal scales. Furthermore, dramatic changes in coral cover and benthic metabolism could alter seawater carbonate chemistry on coral reefs, locally alleviating or exacerbating OA. This study examines how benthic metabolic rates scale with changing coral cover (0–100%), and the subsequent influence of these coral communities on seawater carbonate chemistry based on mesocosm experiments in Bermuda and Hawaii. In Bermuda, no significant differences in benthic metabolism or seawater carbonate chemistry were observed for low (40%) and high (80%) coral cover due to large variability within treatments. In contrast, significant differences were detected between treatments in Hawaii with benthic metabolic rates increasing with increasing coral cover. Observed increases in daily net community calcification and nighttime net respiration scaled proportionally with coral cover. This was not true for daytime net community organic carbon production rates, which increased the most between 0 and 20% coral cover and then less so between 20 and 100%. Consequently, diel variability in seawater carbonate chemistry increased with increasing coral cover, but absolute values of pH, Ωa, and pCO2 were not significantly different during daytime. To place the results of the mesocosm experiments into a broader context, in situ seawater carbon dioxide (CO2) at three reef sites in Bermuda and Hawaii were also evaluated; reefs with higher coral cover experienced a greater range of diel CO2 levels, complementing the mesocosm results. The results from this study highlight the need to consider the natural complexity of reefs and additional biological and physical factors that influence seawater carbonate chemistry on larger spatial and longer temporal scales. Coordinated efforts combining various research approaches (e.g., experiments, field studies, and models) will be required to better understand how benthic metabolism integrates across functional, spatial, and temporal scales, and for making predictions on how coral reefs will respond to climate change.
Introduction
Coral reefs are one of the most diverse ecosystems in the world and provide numerous ecosystem goods and services including habitat provision, shoreline protection, nutrition, medicinal compounds, and monetary revenue from fisheries and tourism (Moberg and Folke, 1999; Costanza et al., 2014). The total economic valuation of the services provided by coral reefs has been estimated at several billions of U.S. dollars per year (de Groot et al., 2012; Costanza et al., 2014). In recent decades, the function of worldwide coral reefs has changed drastically owing to shifts in community structure with declines in coral cover and increases in turf and fleshy macroalgae (Wilkinson, 2008; Costanza et al., 2014; Chen et al., 2015; Bruno and Valdivia, 2016). In the Indo-Pacific region during 1980-1983, the majority of surveyed coral reefs had 20–50% coral cover with some reefs having up to 100% coral cover. In contrast, in 2003, the highest coral cover reported for this region was 70% with most reefs having less than 30% coral cover (Bruno and Selig, 2007). Similarly, reefs in the Caribbean have experienced massive declines in coral cover from an average of 50% in the mid-1970s to 10% now (Gardner et al., 2003).
The global trend of decreasing coral cover has been attributed to both local and global factors including disease outbreaks (Harvell et al., 1999), overfishing (Hughes et al., 2007), nutrient and sediment pollution (Koop et al., 2001; Szmant, 2002), storm damage, and climate change (Hoegh-Guldberg et al., 2007; Buddemeier et al., 2008; De'ath et al., 2012; Bruno and Valdivia, 2016). The major climate change concerns are prolonged periods of elevated seawater temperature, which can lead to mass coral bleaching events (Glynn, 1993; Brown, 1997; Hoegh-Guldberg, 1999; Baker et al., 2008; Rodgers et al., 2015), and ocean acidification (OA), i.e., a reduction in seawater pH and saturation state with respect to the calcium carbonate mineral aragonite (Ωa) resulting from oceanic uptake of anthropogenic CO2. It has been hypothesized that OA could cause reefs to shift from states of net accretion to states of net calcium carbonate (CaCO3) dissolution and erosion (Kleypas and Yates, 2009; Silverman et al., 2009; Eyre et al., 2014; Enochs et al., 2016).
The potential response of corals and coral reef community metabolism (i.e., primary production, respiration, calcification, and CaCO3 dissolution) to ocean warming and acidification has been studied extensively in laboratory and mesocosm experiments. Coral calcification rates are typically reduced when exposed to low seawater pH and Ωa (Marubini et al., 2003; Ohde and Hossain, 2004; Anthony et al., 2008; Holcomb et al., 2010; Comeau et al., 2013; Horvath et al., 2016), which also has been observed for coral communities and rates of net community calcification (NCC = gross calcification – gross CaCO3 dissolution) (e.g., Langdon et al., 2000; Leclerq et al., 2000; Andersson et al., 2009; Anthony et al., 2013). Similarly, relatively modest warming above summer maximum temperatures has been shown to affect coral skeletal growth and calcification negatively, although small increases in seawater temperature have been observed to increase coral calcification rates (Jokiel and Coles, 1990; Marshall and Clode, 2004; Bahr et al., 2016). In general, coral primary production and net community organic carbon production (NCP = primary production – autotrophic and heterotrophic respiration) decrease under elevated seawater temperatures (Coles and Jokiel, 1977; Brown, 1997) due to increasing rates of respiration, but the response of these processes to OA is less clear (Andersson et al., 2011). Langdon and Atkinson (2005) observed increased NCP for coral communities exposed to high pCO2 and low pH seawater in flume experiments, but other experiments have reported a decrease or no effect on NCP under similar conditions (e.g., Anthony et al., 2013; Page et al., 2016). However, temperature and/or OA induced coral bleaching generally results in a reduction in NCP owing to decreased photosynthesis and increased respiration (Anthony et al., 2008; Crawley et al., 2010). Concurrent with the effects of warming and OA on coral reef metabolic processes, decreasing coral cover will also affect these processes. To date, this has received relatively little attention. As a result of decreasing coral cover, metabolic rates could change in non-intuitive ways because of changing resource availability, flow regime, boundary layer thickness, and intra- and inter specific competition (Lesser et al., 1994; Tanner, 1995; Ferrier-Pagès et al., 2003; Evensen and Edmunds, 2016).
Understanding how coral reef metabolism will change in response to decreasing coral cover and ocean warming and acidification is critical because it relates to a reef's ability to accrete CaCO3 and its ability to locally alleviate or exacerbate OA (Anthony et al., 2011; Kleypas et al., 2011; Jury et al., 2013; Andersson et al., 2014; Page et al., 2016). Coral reef metabolism can have a significant influence on the local seawater carbonate chemistry (Bates, 2002; Bates et al., 2010; Hofmann et al., 2011; Andersson and Mackenzie, 2012; Shaw et al., 2012; Drupp et al., 2013), and diel and seasonal variations in coral reef CO2 parameters (e.g., pCO2, pH, and Ωa) are much greater than in the open ocean. Many reefs may periodically already experience seawater pCO2, pH, and Ωa levels predicted to occur in the open ocean by the end of the century (Andersson and Mackenzie, 2012; Shaw et al., 2012; Drupp et al., 2013; Manzello et al., 2014; Albright et al., 2015) owing to strongly positive NCC, close to balanced trophic status, and negative NCP occurring at night. Positive NCC decreases dissolved inorganic carbon (DIC) and total alkalinity (TA) in a ratio of 1:2 resulting in a reduction of pH and Ωa while negative NCP decrease pH and Ωa owing to increased DIC. Furthermore, variations in metabolic rates and ratios of NCC to NCP between benthic functional groups (e.g., coral, turf and fleshy algae, coralline algae, sand, etc.) lead to different influences on seawater carbonate chemistry depending on community composition and structure (Anthony et al., 2013; Jokiel et al., 2014; Page et al., 2016), and these effects could either alleviate or enhance local seawater acidification or alkalinization. Based on mainly mesocosm and modeling experiments, changing community composition in favor of increasing coral cover has resulted in higher rates of NCC relative to NCP, causing a decrease in average seawater pH and Ωa, while the opposite has been true for a decrease in coral cover in favor of macroalgae (Kleypas et al., 2011; Page et al., 2016).
The current understanding of the potential impacts of environmental perturbations to coral community metabolism and the effect of changing community structure on seawater carbonate chemistry is limited with respect to the functional, spatial, and temporal scales of these impacts. To date, researchers have been constrained to extrapolating short term individual or community level responses observed in aquaria or mesocosm experiments to larger functional (e.g., ecosystems), spatial (e.g., regions or world), and/or temporal (e.g., years) scales. This approach often assumes that the whole response of coral reefs is equal to the sum of their individual components and frequently lacks consideration for the natural complexity of coral reefs, where organisms do not exist in isolation, but rather interact with other organisms and their physical environment (Mumby and van Woesik, 2014; Andersson et al., 2015; Edmunds et al., 2016). Being able to integrate effects of environmental perturbations on metabolic rates across functional scales, from organisms to reefs, however, is critical to better understand the fate of coral reefs in a future warmer and less alkaline ocean. Edmunds et al. (2016) proposed that existing ecological theories, namely metabolic theory of ecology (MTE; Brown et al., 2004), could provide the framework for this integration of metabolic rates. MTE states that allometric scaling between body size and metabolic rates governs ecological principles at higher functional scales (Brown et al., 2004). For example, net coral community calcification can be estimated as long as one knows (1) the functional relationship between coral colony size and calcification rate and (2) the abundance of different colony sizes within a reef (Edmunds et al., 2016). One of the first steps to develop a MTE for coral reefs is to better understand how colony sizes and coral densities relate to physiological rates in controlled, experimental settings, and then gradually evaluate these relationships for increasingly complex natural settings.
In this study, the main objectives were to examine the influence of different coral densities on rates of NCC and NCP (here referred to as “benthic metabolism”) as well as their influence on the overlying seawater carbonate chemistry in two different locations, Bermuda and Hawaii. Through two sets of mesocosm experiments, we tested two hypotheses: (1) High coral cover has higher NCC and NCP rates compared to low coral cover, and rates scale proportionally to the percent coral cover, and (2) As a consequence of higher NCC and NCP rates, high coral cover results in greater diel variability of seawater pH, pCO2, and Ωa compared to low coral cover. As a complement to the mesocosm experiments, we also evaluated in situ seawater CO2 measurements from three contrasting reef locations with different coral cover in Bermuda and Hawaii. It is not our intention to quantitatively link and connect the mesocosm results with these field observations, as this would require a range of additional data, but simply to provide a broader context in which to place the results of the mesocosm experiments. We also hope that these data will stimulate additional research aimed at quantitatively connecting experimental and field results which, combined, will strengthen our understanding of the links between coral communities, benthic metabolism, and seawater carbonate chemistry.
Materials and Methods
Two mesocosm experiments were conducted to examine the relationships between coral cover, benthic metabolism, and diel seawater carbonate chemistry. An initial experiment was conducted at the Bermuda Institute of Ocean Sciences (BIOS) in 2012 to examine the effects of two treatments (40 and 80% coral cover) on daytime (06:00–00:00) seawater carbonate chemistry. This initial study was followed up by an experiment at the Hawaii Institute of Marine Biology (HIMB) in 2016 to include more coral cover treatments (20–100% coral cover) as well as a complete diel cycle (Table 1). These two sites (BIOS and HIMB) were primarily chosen because they contain outdoor, flow-through mesocosm facilities that experience natural fluctuations in environmental conditions representative of conditions experienced on a coral reef and allow control of flow rates. They also represent contrasting coral reef characteristics (e.g., different latitudes, high terrestrial vs. low terrestrial material inputs, and Atlantic vs. Pacific Oceans) and different dominant coral species.

Table 1. Experimental design for mesocosm experiments in Bermuda and Hawaii.
Experiment 1: Bermuda 2012
Experimental Design
The experimental system at BIOS pumped filtered seawater from Ferry Reach, Bermuda into carboys which had gravity-fed flow into nine flow-through mesocosms with the dimensions 53 × 39 × 30.5 cm and flow rates (±1 std) averaging 1.67 ± 0.12 L min−1 (residence time, τ = 0.64 ± 0.28 h). Additionally, two fountain pumps circulated water within each mesocosm, ensuring that the seawater was well-mixed and corals were provided with extensive water flow. To prevent extreme temperature and light stress to the corals, shades were kept over the mesocosms throughout the experiment.
The coral communities in the mesocosms were made up of the scleractinian corals Diploria labyrinthiformis, Porites astreoides, and Madracis aurentenra, which are common to reefs in Bermuda (Bates et al., 2010; Courtney et al., 2016). Most of the corals had been previously collected from the Bermuda reef platform and acclimated to mesocosm conditions for over a year. However, to obtain higher coral cover in the mesocosms, additional M. aurentenra corals were collected from a shallow patch reef and acclimated for 1 week. Two coral cover treatments (40 and 80%) and controls (0% coral cover) were replicated in three mesocosms each (n = 3 per treatment). The 40% coral cover treatment contained five medium-sized colonies (<25 cm diameter) of D. labyrinthiformis and P. astreoides whereas 10 colonies total (five of each species) were used in the 80% coral cover treatment; M. aurentenra were filled in around these colonies to obtain the desired coral cover percentages.
Sampling Protocol
Seawater chemistry was monitored every 1–3 h from 06:00 to 00:00 (18 h total) on 29 August 2012 in order to encompass the full daylight period. Relative light intensity was measured using HOBO Pendant® temperature/light data loggers (Onset Computer Corporation) set to record light every 10 min. Seawater temperature (±0.15°C) and salinity (±1.0% of reading) were measured hourly using a YSI 556 multiprobe sensor, which was calibrated immediately prior to the experiment. Every 3 h, seawater samples were collected in 200 mL glass Kimax bottles for dissolved inorganic carbon (DIC) and total alkalinity (TA) analyses. These samples were immediately poisoned with a saturated solution of mercuric chloride to halt any biological activity in the samples.
Sample Analyses
Seawater samples were shipped to Scripps Institution of Oceanography (SIO) where they were analyzed for DIC and TA. DIC was measured using an Automated Infra-Red Inorganic Carbon Analyzer (AIRICA, Marianda Inc.) equipped with an infrared LI-COR 7000 CO2/H2O differential, non-dispersive infrared (NDIR) gas analyzer while TA was measured using an open-cell potentiometric acid-titration procedure outlined in Best Practices for Seawater CO2 Measurements (Dickson et al., 2007). Precision for both instruments was typically within ±3 μmol kg−1 while the accuracies, calculated as the average (±1 std) offset from certified reference material (CRM) values, were 1.45 ± 2.62 (n = 45) and −0.85 ± 1.51 (n = 24) μmol kg−1 for DIC and TA, respectively.
Experiment 2: Hawaii 2016
Experimental Design
The mesocosm facility at HIMB (Smith et al., 1977; Andersson et al., 2009; Page et al., 2016) pumps water from Kaneohe Bay into a main header tank. This header tank flows into smaller header tanks that feed flow-through mesocosms with the dimensions 117 × 117 × 50 cm. Water flows up into the mesocosm from the center of the bottom, causing seawater to be well-mixed and providing plenty of flow for corals. Flow rates for the mesocosms averaged 10.81 ± 0.14 L min−1 (τ = 0.74 ± 0.01 h) while water depth was ~0.35 m. Mesocosms were kept exposed to full sunlight since the reef from which corals were collected was approximately the same depth as the mesocosms.
Two of the dominant coral species, Montipora capitata and Porites compressa, were collected from the patch reef along the north side of Coconut Island. These are among the five dominant coral species in the state of Hawaii (Rodgers et al., 2015). Five coral cover treatments in addition to a control (0% coral cover) were set up in the mesocosms: 20, 40, 60, 80, and 100%. These percentages were composed of approximately half M. capitata and half P. compressa (Supplementary Figure 1). These coral communities were acclimated to mesocosm conditions for 36 h before beginning sampling on the first day.
Sampling Protocol
Seawater chemistry was sampled every 1–3 h for two diel (24 h) cycles (18:00–18:00) during June of 2016, following a similar protocol described for Experiment 1. HOBO loggers recorded relative light levels every 5 min. Seawater temperature (± 0.2°C) and salinity (± 1.0% of reading) were measured hourly using a handheld YSI Professional Plus multi-probe sensor which was calibrated to the certified salinity value (psu) for a CRM (Dickson Laboratory, SIO) immediately prior to each diel cycle. Every 3 h, seawater samples were collected in 250 mL glass Pyrex borosilicate bottles for DIC and TA analyses; these samples were immediately poisoned with a saturated solution of mercuric chloride.
Sample Analyses
Seawater samples were shipped to SIO where they were analyzed for DIC and TA using the same protocol as Experiment 1. Once again, the precision of the instruments was ±3 μmol kg−1. The instrument accuracies were −1.31 ± 2.98 (n = 62) and 0.33 ± 2.21 (n = 23) μmol kg−1 for DIC and TA, respectively.
Data Analysis and Calculations of Mesocosm Experiments
The HOBO loggers recorded relative light levels as lux. However, photosynthesis only utilizes specific wavelengths of light, and thus, photosynthetically available radiation (PAR) provides more insight into the light levels that can drive autotrophic carbon fixation. We converted lux to PAR by using the following equation: PAR (μmol photons m−2 s−1) = LUX ÷ 51.2 (Valiela, 1984; Smith et al., 2013).
Because the source water at each location passes through several ecosystems that modify carbon chemistry over diel cycles (Andersson and Mackenzie, 2012), variability in seawater carbonate chemistry of treatment mesocosms was due to changes both in the source water and modifications by the coral communities in the mesocosms. Additionally, plankton in the seawater may have modified seawater DIC and TA. To eliminate the influences of source water variability and plankton on seawater DIC and TA, and simply evaluate the influence of the benthic community in each mesocosm, the average control values were subtracted from treatment values. Thus, the resulting residual of DIC and TA of the treatment tanks represent modifications owing solely to the specific benthic community within each tank. Values of DIC and TA can be used to calculate NCC and NCP rates by modifying standard equations (Langdon et al., 2010) to:
where control values are averages for a specific sampling time, τ is the average residence time of seawater in the mesocosm (h), ρ is the seawater density (kg m−3), and H is the height of the water column (m). The effect of gas exchange on the DIC in the treatment tanks is partly taken into account by subtracting the DIC from the control tanks, but fails to account for additional CO2 flux as a result of biological modification of the seawater pCO2. However, calculations of this flux (<0.2 mmol m−2 h−1) show that it is small relative to the observed changes and residence time of the water.
Statistical analysis was performed using R v3.3.1 software (R Development Core Team, 2008) to test for differences in NCC and NCP rates between coral cover treatments. For Experiment 1, only rates occurring during daylight hours were used for this analysis; NCC and NCP rates were split into day and night for Experiment 2 since full diel cycles were measured. Data were first visually compared for no differences between replication units (mesocosm for Experiment 1 and day for Experiment 2). Since there were no differences between the replication units for either experiment, they were then combined for a one-way ANCOVA to determine statistically significant differences between coral cover treatments on NCC and NCP rates, controlling for time. When significance for treatment was detected, a post-hoc Tukey's HSD Test with a confidence level of 0.95 was used to examine which treatments were statistically different from one another.
In order to determine how NCC and NCP rates scaled to coral cover (Hypothesis 1), rates measured in Experiment 2 were scaled relative to the observed NCC and NCP rates for the 100% coral cover treatment on each day for each time point. For NCC, the following equation was used:
Since NCP rates are in general positive during the day (primary production > respiration) and negative at night (respiration > primary production), day and night rates were evaluated separately. NCP rates measured at 18:00 were not used for this analysis since the rates at this time transitioned between net primary production and net respiration, and thus, caused misrepresentative scaling values. Therefore, daytime rates were scaled from 0 to 100% and nighttime rates from 0 to – 100%:
Using R v3.3.1 software (R Development Core Team, 2008), linear regression models (lm) were used to describe the relationships between coral cover and scaled rates.
Seawater pH, pCO2, and Ωa were calculated from measured temperature, salinity, DIC and TA using CO2SYS (Lewis and Wallace, 1998). K1 and K2 constants from Mehrbach et al. (1973), refitted by Dickson and Millero (1987) were selected for calculations on the total pH scale.
To further examine the relationships between coral cover, benthic metabolism, and seawater carbonate chemistry, a graphical analysis of TA and DIC vectors was performed (Deffeyes, 1965). Type II Linear Regressions were fit to TA and DIC data for each treatment from Experiment 2 using the lmodel2 package within R v3.3.1 software (R Development Core Team, 2008). The slopes provided by the major axis method, which assumes error in both the x and y axes, are reported and subsequently compared using an ANOVA after ensuring data meet assumptions for this statistical test. This analysis was not completed for Experiment 1 because the linear regressions were not significant (p > 0.05).
In situ Surface Seawater CO2 Measurements in Bermuda and Hawaii
To put the mesocosm results into a broader context we evaluated the diel CO2 variability and environmental conditions at three reef sites equipped with autonomous CO2 sensors and contrasting coral cover for a period of 12 days coincident with the mesocosm experiments (Figure 1). In Bermuda, Crescent Reef is a patch reef located within a sandy bottom lagoon with water depth ranging from ~2 to 7 m at the reef site. Coral cover is ~15% (Jones, 2006). In contrast, Hog Reef is located on the rim reef with depth ranging from ~6 to 11 m. The benthic community at Hog Reef is comprised of close to 30% hard (Scleractinian) corals with almost 70% of the community consisting of macroalgae, turf algae, and soft corals (Courtney et al., 2016). D. labyrinthiformis and P. astreoides constitute ~10 and 1.5% of the benthic cover, respectively (Jones, 2006; Bates et al., 2010; Courtney et al., 2016). The seawater residence time on the rim reef is relatively short (1–4 days) while the lagoon experiences longer seawater residence times ranging from 5 to 12 days (Bates et al., 2010; Venti et al., 2012). In Hawaii, the monitoring site is a back reef environment located within Kaneohe Bay right at the shallow (~2 m) transition zone between the barrier reef with ~65% coral cover (Jokiel et al., 2015) and the inside deep (~12 m) lagoon (Figure 1). The seawater residence time on the barrier reef of Kaneohe Bay, based on numerical simulations forced by historical wave, wind and tidal data is on the order of a day (Lowe et al., 2009), but can be much shorter depending on the wind strength and wave height conditions.
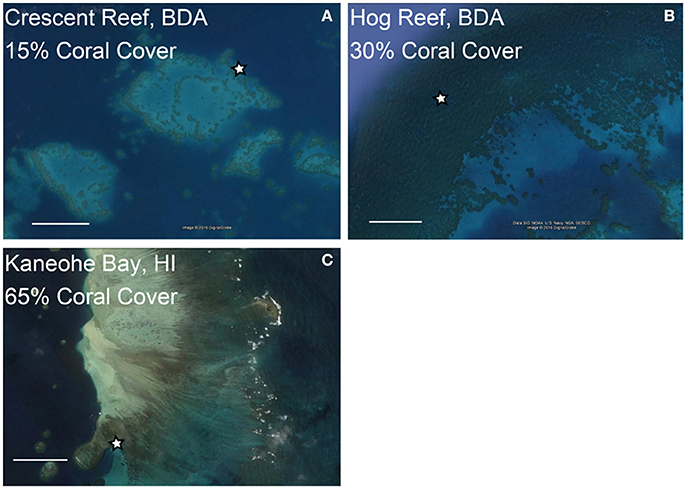
Figure 1. Locations of coral reef buoys at reefs with contrasting coral cover in Bermuda (BDA, A,B) and Hawaii (HI, C). The stars indicate locations of coral reef CO2 buoys and coral cover estimates are for the area surrounding these buoys. The scale bars represent 0.50 km in each image. Images were obtained from Google Earth.
At each reef site, the mole fraction of CO2 (xCO2) in seawater and in air was measured every 3 h by NOAA PMEL MAPCO2 systems (Sutton et al., 2014). The MAPCO2 moorings utilize a Battelle Memorial Institute CO2 system equipped with a LI-COR LI-820 infrared CO2 gas analyzer and SHT71 relative humidity and temperature sensor (Sutton et al., 2014). The system calculates xCO2 in air that has been equilibrated with seawater. The system is calibrated with a zero and a non-zero CO2 reference gas provided by NOAA Earth System Research Laboratory (ESRL) and traceable to World Meteorological Organization (WMO) standards. The accuracy and precision of both air and seawater xCO2 measurements are typically better than 2 μmol mol−1 (Sutton et al., 2014). At each of these sites, seawater temperature (°C) is also measured every 3 h by a Seabird 16plus V2 Seacat CTD. Tide and wind measurements were retrieved from nearby monitoring stations. Hourly mean lower low water (MLLW, m) data were obtained for St. George's Island, Bermuda and Coconut Island (Mokuoloe), Kaneohe, Hawaii from NOAA/National Ocean Service (NOS) Center for Operational Oceanographic Products and Services (https://tidesandcurrents.noaa.gov). Wind data from Bermuda were taken from International Civil Aviation Organization (ICAO) standard observations at the LF Wade International Airport, Bermuda. The NOAA/NOS Data Buoy Center (www.ndbc.noaa.gov) provided hourly wind speed and direction for Coconut Island (Mokuoloe), Kaneohe, Hawaii.
Results
All values are reported as the mean ±1 standard deviation, unless otherwise noted. The term “benthic metabolism” refers to the NCC and NCP rates for the communities containing different densities of coral within the mesocosms.
Experiment 1: Bermuda 2012
Environmental Conditions
The mesocosms experienced natural variations in seawater temperature, salinity, and light (Figure 2). From the beginning of the experiment, seawater temperature increased to a maximum of 30.37 ± 0.19°C at 15:00. Temperatures then decreased to 29.53 ± 0.07°C and remained fairly stable until the last sampling at midnight. Salinity fluctuated slightly around 36.67 psu for most of the experiment. There was a decline to 36.30 ± 0.15 psu at 21:00 due to a rain shower but salinity quickly recovered due to the short residence times of the mesocosms. Light started increasing slightly just before sunrise, which was at 6:52. Light levels reached a maximum (~325 μmol photons m−2 s−1) around 15:00 and then decreased to zero just prior to sunset (19:46).
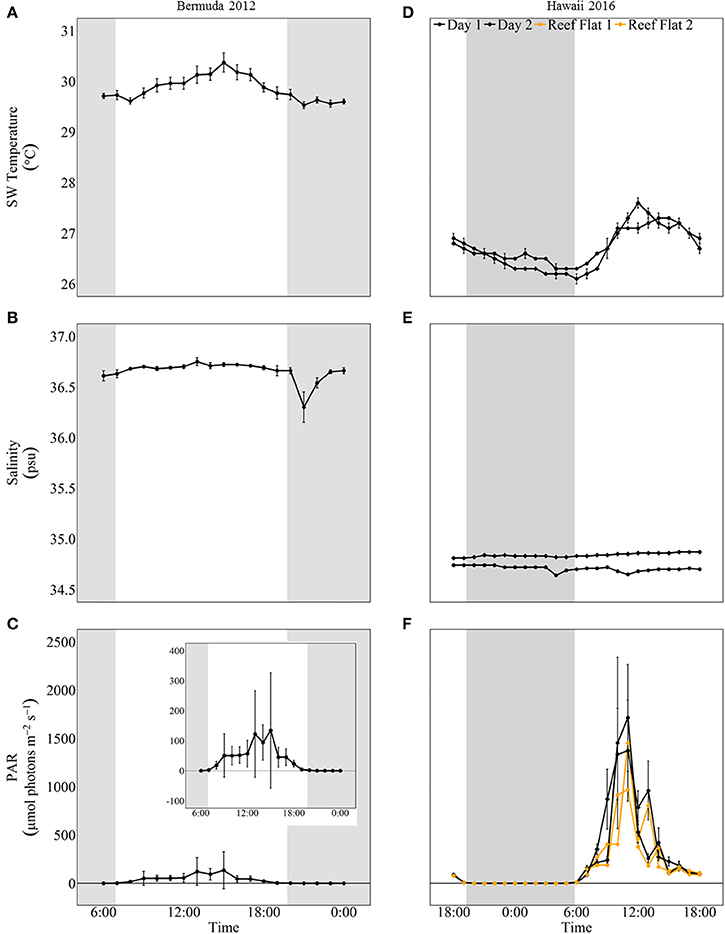
Figure 2. Environmental conditions (mean ± 1 std) for mesocosm experiments in Bermuda 2012 (left panel, A–C) and Hawaii 2016 (right panel, D–F). The shaded areas show night as defined by sunset and sunrise times. In Hawaii, a light sensor was also placed on the reef flat where specimen were collected and these data are shown in orange.
Benthic Metabolism
NCC rates remained fairly stable throughout the experiment while NCP rates followed temperature and light closely, with the significantly highest rates occurring during the middle of the day (Figure 3). Coral communities maintained positive net calcification and organic carbon production throughout the day. Despite slightly higher rates for 80% coral cover throughout most of the day, there were no statistically significant differences in average daytime NCC or NCP between the two coral cover treatments (Table 2). The 40% coral cover treatment had an average daytime NCC rate of 3.37 ± 2.94 mmol m−2 h−1 while the 80% coral cover had a slightly higher average daytime NCC rate of 3.93 ± 2.55 mmol m−2 h−1. NCP rates reached peak organic production at 15:00 when irradiance was highest and rates were ~35% higher for high coral cover than for 40% coral cover (7.94 ± 3.82 vs. 5.93 ± 3.00 mmol m−2 h−1).
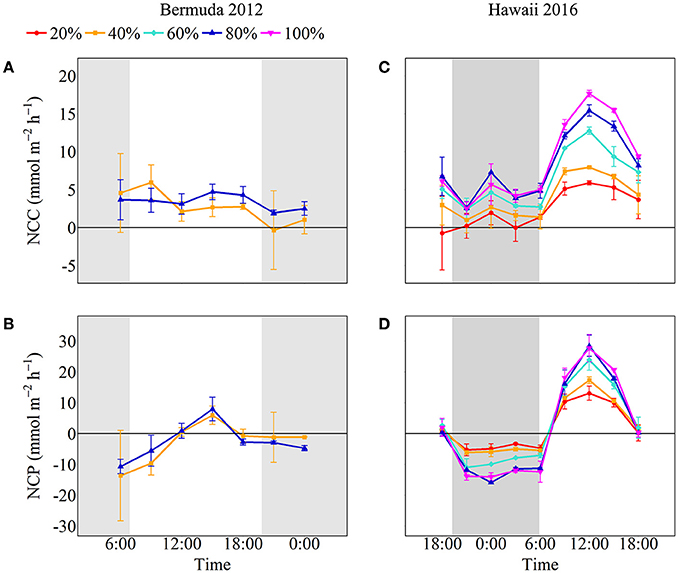
Figure 3. NCC and NCP for Bermuda 2012 (left panels, A,B) and Hawaii 2016 (right panels, C,D) with colors and symbols representing coral cover treatments (red circle: 20%, orange square: 40%, aqua diamond: 60%, blue triangle: 80% and pink inverted triangle: 100%). The shaded areas show night as defined by sunset and sunrise times.
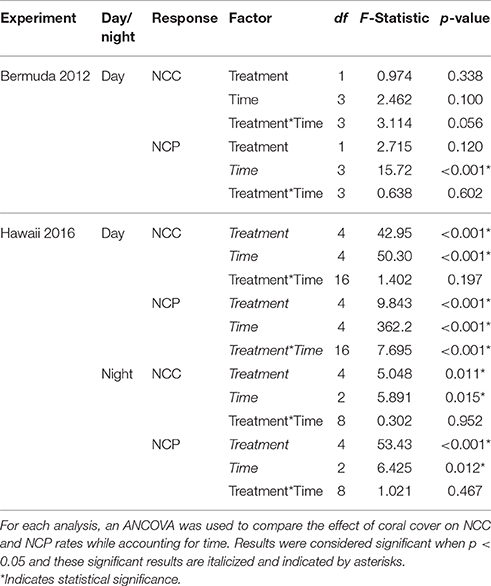
Table 2. Statistical comparison of NCC and NCP rates for Bermuda 2012 and Hawaii 2016.
Seawater Carbonate Chemistry
The net effect of NCC and NCP in the treatment mesocosms modified the seawater carbonate chemistry relative to the control, with positive NCC promoting acidification and positive NCP promoting alkalinization (Figure 4). Seawater pH and Ωa increased throughout the morning until 15:00 after which they slightly decreased. In contrast, seawater pCO2 started at maximum values and decreased until 15:00. At the start of the experiment, before sunrise, seawater pH was lowest for both coral cover treatments (7.85 ± 0.07 and 7.86 ± 0.02 for 40 and 80% coral cover, respectively) and lower than the control pH. Maximum pH for both treatments was 7.94 ± 0.01 which was 0.01 ± 0.01 higher than the control pH. Therefore, the pH range was 0.09 and 0.08 for 40 and 80% coral cover, respectively, which were twice the variability of seawater pH in the control (0.04). Seawater pCO2 was highest in the morning and then decreased to 519.1 ± 10.3 μatm in 40% coral cover and 517.5 ± 11.4 μatm in 80% coral cover. The pCO2 variability for 40 and 80% coral cover was 148.1 μatm and 122.9 μatm, respectively. Seawater Ωa followed the same trend as seawater pH. The minimum values were 2.77 ± 0.40 for 40% coral cover and 2.83 ± 0.13 for 80% coral cover. The Ωa rose to approximately maximum values of 3.33 for both coral cover treatments, which was 0.09 higher than the control (3.24 ± 0.04). The ranges of variability were 0.56 and 0.49 for 40 and 80% coral cover, respectively.
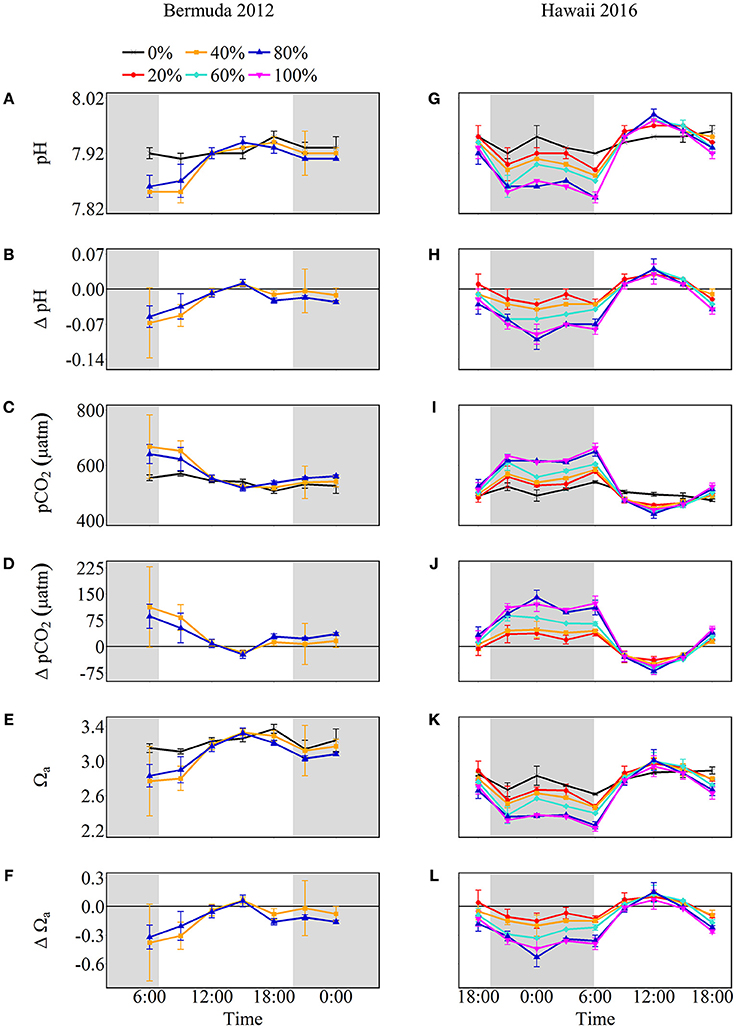
Figure 4. Seawater carbonate chemistry shown as absolute values (pH, pCO2, and Ωa) and the difference from control (0%) values (Δ pH, Δ pCO2, and Δ Ωa) for Bermuda 2012 (left panel, A–F) and Hawaii 2016 (right panel, G–L). The shaded areas show night as defined by sunset and sunrise times while the colors and symbols represent coral cover treatments (black cross: 0%, red circle: 20%, orange square: 40%, aqua diamond: 60%, blue triangle: 80% and pink inverted triangle: 100%).
Experiment 2: Hawaii 2016
Environmental Conditions
Seawater temperature and light had strong diel variations while salinity remained stable throughout both days of sampling. The minimum and maximum seawater temperatures were similar for both days; the minimum temperature was around 26°C at night and then increased to ~27.5°C during midday. On the first day of sampling, salinity averaged 34.71 ± 0.03 psu and was slightly higher on the second day, averaging 34.84 ± 0.03 psu. Light levels reached zero around 19:00 and started increasing when sunrise occurred just before 6:00. Maximum light levels (PAR) were ~1,700 μmol photons m−2 s−1 during both days of sampling. These light levels were almost twice as high as measurements taken on the reef flat where corals were collected (Figure 2).
Benthic Metabolism
Both NCC and NCP followed similar diel trends to seawater temperature and irradiance; rates were low at night and then steadily increased to maximum rates during midday after which they decreased (Figure 3). Although all coral communities maintained net calcification most of the time, there were statistically significant differences between average night [ANCOVA, F(4, 13) = 5.048, p = 0.011] and day [ANCOVA, F(4, 35) = 42.947, p < 0.001] NCC rates (Table 2). The lowest rates of NCC were observed during night and the lowest coral cover had the lowest average NCC rate of 0.73 ± 1.6 mmol m−2 h−1. This rate differed significantly from the highest nighttime NCC rates for 80% (4.0 ± 2.0 mmol m−2 h−1) and 100% (4.1 ± 1.9 mmol m−2 h−1) coral cover, which were not significantly different from one another. These differences between coral cover continued during the day as NCC rates followed the irradiance and temperature increase. The lowest coral cover (20%) had an average daytime NCC rate of 3.4 ± 3.0 mmol m−2 h−1 while the highest coral cover (100%) had an average daytime NCC rate of 11.2 ± 4.9 mmol m−2 h−1.
All of the coral communities experienced net respiration at night and net organic production during the day. As observed for average NCC rates at night, there were also significant differences between treatment average NCP rates at night [ANCOVA, F(4, 13) = 53.43, p < 0.001; Table 2]. The most negative average NCP rates were observed for 80% (−12.5 ± 1.9 mmol m−2 h−1) and 100% (−13.3 ± 1.3 mmol m−2 h−1) coral cover treatments. The 20 and 40% coral cover treatments had the least negative average night NCP rates at −4.5 ± 1.5 and −5.7 ± 0.97 mmol m−2 h−1, respectively, and did not differ significantly from one another. The only significant interaction between coral cover treatment and time occurred for average daytime NCP rates [ANCOVA, F(16, 35) = 7.695, p < 0.001] such that there were only differences between treatments at noon and 15:00 when maximum NCP rates were observed. At noon, 20% coral cover had the lowest positive NCP rate of 13.1 ± 2.3 mmol m−2 h−1 while the maximum NCP rate for the 100% coral cover treatment was approximately doubled at 27.7 ± 4.4 mmol m−2 h−1.
Although there was quite a bit of variance in scaled NCC and NCP rates, linear regressions of scaled rates vs. coral cover explained over 95% of this variance and thus were statistically significant for NCC (R2 = 0.98, p = 0.001), NCPDay (R2 = 0.96, p = 0.003), and NCPNight (R2 = 0.95, p = 0.003). NCC rates scaled proportionally to coral cover with the linear regression having a slope of 0.99. (A linear regression with a slope of 1 would indicate increases in metabolic rates proportional to increases in coral cover.) The scaled NCC rates increased from 25 ± 33% to 89 ± 28% for 20% and 80% coral cover, respectively. NCPNight also scaled relatively proportionally to coral cover with the linear regression having a slope of −0.90. The lowest coral cover (20%) had scaled NCPNight rates of −35 ± 9% while 80% coral cover had scaled NCPNight rates of −93 ± 12%. Unlike NCC and NCPNight, scaled rates for NCPDay did not scale proportionally to coral cover; the slope of the linear regression was only 0.66. The 20% coral cover treatment had scaled NCPDay of 51 ± 6% and this scaled rate increased to 93 ± 9% for 80% coral cover (Figure 5). Comparison of rates of nighttime net respiration to daytime net production revealed that the balance between net respiration and net production shifts toward the former as coral cover increases (inset on Figure 5). Consequently, daily positive net community production remained relatively similar between treatments.
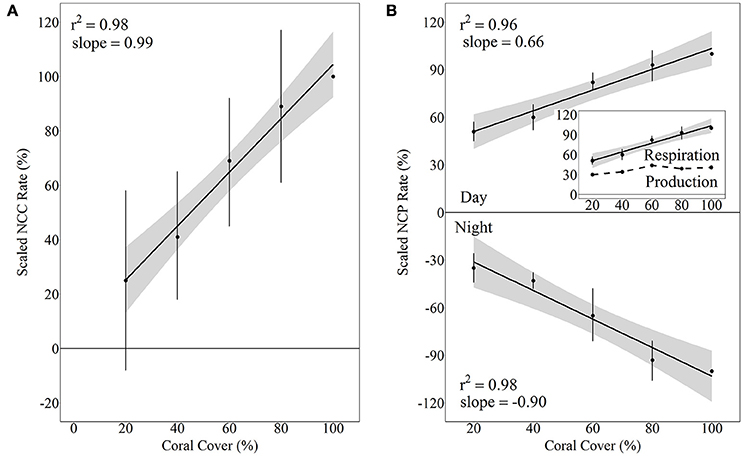
Figure 5. Scaled NCC (A) and NCP (B) rates vs. coral cover treatments for Hawaii 2016 with linear regressions and shaded 95% confidence intervals during day and night. Separate linear regressions were performed for NCP day and night to show scaled rates for NCPNight (net respiration, B, bottom panel) and NCPDay (net organic carbon production, (B, top panel). The inset shows the daytime NCP rates as well as the difference between day and night NCP rates (dashed line), which essentially is a relative estimate of the integrated daily net production rate relative to daytime NCP in the 100% coral cover treatment.
Seawater Carbonate Chemistry
Net calcification and net respiration at night resulted in low seawater pH and Ωa and high pCO2 while net organic carbon production during the day elevated seawater pH and Ωa, and decreased pCO2 (Figure 4). Interestingly, there were noticeable differences in seawater carbonate chemistry between different coral cover treatments at night but not during the day. Seawater pH for coral cover treatments was lower than control at night and had minimum pH ranging from 7.89 ± 0.00 (20% coral cover) to 7.84 ± 0.01 (80 and 100% coral cover). During the day, control pH reached a maximum of 7.96 ± 0.01 while the coral cover treatments had pH values 0.01–0.03 higher than the control. The diel variability of seawater pH was lowest for the control (0.04) and increased with increasing coral cover (0.08 for 20% coral cover to 0.14 for 100% coral cover). Maximum seawater pCO2 occurred at the end of the night, just before sunrise. The control reached a maximum pCO2 of 539.0 ± 3.5 μatm while coral cover treatment maxima ranged from 577.0 ± 4.2 (20% coral cover) to 662.0 ± 14.4 μatm (100% coral cover). Minimum seawater pCO2 was observed at midday with coral cover treatments having lower pCO2 relative to the control. As with seawater pH, these diel trends led to increasing variability of pCO2 with increasing coral cover. Coral cover treatments had the lowest Ωa during the night with minimum values of 2.48 ± 0.02 (20% coral cover) to 2.23 ± 0.04 (100% coral cover) and these were lower than the minimum value for the control (2.62 ± 0.01). During the day, coral cover treatments had slightly higher seawater Ωa relative to control values. The diel variability of seawater Ωa was lowest for the control (0.27) and increased with increasing coral cover (0.49–0.71 for 20 and 100% coral cover, respectively). Although the magnitude of changes observed in seawater TA and DIC differed between treatments (Figure 6), there were no differences between the slopes of TA:DIC ratios [ANOVA, F(4, 5) = 0.271, p = 0.885; Figure 7]. These slopes ranged from 0.43 ± 0.10 for 40% coral cover to 0.54 ± 0.24 for 80% coral cover. This resulted in a pH range of 7.8–8.0 and pCO2 range of 400–800 μatm for all coral densities.
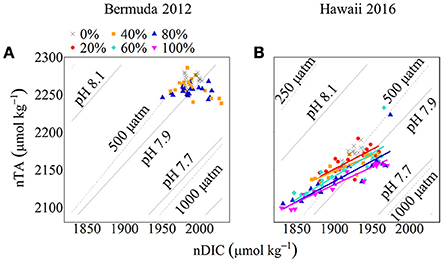
Figure 6. nTA:nDIC plots with pH and pCO2 isolines for Bermuda 2012 (A) and Hawaii 2016 (B). Seawater pH and pCO2 was calculated using nDIC, nTA, and average temperature and salinity for each site. The colored symbols show coral cover treatments (black cross: 0%, red circle: 20%, orange square: 40%, aqua diamond: 60%, blue triangle: 80% and pink inverted triangle: 100%) for both experiments. The colored lines show Type II Linear Regressions for each coral community.
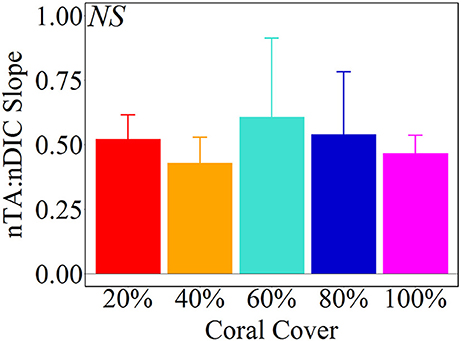
Figure 7. Average (± 1 std) nTA:nDIC slopes from Type II Linear Regressions of the Hawaii mesocosm data. There were no statistical significant differences between coral cover treatments [ANOVA, F(4, 5) = 0.271, p = 0.885].
In Situ Surface Seawater CO2 Measurements in Bermuda and Hawaii
In general, in situ observations showed that reefs with higher coral cover experienced greater diel variability in seawater CO2 than reefs with lower coral cover (Figure 8). Crescent Reef, which had the lowest coral cover, experienced a mean xCO2 of 483.6 μmol mol−1 and a range of 455.2–521.8 μmol mol−1. Hog Reef had slightly higher mean xCO2 (501.5 μmol mol−1) and range (444.9–574.8 μmol mol−1) compared to Crescent Reef. The larger range of CO2 at Hog Reef can be attributed to nighttime maxima always being greater than Crescent Reef whereas daytime minima were similar to or slightly lower than Crescent Reef. However, both reefs always had higher xCO2 than the atmosphere, which averaged 385 μmol mol−1. The reef in Kaneohe Bay experienced a much greater range of xCO2 compared to the reefs in Bermuda with both nighttime maxima and daytime minima higher and lower, respectively. The minimum value during the study period was 306.0 μmol mol−1 while the maximum was 691.0 μmol mol−1 with a mean of 473.5 μmol mol−1. The average seawater temperature in Bermuda was 29.3°C with a 1.5°C range while Hawaii was slightly cooler (mean = 26.4°C) and experienced a larger range of 4°C. Both regions had semidiurnal tides with a tidal range less than or equal to 1 m. Wind speed and direction were variable in Bermuda while east to northeasterly trade winds dominated in Hawaii during the time frames examined (Figure 8).
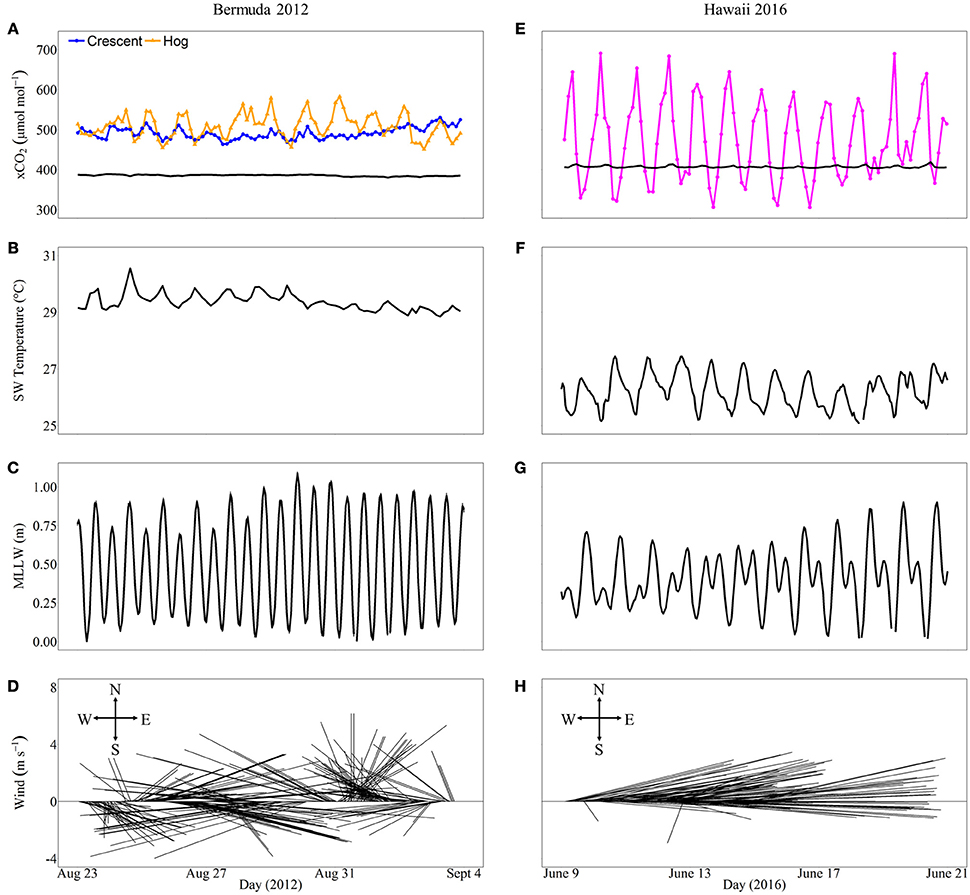
Figure 8. In situ xCO2(μmol mol−1) and environmental conditions including seawater temperature, tidal range, and wind speed and direction that may influence xCO2 variability for different reefs in Bermuda (left panel, A–D) and Hawaii (right panel, E–H) over 12 consecutive days overlapping the mesocosm experimental periods during 2012 and 2016, respectively. The xCO2 for both the atmosphere (black lines) and seawater (colored lines) are shown (A,E). Crescent Reef (orange circles) has the lowest coral cover while the reef in Hawaii (Kaneohe Bay barrier reef; magenta circles) has the highest coral cover.
Discussion
This study was designed to test hypotheses relevant for the scaling of NCC and NCP rates and their influence on seawater carbonate chemistry for different coral densities. Higher coral density sometimes, but not always led to higher NCC and NCP rates that scaled with increases in coral cover. In Bermuda, the higher coral density treatment (80%) did not have statistically significantly higher average daytime NCC or NCP rates (H1) compared to the low coral density (40%) treatment. Consequently, no significantly different influences on seawater carbonate chemistry were observed between low and high coral cover for this experiment (H2). In contrast, higher coral cover did lead to statistically higher average NCC and NCP rates in Hawaii (H1). Furthermore, these increases were roughly linearly proportional to the increases in coral cover for NCC and NCPNight. That is, a doubling in coral cover doubled the rate of NCC and the rate of nighttime net respiration (-NCP) (H1). NCPDay also increased with increasing coral cover, but was not directly proportional to the percent increase in cover. Notably, the observed increases in metabolic rates led to increases in diel variability of seawater pH, pCO2, and Ωa (H2). Likewise, field measurements of seawater xCO2 in Bermuda and Hawaii showed greater diel ranges for reef areas with higher coral cover. We discuss these results further in the subsequent sections.
Coral Density and Benthic Metabolic Rates
The first experiment conducted in Bermuda during 2012 showed no significant difference between daytime NCC and NCP rates between two coral cover treatments. In addition, NCC rates remained relatively low and did not follow a clear diurnal cycle (average of 2.68 and 3.40 mmol m−2 h−1 for 40 and 80% coral cover, respectively), while NCP rates tracked light and temperature closely with the highest rates occurring in the late afternoon. These results were unexpected as we had anticipated high coral cover to have significantly higher metabolic rates than low coral cover (Kleypas et al., 2011). We had also expected NCC rates to track variations in light intensity and NCP due to light and/or production enhanced calcification (e.g., Vandermeulen et al., 1972; Gattuso et al., 1999; Albright et al., 2015; Cohen et al., 2016). However, the observed variability in NCC and NCP rates between treatments was high, masking any potential systematic differences (Figure 3). It is likely this variability was partly related to insufficient control and characterization of flow rates, and therefore residence time within the mesocosms, which has a large influence on calculations of NCC and NCP. Furthermore, shading cloth intended to moderate temperatures in the mesocosms resulted in low light intensities that only reached a maximum of 325 μmol photons m−2 h−1. This may have resulted in metabolic rates that were insufficient to distinguish differences between the two treatments. In addition, limited light conditions may also explain the low and temporally flat NCC rates despite a distinct temporal trend in NCP, since photosynthesis and light enhanced calcification could respond differently to different wavelengths and intensity of light (Cohen et al., 2016). However, additional studies would be required to evaluate whether this could have been the case. Compared to the Hawaii experiments conducted under higher light conditions (max ~1,700 μmol photons m−2 h−1), NCP rates for the Bermuda experiment were much lower although the qualitative trend and difference between treatments were similar to the Hawaii experiments (Figure 2). Regardless of the shortcomings of this experiment, the results represent metabolic rates of two coral density treatments and their influence on seawater carbonate chemistry under the reported conditions, which could naturally be experienced in situ on cloudy days or at deeper depths. The results also provide important information to be considered in the interpretation of other studies as well as in the design of future experiments.
Because of the somewhat inconclusive results achieved in Bermuda, the follow-up study in Hawaii was designed using the mesocosm facility at HIMB, which experiences full exposure to sunlight and has a proven ability to control seawater flow rates (Andersson et al., 2009; Page et al., 2016). Using more different coral cover treatments and full diel cycles also allowed a more incisive investigation into the effects of coral densities on benthic metabolism and seawater carbonate chemistry. In contrast to the Bermuda experiments, these experiments showed statistically significant increasing rates of NCC and NCP as a function of increasing coral cover. In addition, both NCC and NCP followed the light cycle with lower rates at night and higher rates during the day as expected based on previous mesocosm experiments at HIMB (Jokiel et al., 2014; Page et al., 2016). Coral communities typically maintained net calcification (positive NCC) throughout the experiments with a few instances of net CaCO3 dissolution for the lower coral cover communities (20 and 40%) during the night. Interestingly, rates of NCC and NCPnight scaled directly to coral cover while NCPday did not (Figure 5). Because rates of respiration are linked to body size and metabolic demand, the proportional link between coral cover and NCPnight seems reasonable. The same might be true for NCC assuming that this rate is directly linked to the energetic expenditure of the colonies within a community. However, this relationship between body size and metabolic demand for NCC would imply that communities with low coral cover require more energy to calcify or can store more energy for other processes than high coral cover since NCPday rates were proportionally higher for low coral cover compared to high coral cover communities. For example, the 20% coral cover treatment had NCPday rates on average approximately half of the rates for the 100% coral cover treatment, but maintained NCC rates at ~20% of the rates observed in the 100% treatment. One possibility is that higher coral cover may have depleted the availability of resources (e.g, inorganic macro-nutrients) necessary for primary production, thus leading to proportionally lower NCP in these treatments. Mesocosms with higher coral cover also contained more complex topography, which could result in shading of some coral colonies and/or different boundary layer thicknesses (Shashar et al., 1996; Hearn et al., 2001), which could affect rates of primary production (Dennison and Barnes, 1988). Furthermore, intra- and inter-specific interactions in high coral density could reduce rates of physiological processes as organisms cope with stress and/or divert energy resources toward defense mechanisms against competitors (Rinkevich and Loya, 1985; Tanner, 1997). Regardless of the various factors that may have influenced the metabolic rates, it is unclear why NCC scaled proportionally with coral cover while NCPday did not. Time may also be a factor with potential lag in responses that are not detected over the diel timescale of the current experiments. Experiments of longer duration could potentially reveal different relationships and scaling of metabolic rates in response to variations in environmental parameters. Our initial results indicate that additional studies are warranted to better understand how different environmental and physical properties interact and influence benthic metabolic rates.
Coral Density and Seawater Carbonate Chemistry
In general, positive NCC and negative NCP at night led to seawater acidification while positive NCP exceeding NCC during the day promoted alkalinization for most treatments (Figure 4). Intuitively, one might anticipate that higher coral cover and higher rates of NCC and NCP would lead to significantly different seawater pH, pCO2, and Ωa as well as different diel amplitude and variability, but this was not always the case. Naturally, for the Bermuda experiments, no differences in seawater pH, pCO2, and Ωa were observed between coral densities because NCC and NCP rates were not significantly different. However, even for the Hawaii experiments, no significant differences were observed in these parameters between coral density treatments during the day despite significantly different NCC and NCP rates. In contrast, seawater pH and Ωa were progressively lower and pCO2 higher with increasing coral cover at night, which resulted from increased net respiration and positive NCC as a function of higher coral cover. As a result of the differential influence by communities with different coral densities on seawater chemistry at night, the daily average pH and Ωa, and the diel variability of these parameters decreased and increased slightly, respectively, with increasing coral cover.
Deffeyes diagrams (Deffeyes, 1965) provide a useful tool to understand the observed trends in carbonate chemistry and illuminate differences in diel variability of seawater pH, pCO2, and Ωa between coral cover treatments. These diagrams graphically depict seawater carbonate chemistry parameters (i.e., pH, Ωa, and pCO2) as a function of variations in TA and DIC owing to modification by biogeochemical processes such as NCC and NCP (Watanabe et al., 2006; Andersson and Gledhill, 2013). Depending on the slope of the TA-DIC relationship, one can infer the relative importance of organic to inorganic carbon cycling (i.e., NCP vs. NCC) with slopes less than ~1 indicating higher dominance by organic carbon cycling. In this study, the overall slopes of the vectors were always less than 1 for the duration of the experiments. Some of the observed variability in TA-DIC slopes could be accounted for by changes in the source water, but in general this was small compared to the changes due to metabolic processes within the mesocosms (Figure 6). Although TA-DIC slopes were similar across treatments, there was consistently lower TA with increasing coral cover owing to higher NCC rates, which combined with more negative NCP rates during night, led to differences in the daily mean and the range of variability of seawater pH, pCO2, and Ωa between treatments. At night, positive NCC and negative NCP acted additively in modifying seawater carbonate chemistry parameters while during the day, positive NCC and positive NCP counteracted the influence on these parameters (Page et al., 2016). Consequently, both the absolute NCC and NCP rates and the relative balance between these processes, which combined modify the seawater TA and DIC balance, are important to consider in evaluating the influence of biogeochemical processes on seawater pH, pCO2, and Ωa (Andersson and Gledhill, 2013).
Similar to the mesocosm results, natural coral reefs with higher coral cover experienced greater diel ranges of seawater CO2 concentrations relative to reefs with lower coral cover. In Bermuda, observations of seawater CO2 from Crescent and Hog Reefs qualitatively agreed with the mesocosm results with large differences at night, but similar conditions during the day between the two reef sites. At this time, it is not our intention to fully assess the in situ variability and quantitatively compare it to the mesocosm results, as additional data are required (see for example, Kayanne et al., 2005); however, initial assessments show that the range of in situ CO2 and temperatures are comparable to values measured in the mesocosm experiments. Compared to the mesocosms, additional biological and physical factors influence seawater carbonate chemistry on natural coral reefs. Even though coral cover is the only biological metric reported here, additional functional groups (e.g., calcifying algae, fleshy macroalgae, and sand) differed between each reef site, but were not included in the mesocosms. The magnitude of the influence by benthic metabolism on seawater carbonate chemistry is likely to depend on benthic community composition. Previous mesocosm and flume studies have shown differential modification of seawater pCO2, pH, and Ωa(Anthony et al., 2011, 2013; Page et al., 2016) between fleshy algae, crustose coralline algae, coral, and sand communities due to differences in benthic metabolic rates. Although benthic metabolism typically has a large influence on the magnitude of CO2 changes on a reef, physical drivers such as water depth, residence time, tidal flow, wind speed, and wave forcing strongly influence this variability as well (Suzuki and Kawahata, 2003; Drupp et al., 2013; Falter et al., 2013). Furthermore, air-sea gas exchange (Bates et al., 2001; Fagan and Mackenzie, 2007) and terrestrial influences (Kawahata et al., 2000; Suzuki and Kawahata, 2003; Drupp et al., 2011; Massaro et al., 2012; Cyronak et al., 2013) must also be considered as they may differ greatly between Bermuda and Hawaii (particularly terrestrial inputs). The Kaneohe Bay reef system is more strongly dominated by organic carbon cycling than inorganic carbon cycling (Massaro et al., 2012) while the opposite is true for the Bermuda reefs (Andersson et al., 2014). Consequently, additional studies would be required to tease apart the exact drivers of seawater CO2 variability on these reefs and to determine the in situ relative importance of coral cover and other benthic components to this variability.
Integrating Effects across Scales to Predict Coral Reef Response to Environmental Changes
The results from this study highlight the need to develop a more comprehensive understanding of how metabolic processes and the subsequent effects on seawater carbonate chemistry integrate across functional, spatial, and temporal scales. Community scale mesocosm experiments provide an intermediate step between experiments with individual coral colonies and natural reef communities, and provide valuable insight into drivers of benthic community metabolism (e.g., coral cover, community composition, flow rates, and resource availability) (Anthony et al., 2013; Page et al., 2016). However, the question remains: how do these results translate to an entire reef system across different temporal and spatial scales? In this study, altering coral cover alone in mesocosms did not always change the influence on the magnitude of the variability of diel seawater pCO2, pH, and Ωa, but natural reefs with variable coral cover exhibited significantly different diel variability in seawater CO2. It is clear from the current results that additional processes need to be considered to account for the in situ observations, which may include water depth, water flow, and the major functional groups' relative composition and metabolism. Nonetheless, the process of comparing results from controlled laboratory experiments with in situ observations is a necessary first step of developing a more sophisticated model that is able to account for the observed variability in the natural environment. Combined with refinement and application of existing ecological theory, this approach provides an initial foundation to integrate metabolic rates across functional, spatial and temporal scales (Andersson et al., 2015; Edmunds et al., 2016; Shaw et al., 2016). Being able to integrate metabolic rates across scales will be critical to predict how coral reefs as a whole will respond to environmental perturbations, such as climate change and OA. The magnitude of OA will, at the local scale, partly depend on benthic metabolism and how it modifies seawater carbonate chemistry (Anthony et al., 2011, 2013; Kleypas et al., 2011; Jokiel et al., 2014; Page et al., 2016). Therefore, research priorities should first aim to understand the relationships between community composition, benthic metabolism and seawater carbonate chemistry, then how physical forcing/processes alter the “apparent” response of the seawater to the specific community metabolism and, finally, how these relationships are modified by climate change and OA. The pathway to accurately being able to scale results between different functional, spatial, and temporal levels will require a range of research approaches integrating laboratory experiments with field observations and numerical modeling, but these efforts will be essential to advance our understanding regarding the future impacts of climate change and OA on these important systems (Andersson et al., 2015). One of the main challenges is related to the fact that different processes and drivers of net reef metabolism operate on different temporal and spatial scales, and perhaps this can only fully be accounted for by a well-defined numerical model integrating physical, ecological and biogeochemical processes.
Author Contributions
HP and AA designed the study, analyzed the results, and wrote the initial draft of the manuscript. HP, TC, and AC conducted the experiments. ED contributed data. All authors contributed to writing of the revised manuscript.
Funding
NSF GRFP (HP, TC); NSF OCE 09-28406; NSF OCE 12-55042 (AA), NOAA: NA14OAR4170071, Project R/IR-27, University of Hawaii Sea Grant College Program (ED).
Conflict of Interest Statement
The authors declare that the research was conducted in the absence of any commercial or financial relationships that could be construed as a potential conflict of interest.
Acknowledgments
We would like to thank Melissa Wartman and Noah Howins for assistance with preparing and conducting these mesocosm experiments in Bermuda and Hawaii as well as Kyra Freeman for help with analyzing seawater samples. We would also like to thank the reviewers for their comments which greatly improved the original version of this paper. This paper is funded in part by a grant/cooperative agreement from the National Oceanic and Atmospheric Administration, Project R/IR-27, which is sponsored by the University of Hawaii Sea Grant College Program, SOEST, under Institutional Grant No. NA14OAR4170071 from NOAA Office of Sea Grant, Department of Commerce. The views expressed herein are those of the author(s) and do not necessarily reflect the views of NOAA or any of its subagencies. UNIHI-SEAGRANT-JC-17-01.
Supplementary Material
The Supplementary Material for this article can be found online at: https://www.frontiersin.org/article/10.3389/fmars.2017.00161/full#supplementary-material
References
Albright, R., Benthuysen, J., Cantin, N., Caldeira, K., and Anthony, K. (2015). Coral reef metabolism and carbon chemistry dynamics of a coral reef flat. Geophys. Res. Lett. 42, 3980–3988. doi: 10.1002/2015GL063488
Andersson, A. J., and Gledhill, D. (2013). Ocean acidification and coral reefs: effects on breakdown, dissolution, and net ecosystem calcification. Ann. Rev. Mar. Sci. 5, 321–348. doi: 10.1146/annurev-marine-121211-172241
Andersson, A. J., Kline, D. I., Edmunds, P. J., Archer, S. D., Bednaršek, N., Carpenter, R. C., et al. (2015). Understanding ocean acidification impacts on organismal to ecological scales. Oceanography 28, 16–27. doi: 10.5670/oceanog.2015.27
Andersson, A. J., Kuffner, I. B., Mackenzie, F. T., Jokiel, P. L., Rodgers, K. S., and Tan, A. (2009). Net loss of CaCO3 from a subtropical calcifying community due to seawater acidification: mesocosm-scale experimental evidence. Biogeosciences 6, 1811–1823. doi: 10.5194/bg-6-1811-2009
Andersson, A. J., and Mackenzie, F. T. (2012). Revisiting four scientific debates in ocean acidification research. Biogeosciences 9, 893–905. doi: 10.5194/bg-9-893-2012
Andersson, A. J., Mackenzie, F. T., and Gattuso, J.-P. (2011). “Effects of ocean acidification on benthic processes, organisms, and ecosystems” in Ocean Acidification, eds. J.-P. Gattuso and L. Hansson (New York, NY: Oxford University Press), 122–153.
Andersson, A. J., Yeakel, K. L., Bates, N. R., and de Putron, S. J. (2014). Partial offsets in ocean acidification from changing coral reef biogeochemistry. Nat. Clim. Chang. 4, 56–61. doi: 10.1038/nclimate2050
Anthony, K. R. N., Diaz-Pulido, G., Verlinden, N., Tilbrook, B., and Andersson, A. J. (2013). Benthic buffers and boosters of ocean acidification on coral reefs. Biogeosciences 10, 4897–4909. doi: 10.5194/bg-10-4897-2013
Anthony, K. R. N., Kleypas, J., and Gattuso, J.-P. (2011). Coral reefs modify their seawater carbon chemistry – implications for impacts of ocean acidification. Glob. Chang. Biol. 17, 3655–3666. doi: 10.1111/j.1365-2486.2011.02510.x
Anthony, K. R. N., Kline, D. I., Diaz-Pulido, G., Dove, S., and Hoegh-Guldberg, O. (2008). Ocean acidification causes bleaching and productivity loss in coral reef builders. Proc. Natl. Acad. Sci. U.A.S. 105, 17442–17446. doi: 10.1073/pnas.0804478105
Bahr, K. D., Jokiel, P. L., and Rodgers, K. S. (2016). Relative sensitivity of five Hawaiian coral species to high temperature under high-pCO2 conditions. Coral Reefs. 35, 729–738. doi: 10.1007/s00338-016-1405-4
Baker, A. C., Glynn, P. W., and Riegl, B. (2008). Climate change and coral reef bleaching: an ecological assessment of long-term impacts, recovery trends and future outlook. Estuar. Coas. Shelf Sci. 80, 435–471. doi: 10.1016/j.ecss.2008.09.003
Bates, N. R. (2002). Seasonal variability of the effect of coral reefs on seawater CO2 and air-sea CO2 exchange. Limnol. Oceanogr. 47, 43–52. doi: 10.4319/lo.2002.47.1.0043
Bates, N. R., Amat, A., and Andersson, A. J. (2010). Feedbacks and responses of coral calcification on the Bermuda reef system to seasonal changes in biological processes and ocean acidification. Biogeosciences 7, 2509–2530. doi: 10.5194/bg-7-2509-2010
Bates, N. R., Smauels, L., and Merlivat, L. (2001). Biogeochemical and physical factors influencing seawater fCO2 and air-sea CO2 exchange on the Bermuda coral reef. Limnol. Oceanogr. 46, 833–846. doi: 10.4319/lo.2001.46.4.0833
Brown, B. E. (1997). Coral bleaching: causes and consequences. Coral Reefs. 16(Suppl.), S129–S138. doi: 10.1007/s003380050249
Brown, J. H., Gillooly, J. F., Allen, A. P., Savage, V. M., and West, G. B. (2004). Toward a metabolic theory of ecology. Ecology 85, 1771–1789. doi: 10.1890/03-9000
Bruno, J. F., and Selig, E. R. (2007). Regional decline of coral cover in the Indo-Pacific: timing, extent, and subregional comparisons. PLoS ONE 2:e711. doi: 10.1371/journal.pone.0000711
Bruno, J. F., and Valdivia, A. (2016). Coral reef degradation is not correlated with local human population density. Sci. Rep. 6:29778. doi: 10.1038/srep29778
Buddemeier, R. W., Jokiel, P. L., Zimmerman, K. M., Lane, D. R., Carey, J. M., Bohling, G. C., et al. (2008). A modeling tool to evaluate regional coral reef responses to changes in climate and ocean chemistry. Limnol. Oceanogr. Methods. 6, 395–411. doi: 10.4319/lom.2008.6.395
Chen, P. Y., Chen, C.-C., Chu, L., and McCarl, B. (2015). Evaluating the economic damage of climate change on global coral reefs. Global Environ. Change. 30, 12–20. doi: 10.1016/j.gloenvcha.2014.10.011
Cohen, I., Dubinsky, Z., and Erez, J. (2016). Light enhanced calcification in hermatypic corals: new insights from light spectral responses. Front. Mar. Sci. 2:122. doi: 10.3389/fmars.2015.00122
Coles, S. L., and Jokiel, P. L. (1977). Effects of temperature on photosynthesis and respiration in hermatypic corals. Mar. Biol. 43, 209–216. doi: 10.1007/BF00402313
Comeau, S., Edmunds, P. J., Spindel, N. B., and Carpenter, R. C. (2013). The responses of eight coral reef calcifiers to increasing CO2 do no exhibit a tipping point. Limnol. Oceanogr. 58, 388–398. doi: 10.4319/lo.2013.58.1.0388
Costanza, R., de Groot, R., Sutton, P., van der Ploeg, S., Anderson, S. J., Kubiszewski, I., et al. (2014). Changes in the global value of ecosystem services. Glob. Environ. Change 26, 152–158. doi: 10.1016/j.gloenvcha.2014.04.002
Courtney, T. A., Andersson, A. J., Bates, N. R., Collins, A., Cyronak, T., de Putron, S. J., et al. (2016). Comparing chemistry and census-based estimates of net ecosystem calcification on a rim reef in Bermuda. Front. Mar. Sci. 3:181. doi: 10.3389/fmars.2016.00181
Crawley, A., Kline, D. I., Dunn, S., Anthony, K. R. N., and Dove, S. (2010). The effect of ocean acidification on symbiont photorespiration and productivity in Acropora formosa. Glob. Chang. Biol. 16, 851–863. doi: 10.1111/j.1365-2486.2009.01943.x
Cyronak, T., Santos, I. R., Erler, D. V., and Eyre, B. D. (2013). Groundwater and porewater as major sources of alkalinity to a fringing coral reef lagoon (Muri Lagoon, Cook Islands). Biogeosciences 10, 2467–2480. doi: 10.5194/bg-10-2467-2013
De'ath, G., Fabricius, K. E., Sweatman, H., and Puotinen, M. (2012). The 27-year decline of coral cover on the Great Barrier Reef and its causes. Proc. Natl. Acad. Sci. U.S.A. 109, 17995–17999. doi: 10.1073/pnas.1208909109
Deffeyes, K. S. (1965). Carbonate equilibria: a graphic and algebraic approach. Limnol. Oceanogr. 10, 412–426. doi: 10.4319/lo.1965.10.3.0412
de Groot, R., Brander, L., van der Ploeg, S., Costanza, R., Bernard, F., Braat, L., et al. (2012). Global estimates of the value of ecosystems and their services in monetary units. Ecosyst. Serv. 1, 50–61. doi: 10.1016/j.ecoser.2012.07.005
Dennison, W. C., and Barnes, D. J. (1988). Effect of water motion on coral photosynthesis and calcification. J. Exp. Mar. Biol. Ecol. 115, 67–77. doi: 10.1016/0022-0981(88)90190-6
Dickson, A. G., and Millero, F. J. (1987). A comparison of the equilibrium constants for the dissociation of carbonic acid in seawater media. Deep Sea Res. Part I Oceanogr. Res Pap. 34, 1733–1743. doi: 10.1016/0198-0149(87)90021-5
Dickson, A. G., Sabine, C. L., and Christian, J. R. (2007). Guide to best practices for ocean CO2 measurements. PICES Special Publication 3, 191.
Drupp, P., De Carlo, E. H., Mackenzie, F. T., Bienfang, P., and Sabine, C. (2011). Nutrient inputs, phytoplankton response and CO2 variations in a semi-enclosed subtropical embayment, Kaneohe Bay, Hawaii. Aquatic Geochem. 17, 473–498. doi: 10.1007/s10498-010-9115-y
Drupp, P. S., De Carlo, E. H., Mackenzie, F. T., and Sabine, C. L. (2013). A comparison of CO2 dynamics and air-sea exchange in differing tropical reef environments. Aquatic Geochem. 19, 371–397. doi: 10.1007/s10498-013-9214-7
Edmunds, P. J., Comeau, S., Lantz, C., Andersson, A., Briggs, C., Cohen, A., et al. (2016). Integrating the effects of ocean acidification across functional scales on tropical coral reefs. Bioscience. 66, 350–362. doi: 10.1093/biosci/biw023
Enochs, I. C., Manzello, D. P., Kolodziej, G., Noonan, S. H. C., Vlentino, L., and Fabricius, K. E. (2016). Enhanced macroboring and depressed calcification drive net dissolution at high-CO2 coral reefs. Proc Royal Soc B. 283:20161742. doi: 10.1098/rspb.2016.1742
Evensen, N. R., and Edmunds, P. J. (2016). Interactive effects of ocean acidification and neighboring corals on the growth of Pocillopora verrucosa. Mar. Biol. 163:148. doi: 10.1007/s00227-016-2921-z
Eyre, B. D., Andersson, A. J., and Cyronak, T. (2014). Benthic coral reef calcium carbonate dissolution in an acidifying ocean. Nat. Clim. Chang. 4, 969–976. doi: 10.1038/nclimate2380
Fagan, K. E., and Mackenzie, F. T. (2007). Air-sea CO2 exchange in a subtropical estuarine-coral reef ecosystem, Kaneohe Bay, Oahu, Hawaii. Mar. Chem. 106, 174–191. doi: 10.1016/j.marchem.2007.01.016
Falter, J. L., Lowe, R. J., Zhang, Z., and McCulloch, M. (2013). Physical and biological controls on the carbonate chemistry of coral reef waters: effects of metabolism, wave forcing, sea level, and geomorphology. PLoS ONE 8:e53303. doi: 10.1371/journal.pone.0053303
Ferrier-Pagès, C., Witting, J., Tambutté, E., and Sebens, K. P. (2003). Effect of natural zooplankton feeding on the tissue and skeletal growth of the scleractinian coral Stylophora pistillata. Coral Reefs. 22, 229–240. doi: 10.1007/s00338-003-0312-7
Gardner, T. A., Côté, I. M., Gill, J. A., Grant, A., and Watkinson, A. R. (2003). Long-term region-wide declines in Caribbean corals. Science 301, 958–960. doi: 10.1126/science.1086050
Gattuso, J.-P., Frankignoulle, M., and Smith, S. V. (1999). Measurement of community metabolism and significance in the coral reef CO2 source-sink debate. Proc. Natl. Acad. Sci. U.S.A. 96, 13017–13022. doi: 10.1073/pnas.96.23.13017
Glynn, P. W. (1993). Coral reef bleaching: ecological perspectives. Coral Reefs. 12, 1–17. doi: 10.1007/BF00303779
Harvell, D. D., Kim, K., Burkholder, J. M., Colwell, R. R., Epstein, P. R., Grimes, D. J., et al. (1999). Emerging marine diseases – climate links and anthropogenic factors. Science 285, 1505–1510. doi: 10.1126/science.285.5433.1505
Hearn, C., Atkinson, M., and Falter, J. (2001). A physical derivation of nutrient-uptake rates in coral reefs: effects of roughness and waves. Coral Reefs. 20, 347–356. doi: 10.1007/s00338-001-0185-6
Hoegh-Guldberg, O. (1999). Climate change, coral bleaching and the future of the world's coral reefs. Mar. Freshwater Res. 50, 839–866. doi: 10.1071/MF99078
Hoegh-Guldberg, O., Mumby, P. J., Hooten, A. J., Steneck, R. S., Greenfield, P., Gomez, E., et al. (2007). Coral reefs under rapid climate change and ocean acidification. Science 318, 1737–1742. doi: 10.1126/science.1152509
Hofmann, G. E., Smith, J. E., Johnson, K. S., Send, U., Levin, L. A., Micheli, F., et al. (2011). High-frequency dynamics of ocean pH: a multi-ecosystem comparison. PLoS ONE 6:e28983. doi: 10.1371/journal.pone.0028983
Holcomb, M., McCorkle, D. C., and Cohen, A. L. (2010). Long-term effects of nutrient and CO2 enrichment on the temperate coral Astrangia poculata (Ellis and Solander, 1786). J. Exp. Mar. Biol. Ecol. 386, 27–33. doi: 10.1016/j.jembe.2010.02.007
Horvath, K. M., Castillo, K. D., Armstrong, P., Westfield, I. T., Courtney, T., and Ries, J. B. (2016). Next-century ocean acidification and warming both reduce calcification rate, but only acidification alters skeletal morphology of reef-building coral Siderastrea sidereal. Sci. Rep. 6:29613. doi: 10.1038/srep29613
Hughes, T. P., Rodrigues, M. J., Bellwood, D. R., Ceccarelli, D., Hoegh-Guldberg, O., McCook, L., et al. (2007). Phase shifts, herbivory, and the resilience of coral reefs to climate change. Curr. Biol. 17, 360–365. doi: 10.1016/j.cub.2006.12.049
Jokiel, P. L., and Coles, S. L. (1990). Response of Hawaiian and other Indo-Pacific reef corals to elevated temperature. Coral Reefs. 8, 155–162. doi: 10.1007/BF00265006
Jokiel, P. L., Jury, C. P., and Rodgers, K. S. (2014). Coral-algae metabolism and diurnal changes in the CO2-carbonate system of bulk seawater. PeerJ. 2:e378. doi: 10.7717/peerj.378
Jokiel, P. L., Rodgers, K. S., Brown, E. K., Kenyon, J. C., Aeby, G., Smith, W. R., et al. (2015). Comparison of methods used to estimate coral cover in the Hawaiian Islands. PeerJ. 3:e954. doi: 10.7717/peerj.954
Jones, R. J. (2006). “Bermuda Institute of Ocean Sciences (BIOS),” in Marine Environmental Program (MEP) Annual report (2006–2007), submitted to the Bermuda Government Department of Environmental Protection, Ministry of the Environment (Hamilton), 79.
Jury, C. P., Thomas, F. I. M., Atkinson, M. J., and Toonen, R. J. (2013). Buffer capacity, ecosystem feedbacks, and seawater chemistry under global change. Water 5, 1303–1325. doi: 10.3390/w5031303
Kawahata, H., Yukino, I., and Suzuki, A. (2000). Terrestrial influences on the Shiraho fringing reef, Ishigaki Island, Japan: high carbon input relative to phosphate. Coral Reefs 19, 172–178. doi: 10.1007/s003380000093
Kayanne, H., Hata, H., Kudo, S., Yamano, H., Watanabe, A., Ikeda, Y., et al. (2005). Seasonal and bleaching-induced changes in coral reef metabolism and CO2 flux. Glob. Biogeochem. Cycles. 19:GB3015. doi: 10.1029/2004GB002400
Kleypas, J. A., Anthony, K. R. N., and Gattuso, J.-P. (2011). Coral reefs modify their seawater carbon chemistry – case study from a barrier reef (Moorea, French Polynesia). Glob. Chang. Biol. 17, 3667–3678. doi: 10.1111/j.1365-2486.2011.02530.x
Kleypas, J. A., and Yates, K. K. (2009). Coral reefs and ocean acidification. Oceanography 22, 108–117. doi: 10.5670/oceanog.2009.101
Koop, K., Booth, D., Broadbent, A., Brodie, J., Bucher, D., Capone, D., et al. (2001). ENCORE: the effect of nutrient enrichment on coral reefs: synthesis of results and conclusions. Mar. Pollut. Bull. 42, 91–120. doi: 10.1016/S0025-326X(00)00181-8
Langdon, C., and Atkinson, M. J. (2005). Effect of elevated pCO2 on photosynthesis and calcification of corals and interactions with seasonal changes in temperature/irradiance and nutrient enrichment. J. Geophys. Res. Oceans. 110:C09S07. doi: 10.1029/2004JC002576
Langdon, C., Gattuso, J.-P., and Andersson, A. (2010). “Measurements of calcification and dissolution of benthic organisms and communities,” in Guide to Best Practices for Ocean Acidification Research and Data Reporting. Luxembourg: Office for Official Publications of the European Union (Luxembourg), 213–234.
Langdon, C., Takahashi, T., Sweeney, C., Chpman, D., Goddard, J., Marubini, F., et al. (2000). Effect of calcium carbonate saturation state on the calcification rate of an experimental coral reef. Global Biogeochem. Cycles. 14, 639–654. doi: 10.1029/1999GB001195
Leclerq, N., Gattuso, J.-P., and Jaubert, J. (2000). CO2 partial pressure controls the calcification rate of a coral reef community. Glob. Chang. Biol. 6, 329–334. doi: 10.1046/j.1365-2486.2000.00315.x
Lesser, M. P., Weis, V. M., Patterson, M. R., and Jokiel, P. L. (1994). Effects of morphology and water motion on carbon delivery and productivity in the reef coral, Pocillopora demicornis (Linnaeus): diffusion barriers, inorganic carbon limitation, and biochemical plasticity. J. Exp. Mar. Biol. Ecol. 178, 153–179. doi: 10.1016/0022-0981(94)90034-5
Lewis, E., and Wallace, D. (1998). CO2SYS—Program Developed for the CO2 System Calculations. Oak Ridge: Carbon Dioxide Information and Analysis Center, Oak Ridge National Laboratory, US Department of Energy.
Lowe, R. J., Falter, J. L., Monismith, S. G., and Atkinson, M. J. (2009). A numerical study of circulation in a coastal reef-lagoon system. J. Geophys. Res. 114:C06022. doi: 10.1029/2008JC005081
Manzello, D. P., Enochs, I. C., Bruckner, A., Renaud, P., Kolodziej, G., Budd, D. A., et al. (2014). Galápagos coral reef persistence after ENSO warming across an acidification gradient. Geophys. Res. Lett. 41, 9001–9008. doi: 10.1002/2014GL062501
Marshall, A. T., and Clode, P. (2004). Calcification rate and the effect of temperature in a zooxanthellate and an azooxanthellate scleractinian reef coral. Coral Reefs. 23, 218–224. doi: 10.1007/s00338-004-0369-y
Marubini, F., Ferrier-Pagès, C., and Cuif, J.-P. (2003). Suppression of skeletal growth in scleractinion corals by decreasing ambient carbonate-ion concentration: a cross-family comparison. Proc. Soc. R. B. 270, 79–184. doi: 10.1098/rspb.2002.2212
Massaro, R. F. S., De Carlo, E. H., Drupp, P., Mackenzie, F. T., Maenner-Jones, S., Fagan, K. E., et al. (2012). Multiple factors driving variability in the exchange of CO2 between the ocean and atmosphere in a tropical coral reef environment. Aquatic Geochem. 18, 357–386. doi: 10.1007/s10498-012-9170-7
Mehrbach, C., Culberson, C. H., Hawley, J. E., and Pytkowicx, R. M. (1973). Measurement of the apparent dissociation constants of carbonic acid in seawater at atmospheric pressure. Limnol. Oceanogr. 18, 897–907. doi: 10.4319/lo.1973.18.6.0897
Moberg, F., and Folke, C. (1999). Ecological goods and services of coral reef ecosystems. Ecol. Econ. 29, 215–233. doi: 10.1016/S0921-8009(99)00009-9
Mumby, P. J., and van Woesik, R. (2014). Consequences of ecological, evolutionary and biogeochemical uncertainty for coral reef responses to climatic stress. Curr. Biol. 24, R413–R423. doi: 10.1016/j.cub.2014.04.029
Ohde, S., and Hossain, M. M. M. (2004). Effect of CaCO3 (aragonite) saturation state of seawater on calcification of Porites coral. Geochem. J. 38, 613–621. doi: 10.2343/geochemj.38.613
Page, H. N., Andersson, A. J., Jokiel, P. L., Rodgers, K. S., Lebrato, M., Yeakel, K., et al. (2016). Differential modification of seawater carbonate chemistry by major coral reef benthic communities. Coral Reefs. 35, 1311–1325. doi: 10.1007/s00338-016-1490-4
R Development Core Team (2008). R: A Language and Environment for Statistical Computing. Vienna: R Foundation for Statistical Computing. Available online at: http://www.R-project.org
Rinkevich, B., and Loya, Y. (1985). Intraspecific competition in a reef coral: effects on growth and reproduction. Oecologia 66, 100–105. doi: 10.1007/BF00378559
Rodgers, K. S., Jokiel, P. L., Brown, E. K., Hau, S., and Sparks, R. (2015). Over a decade of change in spatial and temporal dynamics of Hawaiian coral reef communities. Pac. Sci. 69, 1–13. doi: 10.2984/69.1.1
Shashar, N., Kinane, S., Jokiel, P. L., and Patterson, M. R. (1996). Hydromechanical boundary layers over a coral reef. J. Exp. Mar. Biol. Ecol. 199, 17–28. doi: 10.1016/0022-0981(95)00156-5
Shaw, E. C., Hamylton, S. M., and Phinn, S. R. (2016). Incorporating benthic community changes into hydrochemical-based projections of coral reef calcium carbonate production under ocean acidification. Coral Reefs. 35, 739–750. doi: 10.1007/s00338-016-1407-2
Shaw, E. C., McNeil, B. I., and Tilbrook, B. (2012). Impacts of ocean acidification in naturally variable coral reef flat ecosystems. J. Geophys. Res. Oceans. 117:C03038. doi: 10.1029/2011JC007655
Silverman, J., Lazar, B., Cao, L., Caldeira, K., and Erez, J. (2009). Coral reefs may start dissolving when atmospheric CO2 doubles. Geophys. Res. Lett. 36:L05606. doi: 10.1029/2008GL036282
Smith, J. E., Price, N. N., Nelson, C. E., and Haas, A. F. (2013). Coupled changes in oxygen concentration and pH caused by metabolism of benthic coral reef organisms. Mar Biol. 160, 2437–2447. doi: 10.1007/s00227-013-2239-z
Smith, S. V., Jokiel, P. L., Key, G. S., and Guinther, E. B. (1977). Metablic Responses of Shallow Tropical Benthic Microcosm Communities to Perturbation. Environmental Protection Agency, Narragansett, Rhode Island. Final report of contract R800906. 110 pp.
Sutton, A. J., Sabine, C. L., Maenner-Jones, S., Lawrence-Slavas, N., Meinig, C., Feely, R. A., et al. (2014). A high-frequency atmospheric and seawater pCO2 data set from 14 open-ocean sites using a moored autonomous system. Earth Syst. Sci. Data 6, 353–366. doi: 10.5194/essd-6-353-2014
Suzuki, A., and Kawahata, H. (2003). Carbon budget of coral reef systems: an overview of observations in fringing reefs, barrier reefs and atolls in the Indo-Pacific regions. Tellus B. 55, 428–444. doi: 10.1034/j.1600-0889.2003.01442.x
Szmant, A. M. (2002). Nutrient enrichment on coral reefs: is it a major cause of coral reef decline? Estuaries 25, 743–766. doi: 10.1007/bf02804903
Tanner, J. E. (1995). Competition between scleractinian corals and macroalgae: an experimental investigation of coral growth, survival and reproduction. J. Exp. Mar. Biol. Ecol. 190, 151–168. doi: 10.1016/0022-0981(95)00027-O
Tanner, J. E. (1997). Intraspecific competition reduces fitness in scleractinian corals. J. Exp. Mar. Biol. Ecol. 214, 19–34. doi: 10.1016/S0022-0981(97)00024-5
Vandermeulen, J. H., Davis, N. D., and Muscatine, L. (1972). The effect of inhibitors of photosynthesis on zooxanthellae in corals and other marine invertebrates. Mar Biol. 16, 185–191.
Venti, A., Kadko, D., Andersson, A. J., Langdon, C., and Bates, N. R. (2012). A multi-tracer model approach to estimate reef water residence times. Limnol. Oceanogr. Methods. 10, 1078–1095. doi: 10.4319/lom.2012.10.1078
Keywords: coral reef, metabolism, carbon chemistry, ocean acidification, coral cover
Citation: Page HN, Courtney TA, Collins A, De Carlo EH and Andersson AJ (2017) Net Community Metabolism and Seawater Carbonate Chemistry Scale Non-intuitively with Coral Cover. Front. Mar. Sci. 4:161. doi: 10.3389/fmars.2017.00161
Received: 15 January 2017; Accepted: 12 May 2017;
Published: 30 May 2017.
Edited by:
Hajime Kayanne, University of Tokyo, JapanReviewed by:
Atsushi Watanabe, Tokyo Institute of Technology, JapanEmma Camp, University of Technology, Sydney, Australia
Copyright © 2017 Page, Courtney, Collins, De Carlo and Andersson. This is an open-access article distributed under the terms of the Creative Commons Attribution License (CC BY). The use, distribution or reproduction in other forums is permitted, provided the original author(s) or licensor are credited and that the original publication in this journal is cited, in accordance with accepted academic practice. No use, distribution or reproduction is permitted which does not comply with these terms.
*Correspondence: Heather N. Page, hnpage@ucsd.edu