Plastic Debris Occurrence, Convergence Areas and Fin Whales Feeding Ground in the Mediterranean Marine Protected Area Pelagos Sanctuary: A Modeling Approach
 Maria Cristina Fossi1
  Teresa Romeo2
  Matteo Baini1
  Cristina Panti1*
  Letizia Marsili1
  Tommaso Campani1
  Simonepietro Canese2
  François Galgani3 Jean-Noël Druon4
  Sabina Airoldi5
  Stefano Taddei6
  Maria Fattorini6,7
  Carlo Brandini6,7
  Chiara Lapucci6,7
- 1Department of Physical, Earth and Environmental Sciences, University of Siena, Siena, Italy
- 2Laboratory of Milazzo, ISPRA, Institute for Environmental Protection and Research, Milazzo, Italy
- 3IFREMER, French Research Institute for Exploitation of the Sea, Immeuble Agostini, Corsica, France
- 4Unit D.02 Water and Marine Resources, European Commission, Joint Research Centre, Directorate D – Sustainable Resources, Ispra, Italy
- 5Thetys Research Institute, Milan, Italy
- 6LaMMA Consortium, Florence, Italy
- 7Institute of BioMeteorology, National Council of Research (CNR), Florence, Italy
The Mediterranean Sea is greatly affected by marine litter. In this area, research on the impact of plastic debris (including microplastics) on biota, particularly large filter-feeding species such as the fin whale (Balaenoptera physalus), is still in its infancy. We investigated the possible overlap between microplastic, mesoplastic and macrolitter accumulation areas and the fin whale feeding grounds in in a pelagic Specially Protected Area of Mediterranean Importance (SPAMI): the Pelagos Sanctuary. Models of ocean circulation and fin whale potential habitat were merged to compare marine litter accumulation with the presence of whales. Additionally, field data on microplastics, mesoplastics, and macrolitter abundance and cetacean presence were simultaneously collected. The resulting data were compared, as a multi-layer, with the simulated distribution of plastic concentration and the whale habitat model. These data showed a high occurrence of microplastics (mean: 0.082 items/m2, STD ± 0.079 items/m2) spatial distribution agreed with our modeling results. Areas with high microplastic density significantly overlapped with areas of high macroplastic density. The most abundant polymer detected in all the sampling sites was polyethylene (PE), suggesting fragmentation of larger packaging items as the primary source. To our knowledge, this is the first study in the Pelagos Sanctuary in which the simulated microplastic distribution has been confirmed by field observations. The overlap between the fin whale feeding habitat and the microplastic hot spots is an important contribution for risk assessment of fin whale exposure to microplastics.
Introduction
In the Mediterranean Sea, marine litter has recently been confirmed as a critical issue (Eriksen et al., 2014; Cózar et al., 2015; UNEP/MAP, 2015; Suaria et al., 2016). The highest fraction (~80%) of marine litter comprises plastic, particularly small sized plastic. This is exacerbated by the basin's limited water exchanges as well as by the presence of densely populated and trafficked coastal areas. An increasing number of studies have investigated the interactions of marine fauna with marine debris in the Mediterranean basin, covering a vast array of species affected by marine litter, such as invertebrates, fish, reptiles and birds (Campani et al., 2013; Codina-García et al., 2013; Deudero and Alomar, 2015; Romeo et al., 2015; Alomar et al., 2016). On the other hand, research on the impact of microplastics (plastic fragments smaller than 5 mm) and mesoplastics (plastic fragments smaller than 25 mm) on large filter-feeding species such fin whale (Balaenoptera physalus) is a largely unexplored topic.
Fin whale is the only resident mysticete in the Mediterranean and aggregates during the summer in the feeding grounds of the north-western Mediterranean Sea (Panigada et al., 2011; Druon et al., 2012). Fin whales potentially ingest microplastics during their feeding activity and might undergo the accumulation of plastic additives in their tissues, leached by plastic particles ingested (Fossi et al., 2012). The same authors investigated the interaction between free-ranging fin whales and microplastics by comparing populations living in two semi-enclosed basins, the Mediterranean Sea and the Gulf of California (Mexico) (Fossi et al., 2016). In these studies, high concentrations of microplastics and plastic additives (phthalates) were detected in neustonic samples collected in the Pelagos Sanctuary for Mediterranean Marine Mammals (hereafter Pelagos Sanctuary). Pelagos Sanctuary is the only pelagic Marine Protected Area in the Mediterranean Sea, designated as one of the Specially Protected Areas of Mediterranean Importance (SPAMI). This marine area, located in the north-western Mediterranean Sea, is characterized by high offshore productive frontal features that attract a variety of large marine vertebrates including eight cetacean species (Coll et al., 2012). This exceptional biodiversity coexists with high human pressure (Fossi et al., 2013; Pinzone et al., 2015), including plastic pollution (Collignon et al., 2012; Fossi et al., 2012; Cózar et al., 2015).
Using observations and models, a number of authors have reported the existence of five large-scale accumulation regions of floating plastic debris in the oceans corresponding to each of the subtropical gyres located on either side of the Equator (Cózar et al., 2014; Eriksen et al., 2014; Law et al., 2014; van Sebille et al., 2015). As for the Mediterranean sea, the average concentration found is comparable to the high values found in subtropical gyres (Cózar et al., 2015; Suaria et al., 2016). This high concentration is in part explainable considering the retention of floating debris facilitated by a limited surface outflow toward the Atlantic ocean (Lebreton et al., 2012). Moreover, within the Mediterranean, there is a marked variability of hydrodynamic circulation features, mainly induced by a strongly variable atmospheric forcing that can also lead to particularly high concentrations corresponding to specific structures, such as fronts and eddies (Zambianchi et al., 2014).
Marine litter drift in the Mediterranean was simulated at a climatological level by ocean circulation models with the main objective of determining the possible existence of permanent, or at least long-term, accumulation areas. Long-term accumulation areas of marine litter in the Mediterranean were not found (Mansui et al., 2015), although floating items may be retained and eventually redistributed by meso-scale structures in a timescale of a few weeks or months. These long-term simulations can be used to derive general trends of marine litter distribution on climatological time scales (years or decades), although such model data are not directly comparable to observations, since the distribution derived from field surveys is limited to short specific periods.
In addition, the dynamics of fronts and gyres are complex and are associated with convergence and divergence areas, in which floating items such as microplastics tend to concentrate. Moreover, the dynamics of mesoscale oceanic features, which generate upwelling (divergence) and downwelling (convergence), are likely to drive both the concentration of floating particles and the presence of favorable feeding habitats for several species, including fin whales (D'Amico et al., 2003), as the spatial and temporal scales of the distribution of these feeding habitats are connected to the variability of combined biogeochemical/hydrodynamical covariates distributed over the area.
Since plastic particles are not uniformly distributed in the Mediterranean Sea, like elsewhere, the possible overlap between plastic debris accumulation areas and charismatic mega-fauna feeding grounds, is a challenging research task. Data from hydrodynamic models and field observation are needed to define accumulation areas of plastic fragments and to assess the risk of exposure of Mediterranean fauna.
In this paper, we present the results of the Plastic Pelagos survey aimed to investigate, using a multi-layer multidisciplinary approach, whether the fin whale feeding grounds and the areas of high floating plastic debris concentration can overlap and create critical conditions for fin whales exposed to plastic in the Pelagos Sanctuary. For this reason, data on microplastics, mesoplastic, macrolitter distribution, cetacean sightings and whale preferred feeding habitat in the north-western Mediterranean Sea were merged.
The novelty of the approach was the use of a sub-seasonal (≈15–30 days) timescale, instead of a climatological one, where models and field data have similar time-scales of variability, which allowed an evaluation of the risk to marine organisms living in the area.
Methods
Plastic Pelagos Survey and Sampling
The Plastic Pelagos survey was carried out for 10 days (8–18 September 2014) with the Research Vessel ASTREA (ISPRA) across the whole Pelagos Sanctuary. The research cruise was planned for several research activities, such as: (a) microplastic and mesoplastic sampling in potential accumulation areas identified by ocean models and satellite data, (b) macroplastics survey and (c) cetacean survey (in particular fin whales). The experimental design and the selection of the sampling sites was determined using the hydrodynamic forecast produced by LaMMA (http://www.lamma.rete.toscana.it/en/currents-lamma-roms-model), satellite data (SST, chlorophyll-a and altimetry), and the operational model of fin whale potential habitat (Druon et al., 2012). During the Plastic Pelagos survey, a total of 967 nautical miles were traveled, 21 zooplankton/microplastic samples were collected, (Figure 1SM) and, simultaneously, 78 miles were monitored for marine litter.
Sampling of Microplastics
All zooplankton-neustonic/microplastic samples were collected during daylight hours and under calm weather and sea conditions. The samples were collected with a High Speed Manta Trawl (mouth opening: 25 × 50 cm; 330 μm mesh size) equipped with a flow meter to measure the volume of filtered water. The GPS coordinates were noted at the beginning and the end of the sampling station. The net was towed horizontally in surface waters at a speed of approximately 3–4 knots for 30 min. The net was washed on board, to collect particles and zooplankton and to avoid contamination, and the resulting materials preserved in a 4% formaldehyde-seawater buffered solution for subsequent analyses of plastic particles and further analysis of zooplankton.
Counting and Characterization of Microplastics and Mesoplastics
For the analysis of plastic particles, the samples were observed under a stereomicroscope Stereo Zoom NBS (mod. NBS-STMDLX-T) with a LED light and micrometer ocular lens. During the laboratory procedure, care was taken to prevent airborne contamination of samples by performing sample analysis in a clean air flow room. Each plastic particle was characterized and classified by: (a) color: white, black, red, blue, transparent, green, other color and (b) size: ≤ 0.5; 0.51–1.0; 1.01–2.5, 2.51–5.0 mm for microplastics and 5.01–25 mm for mesoplastics. The microplastics and mesoplastics were also isolated, dried at 60°C for 24 h and weighed on a petri dish. The weight was measured at least three times until a stable value was obtained.
Micro and mesoplastics collected with the manta trawl (number of items and weight) were normalized to the total water surface filtered and expressed as items/m2 and mg/m2. All data were corrected according to weather and sea conditions considering the possible “wind stress” effect, considering the wind speed (m/s) and wave height (m) applying the correction factors adopted by Kooi et al. (2016) and Kukulka et al. (2012).
Polymer Identification: Fourier Transform Infrared Spectroscopy
Plastic polymers were identified using the Fourier Transform Infrared (FT-IR) spectroscopy technique (Hummel, 2002) in 10% of the total microplastic items and 50% of mesoplastic items detected in each sampling site. For each plastic fragment, depending on its heterogeneity (including degradation status and fouling presence), three measurements were carried out. The samples were compressed in a diamond anvil compression cell and infrared spectra were acquired using an Agilent Cary 630 FTIR spectrophotometer. Spectra were collected in transmission mode in 16 scans, with a resolution of 4 cm−1. Agilent Micro Lab FTIR software was used for output spectra elaboration. For the identification of polymers, a similarity algorithm was used searching in three different Agilent polymer spectral databases, followed by a visual analysis comparison of characteristic bands in the reference spectrum. Only spectra matching more than 80% with reference polymers were accepted; this minimum hit quality is greater than the one adopted by Lusher (Lusher et al., 2013).
Quantification and Monitoring of Floating Macrolitter
During the Plastic Pelagos survey, for the first time in the Mediterranean Sea, a monitoring of floating macrolitter (items larger than 2.5 cm) was simultaneously carried out with the microplastic and mesoplastic sampling. The methodology used for the quantification and monitoring of floating marine debris was visual observation from the vessel. The protocol is based on the experience acquired from the National Oceanic and Atmospheric Administration (NOAA) in previous studies on floating marine litter that includes the computation of density of marine litter within the transect area (Arthur et al., 2009). The classification system used is consistent with the one reported in Descriptor 10 of the European Marine Strategy Framework Directive (MSFD Technical Subgroup on Marine Litter, 2013). The observations were made from the bow of the boat and only in optimum sea and weather conditions (calm seas and good visibility). Only floating litter observed without binocular within 20 meters from the boat was taken into account. Observers were changed every 30 min to avoid fatigue. The data were then processed in terms of quantity, size and quality. The density of macrolitter was calculated using the formula (Hinojosa and Thiel, 2009): D = N/(W × L); where N is the number of observed plastic debris, W is the maximum distance (0.02 km in the present study) perpendicular to the transect and L is the total length (in km) of the transect.
Statistical Analysis
The plastic data set was processed using non-parametric tests. The normality of the data was checked by a Pearson omnibus normality test. The non-parametric Kruskal-Wallis analysis of variance was used. Correlation between micro-, meso-, and macroplastics was performed with the Spearman correlation (p < 0.05). All the statistical analyses were conducted using STATISTICA 10 (StartSoft) software.
Cetacean Survey
The vessel tracks were not designed to obtain an even coverage of the study area but rather to maximize the encounter rate with whales (based on previous experience and modeling information). During the searching effort, two observers were positioned, one at each side of the vessel, scanning the sea surface looking for cetaceans using 7 × 50 magnification binoculars equipped with a compass. Observations were made preferentially in favorable conditions, i.e., with daylight and good visibility and sea state ≤ 3 Beaufort. The sea state was recorded every 60 min, or more frequently if changes in conditions occurred (Panigada et al., 2005). The transect was interrupted once a cetacean was located for further approach to record geographic position, movements, group size, behavior, and to assess the presence or absence of calves and sub-adults. The species of interest in the project was the fin whale (B. physalus) (details on the species in Supplementary Material). Stenella coeruleolba, Tursiops truncatus and Grampus griseus were also investigated during the cruise (see Figure 2SM).
Model of Potential Fin Whale Habitat
The chosen modeling approach of potential fin whale habitat relies on the niche theory, which links environmental with ecological processes to select a limited set of predictors and improve model interpretability. The potential feeding habitat of fin whales (Druon et al., 2012) (FHO - Feeding Habitat Occurrence), was mainly traced by the occurrence of productive oceanic fronts which are perceived as features sufficiently stable to sustain zooplankton production. By relating the proximity of over 10 years of fin whale sighting locations (n = 1,451) in the Western Mediterranean Sea to concurrent remotely sensed oceanic fronts of chlorophyll-a, the habitat model is able to efficiently detect and map the fin whale's preferred feeding habitat on a daily time scale.
Compared with habitat modeling (Druon et al., 2012) the favorable feeding habitat was identified here by sea surface chlorophyll-a (Chl-a) fronts only and not in combination with satellite-derived SST fronts. Indeed, infrared data was found to be more unstable from day-to-day than optical data (Chl-a). Overall, the potential feeding habitat was derived on a daily basis using a) the productive frontal features (Chl-a fronts), b) a preferred range of surface Chl-a concentration and c) a minimum water depth. The optimized set of parameters that was used to define the fin whale's preferred habitat had the following values (using Chl-a data from the MODIS-Aqua sensor): linear increase of daily habitat value from 0.3 to 1 in the range of Chl-a horizontal gradient from 0.00086 to 0.0052 mgChl-a.m−3.km−1, and 1 above the latter value,- 0.11 < Chl-a concentration <0.50 mg.m−3- water depth > 90 m.
Ocean Circulation Model and Satellite Data
In the period of the sampling cruise (September 2014), the circulation in the North Tyrrhenian and Ligurian Sea was deduced by a joint analysis of satellite and modeling data: sea level anomaly (SLA), absolute dynamic topography (ADT), sea surface temperature (SST), chlorophyll a concentration (Chl-a), and hydrodynamic models at both basin scale (re-analysis of the Copernicus Marine Environment Monitoring Service, CMEMS) and at regional scale (Tyrreno-ROMS).
The Tyrreno-ROMS model is a regional implementation of the Regional Ocean Modelling System (ROMS) currently operational at the LaMMA consortium for ocean forecast. The model is implemented in a domain covering the Tyrrhenian Sea, the Ligurian Sea, and the western portion of the Mediterranean Sea to the east of the Gulf of Lyon, with a horizontal resolution of 2 km. ROMS has a generalized vertical, terrain-following, coordinate system (Shchepetkin and McWilliams, 2005), so-called s-coordinates, in our case implemented through 30 s-levels. Initial and boundary conditions are taken from the CMEMS. Turbulent fluxes on the ocean/atmosphere interface, estimated by the bulk flux formulation (Fairall et al., 1996), are derived from an implementation of the WRF-ARW (Weather Research and Forecasting-Advanced Research) model over the central Mediterranean area at 3 km resolution and using European Center Medium Weather Forecast (ECMWF) data as initial and boundary conditions. Regarding satellite data, weekly updated delayed maps of sea level anomaly (SLA), Ssalto/Duacs altimeter products, mean dynamic topography (MDT), and the resulting absolute dynamic topography (ADT) maps (Iacono et al., 2013) were selected and distributed by the CMEMS. As for SST, the CMEMS sea surface temperature nominal operational product for the Mediterranean Sea, daily gap-free maps (L4) at 1 km horizontal resolution (Buongiorno Nardelli et al., 2013) were chosen. Chl-a concentrations were estimated by the OC5 algorithm (Gohin et al., 2002) on NASA MODIS AQUA reflectances, 1 km space resolution, as this algorithm presents intrinsic robustness in the waters of the Ligurian and North Tyrrhenian Seas (Lapucci et al., 2012; more details in Supplementary Material).
Modeling Marine Litter Distribution
The marine litter transport at the sea surface has been modeled using virtual particles, advected as Lagrangian tracers in our numerical circulation model. To identify areas where floating particles can be concentrated, the tendency to accumulation/dispersion from homogenous initial conditions can be estimated through the parameter
where Ct is the dimensionless concentration of floating debris at time t, N0 is the number of simulated floating particles in an area equal to the size of the model resolution at the initial time (in our case, in open sea conditions, 102 uniformly distributed particles for each square element), and Nt is the number of floating particles in the same element area at time t. This is motivated by the lack of global information describing the distribution of floating debris (Mansui et al., 2015).
We simulated the hydrodynamic conditions for the entire period of the survey by using the Tyrreno-ROMS regional model, initialized every day with the CMEMS analysis data. Every simulation obtained by the regional hydrodynamic model was stopped after 15 days because of the progressive decay of its reliability after 1–2 weeks of simulation. Hydrodynamic simulations started 15 days before the beginning of the survey, and were performed up to 15 days after the end, so that a total of 40 simulations have been realized. At the beginning of each simulation, an uniform release of particles in the study area, by using the virtual Lagrangian floats available in ROMS, was performed in order to simulate the 15-days evolution of floating items.
Due to the uncertainties in the hydrodynamic fields, instantaneous concentrations computed with the present method may be progressively unreliable with increasing simulation time. At the same time, the concentration of a passive tracer (such as floating debris) at the mesoscale depends on previous hydrodynamic history, and too short of a simulation time does not allow particles to concentrate or to disperse on significant hydrodynamic structures such as fronts and gyres. Therefore, to calculate the value of the dimensionless concentration, or relative density, Ct, best correlated with observations, we made averages of Ct corresponding to different model simulations. Each averaged concentration is estimated from instantaneous concentrations, as for instance the mean value < C3 > is obtained with the instantaneous values C3, computed after 3 days of each different simulation, taken over different time periods of 48, 144, and 336 h centered at the time of observation. As a consequence, the accumulation/dispersion of the plastic particles was assumed to be due to hydrodynamic structures that have a persistence longer than 1 day. This average was centered to consider possible uncertainty in the presence of the hydrodynamical structures over time. In fact, we see that a time shift of the position of the averaging window does not significantly change our results.
Statistical correlations between observed surface microplastic concentration and both the instantaneous Ct and the mean values <Ct> were computed. Considering only instantaneous concentrations, this comparison showed a progressive decrease of correlation with increasing simulation time. On the contrary, <Ct> show a much stronger correlation.
Results
During the Plastic Pelagos survey, floating marine litter (micro-,meso- and macroplastic) sampling and cetacean survey were conducted to verify the possible overlap between the marine litter accumulation areas and preferred fin whale feeding ground identified by regional hydrodynamic circulation and fin whale potential habitat models, in the Pelagos Sanctuary. This multi-layer approach (models and field data sets) allowed identifying areas of higher risk of exposure to plastic ingestion for fin whale and other cetacean species in the SPAMI.
Microplastics Abundance, Characterization and Spatial Distribution
Data revealed a high occurrence of microplastics (mean: 0.082 items/m2, STD ± 0.079 items/m2) (Figure 1A) in the investigated surface neustonic/planktonic samples. The samples collected close to Genoa harbor (PP5, PP6) and in the proximity of Capraia Island (PP11) (Figure 1A), showed the highest values of the whole dataset. The average concentration of plastic particles is similar to the one previously shown by other authors in the Pelagos Sanctuary (Collignon et al., 2012; Fossi et al., 2016). These data are consistent and slightly higher than those measured in the Mediterranean Sea by Faure and collaborators in 2015. The Tuscan Archipelago area (Capraia Island) was also found to be one of the site with highest concentration values and weight of microplastics, as also recently highlighted (Suaria et al., 2016).
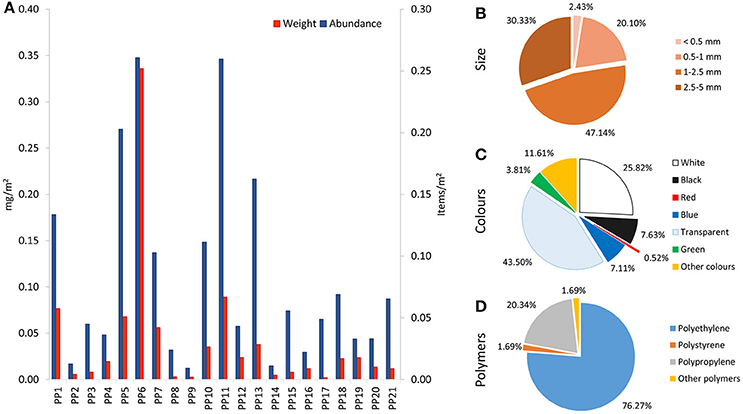
Figure 1. Microplastic abundance and characterization in the Pelagos Sanctuary. (A) Microplastic abundance (items/m2) and weight (mg/m2) in the different sampling sites; (B) microplastic size; (C) microplastic color; (D) microplastic polymers.
Microplastic size analysis is in line with (Panti et al., 2015) with 47% of microplastics in the size range between 1 and 2.5 mm (Figure 1B). Characterization in terms of color and dimension in the different sampling sites is reported in Figure 1C. Fragment is the most frequent shape and transparent and white the predominant colors. A more detailed analysis was performed on the 10% of the total microplastics isolated during the analytical procedure. The most abundant polymer detected in all of the sampling site was polyethylene (PE), suggesting the potential origin of the microplastic analyzed by fragmentation of packaging items (Plastics Europe, 2015). PE and polypropylene (PP) represent 76 and 20% of the total plastic polymers measured, respectively (Figure 1D).
Mesoplastics Abundance, Characterization and Spatial Distribution
Mesoplastics were present in 19 out of the 21 samples, ranging from 0 to 0.037 items/m2, (mean: 0.0126 items/m2, STD ± 0.0118 items/m2) (Figure 2A). The data are in the same order of magnitude as found by Faure and collaborators in 2015, where the maximum value is 0.021 items/m2. Transparent was the predominant color (Figure 2B). The polymer analysis was performed on 50% of the total mesoplastics isolated during the analytical procedure. Similarly to microplastics, PE and PP were also the most abundant polymers for this size class (Figure 2C).
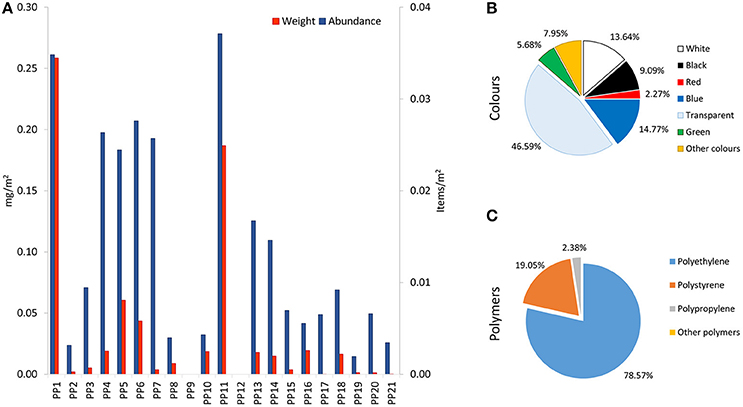
Figure 2. Mesoplastic abundance and characterization in the Pelagos Sanctuary. (A) Mesoplastic abundance (items/m2) and weight (mg/m2) in the different sampling sites; (B) mesoplastic color; (C) mesoplastic polymers.
Microliter Abundance, Characterization and Spatial Distribution
Simultaneously with manta trawl sampling, a survey of floating macrolitter was carried out, for the first time in the Mediterranean Sea (Figure 3) in order to explore the correlation between these two data. The analysis was performed on the total floating macrolitter, considering all objects defined as marine litter according to NOAA. A more specific analysis was made on plastic objects (macroplastics), which represent 83.5% of total floating litter composed mainly by fragments of larger plastic items, bottles/packaging items and fishing gears. Seventy-eight miles were monitored during the cruise for a total of 1.6 km2 (Figure 3) with an average value of 175.24 macroplastics/km2. Again, the areas close to the Genoa harbor and in proximity to the Capraia Island showed the highest values for macroplastics, confirming both areas as hot spots for plastic debris in the Pelagos Sanctuary. In a similar survey across the Mediterranean Sea, Suaria and Aliani (Suaria and Aliani, 2014) found a lower mean value of floating debris (6.9 items/km2) with a maximum value of 194.6 items/km2. Finally, in the investigated areas of the Pelagos Sanctuary, a significant correlation between micro-, meso- and macroplastic debris was found (Figure 4).
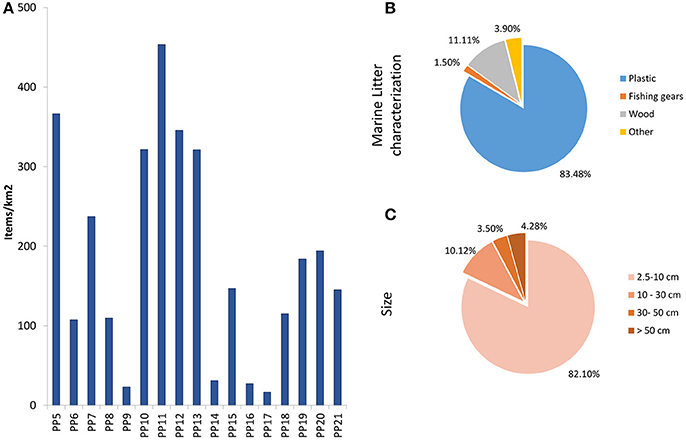
Figure 3. Macrolitter abundance and characterization in the Pelagos Sanctuary. (A) macrolitter abundance in the different samplig sites (items/Km2); (B) macrolitter characterization; (C) macrolitter size.
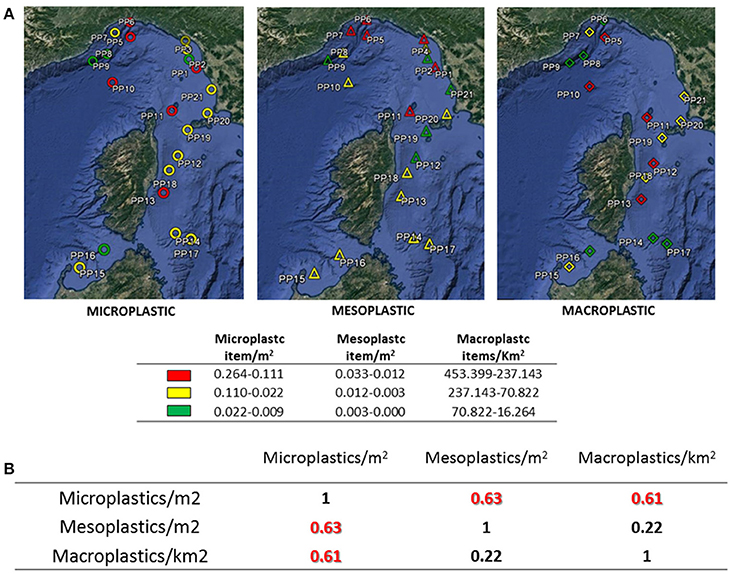
Figure 4. Spatial distribution of microplastics, mesoplastics and macroplastics in the Pelagos Sanctuary during the Plastic Pelagos survey. (A) The different colors of the sampling sites represent the relative concentration of items/m2 (microplastics and mesoplastics) and items/km2 (macroplastics). Red symbols are values ≥75th percentile; yellow are values <75th and ≥25th percentile; green are values <25th percentile; map produced using the Google Earth version 7.1.5.1557 open source software; (B) Correlation between micro-, meso-, and macroplastic in the Pelagos Sanctuary.
Cetacean Survey
Four different cetacean species were identified during the sampling cruise (Bp = B. physalus, Sc = S. coeruleolba, Tt = T. truncatus, Gg = G. griseus) in the Pelagos Sanctuary with a total of 14 sightings and 44 specimens. The respective sighting sites and numbers of individuals are reported in Table 1 and in Figure S2.
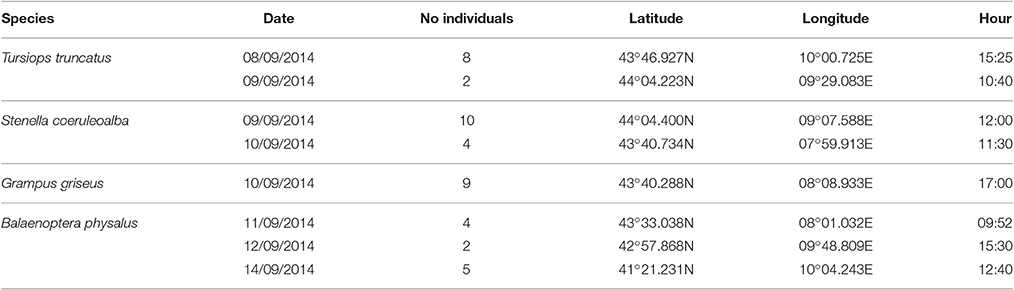
Table 1. Cetaceans sightings in the Pelagos Sanctuary during the Plastic Pelagos survey.
Ocean Circulation in the Pelagos Area During the Survey
In general, ocean circulation in the Pelagos area appears to be associated with a prevailing transport from South to North. This dominant circulation feature is in turn modulated by intense mesoscale activity characterized by ocean eddies (cyclonic and anticyclonic), meandering currents and fronts. The spatial and temporal resolution of the Tyrreno-ROMS allows the simulation of all such phenomena. Along the western and eastern Corsica coast two branches of ascending currents (Eastern and Western Corsica currents) converge and give a fundamental contribution to generation of the North Mediterranean current (Figure 5A). The Mean Kinetic Energy (MKE) has been used as a proxy for the velocity field (Figure 6B) in order to highlight the main circulation (Mansui et al., 2015). The currents generating the North Mediterranean current are associated with a wide cyclonic area with a counter current to the East, which generates a considerable negative sea level anomaly as well as relatively low SST levels and a high level of Chl-a. The satellite observations reported in Figure 5B of MADT, SST and Chl-a, for August 24th 2014, supports the presence of hydrodynamic structures in accordance with the circulation model results. The mesoscale anticyclonic eddy structure located around Capraia Island (Structure A in Figure 5A) is outlined by the regional Tyrreno-ROMS model and confirmed by satellite data, showing a relative maximum of MADT, typical of downwelling dynamics.
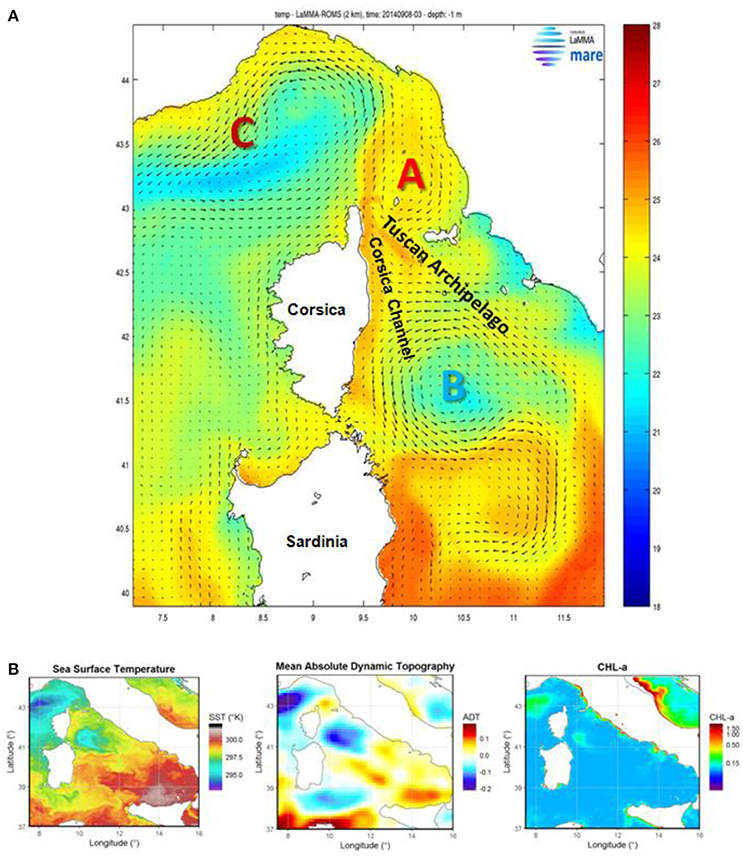
Figure 5. Relevant hydrodynamic structures in the Pelagos Sanctuary area. (A) Anticyclonic circulation of the “Capraia Gyre” (Structure A), Northern Tyrrhenian Cyclone (Structure B), Ligurian current (Structure C); map produced using the Matlab Release 14 software; (B) SST, MADT, and Chla maps, 28th August 2014; maps produced using the IDL 5.6 with Rgdal R package version 1.1-3 software, and the SeaDAS 7.2 26 and R library 27 open-source software.
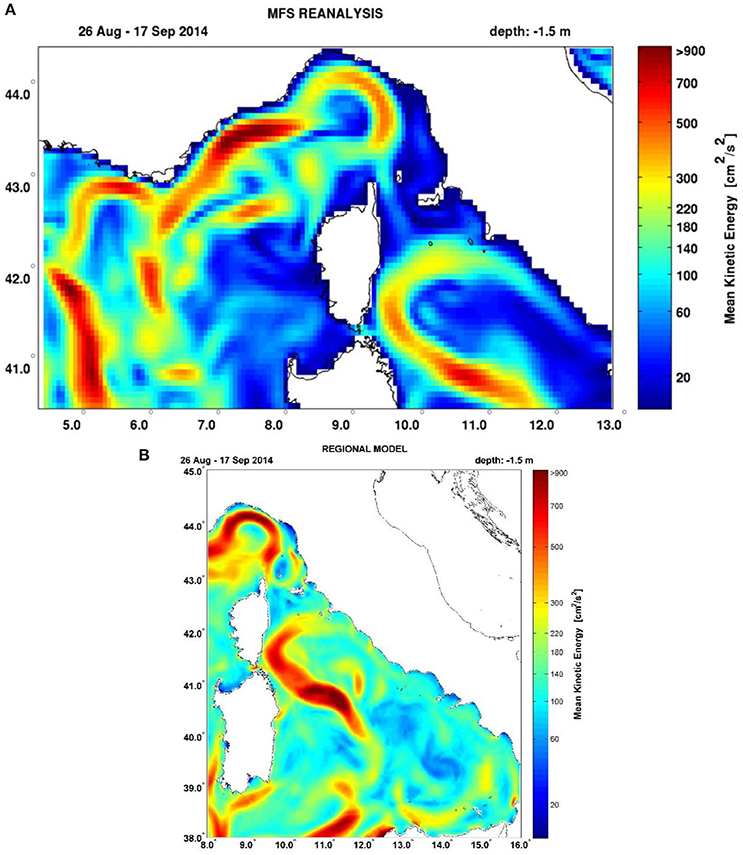
Figure 6. Ocean circulation model and satellite data. (A) Mean Kinetic Energy (MKE) distribution from CMEMS, for the period 26 August-17 September 2014, which highlights the most energetic circulation patterns; (B) Mean MKE result from the Tyrreno-ROMS circulation model for the same period. Major differences between the Mediterranean CMEMS and the Tyrreno-ROMS model consist in improved representation of small scale hydrodynamic features.
This “Capraia gyre,” as a potential accumulation area of marine debris, was already observed (Schroeder et al., 2011), although it is still not completely characterized in its seasonal variability. The well-marked cyclonic gyre in the northern Tyrrhenian Sea (Structure B in Figure 5A), or northern Tyrrhenian gyre (Artale et al., 1994), is also shown on satellite data through relative minimum levels of SSTs, relative maximum levels of MADT, and higher Chl-a levels at the center of the gyre, possibly due to the upwelling associated with cyclonic dynamics.
Comparison between Microplastic Field and Model Data
To compare model data with in situ measurements, we computed the statistical correlation between the observed surface microplastic concentration and the simulated values of the relative density parameter Ct (or its mean values <Ct>). This comparison showed: (a) a progressive decrease of correlation of instantaneous values Ct from 3 to 15 days that is likely due to the reliability decay in the regional hydrodynamic model for increasing simulation times (Table 2); and (b) a significant increase of correlation of mean values <Ct>, with t ranging from 3 to 15 days and using time windows of 144 and 366 h, as shown in Table 3.
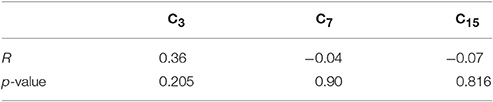
Table 2. Correlations obtained by using instantaneous values Ct of model concentrations.
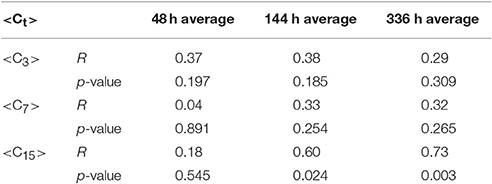
Table 3. Correlations obtained by using mean values <Ct> of model concentrations.
Taking an appropriate average of instantaneous value, the simulation results confirm that concentration levels are strongly dependent on the hydrodynamic history. The mean values <Ct>, computed over the different time windows, can be utilized as a tool to highlight the persistence of hydrodynamic structures that may have contributed accumulating or dispersing the floating particles in a given area.
The strong statistical correlation (Table 3) between the field data and the mean relative density, <Ct>, computed by the regional model, allows to convert the dimensionless concentration into physical concentrations expressed in terms of standard units (e.g., items/m2). A bias and a factor for unit conversion were estimated using a linear fit between the modeled and observed concentrations. Hence the dimensionless concentration or relative density, <Ct>, can be transformed into a dimensional concentration of floating plastic debris, <C>, by a linear relationship of this type:
In particular, for our best case (hence the relative mean density <C15> computed over 336 h, as in Table 3), the linear fit gives the values: A = 3.42 and B = −1.51 (Figure 7A). Although the values of correlation obtained are quite high, the number of samples reported in Figure 7A is not large enough to obtain a more significant correlation. This could be achieved by a more extended study.
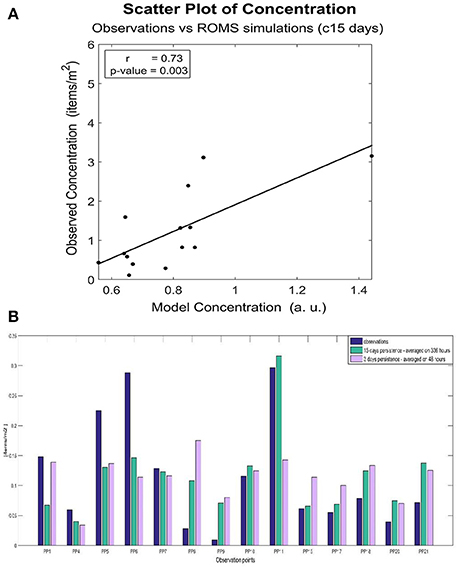
Figure 7. Comparison of microplastic concentrations observed and the model estimations. (A) Scatter plot of microplastic concentrations: observation vs. ROMS simulation (15-days centered average case), (B) Histogram of microplastic concentrations observed and modeled.
The estimated concentrations expressed in terms of standard units can be plotted on the map, as reported in Figure 8, where modeled microplastic concentrations were averaged for the whole month of September 2014. The highest microplastic concentration value, found close to Capraia Island (PP11, Structure A in Figure 5A), is very well reproduced by the regional model simulation (Figures 7B, 8). The most prominent hydrodynamic characteristic of this point is the stable anticyclonic circulation for the investigated period (mid-August – mid-September). In other areas, characterized by strong hydrodynamic features, concentration values from our modeling are very similar to those measured at sea, such as point PP17 (Figures 4, 7B) which is the closest to the most relevant cyclonic feature of the area (the Northern Tyrrhenian gyre, Structure B in Figure 5A), and point PP10 (Figures 4, 7B) in the middle of the cyclonic circulation over the Ligurian sea (Structure C in Figure 5A). In general, most of the observed variations can be explained in terms of prominent hydrodynamic features (observed and modeled) in the period of interest, with the remarkable exception of coastal areas in which local inputs can affect abundances and distributions of floating debris, for instance, points PP5, PP6, PP7 close to the Ligurian coast (e.g., Genoa) (Figures 4, 7B).
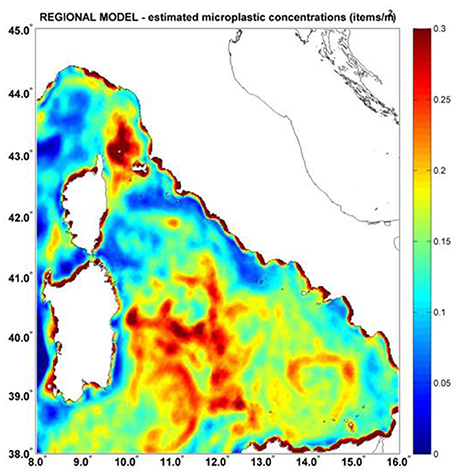
Figure 8. Modeling marine litter distribution. Estimated concentrations of microplastics (items/m2) in the period September-October 2014; map produced using the Matlab Release 14 software (https://www.mathworks.com/).
Microplastic Convergence Areas and Fin Whale Feeding Grounds
The overlap of preferred feeding habitat for planktivorous species with high concentrations of microplastic areas can increase the probability of plastic ingestion by these marine species. Because the FHO index can point out the presence of favorable feeding habitats in a certain area (Druon et al., 2012), we can compare its related maps (Figure 9A) with the simulated microplastic concentration (Figure 9B) to give an estimation of the potential impact of floating plastic on fin whale in the Pelagos Sanctuary.
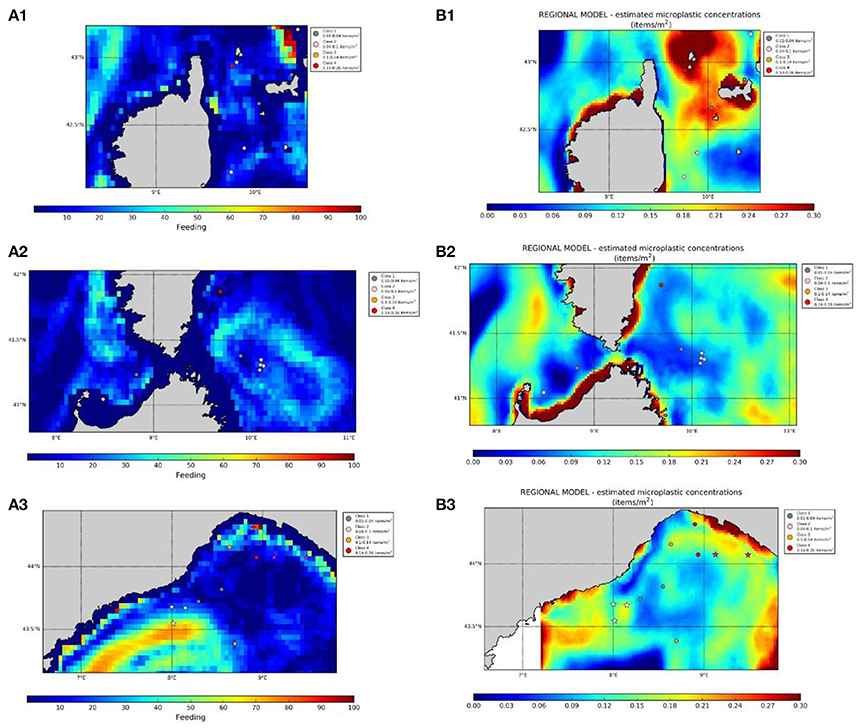
Figure 9. Fin whale habitat maps (Feeding Habitat Occurrence) (A1–A3) and simulated distribution of microplastics (items/m2) (B1–B3) in north-western Mediterranean Sea. Microplastic concentrations (circle), and cetacean sighting data (white star: Balaenoptera physalus, pink star: Stenella coeruleolba, Tursiops truncatus, Grampus griseus) plotted in the two maps. Maps were produced using Matlab software (Release 14) and Python 2.7.12 for Linux 64-bit.
The results of the model simulations show that some upwelling areas associated to cyclonic circulation, where FHO is particularly high, correspond to relatively low levels of microplastic concentration (Figures 9A2,B2). Instead the areas characterized by anticyclonic circulation, associated with downwelling (for example the Capraia gyre), despite their high values of plastic concentration, can be less favorable for whale feeding (Figures 9A1,B1). On the other hand, there is a possible overlap of feeding habitats and areas of high microplastic concentration in the external part of both cyclonic and anticyclonic structures. With cyclonic structures, the major contribution to the ingestion risk could be due to the high probability of feeding determined by the proximity to highly trophic upwelling areas. In the case of anticyclonic structures, the contribution of relatively high concentration of plastic could play a major role even with more oligotrophic conditions.
Besides the comparison with the feeding habitat model, it is important to consider the cetaceans sighting data obtained during the cruise. In particular, some of the direct whale observations are close to the areas with a high FHO index and many of them are in the areas with high estimated microplastic concentrations (Figures 9A,B). It is worth noting that two whale sightings are inside the area of highest plastic concentration, related to the anticyclonic Capraia gyre (Figures 9A1,B1).
Moreover, three other cetacean species (S. coeruleolba, T. truncatus and G. griseus) were identified during the sampling cruise for a total of 44 specimens. The striped dolphin and Risso's dolphin sightings (see Figure 2SM) overlap with the pelagic areas of high microplastic occurrence. This preliminary observation suggests a potential exposure also for odontocete cetaceans that prey preferentially on cephalopods and fish, in particular myctophidae (lanternfish). Myctophidae are a key trophic component of the marine food chain and are known to present high levels of microplastic ingestion worldwide (Lusher et al., 2016; Romeo et al., 2016). These fish species could be a potential vector of microplastic intake for odontocete species inhabiting this protected area.
Discussion
The data obtained during the Plastic Pelagos survey confirm that floating plastic debris and particularly microplastics are widespread in the north-western Mediterranean Sea including the Pelagos Sanctuary (Collignon et al., 2012, 2014; Fossi et al., 2012, 2016; Cózar et al., 2014; Faure et al., 2015; Suaria et al., 2016). The most abundant polymer detected in the study area was polyethylene (76%), suggesting the main origin of the microplastics and mesoplastics analyzed was from fragmentation of larger packaging items. Polyethylene was found to be the most common plastic polymer among the plastic debris in the Mediterranean Sea and other oceans worldwide (Hidalgo-Ruz et al., 2012; Cózar et al., 2014). The data on floating plastic abundance confirm the high concentration found by other authors in the Mediterranean Sea (Cózar et al., 2015), identified as the sixth accumulation area for marine litter together with the main five oceanic gyres, as also predicted by global models (Eriksen et al., 2014).
The assessment of the potential exposure of fin whale to plastic was obtained comparing empirical data with a model of the fin whale feeding habitat and a model estimating the concentration of floating debris for the SPAMI Pelagos Sanctuary. The latter model was calibrated using observations, so it allows to spatialize an initially sparse dataset. This approach can give an important contribution to the preliminary risk assessment of the fin whales exposure to microplastics and could be extended to other marine species exposed to plastic ingestion if appropriate model for the feeding habitat of a given species is available.
Compared to other studies that use a simulation-based approach to describe the impact of spatial debris distributions on species such as sea turtles (Schuyler et al., 2016) or sea birds (Wilcox et al., 2015), we used high-resolution operational models to identify the variability of floating litter concentrations induced by hydrodynamic features. Using real data from aerial surveys performed in the Channel, the Atlantic and the Mediterranean regions, Darmon and collaborators (Darmon et al., in press) identified the exposure areas of loggerhead sea turtles (Caretta caretta) and magnitude in terms of spatial overlap, encounter probability and density of surrounding debris at various spatial scales. A modeling approach, calibrated with in-situ data, as used in the Plastic Pelagos survey, can be better extended to identify exposure areas and ingestion risk at various spatial and temporal scales.
Although permanent and stable circulation structures similar to the main ocean gyres do not occur in the north-western Mediterranean Sea, temporary accumulation patterns can be induced by seasonal circulation features. Local upwelling features, which are highly productive areas, could not coincide with the strongest observed accumulation areas mostly generated by anticyclonic circulation. On the other hand, several dynamical aspects as the proximity of the accumulation patterns to fronts and feeding habitats could largely increase the risk of plastic ingestion by several marine species, including fin whale. These findings indicate that fin whales can be exposed to microplastic ingestion in specific areas of Pelagos Sanctuary, especially in the summer, when the whale population is concentrated there (Druon et al., 2012). The effects related to this exposure was previously observed. Higher concentrations of persistent, bioaccumulative and toxic chemicals, plastic additives, and biomarker responses in the biopsies of Mediterranean whales were found in whales compared to whales inhabiting the less polluted Sea of Cortez (Mexico) (Fossi et al., 2016). In the same paper, a temporal increase in toxicological stress in whales, from the beginning to the end of the summer feeding period, suggests that exposure to microplastic contamination increases over the span of permanence in the summer feeding grounds in the Pelagos Sanctuary.
In addition, seven phthalate esters (plastic additives) were detected in microplastic/neustonic samples and in skin biopsies of several cetacean species collected in the same protected areas (Baini et al., 2017), confirming the occurrence of associated plastic chemicals and their related risk to the inhabiting fauna.
In conclusion, to our knowledge, this is the first study in which simulated plastic distributions show a quantitative agreement with the distributions derived from a floating litter data set. The overlap of microplastic convergence areas with the fin whale feeding grounds can serve as a provisional model for estimating hazard to marine biota in this and other SPAMI areas. The methodology proposed is promising, although a larger dataset, both for plastics debris (abundance and characterization) and marine species distribution, is necessary for a more comprehensive risk assessment. In particular, future works should include in the simulation model the potential sources of marine litter (as for instance ports, rivers and ship routes) to better characterize the origin of marine litter in the Pelagos Sanctuary to establish targeted conservation/mitigation actions based, for instance, on the characterization of the polymer plastic items, for instance PE and PP, which mainly derives from packaging and fisheries activity, respectively. The actions should promote instruments and incentives to reduce the use of disposable single-use and other items and identifying measures to address key waste items from the fishing industry and aquaculture, as underlined in the UNEP/MAP Regional Plan on Marine Litter (UNEP/MAP, 2015).
Ethics Statement
The paper does not include any sampling and laboratory analysis on cetaceans but only data based on observations from a boat platform. Therefore, ethics approval was not required as per institutional and national guidelines. Moreover, the field activities were carried out under the Italian Ministry for Environment authorization Prot. 0017880/PNM.
Author Contributions
MCF designed the study, conducted the field sampling, and wrote the manuscript. TR organized the field sampling. MB carried out the field sampling, processed microplastics samples, performed data analysis and edited the manuscript. CP carried out the field sampling, processed microplastics samples, performed data analysis, and commented on and edited the manuscript. LM carried out the field sampling. TC carried out the field sampling and performed marine litter data analysis. SC organized and carried out the field sampling. FG carried out the field sampling, contributed to design the study and commented on the manuscript. JD commented on the manuscript and provided the model of whale feeding ground. SA contributed to design cetacean survey. ST performed the model of marine litter distribution and helped write the manuscript. MF performed the model of marine litter distribution. CB contributed to design the field study, performed the model of marine litter distribution, and helped write the manuscript. CL contributed to design the field study, helped in the field sampling, performed the model of marine litter distribution, and helped write the manuscript.
Funding
This project (Plastic Pelagos) was partially supported by the Italian Ministry of Environment, Territory and Sea (prot n° CUP F65I14000120001).
Conflict of Interest Statement
The authors declare that the research was conducted in the absence of any commercial or financial relationships that could be construed as a potential conflict of interest.
Acknowledgments
We would like to thanks the technical staff of R/V ASTREA (ISPRA), Dr. Luca Bittau, Dr. Françoise Clarò and Ms. Laura Carletti, for the support during the sampling cruise.
Supplementary Material
The Supplementary Material for this article can be found online at: https://www.frontiersin.org/article/10.3389/fmars.2017.00167/full#supplementary-material
References
Alomar, C., Estarellas, F., and Deudero, S. (2016). Microplastics in the Mediterranean Sea: deposition in coastal shallow sediments, spatial variation and preferential grain size. Mar. Environ. Res. 115, 1–10. doi: 10.1016/j.marenvres.2016.01.005
Artale, V., Astraldi, M., Buffoni, G., and Gasparini, G. P. (1994). Seasonal variability of gyre-scale circulation in the northern Tyrrhenian Sea. J. Geophys. Res. 99, 14127. doi: 10.1029/94JC00284
Arthur, C., Baker, J., and Bamford, H. (2009). “Effects, and fate of microplastic marine debris,” in Proceedings of the International Research Workshop on the Occurrence (Tacoma, WA: NOAA Technical Memorandum NOS-OR&R-30).
Baini, M., Martellini, T., Cincinelli, A., Campani, T., Minutoli, R., Panti, C., et al. (2017). First detection of seven phthalate esters (PAEs) as plastic tracers in superficial neustonic/planktonic samples and cetacean blubber. Anal. Methods 9, 1512–1520. doi: 10.1039/C6AY02674E
Buongiorno Nardelli, B., Tronconi, C., Pisano, A., and Santoleri, R. (2013). High and Ultra-High resolution processing of satellite Sea Surface Temperature data over Southern European Seas in the framework of MyOcean project. Remote Sens. Environ. 129, 1–16. doi: 10.1016/j.rse.2012.10.012
Campani, T., Baini, M., Giannetti, M., Cancelli, F., Mancusi, C., Serena, F., et al. (2013). Presence of plastic debris in loggerhead turtle stranded along the Tuscany coasts of the Pelagos Sanctuary for Mediterranean Marine Mammals (Italy). Mar. Pollut. Bull. 74, 225–230. doi: 10.1016/j.marpolbul.2013.06.053
Codina-García, M., Militão, T., Moreno, J., and González-Solís, J. (2013). Plastic debris in Mediterranean seabirds. Mar. Pollut. Bull. 77, 220–226. doi: 10.1016/j.marpolbul.2013.10.002
Coll, M., Piroddi, C., Albouy, C., Ben Rais Lasram, F., Cheung, W. W. L., Christensen, V., et al. (2012). The Mediterranean Sea under siege: spatial overlap between marine biodiversity, cumulative threats and marine reserves: the Mediterranean Sea under siege. Glob. Ecol. Biogeogr. 21, 465–480. doi: 10.1111/j.1466-8238.2011.00697.x
Collignon, A., Hecq, J.-H., Galgani, F., Collard, F., and Goffart, A. (2014). Annual variation in neustonic micro- and meso-plastic particles and zooplankton in the Bay of Calvi (Mediterranean–Corsica). Mar. Pollut. Bull. 79, 293–298. doi: 10.1016/j.marpolbul.2013.11.023
Collignon, A., Hecq, J.-H., Glagani, F., Voisin, P., Collard, F., and Goffart, A. (2012). Neustonic microplastic and zooplankton in the North Western Mediterranean Sea. Mar. Pollut. Bull. 64, 861–864. doi: 10.1016/j.marpolbul.2012.01.011
Cózar, A., Echevarria, F., Gonzalez-Gordillo, J. I., Irigoien, X., Ubeda, B., Hernandez-Leon, S., et al. (2014). Plastic debris in the open ocean. Proc. Natl. Acad. Sci. U.S.A. 111, 10239–10244. doi: 10.1073/pnas.1314705111
Cózar, A., Sanz-Martín, M., Martí, E., González-Gordillo, J. I., Ubeda, B., Gálvez, J. Á., et al. (2015). Plastic accumulation in the Mediterranean Sea. PLOS ONE 10:e0121762. doi: 10.1371/journal.pone.0121762
D'Amico, A., Bergamasco, A., Zanasca, P., Carniel, S., Nacini, E., Portunato, N., et al. (2003). Qualitative correlation of marine mammals with physical and biological parameters in the ligurian sea. IEEE J. Ocean. Eng. 28, 29–43. doi: 10.1109/JOE.2002.808206
Darmon, G., Miaud, C., Claro, F., Doremus, G., and Galgani, F. (in press). Risk assessment reveals high exposure of sea turtles to marine debris in French Mediterranean metropolitan Atlantic waters. Deep Sea Res. II Top. Stud. Oceanogr. doi: 10.1016/j.dsr2.2016.07.005
Deudero, S., and Alomar, C. (2015). Mediterranean marine biodiversity under threat: reviewing influence of marine litter on species. Mar. Pollut. Bull. 98, 58–68. doi: 10.1016/j.marpolbul.2015.07.012
Druon, J., Panigada, S., David, L., Gannier, A., Mayol, P., Arcangeli, A., et al. (2012). Potential feeding habitat of fin whales in the western Mediterranean Sea: an environmental niche model. Mar. Ecol. Prog. Ser. 464, 289–306. doi: 10.3354/meps09810
Eriksen, M., Lebreton, L. C. M., Carson, H. S., Thiel, M., Moore, C. J., Borerro, J. C., et al. (2014). Plastic Pollution in the World's Oceans: more than 5 Trillion Plastic Pieces Weighing over 250,000 Tons Afloat at Sea. PLoS ONE 9:e111913. doi: 10.1371/journal.pone.0111913
Fairall, C. W., Bradley, E. F., Godfrey, J. S., Wick, G. A., Edson, J. B., and Young, G. S. (1996). Cool-skin and warm-layer effects on sea surface temperature. J. Geophys. Res. Oceans 101, 1295–1308. doi: 10.1029/95JC03190
Faure, F., Saini, C., Potter, G., Galgani, F., Alencastro, L. F., and de Hagmann, P. (2015). An evaluation of surface micro- and mesoplastic pollution in pelagic ecosystems of the Western Mediterranean Sea. Environ. Sci. Pollut. Res. 22, 12190–12197. doi: 10.1007/s11356-015-4453-3
Fossi, M. C., Marsili, L., Baini, M., Giannetti, M., Coppola, D., Guerranti, C., et al. (2016). Fin whales and microplastics: the Mediterranean Sea and the Sea of Cortez scenarios. Environ. Pollut. 209, 68–78. doi: 10.1016/j.envpol.2015.11.022
Fossi, M. C., Panti, C., Guerranti, C., Coppola, D., Giannetti, M., Marsili, L., et al. (2012). Are baleen whales exposed to the threat of microplastics? A case study of the Mediterranean fin whale (Balaenoptera physalus). Mar. Pollut. Bull. 64, 2374–2379. doi: 10.1016/j.marpolbul.2012.08.013
Fossi, M. C., Panti, C., Marsili, L., Maltese, S., Spinsanti, G., Casini, S., et al. (2013). The Pelagos Sanctuary for Mediterranean marine mammals: Marine Protected Area (MPA) or marine polluted area? The case study of the striped dolphin (Stenella coeruleoalba). Mar. Pollut. Bull. 70, 64–72. doi: 10.1016/j.marpolbul.2013.02.013
Gohin, F., Druon, J. N., and Lampert, L. (2002). A five channel chlorophyll concentration algorithm applied to SeaWiFS data processed by SeaDAS in coastal waters. Int. J. Remote Sens. 23, 1639–1661. doi: 10.1080/01431160110071879
Hidalgo-Ruz, V., Gutow, L., Thompson, R. C., and Thiel, M. (2012). Microplastics in the marine environment: a review of the methods used for identification and quantification. Environ. Sci. Technol. 46, 3060–3075. doi: 10.1021/es2031505
Hinojosa, I. A., and Thiel, M. (2009). Floating marine debris in fjords, gulfs and channels of southern Chile. Mar. Pollut. Bull. 58, 341–350. doi: 10.1016/j.marpolbul.2008.10.020
Hummel, D. O. (2002). Atlas of Plastics Additives: Analysis by Spectrometric Methods. Berlin; New York, NY: Springer.
Iacono, R., Napolitano, E., Marullo, S., Artale, V., and Vetrano, A. (2013). Seasonal variability of the Tyrrhenian Sea surface geostrophic circulation as assessed by altimeter data. J. Phys. Oceanogr. 43, 1710–1732. doi: 10.1175/JPO-D-12-0112.1
Kooi, M., Reisser, J., Slat, B., Ferrari, F. F., Schmid, M. S., Cunsolo, S., et al. (2016). The effect of particle properties on the depth profile of buoyant plastics in the ocean. Sci. Rep. 6:33882. doi: 10.1038/srep33882
Kukulka, T., Proskurowski, G., Morét-Ferguson, S., Meyer, D. W., and Law, K. L. (2012). The effect of wind mixing on the vertical distribution of buoyant plastic debris. Geophys. Res. Lett. 39:L07601. doi: 10.1029/2012GL051116
Lapucci, C., Ampolo Rella, M., Brandini, C., Ganzin, N., Gozzini, B., Maselli, F., et al. (2012). Evaluation of empirical and semi-analytical chlorophyll algorithms in the Ligurian and North Tyrrhenian Seas. J. Appl. Remote Sens. 6, 063565–063561. doi: 10.1117/1.JRS.6.063565
Law, K. L., Morét-Ferguson, S. E., Goodwin, D. S., Zettler, E. R., DeForce, E., Kukulka, T., et al. (2014). Distribution of Surface Plastic Debris in the Eastern Pacific Ocean from an 11-Year Data Set. Environ. Sci. Technol. 48, 4732–4738. doi: 10.1021/es4053076
Lebreton, L. C.-M., Greer, S. D., and Borrero, J. C. (2012). Numerical modelling of floating debris in the world's oceans. Mar. Pollut. Bull. 64, 653–661. doi: 10.1016/j.marpolbul.2011.10.027
Lusher, A. L., McHugh, M., and Thompson, R. C. (2013). Occurrence of microplastics in the gastrointestinal tract of pelagic and demersal fish from the English Channel. Mar. Pollut. Bull. 67, 94–99. doi: 10.1016/j.marpolbul.2012.11.028
Lusher, A. L., O'Donnell, C., Officer, R., and O'Connor, I. (2016). Microplastic interactions with North Atlantic mesopelagic fish. ICES J. Mar. Sci. J. Cons. 73, 1214–1225. doi: 10.1093/icesjms/fsv241
Mansui, J., Molcard, A., and Ourmières, Y. (2015). Modelling the transport and accumulation of floating marine debris in the Mediterranean basin. Mar. Pollut. Bull. 91, 249–257. doi: 10.1016/j.marpolbul.2014.11.037
MSFD Technical Subgroup on Marine Litter (2013). Guidance on Monitoring of Marine Litter in European Seas. Luxembourg: Publications Office.
Panigada, S., Lauriano, G., Burt, L., Pierantonio, N., and Donovan, G. (2011). Monitoring winter and summer abundance of cetaceans in the pelagos sanctuary (Northwestern Mediterranean Sea) through aerial surveys. PLoS ONE 6:e22878. doi: 10.1371/journal.pone.0022878
Panigada, S., Notarbartolo di Sciara, G., Zanardelli, M., Airoldi, S., Borsani, J. F., and Jahoda, M. (2005). Fin whales summering in the Ligurian Sea: distribution, encounter rate, mean group size and relation to physiographic variables. J. Cetacean Res. Manag. 7, 137–145.
Panti, C., Giannetti, M., Baini, M., Rubegni, F., Minutoli, R., and Fossi, M. C. (2015). Occurrence, relative abundance and spatial distribution of microplastics and zooplankton NW of Sardinia in the Pelagos Sanctuary Protected Area, Mediterranean Sea. Environ. Chem. 12:618. doi: 10.1071/EN14234
Pinzone, M., Budzinski, H., Tasciotti, A., Ody, D., Lepoint, G., Schnitzler, J., et al. (2015). POPs in free-ranging pilot whales, sperm whales and fin whales from the Mediterranean Sea: influence of biological and ecological factors. Environ. Res. 142, 185–196. doi: 10.1016/j.envres.2015.06.021
Plastics Europe (2015). Plastics – the Facts 2015 An Analysis of European Plastics Production, Demand and Waste Data. Bruxelles: Plastics Europe
Romeo, T., Pedà, C., Fossi, M. C., Andaloro, F., and Battaglia, P. (2016). First record of plastic debris in the stomach of Mediterranean lanternfishes [Prvi zapis o plastičnim krhotinama u želucu mediteranskih riba žaboglavki (Myctophidae). Acta Adriat. 57, 115–124.
Romeo, T., Pietro, B., Pedà, C., Consoli, P., Andaloro, F., and Fossi, M. C. (2015). First evidence of presence of plastic debris in stomach of large pelagic fish in the Mediterranean Sea. Mar. Pollut. Bull. 95, 358–361. doi: 10.1016/j.marpolbul.2015.04.048
Schroeder, K., Haza, A. C., Griffa, A., Özgökmen, T. M., Poulain, P. M., Gerin, R., et al. (2011). Relative dispersion in the Liguro-Provençal basin: from sub-mesoscale to mesoscale. Deep Sea Res. Part I: Oceanogr. Res. Pap. 58, 209–228. doi: 10.1016/j.dsr.2010.11.004
Schuyler, Q. A., Wilcox, C., Townsend, K. A., Wedemeyer-Strombel, K. R., Balazs, G., van Sebille, E., et al. (2016). Risk analysis reveals global hotspots for marine debris ingestion by sea turtles. Glob. Change Biol. 22, 567–576. doi: 10.1111/gcb.13078
Shchepetkin, A. F., and McWilliams, J. C. (2005). The regional oceanic modeling system (ROMS): a split-explicit, free-surface, topography-following-coordinate oceanic model. Ocean Model. 9, 347–404. doi: 10.1016/j.ocemod.2004.08.002
Suaria, G., and Aliani, S. (2014). Floating debris in the Mediterranean Sea. Mar. Pollut. Bull. 86, 494–504. doi: 10.1016/j.marpolbul.2014.06.025
Suaria, G., Avio, C. G., Mineo, A., Lattin, G. L., Magaldi, M. G., Belmonte, G., et al. (2016). The Mediterranean Plastic Soup: synthetic polymers in Mediterranean surface waters. Sci. Rep. 6:37551. doi: 10.1038/srep37551
van Sebille, E., Wilcox, C., Lebreton, L., Maximenko, N., Hardesty, B. D., van Franeker, J. A., et al. (2015). A global inventory of small floating plastic debris. Environ. Res. Lett. 10:124006. doi: 10.1088/1748-9326/10/12/124006
Keywords: floating plastic debris, microplastics, Mediterranean Sea, convergence areas, modeling, fin whales, Marine Protected Area
Citation: Fossi MC, Romeo T, Baini M, Panti C, Marsili L, Campani T, Canese S, Galgani F, Druon J-N, Airoldi S, Taddei S, Fattorini M, Brandini C and Lapucci C (2017) Plastic Debris Occurrence, Convergence Areas and Fin Whales Feeding Ground in the Mediterranean Marine Protected Area Pelagos Sanctuary: A Modeling Approach. Front. Mar. Sci. 4:167. doi: 10.3389/fmars.2017.00167
Received: 13 January 2017; Accepted: 15 May 2017;
Published: 31 May 2017.
Edited by:
Mario Barletta, Federal University of Pernambuco, BrazilReviewed by:
Mark Peter Simmonds, University of Bristol, United KingdomSunwook Hong, Our Sea of East Asia Network, South Korea
Russell Christopher Leaper, University of Aberdeen, United Kingdom
Copyright © 2017 Fossi, Romeo, Baini, Panti, Marsili, Campani, Canese, Galgani, Druon, Airoldi, Taddei, Fattorini, Brandini and Lapucci. This is an open-access article distributed under the terms of the Creative Commons Attribution License (CC BY). The use, distribution or reproduction in other forums is permitted, provided the original author(s) or licensor are credited and that the original publication in this journal is cited, in accordance with accepted academic practice. No use, distribution or reproduction is permitted which does not comply with these terms.
*Correspondence: Cristina Panti, panti4@unisi.it