Thermal Thresholds of Phytoplankton Growth in Polar Waters and Their Consequences for a Warming Polar Ocean
 Alexandra Coello-Camba
 Susana Agustí
- 1Red Sea Research Center, King Abdullah University of Science and Technology, Thuwal, Saudi Arabia
- 2Department of Arctic and Marine Biology, Faculty of Bioscience, Fishery and Economy, University of Tromsø, Tromsø, Norway
Polar areas are experiencing the steepest warming rates on Earth, a trend expected to continue in the future. In these habitats, phytoplankton communities constitute the basis of the food web and their thermal tolerance may dictate how warming affects these delicate environments. Here, we compiled available data on thermal responses of phytoplankton growth in polar waters. We assembled 53 growth-vs.-temperature curves (25 from the Arctic, 28 from the Southern oceans), indicating the limited information available for these ecosystems. Half of the data from Arctic phytoplankton came from natural communities where low ambient concentrations could limit growth rates. Phytoplankton from polar waters grew faster under small temperature increases until reaching an optimum (TOPT), and slowed when temperatures increased beyond this value. This left-skewed curves were characterized by higher activation energies (Ea) for phytoplankton growth above than below the TOPT. Combining these thermal responses we obtained a community TOPT of 6.5°C (±0.2) and 5.2°C (±0.1) for Arctic and Southern Ocean phytoplankton communities, respectively. These threshold temperatures were already exceeded at 70°N during the first half of August 2013, evidenced by sea surface temperatures (SSTs, satellite data, http://www.ncdc.noaa.gov). We forecasted SSTs for the end of the twenty-first century by assuming an overall 3°C increase, equivalent to a low emission scenario. Our forecasts show that SSTs at 70°N are expected to exceed TOPT during summer by 2100, and during the first half of August at 75°N. While recent Arctic spring temperatures average 0.5°C and −0.7°C at 70°N and 75°N, respectively, they could increase to 2.8°C at 70°N and 2.2°C at 75°N as we approach 2100. Such temperature increases could lead to intense phytoplankton blooms, shortened by fast nutrient consumption. As SSTs increase, thermal thresholds for phytoplankton growth would be eventually exceeded during bloom development. This could lead to changes in the blooming phytoplankton community, threatening the production peak and cycles in the Arctic. Our forecasted phytoplankton responses, are constrained by the limited data set, besides uncertainties in the most plausible future Arctic temperature scenarios. To improve predictions in polar oceans, we need to increase the number of studies, in particular for a fast-changing Arctic.
Introduction
Climate change is predicted to increase average global temperatures by 0.3–0.9°C per decade. Polar regions are expected to experience the highest temperature increases (Christensen et al., 2007), with far-reaching effects on the Arctic (Wassmann and Reigstad, 2011). Furthermore, an acceleration of temperature increases is also anticipated in some regions (around the Antarctic Peninsula and near-coastal Antarctica) of the Southern Ocean (Christensen et al., 2007).
The ecological and physiological adaptations of phytoplankton to temperature influence their global distribution (Huertas et al., 2011; Thomas et al., 2012). The effect of temperature on phytoplankton growth has been widely observed (Raven and Geider, 1988; Coello-Camba et al., 2014, 2015). The thermal performance curves of these organisms usually follow a typical shape of being bound at extreme temperatures with a single intermediate mode (Angilletta, 2006; Figure 1). This mode represents the optimum temperature (TOPT) for growth. The farther away the temperature moves from this optimum, the lower the growth rate. Phytoplankton communities account for most primary production in the oceans (Sakshaug and Holm-Hansen, 1984). These pelagic organisms have optimum temperatures for growth that are strongly related to mean annual temperatures at their geographical location, demonstrating a clear latitudinal trend in their TOPT (Thomas et al., 2012), with higher TOPT for growth at lower and hence warmer latitudes. Warming is therefore expected to cause poleward shifts in the range of species (Parmesan, 2006; Thomas et al., 2012) as they vary their biogeographic distribution to accommodate changes in ambient temperatures (Loarie et al., 2009; Burrows et al., 2011). Nonetheless, for species inhabiting polar oceans no “colder waters” will be available as refugia (Boyd et al., 2013). The high-latitude niches occupied by species with low TOPT values will diminish, necessitating that these species acclimatize or adapt to higher temperatures to survive (Boyd et al., 2013). Besides this, an increase in the number of subpolar phytoplankton species moving into the polar region is likely to happen, particularly in the Arctic Ocean, where advection processes help to connect this ocean with waters at lower latitudes (Hunt et al., 2016). Under such conditions, competition will become a strong selection factor as the environment becomes better suited to incoming species from lower latitudes and resident communities will be challenged.
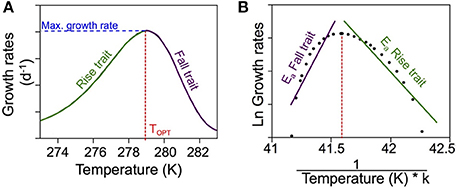
Figure 1. Conceptual figure of thermal responses of ectotherms. (A) Conceptual figure depicting a typical thermal response. When the growth rates are plotted in relation to temperature, the optimum temperature corresponds to the peak in growth rate. (B) To estimate the activation energies for the growth rates, we follow the method described by Vaquer-Sunyer et al. (2010). The Ln of the growth rates is represented in relation to the inverse of the temperature (in Kelvin) multiplied by the constant k. The resulting slopes in both traits are then the Ea correspondent to each trait.
Although thermal performance curves have been described for several organisms (Loarie et al., 2009), few datasets presenting thermal curves for polar phytoplankton are available (i.e., Thomas et al., 2012). This may be a consequence of the remoteness of polar waters and of the limited number of polar phytoplankton species that have successfully been cultured in the laboratory.
The goal of this paper is to identify the thermal thresholds of phytoplankton in polar waters and to predict possible implications of increasing temperatures for growth and bloom development. To do so, we created a growth-vs.-temperature database using data from the literature and new experiments. Then, based on this database, we calculated the community TOPT for growth, a parameter that represents a turning point beyond which temperature becomes a restrictive factor. We also calculated activation energies (Ea) to illustrate the steepness of the changes in growth rates above and below the optimum temperature and to infer the capacity for phytoplankton to respond to increased temperature in a warming polar sea. We then compared thermal thresholds with recent surface seawater temperatures (SSTs) in both polar oceans to evaluate how close phytoplankton populations are to their thermal limits. Finally, we modeled a future SST scenario to predict when temperatures will rise above the thermal thresholds of phytoplankton in polar waters. Temperature predictions will be especially relevant to the Arctic and to the spring bloom, a key process that accounts for the largest part of annual primary production (Leu et al., 2011) and that is tightly coupled with melting ice (Leu et al., 2011). Alterations in the timing and/or quality of this key peak in primary production may consequently alter Arctic food webs and possibly influence biogeochemical cycles.
Materials and Methods
Seawater Temperature
Recent SSTs for the entire Arctic Ocean were obtained from satellite data (http://www.ncdc.noaa.gov). We averaged daily temperatures from four latitudes (70, 75, 80, and 85°N) between March and September 2013 to gain a general representation of Arctic SSTs. For the Southern Ocean, we considered the SSTs measured during the same year in the vicinity of the Antarctic Peninsula (80–50°W, 75°S-Antarctic Convergence). To estimate future SSTs in these areas, we increased the SSTs observed in 2013 by 3°C, taking into account that seawater temperatures will remain low as long as the ice cover remains and that they will gradually increase after the ice melts. This represents a low-emission scenario similar to that previously assumed by various authors (e.g., Flombaum et al., 2013). This 3°C increase corresponds to an intermediate value between the increase in temperatures predicted for the Arctic by the RCP2.6 (+2.2°C) and RCP4.5 (+4.2°C) scenarios estimated in the Fifth Assessment Report of the Intergovernmental Panel on Climate Change (IPCC; Collins et al., 2013).
Dataset from the Literature
We assembled a dataset of marine phytoplankton growth rates vs. temperature to estimate the optimal growth temperatures (TOPT) for phytoplankton in the Arctic and Southern Oceans. This dataset included bibliographic and new experimental data. During the literature search, we took into account all studies published to that date that reported growth rate measurements of polar marine phytoplankton at different temperatures. To determine which data should be included in our analyses, we used the following criteria: following the climatic classification proposed by Supan (1884), we considered phytoplankton species living beyond the 10°C isotherm defined for the warmest month as Arctic species. For Antarctic species, we selected those living beyond the Antarctic Convergence, an oceanographic barrier that delimits the Southern Ocean and varies between 50 and 65°S (Anisimov et al., 2001; Figure 2). We focused our analysis on those studies that evaluated temperature increases consistent with possible future scenarios in both polar areas and excluded measurements at high temperatures that would be unlikely to happen in these oceans within the next century. Due to the limited number of polar studies meeting the requirements needed for our study, we also considered those studies in which the largest measured growth rates occurred at the lowest or highest temperature tested. Also, we preferentially selected data obtained under experimental conditions (of light, salinity, etc.) that were more similar to the natural levels usually encountered in these oceans. The resulting dataset is detailed in Table 1.
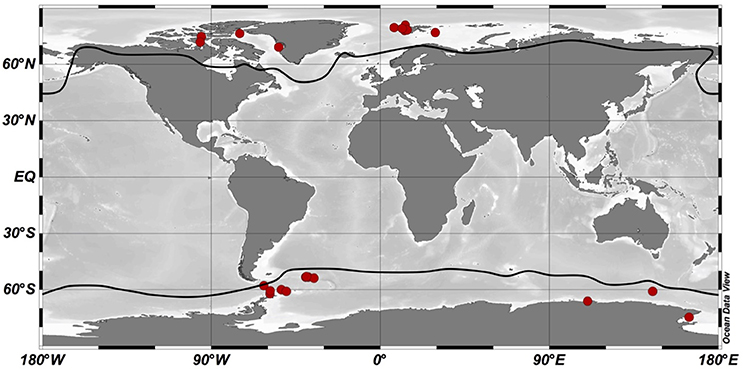
Figure 2. Geographical distribution of optimum temperature data for phytoplankton growth in the Arctic and Southern Oceans. Red dots indicate geographical sites from which phytoplankton species where isolated. Dark lines represent the polar boundaries considered in this study: the 10°C isotherm for the Arctic Ocean and the Antarctic Convergence for the Southern Ocean. Schlitzer, R., Ocean Data View, http://odv.awi.de, 2015.
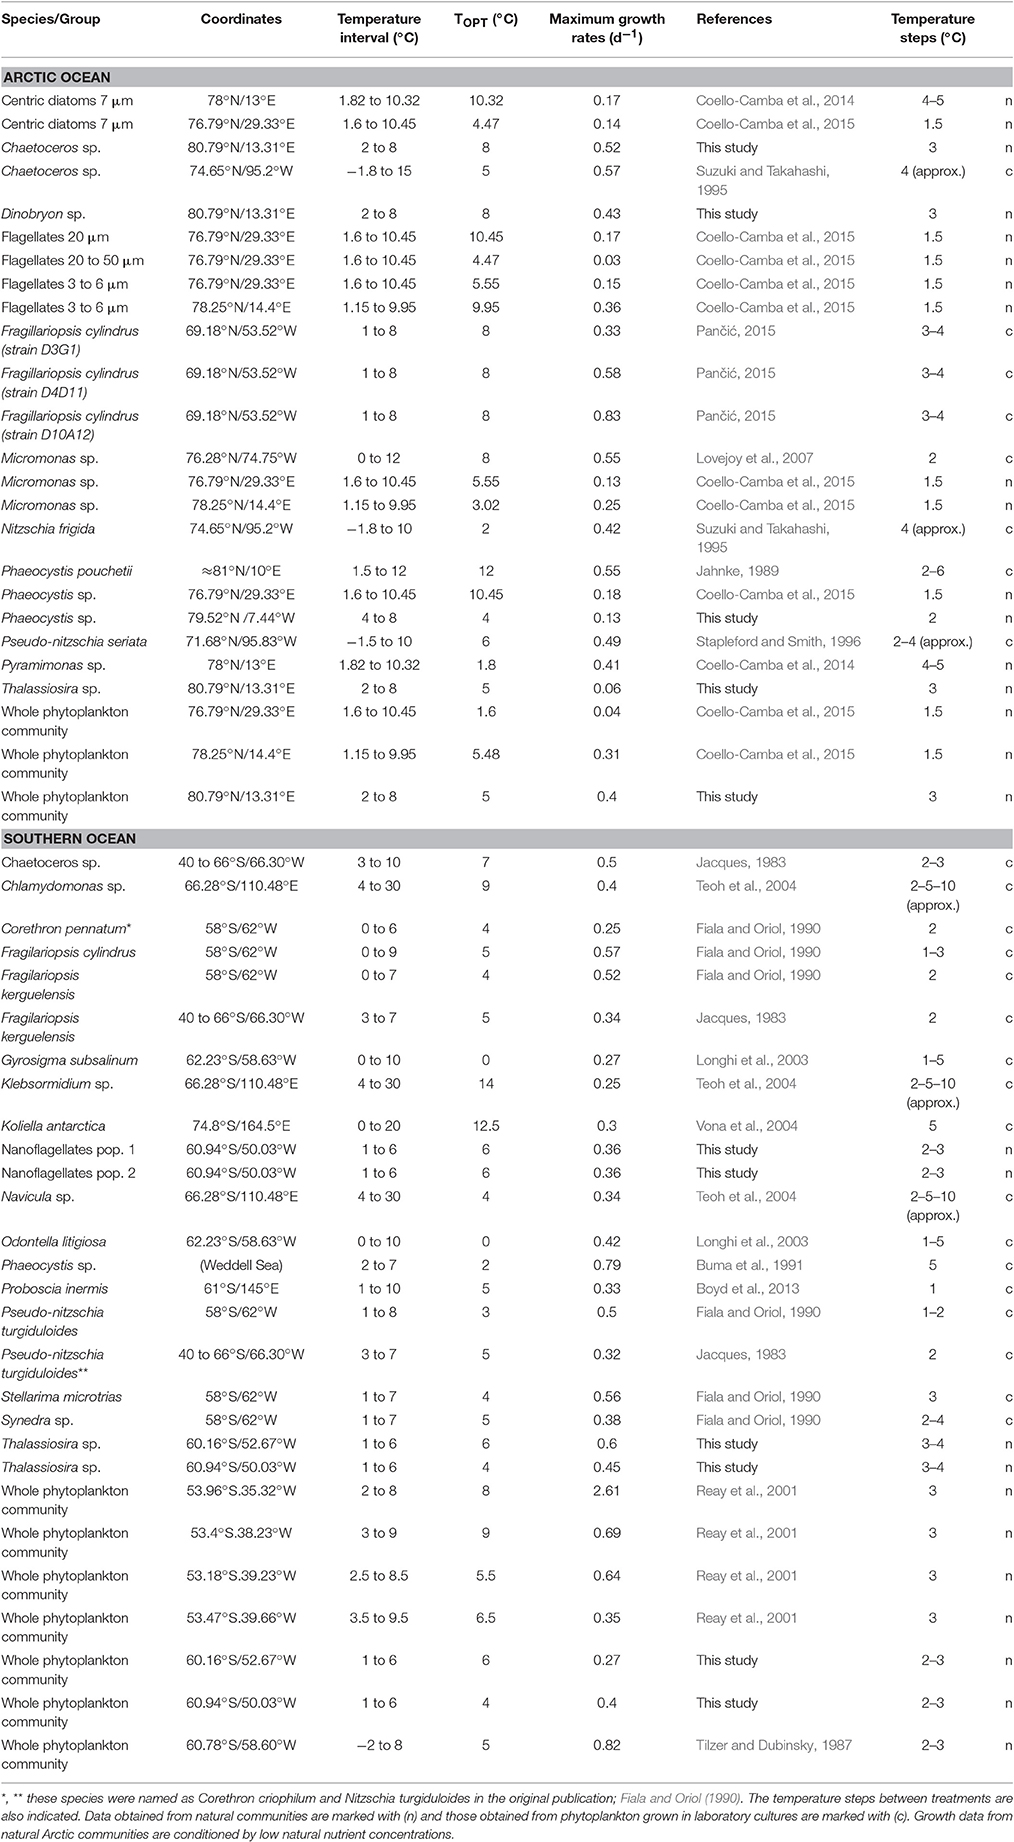
Table 1. Optimum temperatures (TOPT) and maximum growth rates (μmax) estimated for Arctic and Antarctic phytoplankton.
Experimental Data
We performed four experiments on natural phytoplankton communities during the ATOS-I and ESASSI cruises on the Arctic and Southern Oceans, respectively, on board the Spanish research vessel BIO Hespérides. ATOS-I (Atmospheric inputs of organic carbon and pollutants to the polar ocean: rates, significance and outlook) took place between 29 June and 27 July 2007 across the Fram Strait, between the Spitsbergen Islands and the ice limit. The ESASSI [Spanish contribution to the SASSI (“Synoptic Antarctic Shelf-Slope Interaction”) international project] cruise took place the following year, from 2 to 23 January 2008 in the South Scotia Ridge region.
During each cruise, surface seawater samples (5 m depth) were collected using 12-L Niskin bottles attached to a CTD-rosette system and distributed into six 2-L bottles, adding plankton collected from a 20-μm net. These samples were incubated at three different temperatures, with the lowest temperature treatment similar to the in situ seawater temperature measured at the beginning of the experiment and the other temperatures representing two steps of 2–3 and 4–5°C higher. Polycarbonate bottles were incubated in white 50-L tanks placed on deck of the ship to receive natural solar radiation. These bottles reduced photosynthetically active radiation (PAR) by 10%. They were secured with a light net that additionally removed 18% of PAR; this way, our incubations were exposed to light conditions close to the PAR levels found at 5 m depth. These tanks were filled with seawater and connected to a cooling circulating water system and a thermostat (Lauda Co.) to maintain the desired temperature (error ± 0.5°C). The precision of the system was regularly checked with a digital thermometer.
The nutrient concentrations measured in our experiments allowed the growth of phytoplankton during the incubations. Phytoplankton cell abundances were measured every second day. A known volume (20–50 mL) from each experiment was filtered through a black polycarbonate filter (1 μm pore) and fixed with glutaraldehyde (1% final concentration). Cells were counted at x1000 magnification using an Olympus BX40 and a Zeiss Axiovert 25 epifluorescence microscope. Cell abundances for the smallest phytoplankton groups in the Southern Ocean samples were counted using a FACSCalibur (Becton Dickinson) flow cytometer equipped with a 488-nm laser. To count the largest cells we used a FlowCAM (FluidImaging Technologies), equipped with a 300-μm-wide flow cell and a camera with a 4x magnification objective. We estimated the abundance of the particles by relating the cell counts to the volume of sample processed.
To estimate the biomass of the whole phytoplankton community, we measured chlorophyll a concentrations. We filtered 50 mL of experimental water into Whatman GF/F filters daily and followed the fluorometric method described by Parsons et al. (1984).
Growth vs. Temperature Curves and Identification of TOPT
We estimated the TOPT for growth in polar phytoplankton communities from the optimum temperatures of the different groups and communities described in our database. We took into account the fact that TOPT values for growth are robust across a range of different experimental methodologies (Boyd et al., 2013).
To estimate TOPT during our experiments, we calculated the net growth rates (μ) for each group and for the whole phytoplankton community under every temperature treatment. These were calculated from the slope of changes in the natural logarithm (Ln) of the cell abundance (N) (or of their chlorophyll a concentration, chl a), over the duration of the experiment (days, t) by fitting the following linear regression equation:
Then, we obtained each specific TOPT from the growth rates obtained from our experiments and from the previous studies included in our polar database that did not directly include the optimum temperature. We chose the tested temperature at which the maximum net growth rate occurred (gross growth rates for those studies using cultures; Figure 1A).
To calculate the TOPT of Arctic and Southern Ocean communities, we plotted each TOPT from the database against its correspondent maximum growth rate and fit three functions to the upper limit of the scattering data. We applied the unimodal function described by Johnson and Lewin in 1946 (Dell et al., 2011; Equation 2) and the Gaussian and Weibull functions (Angilletta, 2006; Equations 3, 4). We used JMP® statistics software and followed an iterative mathematical method, the Gauss-Newton algorithm, with a stop limit of 2,000 iterations. This method requires a series of initial values for each parameter to work. Here, we arbitrarily assigned these values such that they were low enough to allow the algorithm to perform properly and cover all the data range, which improved convergence and parameter estimation.
Each function provided an overall TOPT value, which we averaged to obtain a mean optimum temperature for both Arctic and Southern Ocean communities as a whole.
Activation Energies
The activation energies (Ea) were calculated for the growth-vs.-temperature curves obtained for each group and community. To estimate the activation energies for the rise and fall traits, we divided the growth-vs.-temperature curves into two parts, one below the optimum temperature (rise trait) and the other above this value (fall trait). Ea values (in eV) were then estimated from the slope of the Arrhenius equation relating the natural logarithm of growth rates (in d−1) to the inverse of the growth temperature (in Kelvin) multiplied by k (Boltzmann's constant, 8.62·10−5 eV k−1) as described by Vaquer-Sunyer et al. (2010) (Figure 1B). The resulting Ea values were grouped separately for Arctic and Southern Ocean data.
Results
Temperature Optima
We compiled 53 estimations of the relationship between the growth rates of phytoplankton from polar waters and increasing temperature: 11 from our own experiments and 42 from the literature (16 papers published between 1983 and 2015). From that total, 25 measurements corresponded to Arctic communities and 28 corresponded to the Southern Ocean communities (Figure 2). In both phytoplankton communities from the Arctic and Southern Oceans, there were diatoms such as Thalassiosira spp., Chaetoceros spp., and Fragilariopsis cylindrus. Phaeocystis spp. and Micromonas spp. stood out among the flagellate cells as also being present in both polar communities.
When the studies considered here covered the whole thermal range of the phytoplankton group studied, the resulting thermal performance curves usually exhibited a characteristic shape, with higher growth rates at the intermediate temperatures tested. In some cases, the temperature interval was not wide enough, and the highest growth rates observed occurred at the extremes of the temperature range tested. This contributed to the lower amount of data available for estimating the Ea fall trait and generated errors in the detection of the TOPT of that phytoplankton group.
Among the maximum net growth rates compiled here, we found low values for some of the groups studied in the Arctic ocean (e.g., flagellates 20–50 μm, Table 1), likely because these groups came from natural populations conditioned by low natural nutrient concentrations. The data reported in Coello-Camba et al. (2014), included communities growing at low nutrient concentrations influencing the value of the maximum growth reported. However, in the experiments run in this study with Arctic communities, nutrient availability was higher (0.62 ± 0.01 μM PO4, 4.25 ± 1.3 μM SiO4, and 8.1 ± 0.49 μM NO3; Boras et al., 2010).
Overall, the average maximum growth rate for the phytoplankton community in the Arctic Ocean was 0.33 (±0.04) d−1 and 0.52 (±0.08) d−1 in the Southern Ocean. The optimum temperatures were also relatively low (Table 1, Figure 3). We did not find significant autocorrelations between TOPT and the latitude range covered here.
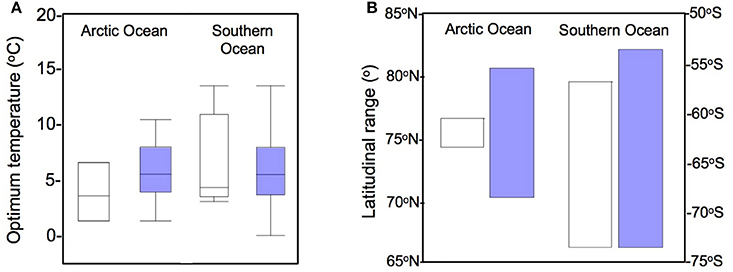
Figure 3. TOPT for phytoplankton growth in polar oceans and latitudinal range of the data. (A) Distribution of the optimum temperatures for phytoplankton growth, comparing the data from Thomas et al. (2012) (white) with the dataset obtained in the present work (blue). (B) Polar latitudinal range covered in each study.
The TOPT for growth observed for each group ranged between 0 and 14°C (Table 1), with average values of 6.4°C (CI90% = 1.0) of the optimum temperatures for the Arctic phytoplankton community, and 5.5°C (CI90% = 0.98) for the Southern Ocean. In some cases, when the same phytoplankton group was present in different studies, we could observe a more or less wide spread of TOPT between estimations (i.e., Arctic Phaeocystis spp., Micromonas spp.).
Using this TOPT data and the corresponding maximum growth rates, we estimated the thermal performance curves for Arctic and Southern Ocean phytoplankton communities (Figure 4). The three model fits applied to our data resulted in the following formulas (SSE = sum of square errors):
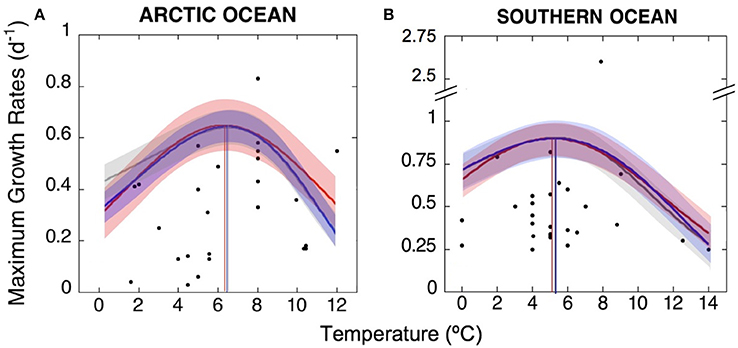
Figure 4. TOPT for growth of Arctic and Antarctic phytoplankton communities. Maximum growth rates observed at the TOPT of phytoplankton species and communities inhabiting (A) the Arctic and (B) the Southern Ocean, obtained from the literature and new experimental data. We used three fits to better predict TOPT for the whole phytoplankton communities in each polar ocean: gray lines represent the best fit of the Johnson and Lewin model as described by Dell et al. (2011); red and blue curves represent the Gaussian and Weibull functions, respectively, as described by Angilletta (2006). The TOPT calculated by each model were similar and are marked here by vertical lines corresponding to the three fits, which averaged 6.5 ± 0.2°C for the Arctic and 5.2 ± 0.1°C for the Antarctic communities. Shaded areas represent the sum of squared errors (±SSE) of each thermal performance curve.
This way, the average TOPT for growth obtained here was of 6.5°C (SE = ±0.2) for the Arctic community and 5.2°C (SE = ±0.1) for the Antarctic community.
Activation Energies
Our results showed that Ea was higher at temperatures above the TOPT (fall trait) than below the TOPT (rise trait) (Figure 1) in both oceans, with Ea fall values approximately doubling the corresponding Ea rise values (Figure 5). The amount of data for the fall traits was scarcer than for the rise traits, particularly for the Southern Ocean. Nonetheless, the differences in Ea derived from each trait were consistent.
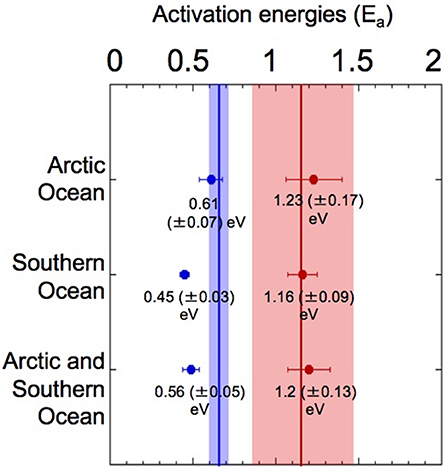
Figure 5. Activation energies (Ea) for phytoplankton growth in the Arctic and Southern Oceans. Analysis of Ea for the rise and fall traits estimated from the thermal performance curves of growth-vs.-temperature for phytoplankton communities living in polar oceans. Vertical lines mark the mean Ea (shaded areas represent ±95% CI) of rise (blue) and fall (red) responses, as determined in Dell et al. (2011) (0.65 eV, and 1.15 eV, respectively) for an entire dataset, including microbes, plants and animals.
Polar Seawater Surface Temperature
Recent (2013, data from http://www.ncdc.noaa.gov) seawater temperatures in the Arctic Ocean are shown in Figure 6. In the southernmost Arctic region studied here (70°N), SSTs varied between −1 and 7.2°C during the year. At increasingly higher latitudes, where sea ice is more persistent throughout the year, the temperature gradient became smoother and eventually led to almost stable SSTs (Figure 6).
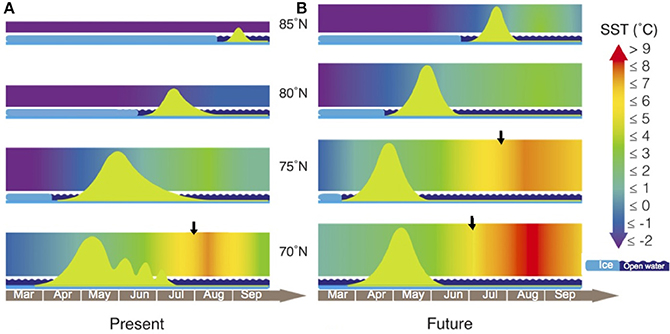
Figure 6. SSTs and phytoplankton blooms in the Arctic at present and in future scenarios. Arctic phytoplankton blooms (green curves) develop in open waters (wavy dark blue bars) once sea ice retreats (light blue bars). Shaded areas represent daily changes in average SST. (A) Recent scenario, temperatures in the Arctic corresponding to 2013 (www.ncdc.noaa.gov) between 70 and 85°N. (B) The future SST scenario expected by 2100, assuming a 3°C increase in mean temperatures (right panel) and predicting sharper bloom developments due to faster growth rates at increased temperatures. Black arrows indicate when SSTs increase above the TOPT = 6.5°C. Modified after Wassmann and Reigstad (2011) and Leu et al. (2011).
Spring temperatures at the lowest latitudes averaged 0.5°C at 70°N and −0.7°C at 75°N, with a maximum SST of 2.3°C at 70°N. The seasonal warming that takes place during spring became less intense toward the pole, with averaged SSTs of approximately −1.4°C at 80 and −1.7°C at 85°N. During summer, Arctic SSTs averaged 4.9°C at 70°N, 2.1°C at 75°N, −0.4°C at 80°N, and −1.2°C at 85°N, reaching the maximum value in mid-August at 70°N (7.2°C; Figure 6).
Arctic SST in 2100
We estimated the seasonal variability of SST in the Arctic Ocean for the end of the twenty-first century with the assumption of a 3°C increase (Figure 6) over time. With this warming scenario, seawater temperatures increased at all latitudes, with steeper temperature gradients and strong ice breakup processes at high latitudes. During spring, we estimated SSTs to reach values of up to 5.2°C at 70°N, 3.4°C at 75°N, 2.1°C at 80°N and 0.7°C at 85°N, toward the end of the century.
During summer, we expect that a higher variation in SSTs will take place at the lowest Arctic latitudes, where maximum SSTs could be as high as 10.2°C at 70°N or 6.5°C at 75°N. Far toward the pole, at 85°N, SSTs may remain above 0°C during this warmest season (Figure 6).
Discussion
Our efforts to find studies on optimal temperatures for growth of phytoplankton in polar areas demonstrate that, until now, few datasets describing thermal curves for polar phytoplankton have been published despite their relevance to warming trends currently observed in polar ecosystems. Limitations of the compiled dataset include few temperature treatments, which contributes to uncertainty in the identification of the optimum temperatures for growth in some cases. Moreover, there is a limited number of polar phytoplankton species that have been isolated and successfully cultured in the laboratory, forcing the use of natural communities to test the responses to temperature. This implies that, in some experiments, phytoplankton growth rates could have been constrained due to natural nutrient limitations. Besides this, the geographical distribution of the available data is biased toward some particular regions of the Arctic and Southern Oceans (Figure 2). More specifically, most of the Arctic studies on this topic come from the Svalbard Archipelago (as also pointed by Wassmann et al., 2011), an area influenced by the inflow of the West Spitsbergen Current, and the Canadian Arctic-Baffin Bay area. In the Southern Ocean, most data have been obtained next to the Antarctic Peninsula and the Ross Sea. A seasonal bias can also be found in general in polar research, as the access to study areas is often difficult in the coldest seasons and regions.
Among all the phytoplankton groups studied here, genera such as Thalassiosira spp., Chaetoceros spp., Fragilariopsis spp., and Phaeocystis spp. have been usually reported as dominant organisms in the phytoplankton standing stocks associated with spring blooms in the Arctic (Barber et al., 2015). These genera are similar in the Antarctic.
The thermal thresholds determined here do not describe the physiology of these phytoplankton groups, but reflect their ecological preferences. This way, we can depict the actual responses to warming of the phytoplankton groups and autotrophic communities inhabiting polar oceans as a whole. The optimum temperature for growth represents a turning point beyond which temperature becomes a restrictive factor for organisms. By conditioning growth, temperature changes could trigger substantial alterations in phytoplankton responses and therefore in the whole polar ecosystem. The dataset compiled here agrees with the description of Thomas et al. (2012) of lower TOPT for phytoplankton species living at high latitudes (Figure 3). We observe that the relatively low TOPT values found (Table 1) agree with the low mean annual SST in polar regions: from 1.8°C in the Arctic (Payne et al., 2011) to −0.2°C near the Antarctic Peninsula (Etourneau et al., 2013). For some phytoplankton, TOPT varied between different estimates (i.e., Micromonas spp. TOPT: 3.02–8°C). This may suggest that there is genotypic plasticity in responses to temperature that may reflect different adaptations of the strains. This plasticity could be associated with geographical differences of the strains as Micromonas showed a higher TOPT in the Canadian Arctic than did the strains from the European Arctic area that showed the lowest values (Lovejoy et al., 2007; Coello-Camba et al., 2015). According to our results, the TOPT estimated for the phytoplankton community from the Southern Ocean (5.2°C) was lower than that estimated for the Arctic phytoplankton community (6.5°C). This difference may be due to the limited connectivity of the polar waters of the Southern Ocean, as the Antarctic Convergence creates an oceanographic barrier that limits exchanges with warmer subpolar areas (Hasle, 1969). This lack of connectivity may result in a higher proportion of cold-adapted species and endemisms (Balech, 1970) that pull the TOPT average down.
The unimodal growth-vs.-temperature curves of both Arctic and Antarctic phytoplankton communities were characterized by left skewness (Dell et al., 2011), as reflected by the higher Ea calculated above than below the optimum (Dell et al., 2011). The Ea values for the fall traits fell within the confidence intervals and were close to the mean value determined by Dell et al. (2011), who performed a global analysis of the thermal Ea of various organisms. The Ea for the rise traits obtained here were low; nevertheless, they agreed with the mean value of 0.50 (±0.18) eV estimated by the same authors for unicellular organisms (Dell et al., 2011). According to this left skewness, phytoplankton living in polar oceans is expected to be more sensitive in responding to increased than to decreased temperatures, as the decrease in the growth rates above TOPT is sharper than the increase in these rates below TOPT (Thomas et al., 2012).
In the Arctic Ocean, summer SSTs have already surpassed the thermal thresholds observed here for phytoplankton. In 2013 at 70°N, temperatures remained above 6.5°C during the first 2 weeks of August, reaching a maximum value of 7.2°C on the 12 August 2013 (Figure 6). In contrast, during the last century, temperature increases in the Southern Ocean have been less severe (Christensen et al., 2007), with the highest warming described in the vicinity of the Antarctic Peninsula (Chapman and Walsh, 2007). At present, maximum SSTs in this area (80–50°W, 75°S-Antarctic Convergence) reach up to 4.2°C in January, 1°C below the TOPT for growth that we measured here for Antarctic communities.
Temperature predictions are especially relevant with respect to the Arctic spring bloom, a key process that accounts for the largest part of annual phytoplankton primary production (Lavoie et al., 2009). Leu et al. (2011) presented a conceptual model that described a close coupling between melting ice and primary production in the Arctic Ocean, where pelagic algal blooms require a considerable amount of thinning and broken-up ice. On the basis of Leu's model, Wassmann and Reigstad (2011) added predictions for future Arctic phytoplankton blooms that include earlier bloom development as the ice cover shrinks faster in spring (Wassmann and Reigstad, 2011). Increasing thermal stratification could prevent nutrient supplies during the post-bloom period, softening summer production peaks or even making them disappear (Wassmann and Reigstad, 2011). In addition, in those Arctic regions where strong wind-driven mixing events can weaken the strong vertical stratification, new fall blooms may appear (Ardyna et al., 2014), shifting toward a double bloom production mode, more typical in temperate waters.
Here we implemented both conceptual models by adding recent seasonal SST variability corresponding to year 2013 (http://www.ncdc.noaa.gov). At present, when spring blooms develop after the ice melts, the average temperature remains below 1°C (Figure 6), except at 70°N where there is no ice cover and the main bloom occurs between April and May. At 75°N, a weak and slow surface stratification in spring (Wassmann and Reigstad, 2011) delays the beginning of the bloom by a few weeks. At the heavily ice-covered latitudes of 80 and 85°N, the bloom begins even later in the year, after the ice melts closer to summer. In July 2013, temperatures increased faster at 70°N to a maximum of 7.2°C in August. This seasonal warming became less intense toward the pole, with a maximum SST of −0.4°C at 80°N. Finally, beyond 85°N where sea ice persists throughout the year, the temperature gradient is nearly absent and SST remains stable below −1°C (Figure 6).
We estimated the seasonal variability of SST in the Arctic Ocean by 2100 by assuming a 3°C increase over time, a rather conservative prediction taking into account that some regional climate models predict increases of up to 8°C by the end of this century (Collins et al., 2013). As in most future scenarios, our predictions are characterized by steeper temperature gradients with strong ice break-up processes. Predictions indicate that temperature increases would be stronger at the lowest latitudes. Spring temperatures are expected to remain below 1°C at 85°N, while average temperatures would rise higher at 70°N or 75°N as we approach 2100. In fact, throughout the year, conditions at 75°N will be similar to the present-day situation at 70°N, with thermal stratification becoming increasingly stronger at the lowest Arctic latitudes (Leu et al., 2011; Wassmann and Reigstad, 2011). Besides this, predicted SSTs at 70°N are expected to exceed the TOPT all summer long by the end of this century and during the first half of August at 75°N.
As the seasonal ice melts, temperatures will increase more abruptly, although our predictions for 2100 do not anticipate that SST will exceed the TOPT of Arctic phytoplankton growth in spring (Figure 6) when the bloom for primary production begins. Nonetheless, increased temperatures may lead to subsequent increases in the growth rates of phytoplankton (Figures 4, 5), resulting in a fast increase in blooming biomass. As a consequence, nutrient consumption may also be accelerated, giving way to a more rapid decrease at the end of the bloom (Figure 6). However, under this low emission future forecast, we expect that the TOPT threshold would not be exceeded in spring. Polar phytoplankton species should therefore be able to grow properly and dominate the spring blooms (Figure 6). If we also consider the predicted increase in pCO2 by 2100 (Meehl et al., 2007), the acceleration of the Arctic spring bloom could be even larger as a consequence of the fertilizing effect of pCO2. This could compensate present pCO2 limitation in those areas where nutrients are still available and temperatures remain below 6°C (Holding et al., 2015). This dependence of the fertilizing effect of increased pCO2 on temperature adds to the temperature threshold of 6.5°C predicted here for the growth of Arctic phytoplankton communities.
As the temperature of polar seawater increases, the principle of competitive exclusion implies that more thermo-tolerant phytoplankton groups (i.e., species or ecotypes) would out compete cold-water phytoplankton groups with lower growth TOPT in polar waters. Some phytoplankton species can exhibit phenotypic plasticity to temperature (Reusch and Boyd, 2013). Among cold-water communities, extremely low temperatures have forced specific cellular and physiological adaptations (Morgan-Kiss et al., 2006). Phytoplankton can adapt to temperature under stable conditions (Huertas et al., 2011). The low interannual variability in temperature of these extremely cold niches has helped that adaptation but environmental increases in temperature above the regular values is limiting the capacity of low-temperature phototrophs to adapt to large increases in SSTs (Morgan-Kiss et al., 2006; Bonebrake and Mastrandrea, 2010; Huertas et al., 2011). This way, under future increased temperatures, a compositional change of communities from less to more thermo-tolerant groups rather than local adaptive evolution would be expected.
According to this principle, once seawater temperatures in a warmer polar ocean surpass the TOPT of resident communities, these high-latitude niches will be opened up for incoming subpolar temperature-tolerant species. However, studies addressing the plasticity of phytoplankton species in polar waters to temperature changes are still limited, so predictions on community changes remain a challenge. Nonetheless, toward the end of this century, SSTs are expected to remain low during winter, with ice formation (Serreze et al., 2007) and limited light availability for primary production (Berge et al., 2015). Under these unfavorable conditions, many polar phototrophic plankton are able to persist by following different strategies such as facultative heterotrophy, storage and utilization of energy reserves at a reduced metabolic rate and formation of resting spores (Palmisano and Sullivan, 1982; Zhang et al., 1998). Incoming temperate species may not have the potential to survive such long periods of darkness (Peters, 1996; Peters and Thomas, 1996), and thus there are uncertainties in predicting their ability to offset polar species during the polar night. Polar species may then retain a competitive advantage surviving during the coldest months, and they will likely maintain their key role in seeding the subsequent spring polar bloom, as long as their optimum temperature for growth is not exceeded in spring. The income of subpolar phytoplankton species is more likely to happen in the Arctic Ocean, where advection processes help in connecting the polar ocean with waters at lower latitudes. Increased temperatures would favor the growth of the newly arriving groups that are already adapted to higher temperatures. In the Southern Ocean, atmospheric and oceanic patterns result in higher isolation (Hunt et al., 2016). This way, Southern Ocean phytoplankton communities might live in a narrower environmental temperature range, but they are less influenced by the influx of species from lower latitudes.
Future predictions describe a longer ice-free period in the Arctic Ocean and in some areas of the Southern Ocean, where ice will melt faster in spring and consequently make phytoplankton blooms begin earlier. According to our results, we expect that warming may lead to more intense but shorter spring bloom peaks in the Arctic Ocean. These alterations in the timing of blooms and ultimately in food quality could disrupt the delicate balance among trophic levels (Søreide et al., 2010) with implications for polar trophodynamics (Boyd et al., 2013).
The thermal threshold defined here for Arctic communities is already exceeded in August at the lowest Arctic latitudes. In future scenarios, this potential threat to phytoplankton will affect increasingly higher latitudes and move closer to the blooming season, extending into July and September. In fact, if we consider the RCP8.5 high-emission scenario described in the 2013 IPCC report, we can expect the TOPT to be exceeded in spring at 70°N before reaching the year 2100. The literature on species thermal performance suggests that once the TOPT is exceeded, the growth of organisms is constrained. Instead, if we consider a low-emission scenario, an intense increase in spring SST is not expected to take place during this century.
At present, polar studies are still quantitatively and geographically restricted, likely constraining our comprehension of the effects of global warming in polar oceans. Also, the temperature range of some of the growth-vs.-temperature curves included in this study were not wide enough to properly accommodate the optimum value, and nutrient limitation could constrain the growth results from some experiments. We highlight the importance of an increase in the number of species studied from the polar areas. More investigation is required to understand how predicted changes in environmental factors such as temperature, as addressed here, may influence polar phytoplankton in the decades to come.
Author Contributions
AC and SA were responsible for running all experiments, collecting data from the literature, performing data analysis and for writing and editing the manuscript.
Funding
This study is a contribution to the project ATOS (“Atmospheric inputs of organic carbon and pollutants to the polar ocean: rates, significance and outlook,” POL2006-00550) and ESASSI (Spanish contribution to the SASSI “Synoptic Antarctic Shelf-Slope Interaction” international project, P.N., POL2006-11139-C02-01/CGL) funded by the Spanish Ministry of Science and Innovation. AC was supported by grant BES-2007-15193. King Abdullah University of Science and Technology also supported this research.
Conflict of Interest Statement
The authors declare that the research was conducted in the absence of any commercial or financial relationships that could be construed as a potential conflict of interest.
Acknowledgments
We thank the BIO Hespérides crew and technical UTM personnel for their help and assistance during both cruises. We are also grateful to I. Gromicho for his help on the preparation of Figure 6, N. Carrillo for sampling assistance and C. M. Duarte for valuable comments about our data analysis and manuscript.
References
Angilletta, M. J. Jr. (2006). Estimating and comparing thermal performance curves. J. Therm. Biol. 31, 541–545. doi: 10.1016/j.jtherbio.2006.06.002
Anisimov, O., Fitzharris, B., Hagen, J. O., Jeffries, R., Marchant, H., Nelson, F. E., et al. (2001). “Polar Regions (Arctic and Antarctic),” in Climate Change 2001. Impacts, Adaptation, and Vulnerability. Contribution of Working Group II to the Third Assessment Report of the Intergovernmental Panel on Climate Change, eds J. McCarthy, O. Canziani, N. A. Leary, D. J. Dokken, and K. S. White (Cambridge, UK: Cambridge University Press), 801–841.
Ardyna, M., Babin, M., Gosselin, M., Devred, E., Rainville, L., and Trenblay, J.-E. (2014). Recent Arctic Ocean sea ice loss triggers novel fall phytoplankton blooms. Geophys. Res. Lett. 41, 6207–6212. doi: 10.1002/2014GL061047
Balech, E. (1970). The distribution and endemism of some Antarctic microplankters. Antarct. Ecol. 1, 143–147.
Barber, D. G., Hop, H., Mundy, C. J., Else, B., Dmitrenko, I. A., Tremblay, J. E., et al. (2015). Selected physical, biological and biogeochemical implications of a rapidly changing Arctic Marginal Ice Zone. Prog. Oceanogr. 139, 122–150. doi: 10.1016/j.pocean.2015.09.003
Berge, J., Renaud, P. E., Darnis, G., Cottier, F., Last, K., Gabrielsen, T. M., et al. (2015). In the dark: a review of ecosystem processes during the Arctic polar night. Prog. Oceanogr. 139, 258–271. doi: 10.1016/j.pocean.2015.08.005
Bonebrake, T. C., and Mastrandrea, M. D. (2010). Tolerance adaptation and precipitation changes complicate latitudinal patterns of climate change impacts. Proc. Natl. Acad. Sci. U.S.A. 107, 12581–12586. doi: 10.1073/pnas.0911841107
Boras, J. A., Sala, M. M., Arrieta, J. M., Sa, E. L., Felipe, J., Agustí, S., et al. (2010). Effect of ice melting on bacterial carbon fluxes channelled by viruses and protists in the Arctic Ocean. Polar Biol. 33, 1695–1707. doi: 10.1007/s00300-010-0798-8
Boyd, P. W., Rynearson, T. A., Armstrong, E. A., Fu, F., Hayashi, K., Hu, Z., et al. (2013). Marine phytoplankton temperature versus growth responses from polar to tropical waters–outcome of a scientific community-wide study. PLoS ONE 8:e63091. doi: 10.1371/journal.pone.0063091
Buma, A. G. J., Bano, N., Veldhuis, M. J., and Kraay, G. W. (1991). Comparison of the pigmentation of two strains of the prymnesiophyte Phaeocystis sp. Neth. J. Sea Res. 27, 173–182. doi: 10.1016/0077-7579(91)90010-X
Burrows, M. T., Schoeman, D. S., Buckley, L. B., Moore, P., Poloczanska, E. S., Brander, K. M., et al. (2011). The pace of shifting climate in marine and terrestrial ecosystems. Science 334, 652–655. doi: 10.1126/science.1210288
Chapman, W. L., and Walsh, J. E. (2007). A synthesis of Antarctic temperatures. J. Clim. 20, 4096–4117. doi: 10.1175/JCLI4236.1
Christensen, J. H., Hewitson, B., Busuioc, A., Chen, A., Gao, X., Held, I., et al. (2007). “Regional climate projections,” in IPCC Climate Change 2007: The Physical Science Basis, eds S. Solomon, D. Qin, M. Manning, Z. Chen, M. Marquis, K. B. Averyt, M. Tignor, and H. L. Miller (Cambridge, UK; New York, NY: Cambridge University Press), 849–940.
Coello-Camba, A., Agustí, S., Holding, J., Arrieta, J. M., and Duarte, C. M. (2014). Interactive effect of temperature and CO2 increase in Arctic phytoplankton. Front. Mar.Sci. 1:49. doi: 10.3389/fmars.2014.00049
Coello-Camba, A., Agustí, S., Vaqué, D., Holding, J., Arrieta, J. M., Wassmann, P., et al. (2015). Experimental assessment of temperature thresholds for arctic phytoplankton communities. Est. Coasts 38, 873–885. doi: 10.1007/s12237-014-9849-7
Collins, M., Knutti, R., Arblaster, J., Dufresne, J.-L., Fichefet, T., Friedlingstein, P., et al. (2013). “Long-term climate change: projections, commitments and irreversibility,” in Climate Change 2013: The Physical Science Basis. Contribution of Working Group I to the Fifth Assessment Report of the Intergovernmental Panel on Climate Change, eds T. F. Stocker, D. Qin, G.-K. Plattner, M. Tignor, S. K. Allen, J. Boschung, A. Nauels, Y. Xia, V. Bex, and P. M. Midgley (Cambridge; New York, NY: Cambridge University Press), 1029–1136.
Dell, A. I., Pawar, S., and Savage, V. M. (2011). Systematic variation in the temperature dependence of physiological and ecological traits. Proc. Natl. Acad. Sci. U.S.A. 108, 10591–10596. doi: 10.1073/pnas.1015178108
Etourneau, J., Collins, L. G., Willmott, V., Kim, J.-H., Barbara, L., Leventer, A., et al. (2013). Holocene climate variations in the western Antarctic Peninsula: evidence for sea ice extent predominantly controlled by changes in insolation and ENSO variability. Clim. Past 9, 1431–1446. doi: 10.5194/cp-9-1431-2013
Fiala, M., and Oriol, L. (1990). Light-temperature interactions on the growth of Antarctic diatoms. Polar Biol. 10, 629–636. doi: 10.1007/BF00239374
Flombaum, P., Gallegos, J. L., Gordillo, R. A., Rincón, J., Zabala, L. L., Jiao, N., et al. (2013). Present and future global distributions of the marine Cyanobacteria Prochlorococcus and Synechococcus. Proc. Nat. Acad. Sci. U.S.A. 110, 9824–9829. doi: 10.1073/pnas.1307701110
Hasle, G. R. (1969). An analysis of the phytoplankton of the Pacific Southern Ocean: abundance, composition, and distribution during the Brategg Expedition, 1947–1948. Hvalråd. Skr. 52, 1–168.
Holding, J. M., Duarte, C. M., Sanz-Martín, M., Mesa, E., Arrieta, J. M., Chierici, M., et al. (2015). Temperature dependence of CO2-enhanced primary production in the European Arctic Ocean. Nat. Clim. Change 5, 1079–1082. doi: 10.1038/nclimate2768
Huertas, I. E., Rouco, M., López-Rodas, V., and Costas, E. (2011). Warming will affect phytoplankton differently: evidence through a mechanistic approach. Proc. R. Soc. Lond. B. 278, 3534–3543. doi: 10.1098/rspb.2011.0160
Hunt, G. L. Jr., Drinkwater, K. F., Arrigo, K., Berge, J., Daly, K. L., Danielson, S., et al. (2016). Advection in polar and sub-polar environments: impacts on high latitude marine ecosystems. Prog. Oceanogr. 149, 40–81. doi: 10.1016/j.pocean.2016.10.004
Jacques, G. (1983). Some ecophysiological aspects of the Antarctic phytoplankton. Polar Biol. 2, 27–33. doi: 10.1007/BF00258282
Jahnke, J. (1989). The light and temperature dependence of growth rate and elemental composition of Phaeocystis globosa Scherffel and P. pouchetii (Har.) Lagerh. in batch cultures. Neth. J. Sea Res. 23, 15–21. doi: 10.1016/0077-7579(89)90038-0
Lavoie, D., Macdonald, R. W., and Denman, K. L. (2009). Primary productivity and export fluxes on the Canadian shelf of the Beaufort Sea: a modelling study. J. Mar. Syst. 75, 17–32. doi: 10.1016/j.jmarsys.2008.07.007
Leu, E., Hessen, D. O., Falk-Petersen, S., and Berge, J. (2011). Consequences of changing sea-ice cover for primary and secondary producers in the European Arctic shelf seas: timing, quantity, and quality. Prog. Oceanogr. 90, 18–32. doi: 10.1016/j.pocean.2011.02.004
Loarie, S. R., Duffy, P. B., Hamilton, H., Asner, G. P., Field, C. B., and Ackerly, D. D. (2009). The velocity of climate change. Nature 462, 1052–1055. doi: 10.1038/nature08649
Longhi, M. L., Schloss, I. R., and Wiencke, C. (2003). Effect of irradiance and temperature on photosynthesis and growth of two Antarctic benthic diatoms, Gyrosigma subsalinum and Odontella litigiosa. Bot. Mar. 46, 276–284. doi: 10.1515/BOT.2003.025
Lovejoy, C., Vincent, W. F., Bonilla, S., Roy, S., Martineau, M.-J., Terrado, R., et al. (2007). Distribution, phylogeny, and growth of cold-adapted picoprasinophytes in Arctic seas. J. Phycol. 43, 78–89. doi: 10.1111/j.1529-8817.2006.00310.x
Meehl, G. A., Stocker, T. F., Collins, W. D., Friedlingstein, P., Gaye, A. T., Gregory, J. M., et al. (2007). “Global climate projections,” in Climate Change 2007: The Physical Science Basis. Contribution of Working Group I to the Fourth Assessment Report of the Intergovernmental Panel on Climate Change, eds S. Solomon, D. Qin, M. Manning, Z. Chen, M. Marquis, K. B. Averyt, M. Tignor, and H. L. Miller (Cambridge; New York, NY: Cambridge University Press).
Morgan-Kiss, R. M., Priscu, J. C., Pocock, T., Gudynaite-Savitch, L., and Huner, N. P. (2006). Adaptation and acclimation of photosynthetic microorganisms to permanently cold environments. Microbiol. Mol. Biol. Rev. 70, 222–252. doi: 10.1128/MMBR.70.1.222-252.2006
Palmisano, A. C., and Sullivan, C. W. (1982). Physiology of sea ice diatoms. I. Response of three polar diatoms to a simulated summer-winter transition. J. Phycol. 18, 489–498. doi: 10.1111/j.1529-8817.1982.tb03215.x
Pančić, M., Hansen, P. J., Tammilehto, A., and Lundholm, N. (2015). Resilience to temperature and pH changes in a future climate change scenario in six strains of the polar diatom Fragilariopsis cylindrus. Biogeosciences, 12, 4235–4244. doi: 10.5194/bg-12-4235-2015
Parmesan, C. (2006). Ecological and evolutionary responses to recent climate change. Annu. Rev. Ecol. Evol. Syst. 37, 637–669. doi: 10.1146/annurev.ecolsys.37.091305.110100
Parsons, T. R., Maita, Y., and Lalli, C. M. (1984). A Manual of Chemical and Biological Methods for Seawater Analysis. Oxford: Pergamon press.
Payne, M. C., Reusser, D. A., and Lee, I. I. H. (2011). Moderate-Resolution Sea Surface Temperature Data and Seasonal Pattern Analysis for the Arctic Ocean Ecoregions. U.S. Geological Survey Publishing Network, Tacoma Publishing Service Center.
Peters, E. (1996). Prolonged darkness and diatom mortality: II. Marine temperate species. J. Exp. Mar. Biol. Ecol. 207, 43–58. doi: 10.1016/0022-0981(95)02519-7
Peters, E., and Thomas, D. N. (1996). Prolonged darkness and diatom mortality I: Marine Antarctic species. J. Exp. Mar. Biol. Ecol. 207, 25–41. doi: 10.1016/S0022-0981(96)02520-8
Raven, J. A., and Geider, R. J. (1988). Temperature and algal growth. New Phytol. 110, 441–461. doi: 10.1111/j.1469-8137.1988.tb00282.x
Reay, D. S., Priddle, J., Nedwell, D. B., Whitehouse, M. J., Ellis-Evans, J. C., Deubert, C., et al. (2001). Regulation by low temperature of phytoplankton growth and nutrient uptake in the Southern Ocean. Mar. Ecol. Prog. Ser. 219, 51–64. doi: 10.3354/meps219051
Reusch, T. B., and Boyd, P. W. (2013). Experimental evolution meets marine phytoplankton. Evolution 67, 1849–1859. doi: 10.1111/evo.12035
Sakshaug, E., and Holm-Hansen, O. (1984). “Factors governing pelagic production in polar oceans,” in Marine Phytoplankton and Productivity, eds O. Holm-Hansen, L. Bolis, and R. Gilles (Berlin: Springer), 1–18.
Serreze, M. C., Holland, M. M., and Stroeve, J. (2007). Perspectives on the Arctic's shrinking sea-ice cover. Science 315, 1533–1536. doi: 10.1126/science.1139426
Søreide, J. E., Leu, E., Berge, J., Graeve, M., and Falk-Petersen, S. (2010). Timing of blooms, algal food quality and Calanus glacialis reproduction and growth in a changing Arctic. Global Change Biol. 16, 3154–3163. doi: 10.1111/j.1365-2486.2010.02175.x
Stapleford, L. S., and Smith, R. E. (1996). The interactive effects of temperature and silicon limitation on the psychrophilic ice diatom Pseudonitszchia seriata. Polar Biol. 16, 589–594. doi: 10.1007/BF02329056
Suzuki, Y., and Takahashi, M. (1995). Growth responses of several diatom species isolated from various environments to temperature. J. Phycol. 31:880. doi: 10.1111/j.0022-3646.1995.00880.x
Teoh, M. L., Chu, W. L., Marchant, H., and Phang, S. M. (2004). Influence of culture temperature on the growth, biochemical composition and fatty acid profiles of six Antarctic microalgae. J. Appl. Phycol. 2:421. doi: 10.1007/s10811-004-5502-3
Thomas, M. K., Kremer, C. T., Klausmeier, C. A., and Litchman, E. (2012). A global pattern of thermal adaptation in marine phytoplankton. Science 338, 1085–1088. doi: 10.1126/science.1224836
Tilzer, M. M., and Dubinsky, Z. (1987). Effects of temperature and day length on the mass balance of Antarctic phytoplankton. Polar Biol. 7, 35–42. doi: 10.1007/BF00286822
Vaquer-Sunyer, R., Duarte, C. M., Santiago, R., Wassmann, P., and Reigstad, M. (2010). Experimental evaluation of planktonic respiration response to warming in the European Arctic sector. Polar Biol. 33, 1661–1671. doi: 10.1007/s00300-010-0788-x
Vona, V., Di Martino Rigano, V., Lobosco, O., Carfagna, S., Esposito, S., and Rigano, C. (2004). Temperature responses of growth, photosynthesis, respiration and NADH: nitrate reductase in cryophilic and mesophilic algae. New Phytol. 163, 325–331. doi: 10.1111/j.1469-8137.2004.01098.x
Wassmann, P., Duarte, C. M., Agustí, S., and Sejr, M. K. (2011). Footprints of climate change in the Arctic Marine Ecosystem. Global Change Biol. 17, 1235–1249. doi: 10.1111/j.1365-2486.2010.02311.x
Wassmann, P., and Reigstad, M. (2011). Future Arctic Ocean seasonal ice zones and implications for pelagic-benthic coupling. Oceanography 24, 220–231. doi: 10.5670/oceanog.2011.74
Keywords: phytoplankton, polar oceans, thermal threshold, climate change, spring bloom
Citation: Coello-Camba A and Agustí S (2017) Thermal Thresholds of Phytoplankton Growth in Polar Waters and Their Consequences for a Warming Polar Ocean. Front. Mar. Sci. 4:168. doi: 10.3389/fmars.2017.00168
Received: 08 August 2016; Accepted: 15 May 2017;
Published: 02 June 2017.
Edited by:
Paul E. Renaud, Akvaplan niva, NorwayReviewed by:
Geir Johnsen, Norwegian University of Science and Technology, NorwayPhilipp Assmy, Norwegian Polar Institute, Norway
Copyright © 2017 Coello-Camba and Agustí. This is an open-access article distributed under the terms of the Creative Commons Attribution License (CC BY). The use, distribution or reproduction in other forums is permitted, provided the original author(s) or licensor are credited and that the original publication in this journal is cited, in accordance with accepted academic practice. No use, distribution or reproduction is permitted which does not comply with these terms.
*Correspondence: Alexandra Coello-Camba, alexandra.camba@kaust.edu.sa