Use of Particle Tracking to Determine Optimal Release Dates and Locations for Rehabilitated Neonate Sea Turtles
 Natalie A. Robson1*
  Yasha Hetzel2
  Scott Whiting3
  Sarath Wijeratne2
  Charitha B. Pattiaratchi2
  Philip Withers1
  Michele Thums4
- 1School of Animal Biology, University of Western Australia, Crawley, WA, Australia
- 2School of Civil, Environmental, and Mining Engineering, UWA Oceans Institute, University of Western Australia, Crawley, WA, Australia
- 3Marine Science Program, Department of Parks and Wildlife, Kensington, WA, Australia
- 4Australian Institute of Marine Science, Indian Ocean Marine Research Centre, University of Western Australia, Crawley, WA, Australia
Sea turtles found stranded on beaches are often rehabilitated before being released back into the wild. The location and date of release is largely selected on an informal basis, which may not maximize the chance of survival. As oceanic conditions have a large influence on the movements of neonate sea turtles, this study aimed to identify the best locations and months to release rehabilitated sea turtles that would assist in their transport by ocean currents to the habitat and thermal conditions required for their survival. A particle tracking model, forced by ocean surface velocity fields, was used to simulate the dispersal pathways of millions of passively drifting particles released from different locations in Western Australia. The particles represented rehabilitated, neonate turtles requiring oceanic habitats [green (Chelonia mydas), hawksbill (Eretmochelys imbricata) and loggerheads (Caretta caretta)] and flatback turtles (Natator depressus) which require neritic habitats. The results clearly identified regions and months where ocean currents were more favorable for transport to suitable habitats. Tantabiddi, near Exmouth on the north-west coast, was consistently the best location for release for the oceanic species, with dominant offshore-directed currents and a very narrow continental shelf reducing the time taken for particles to be transported into deep water. In contrast, release locations with more enclosed geography, wide continental shelves, and/or proximity to cooler ocean temperatures were less successful. Our results produced a decision support system for the release of neonate marine turtles in Western Australia and our particle tracking approach has global transferability.
Introduction
Commonly, sick or injured sea turtles are taken into care and where possible are rehabilitated and released back into the wild (Louisiana Department of Wildlife and Fisheries and Audubon Aquarium, 2013; Craige, 2014). For most rehabilitation centers or management authorities, the decision process around the selection of release sites is not well documented. Others use a best available knowledge approach, such as releasing turtles at the location where they were found or where that species and size class are known to occur (Mandelc et al., 2002; Wallace, 2012; Louisiana Department of Wildlife and Fisheries and Audubon Aquarium, 2013; The Turtle Hospital, 2017). This best available knowledge approach is currently used in Western Australia, but given that all sea turtle species are threatened and the significant level of community labor and expense involved in rehabilitation, a more considered approach using multiple lines of evidence might increase chances of survival for these individuals (Caillouet et al., 2016). Quantitative data that incorporate knowledge of the species, size class and preferred physical environment would help guide effective decisions on release locations and dates.
Post-hatchling and neonate green (Chelonia mydas), hawksbill (Eretmochelys imbricata), loggerhead (Caretta caretta) and flatback sea (Natator depressus) turtles commonly strand in Western Australia (Department of Parks and Wildlife unpublished data). They are all listed as either vulnerable or endangered under the Australian Government's Environment Protection and Biodiversity Conservation Act 1999 (Environment, 2014) and as endangered or critically endangered (except the flatback which is data deficient) by the IUCN (IUCN Red List, 2014).
Sea turtles inhabit a range of ecosystems from terrestrial nesting grounds to developmental and foraging habitats in both coastal and oceanic water (Bolten, 2003; Putman et al., 2010; Shillinger et al., 2012). Loggerhead, green and hawksbill turtles follow the same oceanic-neritic developmental pattern (Collard and Ogren, 1990; Putman et al., 2012; Ascani et al., 2016). Early development occurs offshore until reaching a certain size range; 35–40 cm for hawksbill and green turtles (Moon et al., 1997; Hochscheid et al., 2007) and 65–90 cm for loggerhead turtles (Limpus and Limpus, 2003; Ascani et al., 2016). Later development then occurs on the continental shelf (Zug and Glor, 1998; Bolten, 2003; Scales et al., 2011). The Australian flatback turtle has a completely neritic developmental pattern, with no oceanic phase (Walker and Parmenter, 1990; Salmon et al., 2010).
Water temperature is critical to the survival and health of sea turtles with distributions usually limited to a minimum between 15 and 20°C (Coles and Musick, 2000; McMahon and Hays, 2006) but with variation between species. Sea turtles have been shown to experience a reduction in swimming ability in colder water and can cease feeding when they move into water below their minimum temperature range (Moon et al., 1997). Average sea surface temperatures along the Western Australian coast can range between 15 and 30°C, with the lower temperatures occurring between 32 and 36°S (Figure 1; NOAA 2015).
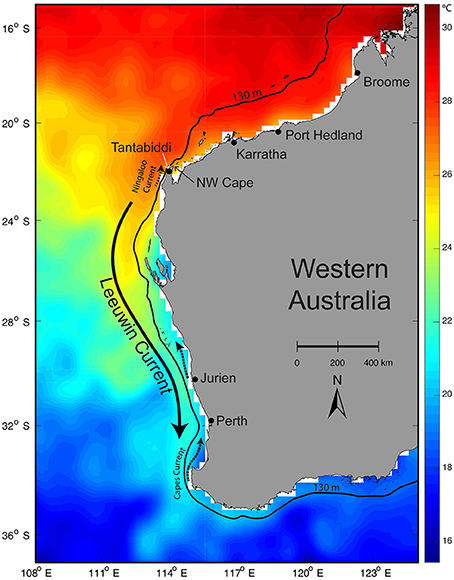
Figure 1. Map of Western Australia showing particle release sites/potential release sites of rehabilitated turtles along the Western Australian coast. Dominant coastal currents are indicated with arrows overlaying NOAA OIv2 sea surface temperature for 17 March, 2010 and 130 m depth contour is shown to indicate the continental shelf edge.
Whilst directional swimming is clearly a component of post-hatchling and neonate turtle's migratory paths (Hamann et al., 2011; Putman and Mansfield, 2015; Christiansen et al., 2016), ocean currents strongly influence their movement (Carr, 1987; Polovina et al., 2000; Gaspar et al., 2006; Bentivegna et al., 2007; Okuyama et al., 2009). The proximity of nesting beaches to favorable ocean currents highlights the importance of ocean currents to sea turtles, with higher nest densities found close to currents that promote hatchling dispersal to suitable habitats (Putman et al., 2010; Shillinger et al., 2012; Ascani et al., 2016). Ocean circulation along the WA coast is dominated by the Leeuwin Current system that consists of the southward flowing Leeuwin Current at the surface, underlying Leeuwin Undercurrent, and variable northward wind-driven coastal currents including the Capes and Ningaloo Currents (Figure 1). The Leeuwin Current flows contrary to other eastern boundary currents, transporting warm tropical water poleward along the continental shelf break (Cresswell and Golding, 1980; Pattiaratchi and Woo, 2009). This causes the favorable thermal range for turtles to extend to approximately 32°S, further poleward than for most other west coasts globally (Smith et al., 1991; Feng et al., 2003; NOAA, 2015). However, the Leeuwin Current system is highly variable, characterized by meanders and eddies and seasonal and inter-annual changes (Feng et al., 2003; Rennie et al., 2007). As a result, entrainment of rehabilitated juvenile turtles by the Leeuwin Current has the potential to transport the turtles far from their optimal habitat and, when they are expelled from the warm current, they may become stranded in sub-optimal water temperatures. As the strength and direction of currents (including local tidal and wind-driven currents) varies both spatially and temporally (Pearce and Phillips, 1988; Hanson et al., 2005), dispersal patterns of rehabilitated sea turtles should vary with release location and time of year, resulting in different end points and therefore survival rates.
Particle tracking models, driven by hydrodynamic models, are commonly used to determine potential dispersal/drift pathways of marine organisms, pollutants or other objects that can be transported by ocean currents. In a particle tracking model, virtual drifters representing marine organisms or other suspended matter are advected by ocean currents predicted by hydrodynamic models forced by atmospheric hindcasts or forecasts and predicted tides. Some particle tracking models ascribe behavioral attributes to the particles (e.g., swimming, vertical movements, directional cues) whilst others treat the virtual drifters as purely passive objects that are advected by the underlying ocean currents in order to reduce uncertainties, as much behavior is difficult to quantify and validate (Condie and Andrewartha, 2008; Condie et al., 2011; Lynch et al., 2014). For example, turtle movements globally have been extensively studied using particle tracking with ocean circulation models (Okuyama et al., 2011; Putman and He, 2013; Putman and Naro-Maciel, 2013; Proietti et al., 2014). Many of the studies on neonate and juvenile sea turtles use passive drifter models, assuming a minimal swimming influence (Okuyama et al., 2011; Proietti et al., 2014).
In this paper, we used a passive particle tracking model forced by predicted ocean currents and temperature, with particles released at varying times of the year and at multiple locations along the WA coastline (shoreline release of rehabilitated turtles is most common) to assess the influence of ocean circulation on particle trajectories and the potential movements of rehabilitated neonate sea turtles. We assessed each particle as successful or not based on the optimal habitat and thermal conditions required for their species and size-class and modeled success as a function of site, month and year for each species. Our objective was to provide a quantitative and objective approach for the selection the release locations and seasons where the probability of transport by ocean currents to favorable environments would be highest. The results will directly inform management agencies in their timing of release and selection of release sites and the methodology is transferrable to other regions.
Methods
We used a stepped approach to the problem of maximizing survivorship of rehabilitated turtles which involved:
1. Identifying species and size classes.
2. Identifying potential release sites.
3. Determining depth and temperature boundaries identified for each species and size class.
4. Developing a particle tracking model with an appropriate hydrodynamic model.
5. Developing criteria for particle/turtle success.
Species and Size Class
The size at which turtles utilize the open ocean varies between species (Bolten, 2003; Putman et al., 2010; Shillinger et al., 2012). Success criteria considered whether particles remained in water depths and temperatures that were favorable for each species survival (Coles and Musick, 2000; McMahon and Hays, 2006). Green and hawksbill turtles utilize the open ocean during neonate stages and recruit to inshore neritic habitats at approximately 40 and 30 cm curved carapace length (CCL) respectively (Moon et al., 1997; Hochscheid et al., 2007). Loggerhead turtles spend longer in the open ocean and recruit to neritic habitats across a large size range with the smallest at approximately 65 cm CCL (Limpus and Limpus, 2003; Ascani et al., 2016). Flatback turtles do not have an oceanic stage and remain on the continental shelf at all stages (Walker and Parmenter, 1990; Salmon et al., 2010). Therefore, these models will assist the return of green, hawksbill and loggerhead turtles of small sizes (oceanic life stages) to the open ocean and for the release of flatback turtles of all sizes to remain on the continental shelf.
Potential Release Locations
Turtles strand anywhere along the WA coast, with current rehabilitation centers located in the Perth Region (Bunbury, Rockingham, Hillarys) (Dolphin Discover Centre, 2015; Rockingham Regional Environment Centre Naragebup, 2015; AQWA, 2017), Shark Bay on the mid-west coast (Ocean Park, 2017), and in the northwest at Broome (Chelonia, 2017; Figure 1). Turtles are transported to rehabilitation centers by road and air. It is not always appropriate to release turtles at the site of stranding as many have been cold stunned or are far from their preferred conditions. Modeled release locations were selected based on proximity to rehabilitation centers and access for transport of turtles, with remote and unfeasible sites not considered. Although releasing rehabilitated turtles at sites near to rehabilitation centers reduces transport time to the release site, releasing turtles near to the Perth region centers is not recommended as these are located south of 32°S and outside the preferred water temperature of most species and size classes. Previously, the Department of Parks and Wildlife has released rehabilitated turtles at Exmouth, Karratha, and Broome based on logistics and local knowledge of species (Figure 1). To test release scenarios, we selected seven proposed release sites (including those previously used) across six regions covering a representative range of habitats (from north to south): Broome, Port Hedland, Karratha, Ningaloo (North West Cape and Tantabiddi), Jurien Bay, and Perth (Figure 1). Shark Bay sites were not considered due to limitations of the hydrodynamic model (Hetzel et al., 2013). Please see the Supplementary Material for a detailed description of the dominant physical processes in Western Australian waters that influence these sites.
Ocean Circulation Model
The particle tracking model was forced by surface velocity fields extracted from a hindcast application of the Regional Ocean Modeling System ROMS (http://www.myroms.org/) (Haidvogel et al., 2008). The ROMS hindcast was run without data assimilation for the years 2000–2016 and termed OzROMS (Wijeratne et al., in review). OzROMS is a fully three-dimensional (3D) high resolution circulation model, configured to include the entire Australian continental shelf, slope and the adjacent deep ocean using ROMS. The main advantage of the OzROMS model compared with other coarser resolution hindcasts such as the Bluelink ReANalysis (BRAN) (Oke et al., 2013) or HYCOM (Chassignet et al., 2007) is the inclusion of tides and higher resolution near the coast that includes processes not resolved in coarser models (Putman and He, 2013). Further details and validation of the OzROMS model are given in Wijeratne et al. (in review). Daily mean outputs of current velocity from OzROMS were used to drive the particle tracking model. Please see the Supplementary Material for a detailed description of the ocean circulation model.
Particle Transport Model
We used a particle tracking modeling framework, a commonly applied approach that uses current velocity fields from ocean circulation models, to force a Lagrangian drift model that calculates the trajectories of virtual “drifters” released in the model domain. For this, we used a freely available java tool, ICHTHYOP-3.2 (Previmer, 2010), which was designed to study the effects of physical factors on ichthyoplankton dynamics (Lett et al., 2008). This tool has been used successfully to model dispersal patterns of sea turtles (Proietti et al., 2014; Putman et al., 2016) as well as a range of other marine organisms (e.g., pelagic fish eggs and larvae, Pagán, 2003; Condie et al., 2011).
Simulated surface velocity fields from a high resolution 3-D ocean circulation model for Australia—OzROMS (Wijeratne et al., in review) were used to drive the ICHTHYOP-3.2 particle tracking model (see details below). Particles were “released” at the seven locations along the WA coastline corresponding to potential rehabilitated turtle release sites (Figure 1) in different months over a 2-year period (2010–2011). The particles were treated as passive drifters (no swimming behavior assigned), as the aim was to identify where and when ocean currents could act in the turtle's favor, not to investigate actual turtle dispersal patterns as turtle swimming behavior cannot be easily or realistically parameterized in these models, and attempting to do so would introduce unknown errors.
Based on a preliminary analysis of inter-annual variability over the 16 year OzROMS archive and a review of regional oceanography, two representative years were selected for particle tracking simulations. The model was run for 2010, representing conditions similar to a “normal” year, and 2011 to look at the effects of La Niña (Boening et al., 2012). These 2 years represent two contrasting extremes: 2010 was cooler than normal but with an average strength Leeuwin Current, whilst 2011 experienced above average temperatures and a strong Leeuwin Current (Boening et al., 2012). Conditions for other years are expected to be represented within the range of conditions experienced during 2010–2011. Spatial patterns common to both years would have a higher probability of occurring in any given year.
We used the Runge Kutta numerical advection scheme with a time step of 180 s to simulate the transport of particles forced by daily averaged surface velocity fields from OzROMS. The relatively small internal timestep was selected to ensure the particle model did not become unstable when high velocities and small grid cells were encountered. This internal 180 s time-step was paired with a record frequency of 240 s in ICHTHYOP 3.2, so that particle positions were recorded every 12 h. To account for horizontal dispersion caused by turbulent processes not resolved by ocean models, the particle tracking model included a random-walk component parameterized by the horizontal dispersion rate that was set to 1 × 10⁻⁹ m2 s−1 following Peliz et al. (2007).
The daily averaged OzROMS surface velocity fields meant that simulated particle trajectories included the residual (i.e., net) effect of tides but did not resolve movements related to individual flood or ebb tidal cycles. This only created limitations near shore in the far north of the region where extreme tides occur and this was taken into consideration when interpreting results.
Please see the Supplementary Material for a detailed description of the main user inputs for the particle tracking model.
Optimal Depth and Temperature Boundaries Identified for Each Species
Depth criteria were based on a literature review of the life cycles of each of the four species. The depth and temperature criteria used in this study may differ to similar studies, as here we used optimal conditions for a release and not mortality (Putman et al., 2012). Particles representing turtles requiring pelagic habitat (all except flatback turtles) were required to leave the continental shelf (>130 m) within 7 days of the release due to the high predation risk on the continental shelf (Bolten, 2003; Bornatowski et al., 2012; Putman et al., 2012). Successful particles representing flatback turtles (shallow water species) were required to stay on the shelf for at least 30 days (<130 m). Sensitivity tests showed that results were insensitive to the number of days chosen for the depth threshold at most sites, with the exception of the NW Cape site where probability of success increased by up to ~80% for all species when more lenient thresholds were chosen, indicating that results for NW Cape are a lower bound of success estimates.
Water temperature thresholds were set at 20°C for green (Moon et al., 1997; Hochscheid et al., 2007) and flatback turtles (Moon et al., 1997; Coles and Musick, 2000; Mandelc et al., 2002; McMahon and Hays, 2006), 18°C for loggerheads (Lutz et al., 1989; Polovina et al., 2004), and 15°C for hawksbills (Moon et al., 1997; NSW National Parks and Wildlife Service, 2002; McMahon and Hays, 2006). While turtles are able to survive temperatures below the criteria outlined above, and have been known to hibernate at extreme temperatures (Carr et al., 1980; Hochscheid et al., 2007), the temperature criteria outlined are considered optimum for success. Corresponding monthly averaged satellite sea surface temperature data from 1/4° resolution NOAA Optimum Interpolation OIv2 dataset (Reynolds et al., 2002) were used to quantify the temperatures experienced by each particle at each time-step. The monthly averaged temperature data were chosen to remove cloud effects and lessen the chances of a particle being deemed “unsuccessful” if it encountered a small patch of cold water not representative of the surrounding environment. By utilizing satellite SST instead of OzROMS temperatures we eliminated bias that may have been present in the model.
Criteria for Particle Success
Post processing of particle trajectories to determine the “success” of each particle considered that each particle represented a turtle of each of the four species that commonly wash ashore in Western Australia.
The associated temperature and water depth for each particle along the predicted pathways were extracted for each time step and each particle was assessed as passing the criteria or not. Particles were classed as unsuccessful if any of the following occurred:
1. Particles came back on shore (beached).
2. Particles did not leave the shelf (<130 m) within 7 days (green, hawksbill and loggerhead turtles) or particles drifted into deep water (>130 m) within 30 days (flatback turtles).
3. Particles experienced water temperatures below species-specific thresholds.
Data Analysis and Interpretation
In order to determine which sites and months were best, we calculated the proportion of successful particles for each month, site, year, and species, then a suite of generalized additive models (GAM) were constructed for each species using the MGCV (Wood, 2011) library in R (R Core Team, 2014), including all combinations of the individual variables, the two-way interactions and the three-way interaction. Success of particles for each species was the response variable where prior weights were used to give the number of trials (total number of particles in our case) and site, year and month were predictor variables. Month was modeled as a continuous variable whereas site and year were categorical variables. We compared and ranked models using weights of Akaike's information criterion (AIC). AIC weight varies from 0 for no support to 1 for complete support (Burnham, 2002), relative to all models in the set. We also calculated the percent deviance explained as a measure of goodness of fit.
For plotting purposes, we also calculated seasonal means (of all criteria) for the core austral season months [i.e., summer (Jan-Feb), autumn (Apr-May), winter (Jun-Jul), spring (Sep-Oct)]. Particle trajectories were interpolated onto a 0.1° grid and the percent of particles passing through each grid cell and the mean drift time to each cell were determined for monthly and seasonal means of all particle releases.
Based on the analysis of the relative success of the particles, we developed a decision support system for what constitutes a successful release site and time for each turtle species. The sites and months were categorized based on the probability of success. These categories were classified as “Very High” (70–100%), “High” (50–70%), “Medium” (30–50%) and “Low” (1–30%). For neritic species (flatback turtles) the category “Indeterminate” (1–30%) was added instead of the “Low” category, as the model results were considered less reliable in places where many particles beached and the total sample size was small. By definition, neritic species remain near shore, and any oceanic features that act to retain turtles (particles) at the coast would in fact be beneficial to their survival. For example, consistently strong onshore winds during the wet season along the north coast caused large numbers of particles to become “beached” in the model simulations, while in reality the likelihood of “beaching” is much less due to the turtles' ability to swim. Irregardless of swimming ability particles are very unlikely to be transported into deep and/or cold water under these conditions. Therefore, even if quantification of probability of success of neritic species is not possible with this model configuration, qualitative conclusions about regions and times more favorable for neritic species can still be made and results are still useful for management purposes. The lower categories should only be considered if no higher options are available and the turtle needs to be released.
Results
Statistical Analysis
The majority of release sites were not successful, with only Tantabiddi, NW Cape and Jurien Bay showing success in some months for the green, hawksbill and loggerheads, and Broome, Port Hedland, Karratha and NW Cape for flatbacks, so the statistical model therefore only included these sites. There was high variability in success between months, sites and years (Figure 2), with the additive model including the three way interaction between site, year and month having majority support for all three species (wAIC = 1) and the proportion of deviance explained ranging from 0.61 to 0.66. Out of the three individual factors, site accounted for largest proportion of the deviance explained (0.43 for green turtles, 0.33 for hawksbill turtles and 0.35 for loggerhead turtles). The three way interaction accounted for an additional proportion of 0.24 for green turtles and 0.28 for hawksbill and loggerhead turtles.
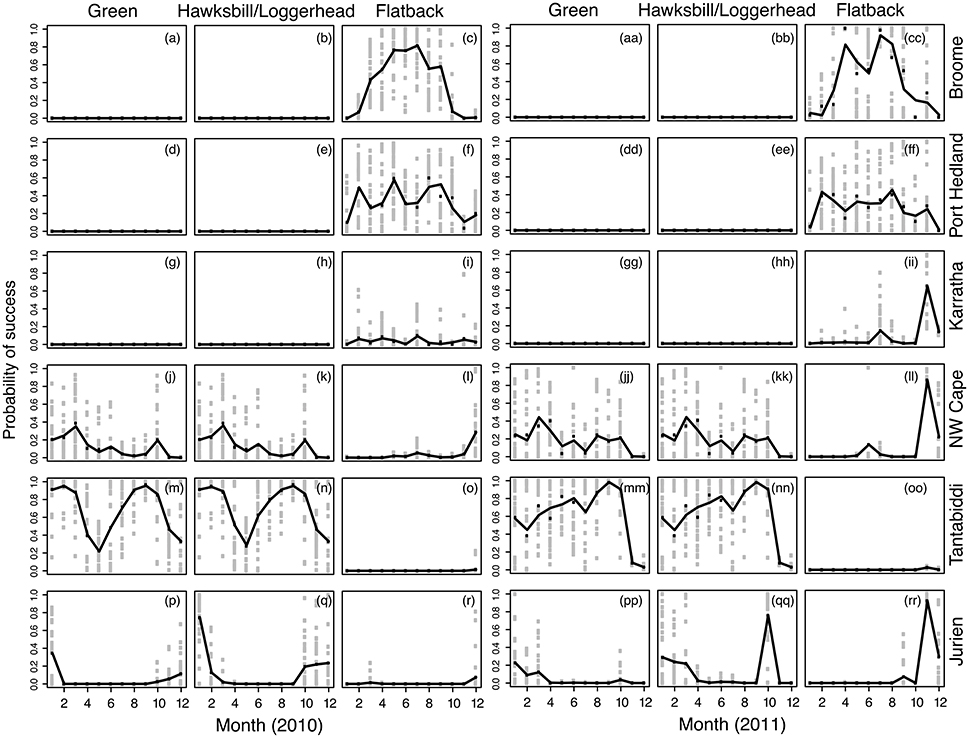
Figure 2. Predicted probability of success (success of each particle is determined by the criteria: temperature, distance offshore, and beaching) from the model used to explain the relationship between particle success and month, site and year for each turtle species. Panels (a–r) display the probability of success across species, site and month for 2010 and Panels (aa–rr) display the species, site and month for 2011. Plots for hawksbills and loggerheads are combined as they had alike results due the similar criteria used for success. Shown in black is the fitted line and gray points are average daily success and black points are mean monthly success.
Tantabiddi was the most successful site (5.90–99.1%), across all months and years for greens, hawksbills, and loggerheads (Figures 2m,n,mm,nn). Seasonal trends were also clear, with a higher probability of success in late summer (January and February) and early spring (September and October) compared to autumn and winter in 2010 (Figures 2m,n). The particles released in 2011 showed different seasonal trends for these species, with a higher probability of success in the cooler months, including autumn, winter and early spring (Figure 2). For flatback turtles, Broome was the most successful site with a higher probability of success in the cooler months, including autumn, winter (Figures 2c,cc) and only minor differences between years. Although the probability of success was higher during the cooler months due to retention of particles on the shelf in warm water in the northern region, a more qualitative interpretation where particles retained at the shoreline is beneficial eliminates the seasonal dependence for success across the north where monsoon winds reverse seasonally. The Perth region (the region supporting most of the rehabilitation centers) had the lowest success as a release site as many particles either beached or were transported into cold water.
Particle Trajectories and Environmental Variables
The differences in particle dispersal pathways (and thus relative success as a turtle release site) between sites and months are explained by local bathymetry, surface current regimes, and winds (Figures 3, 4). The most important factor determining particle success was advection into unsuitable depths (due to beaching and width of the continental shelf) whilst exposure to cold temperatures was secondary (Figure 5). This was in part because drift times to reach cold water were often greater than the 60 day drift duration prescribed to the particles (Figure 4). Seasonality was more important at some sites than others, with inter-annual differences less important than site and season. Across all sites, there was a strong link between “success” and the width of the continental shelf—where the shelf was narrow, particles were more likely to end up in deep water and vice versa (Figures 1, 4). In the north (Broome to Karratha), particles generally remained on the shelf due to the wide shelf and weaker residual currents. Along the west coast from NW Cape to Perth, the strong Leeuwin Current and eddies dispersed particles over a much broader area, and further south along the coast (Figure 3).
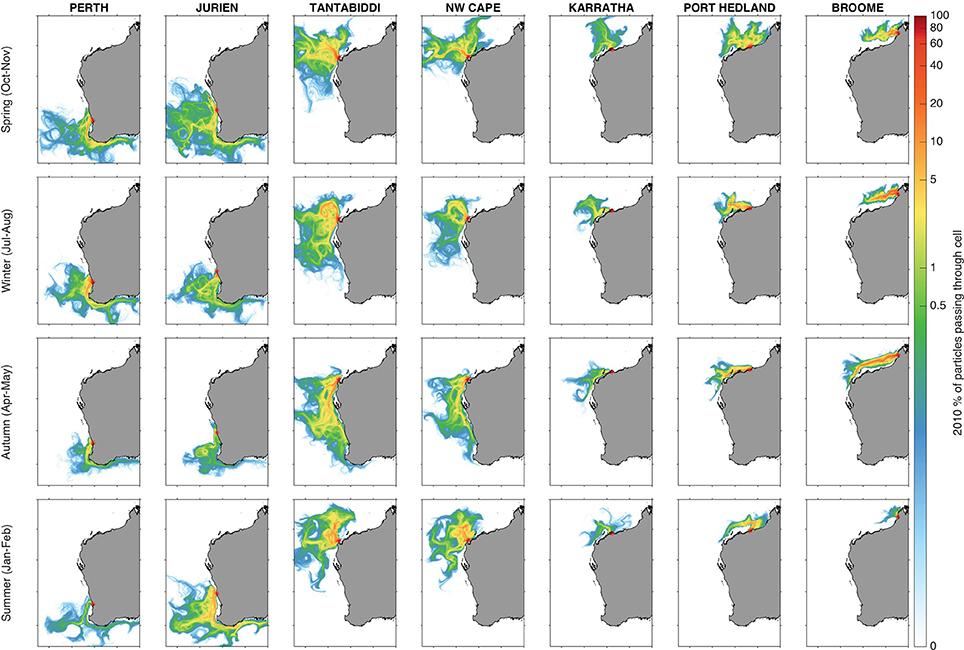
Figure 3. 2010 Seasonal averaged drift trajectories for all seven sites indicating percent of particles passing through each grid cell (seasonal averages of particles released for one month and drifting for 2 months). Red asterisk indicates release location and the color bar is scaled logarithmically to show relevant gradients.
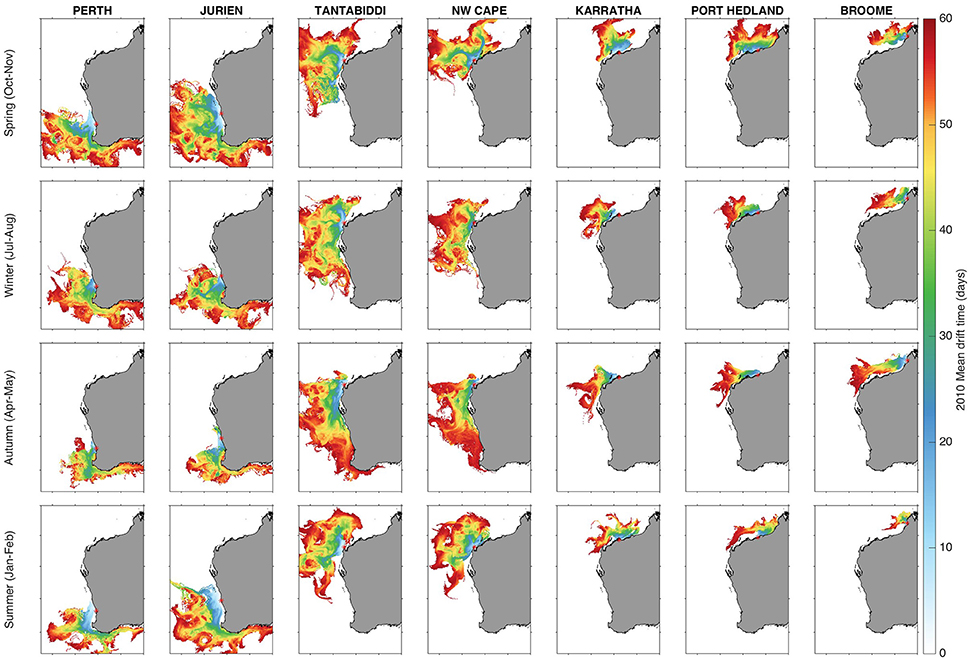
Figure 4. Mean seasonal drift time in days for particles released at seven sites along the Western Australia coast during 2010. Each map shows the mean of ~60,000 individual particle tracks.
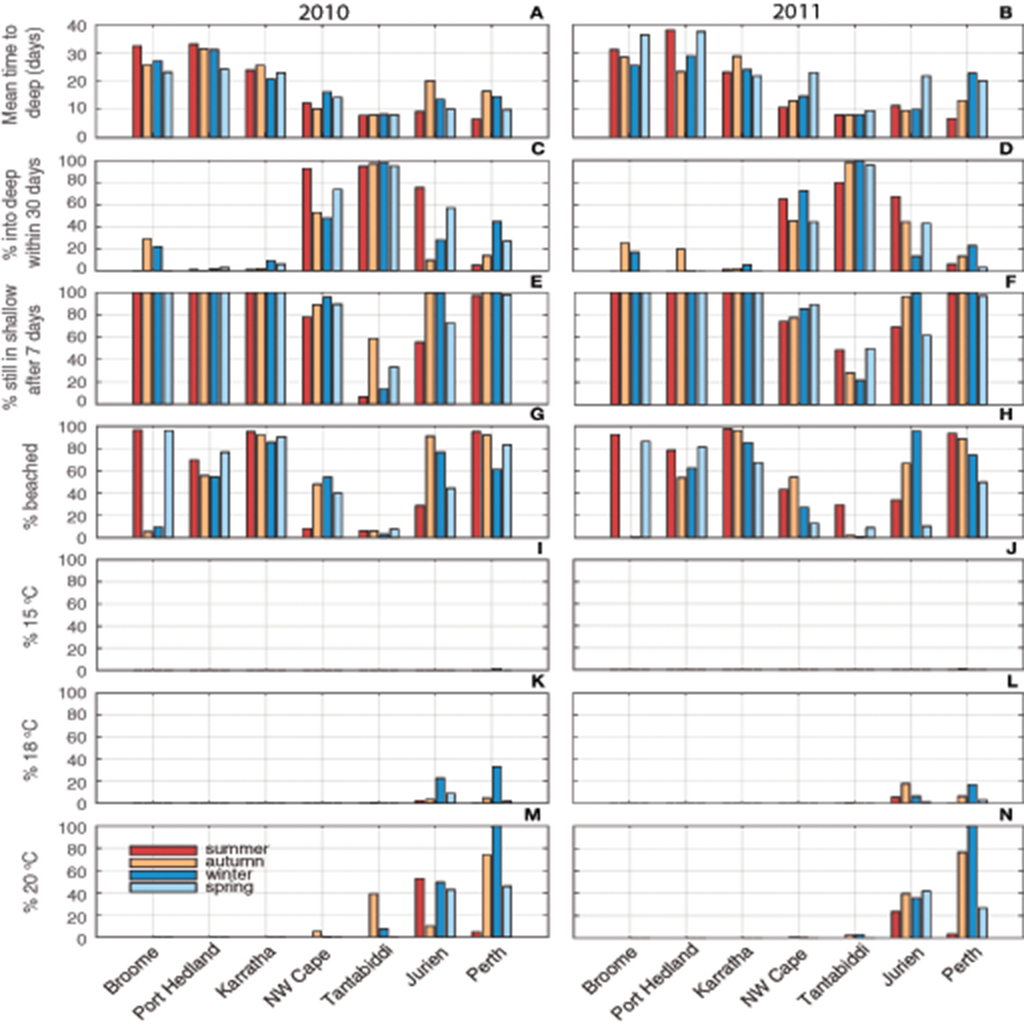
Figure 5. Proportions of particles fulfilling each criteria used to determine success, including 2010 and 2011 seasonal averages for seven sites of (a,b) mean time in days for particles to reach the edge of the continental shelf (>130 m depth); (c,d) proportion of particles that drifted into deep water (>130 m) within 30 days—if so, flatback species were unsuccessful; (e,f) proportion of particles that were still in shallow water (<130 m) after 7 days—if so, deep water species were unsuccessful; (g,h) proportion of particles that beached resulting in failure for all species; (i–n) proportion of particles experiencing temperature thresholds of 15, 18, and 20°C relevant to each corresponding species.
Inter-Site Variability
The strongest determinant of success rates was variability in the time for particles to drift into deep water and beaching. Along the north coast (Karratha-Broome), the mean time to reach deep water was 20–30 days; for Ningaloo sites it was ~10 days; and for the SW sites 10–20 days (Figures 4, 5). Greater than 80% of particles were still in shallow water after 7 days at all sites except Tantabiddi (Figures 5g,h), explaining the poor success for oceanic species at most sites. Only at NW Cape, where particles took closer to 14+ days to reach deep water, were success rates increased substantially if the threshold was longer. Correspondingly, near zero counts of particles drifted into deep water within 30 days along the north coast (explaining higher flatback success at sites on the north coast, Figures 2c,f,i,l); >50% at Ningaloo sites, and variable rates up to 50% at SW sites (Figures 5c,d). Rates of beaching were more variable among sites, but followed similar patterns and ranged from >90% at Karratha and Broome to <5% at Tantabiddi. More than half of all particles beached at all sites except Tantabiddi (Figures 5g,h), particularly those sites with enclosed geography such as Perth and Karratha.
Temperature effects explained less of the success rates than the depth criteria but did show high variability between release sites. Particles released at the southernmost sites were more likely to breach the temperature criteria. At the Perth site the particles were transported south with the Leeuwin Current in all months (Figure 3), carrying <5% of the particles into water temperatures <15°C and 20–30% into water below 18°C. Jurien particles experienced similar counts into 18°C water (20–30%), mostly during winter (Figures 5i–l). Whilst the particles generally still moved southward with the Leeuwin Current across all months, they also moved further offshore in some months, and occasionally drifted north with the Capes Current during summer and spring (Figure 3). Fewer particles experienced water below 20°C at the more northerly sites, reducing from 100% at Perth to <5% at NW Cape. Along the north coast no particles experienced water below 20°C (Figures 5m,n), resulting in these sites being best suited for flatbacks requiring neritic habitat and water temperatures >20°C.
Particles released at Tantabiddi, the most successful site for oceanic life stages, were transported in more northerly and offshore directions, with the particles generally advected quickly offshore and remaining offshore for the duration of the drift phase in warm water (Figure 4).
Seasonal and Inter-Annual Variability
Along the west coast, drift pathways varied with season, with the particles moving southward and closer to shore in autumn and at the start of the winter, whilst moving northwards and offshore in summer and spring (Figure 3). At all sites except Tantabiddi that experienced little seasonality, there was a 5–10 day change in the mean-time to drift into deep water between seasons (Figures 5a,b). The pathways from NW Cape followed the same seasonal patterns observed at Tantabiddi (Figure 3). However, the particles released at NW Cape took longer to get offshore, with more seasonality, and less direct pathways to deep water, thus influencing their overall success as a turtle release site. Stronger southerly winds that occurred during summer and spring (more so in 2010 than 2011) reduced transport time to deep water (Figures 5a,b), improving success for oceanic life stages (Figures 2j–n).
Along the north coast of WA at Karratha, Port Hedland, and Broome, the majority of particles took longer to leave the wide continental shelf and were more likely to beach. These pathways were different across seasons, with the particles advected west and south in the autumn and winter months (dry season), while moving north and east in summer and spring (wet season) (Figure 3). This region is influenced by SE trade winds during the dry season and NW monsoon winds during the wet season (See Supplementary Material for more detail). At Broome almost all particles were beached during the wet season, and <20% beached during the dry season when offshore winds advected particles away from the coast (Figures 5i,j). Despite the high rates of beaching (and inability to quantify success during the wet season at Broome), a qualitative interpretation that considers beached particles as successful for flatback species, would indicate that flatback success may not be limited to a certain time of the year.
Similarly, in the SW (Perth, Jurien), the highest beaching rates occurred due to onshore currents/winds, except in this case those winds were associated with winter cold fronts approaching from the South Indian Ocean. Generally, cold fronts (and onshore winds) do not extend as far north as Ningaloo and so those sites experienced less seasonal variability and less beaching.
The Leeuwin Current was stronger and water temperature was warmer in 2011 compared with 2010. This warmer water was advected relatively further south and as a result the pathways in 2011 (Figure S1) were slightly different compared to 2010 (Figure 3). The seasonal patterns were still very similar to those observed in 2010, with the particles moving southward in the autumn and winter months, and moving northwards in summer and spring across most sites (Figure 3; Figure S1). The only sites that differed substantially between years were Jurien and Tantabiddi. The particles released from Jurien in summer 2011 initially moved further north in the Capes current (Figure S2), before being transported south in the Leeuwin Current. During autumn of 2011 at Jurien, particles were ~10 days faster to move off of the shelf (Figures 5a,b), and were also less likely to experience water <18°C (Figures 5m,n). Likewise, fewer particles released from Tantabiddi in autumn and winter 2011 moved into colder waters (Figure S1), compared with 2010 (Figures 5m,n). Particles released in summer of 2011 took a longer time to get offshore than in 2010 presumably due to weaker wind conditions during this period (Figures 5a,b).
Decision Support System
Based on the results of the particle transport model, a decision support system for when and where to release rehabilitated sea turtles was developed for each species under both 2010 (weak El Niño/neutral ENSO) and 2011 (strong La Niña) conditions. This system, in the format of a flow diagram (Figure 6), was designed to be easily applied by conservation managers. For oceanic species (green turtles less than 40 cm CCL, hawksbill turtles less than 30 cm CCL and loggerhead turtles less than 65 cm CCL) the best release site, under “normal” conditions, is Tantabiddi in summer and winter, and under La Niña conditions the optimal release is from Tantabiddi in autumn, winter and spring (Figure 6). Tantabiddi also provides the benefit of providing inshore habitat if turtles in the larger range recruited early to the nearshore habit. For neritic species (flatback turtles of all sizes) the best release site, under “normal conditions” is Broome in winter, followed by the average release sites; Port Hedland in summer, autumn and winter, and Broome in autumn (Figure 6). Under La Niña conditions the optimal release site for neritic species is Broome in autumn and winter, followed by the average release sites; Port Hedland in winter and Karratha and NW Cape, in spring (Figure 6). A qualitative interpretation that considers beached particles as successful for flatback species, would indicate that flatback success may potentially be higher at many protected sites, particularly along the entire north coast, and may not be seasonally limited. Although Jurien and Perth were found suitable by the model, they were excluded because flatbacks are not commonly found at these locations.
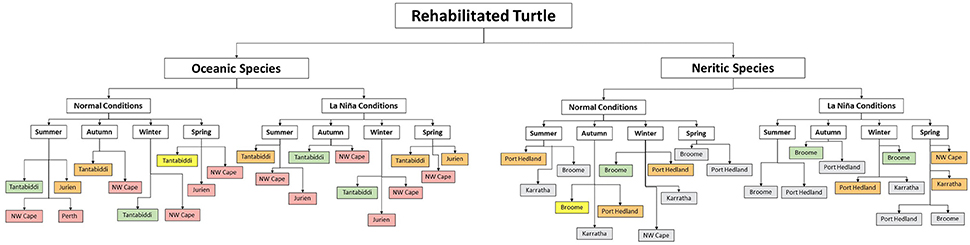
Figure 6. A decision support system to inform the release of rehabilitated sea turtles, with both oceanic and neritic life histories, in Western Australia based on 2010 (normal) and 2011 (La Niña) conditions. The colors indicate the suitability of a site in relation to the percentage of successful particles; green is “Very High” (70–100%), yellow is “High” (50–70%), Orange is “Medium” (30–50%), red is “Low” (<30%) and gray is “indeterminate” (<30%).
Discussion
Turtle migration and transportation by ocean currents has been widely studied using particle tracking with ocean circulation models, for both adult and neonate turtles, but this study was to our knowledge the first to attempt to use it to provide a quantitative approach to the selection of release sites and timing for rehabilitated sea turtles. We found that release site, year, and month were important parameters in explaining the success of released particles and therefore these factors will all be important in influencing the success of released, rehabilitated sea turtles to oceanic habitat. Within Western Australia, Tantabiddi, near Exmouth, is the optimal site to release oceanic life-stage green, hawksbill and loggerhead turtles. Whilst turtles are not passive particles and have the ability to influence their own pathway and orientation, we have identified the release sites and seasons that will result in the most favorable oceanic conditions for rehabilitated turtles to be released at, with the highest probability of being transported to the correct habitat and thermal conditions required for them to survive.
The higher success of particles released in 2010 in the summer and spring months, compared to the autumn and winter months, could be due in part to the changing strength of the Leeuwin Current. The current flows weakly against maximum southerly winds in October to March, and is stronger in April to September due to the absence of dominant southerly winds and other factors (Godfrey and Ridgway, 1985; Woo et al., 2006; Ridgway and Godfrey, 2015). This caused more particles to be transported south in autumn and winter into cooler waters resulting in lower success. Along the Western Australian coast, southerly winds are prevalent in spring and summer; stormy conditions with no prevailing wind direction in winter; and, generally weaker winds during autumn (Verspecht and Pattiaratchi, 2010). The winter storms usually last 1–2 days and are related to the passage of frontal systems, when the region is subject to strong winds from the north-west, which rapidly changes direction to the west then south-west over 12–16 h, gradually weakening over the subsequent 2–3 days. These wind patterns likely affected the success of particles. The generally weaker winds in autumn and winter storms caused more particles to be blown onshore or become beached or remain on the shelf for a longer period of time, whilst the southerlies in summer and spring could prevent the beaching of particles. The sea breeze system is superimposed on the larger scale atmospheric circulation in the region during summer months and tends to dominate water movements near shore (Pattiaratchi et al., 1997). In this system, differential heating of the land and ocean causes a diurnal cycle of offshore directed winds at night and during the morning and strong onshore directed flow during the afternoon when land heats up. Although the particle tracking model provides an estimate of the net movement on the daily time scale, improved success could be achieved if turtles were released during favorable weather conditions when local winds blow offshore and assist their migration offshore.
Particles released in 2011 had higher success in the autumn and winter months than those released in 2010, particularly at the Ningaloo sites. The differences between the years could be attributed to the effects of La Niña (Boening et al., 2012). The 2010/11 La Niña resulted in a stronger Leeuwin Current that intensified earlier than normal in February (Pearce and Feng, 2013). This had the largest impact on the success of particles in the autumn and winter months when the Leeuwin Current is already seasonally strong (Godfrey and Ridgway, 1985; Woo et al., 2006). The particles released in summer in 2010 had a greater percentage of survival than those released in summer 2011. In summer and spring southerly and easterly winds are more prevalent (Bureau of Meteorology, 2014), assisting the transport of particles offshore. However, in 2011 lighter winds were experienced (Boening et al., 2012), which could have resulted in the lower success in summer 2011. The stronger than normal LC during summer in 2011 could have also contributed to this, but it is difficult to determine the exact cause owing to the high number of factors involved.
This inter-annual variability in ocean current velocity and particle dispersal patterns has previously been shown in other particle tracking studies (Hays et al., 2010). This variability between dispersal patterns indicates the importance of particle tracking, for turtle releases and other ocean migration and connectivity studies. These studies can be done using past data from years with similar oceanographic and weather conditions or by using real-time forecasts of ocean currents and the same particle tracking methodology applied here. Comparing those results to what we presented here would be the best approach. In addition to this inter-annual variability, seasonal current bifurcation was observed at most sites. In general, northward coastal currents are restricted to summer and spring seasons with dominant southward flow in autumn and winter. These seasonal drift patterns have been shown to influence hatchling dispersal and subsequent adult migration routes (Scott et al., 2014). This current divergence could explain the different migratory paths taken by nesting female sea turtles (Hays et al., 2010; Whittock et al., 2014). Particle tracking can therefore be used to assist in the prediction of migration patterns of adult turtles, based on the year and season that they hatched, as well as hatchling dispersal patterns.
One of the main criteria for the success of the three oceanic species was being transported off the continental shelf within 7 days and a very high percentage of particles released at Tantabiddi achieved this. This could be attributed to the narrow continental shelf in this area which is the narrowest on the entire Australian mainland (Woo et al., 2006), meaning that particles were likely to be transported off the continental shelf faster at Tantabiddi due to a shorter distance compared to the other sites. Previously the majority of turtles rehabilitated in Western Australia have been released from NW Cape, with very little success. Our study indicated that particles released at NW Cape took longer to move offshore into deep water resulting in lower success (below 40% across all seasons in both years). Over 50% of particles released from NW Cape took more than 7 days to leave the continental shelf across all months and years. Sensitivity tests indicated that increasing the number of days allowed for particles to move into deep water could dramatically improve success at NW Cape, indicating that our results were somewhat sensitive to the exact time threshold chosen. Previous studies have found a strong correlation between nest density and the distance to favorable currents (Putman et al., 2010). Shorter distances offshore will increase the likelihood of hatchlings reaching favorable currents and suitable habitats, as well as decreasing the risk of predation (Putman et al., 2010). This supports our results and favors Tantabiddi over the NW Cape as the optimal release site for rehabilitated neonate turtles (Figure 4). Targeting release dates to favorable local conditions such as strong southerly or easterly winds and an outgoing tide to assist turtles offshore could improve success compared to the non-targeted approach assessed here. However, given the proximity of the Tantabiddi site, it would make more sense to release turtles there, where they have higher chances of success. Whilst our results showed that many of the release sites tested here resulted in zero success, it is important to remember that we did not account for turtle swimming ability in our particle tracking model, so that actual success of real rehabilitated turtles could be higher. Success at some sites could be increased slightly by releasing further offshore and subsequently reducing the likelihood that the particles (turtles) would beach. However, releasing further offshore would not change the general advection patterns and further distances may not be feasible for rehabilitation centers.
The particles released from Jurien in 2010 were more successful in summer. This could be due to the weaker Leeuwin Current at this time of the year and/or the existence of a northward flowing Capes Current (Godfrey and Ridgway, 1985; Woo et al., 2006). With a weaker Leeuwin Current, less particles were transported south into cooler water. However, in 2011 the Leeuwin Current flowed stronger in summer and transported more particles south (Feng et al., 2003; Boening et al., 2012). This indicates that during a “normal” year, Jurien could be considered for release of turtles in summer, although the probability for success is much lower than at Tantabiddi.
Flatback turtles need to remain on the continental shelf and in warm water, above 20°C (NSW National Parks and Wildlife Service, 2002; (McMahon and Hays, 2006). Theoretically, Broome is an ideal release site as there is a wide continental shelf and warm water. However, becoming beached was a major cause of failure for flatback turtles at the Broome site, particularly in summer (wet season) when winds were generally from the west, so the highest rates of success would likely be achieved during the dry season. In reality, success would likely be higher across all sites and seasons than the models predict, as turtle's swimming ability would decrease the likelihood of beaching (Carr, 1987; Polovina et al., 2000; Bentivegna et al., 2007; Okuyama et al., 2009). While the model does not accurately give the probabilities for success for flatback turtles in some regions due to high beaching rates, the results do indicate where currents act to retain particles nearshore, which is ideal for this species. High levels of beaching can therefore be interpreted as favorable for flatback success.
As our aim was to identify where and when ocean currents could act in favor of rehabilitated, released turtles, we purposefully did not account for turtle swimming ability so as to not introduce unknown errors into our modeled dispersal pathways. As we have suggested, the low probability of success that we predicted for flatback turtles due to particle beaching and the zero probability of success for the oceanic species at some sites, might not be realistic in relation to real turtles given that their swimming behavior would clearly influence the modeled pathways. This would be especially true for the larger size classes and our modeled pathways might be more representative of small neonates around <20 cm CCL and for species requiring oceanic habitat (Bolten, 2003). We acknowledge this limitation but argue that our approach has met the stated objective of informing management agencies in the selection of the best times and sites for release and our approach would be equally successful in other areas around the world needing decision support for the release of rehabilitated turtles. Another important factor influencing these results is the large tidal influence in north Western Australia. The OzROMS model output used to drive the particle model consisted of daily velocity fields rather than hourly velocity fields. This is not an issue when the particles are released further offshore, as the path the particles follow is very similar. However, when the particles are released closer to shore, the trajectories resulting from hourly velocity fields are much more variable at short time scales than those computed from the averaged currents. Resolving instantaneous tidal velocities in the particle tracking model, however, would further compound issues related to beaching and would require more complex particle behavior that introduces yet more uncertainty in the results. The results from this study can therefore be considered conservative estimates for Broome, Karratha, and Port Hedland, as these are sites with larger tidal ranges and more enclosed topography. However, since the particles were released offshore and the analysis identified robust general patterns across sites and seasons, we are still confident of the recommendations we provide here. Due to the strong tidal currents at these northern sites, it is important to release flatback turtles at high tide and at a greater distance from shore to prevent beaching or becoming unnecessarily fatigued.
Turtle rehabilitation is often community driven with dedicated groups and individuals spending their own time and money to care for sick and injured individuals. The value of rehabilitation is not only through the release of a healthy individual into the population, but extends to community education and capacity building, scientific information on threats through a compilation of stranding events and through general community support to sea turtle conservation. The final step in the rehabilitation process is the release of the individual into suitable habitat (Caillouet et al., 2016). This study provides a quantitative process to assist conservation decision makers to select release sites and dates to provide these rehabilitated turtles the best survival chance post-release. For each release, logistical factors must also be considered which include a consideration of the transport options available (e.g., air or road), minimizing overall travel time between rehabilitation center and release site and staff support at both ends. For individuals requiring oceanic habitat, releasing the turtles offshore using a vessel should always be considered.
Conclusions
Analysis of more than 3,000,000 simulated particle trajectories for seven sites over 2 years indicated that Tantabiddi, near Exmouth on the Pilbara Coast is the optimal site to release rehabilitated oceanic life stage green, hawksbill and loggerhead turtles in Western Australia. The best time of year for a release depends on the weather conditions, including ENSO variability. To increase a turtle's chance of survival, it is recommended that they are released at high tide, and preferably with easterly winds to assist their transport offshore. Our study is, to the best of our knowledge, the first to have used particle tracking models to determine the optimal release time and location for rehabilitated turtles. This method is preferable to the ad hoc approach used currently, as it allows for a quantitative approach for selecting release sites and times based on the oceanography—one of the main drivers of their movement. Importantly, this project provides objective information to guide conservation management decisions and protocols within Western Australia and provides a useful approach to assist with release decisions for rehabilitated turtles around the world.
Ethics Statement
Animal ethics approval was not required for this study, no animals were used during any process of this research.
Author Contributions
NR originally wrote this manuscript as an honors thesis. She did all of the particle tracking modeling and all of the writing for the manuscript, as well as contributing to the experimental design, graphs and statistics. YH contribution to this manuscript was the analysis of the particle tracking data, as well as providing edits and advise throughout the writing of the manuscript. SWh presented the original research idea and experimental design, he also advised and edited throughout the research and writing process. SWi provided the ozROMS data for the ocean current model, he also assisted with final manuscript edits. CP assisted with obtaining the ozROMS ocean circulation model; and also contributed to the experimental design. PW was a supervisor for the original honors thesis. He provided edits and advise throughout the research and writing process. MT contributed to the experimental design and conducted the statistical analysis. She also provided edits throughout the writing process.
Conflict of Interest Statement
The authors declare that the research was conducted in the absence of any commercial or financial relationships that could be construed as a potential conflict of interest.
Acknowledgments
This study was funded by a student grant from the School of Animal Biology at the University of Western Australia and by the Western Australia Department of Parks and Wildlife. NOAA sea surface temperature data (NOAA_OI_SST_V2) were provided by the NOAA/OAR/ESRL PSD, Boulder, Colorado, USA, from their Web site at http://www.esrl.noaa.gov/psd/.
Supplementary Material
The Supplementary Material for this article can be found online at: https://www.frontiersin.org/article/10.3389/fmars.2017.00173/full#supplementary-material
Figure S1. 2011 Seasonal averages of drift trajectories for all seven sites indicating percent of particles passing through each grid cell. Red asterisk indicates release location and colorbar is scaled logarithmically to show relevant gradients.
Figure S2. Mean seasonal drift time in days for particles released at seven sites along WA coast during 2011. Each map consists of the mean of 60,000 individual particle tracks.
References
AQWA (2017). The Aquarium of Western Australia. Available online at: https://www.aqwa.com.au/
Ascani, F., Van Houtan, K. S., Di Lorenzo, E., Polovina, J. J., and Jones, T. T. (2016). Juvenile recruitment in loggerhead sea turtles linked to decadal changes in ocean circulation. Glob. Chang. Biol. 22, 3529–3538. doi: 10.1111/gcb.13331
AVISO (2015). AVISO Satellite Altimetry Data. Available online at: http://www.aviso.altimetry.fr/en/data.htm
Bentivegna, F., Valentino, F., Falco, P., Zambianchi, E., and Hochscheid, S. (2007). The relationship between loggerhead turtle (Caretta caretta) movement patterns and Mediterranean currents. Mar. Biol. 151, 1605–1614. doi: 10.1007/s00227-006-0600-1
Boening, C., Willis, J. K., Landerer, F. W., Nerem, R. S., and Fasullo, J. (2012). The 2011 La Niña: so strong, the oceans fell. Geophys. Res. Lett. 39:L19602. doi: 10.1029/2012GL053055
Bolten, A. B. (2003). “Variations in sea turtle life history patterns: neritic vs. oceanic developmental stages,” in The Biology of Sea Turtles, Vol. 2 (Boca Raton, FL: CRC Press; LCC), 243–257.
Bornatowski, H., Heithaus, M. R., Batista, C. M. B., and Mascarenhas, R. (2012). Shark scavenging and predation on sea turtles in northeastern Brazil. Amphibia-Reptilia 33, 495–502. doi: 10.1163/15685381-00002852
Burnham, K. P. (2002). Model Selection and Multimodel Inference: A Practical Information-Theoretic Approach, 2nd End. New York, NY: Springer.
Bureau of Meteorology (2014). Climate Statistics for Australian Locations. Available online at: http://www.bom.gov.au/climate/averages/tables/cw_005007.shtml
Caillouet, C. W. Jr., Putman, N. F., Shaver, D. J., Valverde, R. A., Seney, E. E., Lohmann, K. J., et al. (2016). A call for evaluation of the contribution made by rescue, resuscitation, rehabilitation, and release translocations to kemp's Ridley Sea Turtle (Lepidochelys kempii) Population Recovery. Herpetol. Conserv. Biol. 11, 486–496.
Caputi, N., Fletcher, W., Pearce, A., and Chubb, C. (1996). Effect of the Leeuwin Current on the Recruitment of Fish and Invertebrates along the Western Australian Coast. Marine Freshw. Res. 47, 147–155. doi: 10.1071/MF9960147
Carr, A. (1987). New Perspectives on the pelagic stage of Sea Turtle development. Conserv. Biol. 1, 103–121.
Carr, A., Ogren, L., and McVea, C. (1980). Apparent hibernation by the Atlantic loggerhead turtle Caretta caretta off Cape Canaveral, Florida. Biol. Conserv. 19, 7–14. doi: 10.1016/0006-3207(80)90011-7
Chassignet, E. P., Hurlburt, H. E., Smedstad, O. M., Halliwell, G. R., Hogan, P. J., Wallcraft, A. J., et al. (2007). The HYCOM (HYbrid Coordinate Ocean Model) data assimilative system. J. Marine Sys. 65, 60–83. doi: 10.1016/j.jmarsys.2005.09.016
Chelonia (2017). Chelonia. Available online at: http://www.chelonia.org.au/
Christiansen, F., Putman, N. F., Farman, R., Parker, D. M., Rice, M. R., Polovina, J. J., et al. (2016). Spatial variation in directional swimming enables juvenile sea turtles to reach and remain in productive waters. Mar. Ecol. Prog. Ser. 557, 247–259. doi: 10.3354/meps11874
Coles, W. C., and Musick, J. A. (2000). Satellite Sea Surface Temperature Analysis and Correlation with Sea Turtle Distribution off North Carolina. Copeia, 2000, 551–554. doi: 10.1643/0045-8511(2000)000[0551:SSSTAA]2.0.CO;2
Collard, S. B., and Ogren, L. H. (1990). Dispersal Scenarios for Pelagic Post-Hatchling Sea Turtles. Bull. Mar. Sci. 47, 233–243.
Condie, S. A., and Andrewartha, J. R. (2008). Circulation and connectivity on the Australian North West Shelf. Cont. Shelf Res. 28, 1724–1739. doi: 10.1016/j.csr.2008.04.003
Condie, S. A., Mansbridge, J. V., and Cahill, M. L. (2011). Contrasting local retention and cross-shore transports of the East Australian Current and the Leeuwin Current and their relative influences on the life histories of small pelagic fishes. Deep Sea Res. II Topic. Stud. Oceanogr. 58, 606–615. doi: 10.1016/j.dsr2.2010.06.003
Craige, C. (2014). Keep an Eye Out for Sea Turtles Washed Up on Beaches. Available online at: http://www.dpaw.wa.gov.au/news/media-statements/item/848-keep-an-eye-out-for-sea-turtles-washed-up-on-beaches
Cresswell, G. R., and Golding, T. J. (1980). Observations of a south-flowing current in the southeastern Indian Ocean. Deep Sea Res. A Oceanogr. Res. Papers 27, 449–466. doi: 10.1016/0198-0149(80)90055-2
Dee, D. P., Uppala, S. M., Simmons, A. J., Berrisford, P., Poli, P., Kobayashi, S., et al. (2011). The ERA-Interim reanalysis: configuration and performance of the data assimilation system. Q. J. R. Meteorol. Soc. 137, 553–597. doi: 10.1002/qj.828
Dolphin Discover Centre (2015). Dolphin Discover Centre. Bunbury, WA. Available online at: http://dolphindiscovery.com.au/enjoy/interpretive-centre/
Egbert, G. D., and Erofeeva, S. Y. (2002). Efficient inverse modeling of Barotropic Ocean Tides. J. Atmosphere. Ocean. Technol. 19:183. doi: 10.1175/1520-0426(2002)019<0183:EIMOBO>2.0.CO;2
Environment (2014). Environment Protection and Biodiversity Conservation Act 1999. Available online at: http://www.comlaw.gov.au/Details/C2014C00506
Feng, M., Meyers, G., Pearce, A., and Wijffels, S. (2003). Annual and interannual variations of the Leeuwin Current at 32°S. J. Geophys. Res. 108:3355. doi: 10.1029/2002JC001763
Gaspar, P., Georges, J.-Y., Fossette, S., Lenoble, A., Ferraroli, S., and Le Maho, Y. (2006). Marine animal behaviour: neglecting ocean currents can lead us up the wrong track. Proc. R. Soci. Lond. B Biol. Sci. 273, 2697–2702. doi: 10.1098/rspb.2006.3623
Gersbach, G. H., Pattiaratchi, C. B., Ivey, G. N., and Cresswell, G. R. (1999). Upwelling on the south-west coast of Australia—source of the Capes Current? Cont. Shelf Res. 19, 363–400. doi: 10.1016/S0278-4343(98)00088-0
Godfrey, K. R., and Ridgway, J. S. (1985). The large-scale environment of the poleward-flowing Leeuwin Current, Western Australia: longshore steric height gradients, wind stresses and geostrophic flow. Deep Sea Res. Part B. Oceanogr. Literature Rev. 32:996. doi: 10.1016/0198-0254(85)93650-7
Haidvogel, D. B., Arango, H., Budgell, W. P., Cornuelle, B. D., Curchitser, E., Di Lorenzo, E., et al. (2008). Ocean forecasting in terrain-following coordinates: Formulation and skill assessment of the Regional Ocean Modeling System. J. Comput. Phys. 227, 3595–3624. doi: 10.1016/j.jcp.2007.06.016
Hamann, M., Grech, A., Wolanski, E., and Lambrechts, J. (2011). Modelling the fate of marine turtle hatchlings. Ecol. Modell. 222, 1515–1521. doi: 10.1016/j.ecolmodel.2011.02.003
Hanson, C. E., Pattiaratchi, C. B., and Waite, A. M. (2005). Sporadic upwelling on a downwelling coast: phytoplankton responses to spatially variable nutrient dynamics off the Gascoyne region of Western Australia. Cont. Shelf Res. 25, 1561–1582. doi: 10.1016/j.csr.2005.04.003
Hays, G. C., Fossette, S., Katselidis, K. A., Mariani, P., and Schofield, G. (2010). Ontogenetic development of migration: lagrangian drift trajectories suggest a new paradigm for sea turtles. J. R. Soc. Interf. 7:1319. doi: 10.1098/rsif.2010.0009
Hetzel, Y., Pattiaratchi, C., and Lowe, R. (2013). Intermittent dense water outflows under variable tidal forcing in Shark Bay, Western Australia. Cont. Shelf Res. 66, 36–48. doi: 10.1016/j.csr.2013.06.015
Hochscheid, S., Bentivegna, F., Bradhai, M. N., and Hays, G. C. (2007). Overwintering behaviour in sea turtles: dormancy is optional. Mar. Ecol. Prog. Ser., 340, 287–298. doi: 10.3354/meps340287
Holloway, P., and Nye, H. (1985). Leeuwin Current and wind distributions on the southern part of the Australian North West Shelf between January 1982 and July 1983. Marine Freshw. Res. 36, 123–137.
IUCN Red List (2014). The IUCN Red List of Threatened Species. Available online at: http://www.iucnredlist.org
Lett, C., Verley, P., Mullon, C., Parada, C., Brochier, T., Penven, P., et al. (2008). A Lagrangian tool for modelling ichthyoplankton dynamics. Environ. Model. Softw. 23, 1210–1214. doi: 10.1016/j.envsoft.2008.02.005
Limpus, C. J., and Limpus, D. J. (2003). “Biology of the loggerhead turtle in western South Pacific Ocean foraging areas,” in Loggerhead Sea Turtles, Vol. 1, eds A. B. Bolten and B. E. Witherington (Washington, DC: Smithsonian Institution Press), 63–78.
Louisiana Department of Wildlife and Fisheries and Audubon Aquarium (2013). Louisiana Department of Wildlife and Fisheries and Audubon Aquarium of the Americas Release Rehabilitated and Endangered Sea Turtle Back into the Gulf of Mexico [Press release]. New Orleans: State News Service. Retrieved from Factiva.
Lowe, R. J., Ivey, G. N., Brinkman, R. M., and Jones, N. L. (2012). Seasonal circulation and temperature variability near the North West Cape of Australia. J. Geophys. Res. Oceans 117:C04010. doi: 10.1029/2011JC007653
Lutz, P. L., Bergey, A., and Bergey, Y. M. (1989). Effects of temperature on gas exchange and acid-base balance in the Sea Turtle Caretta Caretta at rest and during routine activity. J. Exp. Biol. 144, 155–169.
Lynch, D. G. D., Bigili, A., McGillicuddy, D., Manning, J., and Aretxabaleta, A. (2014). “Archive pointing to code, drifter data, model output, and animations,” in Particles in the Coastal Ocean: Theory and Application. Available online at: http://www.nefsc.noaa.gov/drifter/particles.html
Mandelc, F., Carr, S., Waples, K., and Haering, R. (2002). Guidelines and Conditions for Marine Reptile Strandings, Rehabilitation and Release in New South Wales. Hurtsville: NPWS. Available online at: http://www.environment.nsw.gov.au/resources/nature/marineReptileGuidelines.pdf
McMahon, C. R., and Hays, G. C. (2006). Thermal niche, large-scale movements and implications of climate change for a critically endangered marine vertebrate. Glob. Chang. Biol. 12, 1330–1338. doi: 10.1111/j.1365-2486.2006.01174.x
Meuleners, M. J., Pattiaratchi, C. B., and Ivey, G. N. (2007). Numerical modelling of the mean flow characteristics of the Leeuwin Current System. Deep Sea Res. II Topic. Stud. Oceanogr. 54, 837–858. doi: 10.1016/j.dsr2.2007.02.003
Moon, D. Y., MacKenzie, D. S., and Owens, D. W. (1997). Simulated Hibernation of Sea Turtles in the Laboratory: I. Feeding, Breathing Frequency, Blood pH, and Blood Gases. J. Exp. Zool. 278, 372–380.
NOAA (2015). NOAA National Centers for Environmental Information: Optimum Interpolation Sea Surface Temperature (OISST). Available online at: http://www.ncdc.noaa.gov/sst/
Ocean Park (2017). Ocean Park Aquarium Shark Bay. Available online at: https://oceanpark.com.au/marine-life-rehabilitation/
Oke, P. R., Sakov, P., Cahill, M. L., Dunn, J. R., Fiedler, R., Griffin, D. A., et al. (2013). Towards a dynamically balanced eddy-resolving ocean reanalysis: BRAN3. Ocean Model. 67, 52–70. doi: 10.1016/j.ocemod.2013.03.008
Okuyama, J., Abe, O., Nishizawa, H., Kobayashi, M., Yoseda, K., and Arai, N. (2009). Ontogeny of the dispersal migration of green turtle (Chelonia mydas) hatchlings. J. Exp. Marine Biol. Ecology. 379, 43–50. doi: 10.1016/j.jembe.2009.08.008
Okuyama, J., Kitagawa, T., Zenimoto, K., Kimura, S., Arai, N., Sasai, Y., et al. (2011). Trans-pacific dispersal of loggerhead turtle hatchlings inferred from numerical simulation modeling. Mar. Biol. 158, 2055–2063. doi: 10.1007/s00227-011-1712-9
Pagán, F. (2003). Modeling Egg and Larval Dispersal in the Nearshore Waters of Southwestern Puerto Rico. Ph. D. thesis, University of Puerto Rico, Puerto Rico.
Pattiaratchi, C., and Eliot, M. (2008). “Sea level variability in south-west Australia: from hours to decades,” in Paper presented at the Proceedings of the 31st ASCE International Conference on Coastal Engineering (Hamburg).
Pattiaratchi, C., Hegge, B., Gould, J., and Eliot, I. (1997). Impact of sea-breeze activity on nearshore and foreshore processes in southwestern Australia. Cont. Shelf Res. 17, 1539–1560. doi: 10.1016/S0278-4343(97)00016-2
Pattiaratchi, C., and Woo, M. (2009). The mean state of the Leeuwin Current system between North West Cape and Cape Leeuwin. J. R. Soc. West. Aust. 92, 221–241.
Pearce, A. F., and Feng, M. (2013). The rise and fall of the “marine heat wave” off Western Australia during the summer of 2010/2011. J. Mar. Syst. 111–112, 139–156. doi: 10.1016/j.jmarsys.2012.10.009
Pearce, A., and Pattiaratchi, C. (1999). The Capes Current: a summer countercurrent flowing past Cape Leeuwin and Cape Naturaliste, Western Australia. Cont. Shelf Res. 19, 401–420. doi: 10.1016/S0278-4343(98)00089-2
Pearce, A., and Phillips, B. (1988). ENSO events, the Leeuwin Current, and larval recruitment of the western rock lobster. ICES J. Marine Sci. 45, 13–21.
Peliz, A., Dubert, J., Marchesiello, P., and Teles-Machado, A. (2007). Surface circulation in the Gulf of Cadiz: Model and mean flow structure. J. Geophys. Res. Oceans 112:C11015. doi: 10.1029/2007JC004159
Polovina, J. J., Balazs, G. H., Howell, E. A., Parker, D. M., Seki, M. P., and Dutton, P. H. (2004). Forage and migration habitat of loggerhead (Caretta caretta) and olive ridley (Lepidochelys olivacea) sea turtles in the central North Pacific Ocean. Fish. Oceanogr. 13, 36–51. doi: 10.1046/j.1365-2419.2003.00270.x
Polovina, J. J., Kobayashi, D. R., Parker, D. M., Seki, M. P., and Balazs, G. H. (2000). Turtles on the edge: movement of loggerhead turtles (Caretta caretta) along oceanic fronts, spanning longline fishing grounds in the central North Pacific, 1997–1998. Fish. Oceanogr. 9, 71–82. doi: 10.1046/j.1365-2419.2000.00123.x
Previmer (2010). ICHTHYOP: a Lagrangian Tool for Modelling Ichthyoplankton Dynamics. Available online at: http://www.previmer.org/en/ichthyop
Proietti, M. C., Reisser, J., Marins, L. F., Marcovaldi, M. A., Soares, L. S., Monteiro, D. S., et al. (2014). Hawksbill × loggerhead sea turtle hybrids at Bahia, Brazil: where do their offspring go? PeerJ 2:e255. doi: 10.7717/peerj.255
Putman, N. F., Bane, J. M., and Lohmann, K. J. (2010). Sea turtle nesting distributions and oceanographic constraints on hatchling migration. Proc. R. Soc. Lond. B Biol. Sci. 277, 3631–3637. doi: 10.1098/rspb.2010.1088
Putman, N. F., and He, R. (2013). Tracking the long-distance dispersal of marine organisms: sensitivity to ocean model resolution. J. R. Soc. Interf. 10:20120979. doi: 10.1098/rsif.2012.0979
Putman, N. F., Lumpkin, R., Sacco, A. E., and Mansfield, K. L. (2016). Passive drift or active swimming in marine organisms? Proc. R. Soc. B. 283:20161689. doi: 10.1098/rspb.2016.1689
Putman, N. F., and Mansfield, K. L. (2015). Direct evidence of swimming demonstrates active dispersal in the sea turtle “lost years”. Curr. Biol. 25, 1221–1227. doi: 10.1016/j.cub.2015.03.014
Putman, N. F., and Naro-Maciel, E. (2013). Finding the ‘lost years’ in green turtles: insights from ocean circulation models and genetic analysis. Proc. R. Soc. Lond. B Biol. Sci. 280:20131468. doi: 10.1098/rspb.2013.1468
Putman, N. F., Scott, R., Verley, P., Marsh, R., and Hays, G. C. (2012). Natal site and offshore swimming influence fitness and long-distance ocean transport in young sea turtles. Mar. Biol. 159, 2117–2126. doi: 10.1007/s00227-012-1995-5
R Core Team (2014). R: A Language and Environment for Statistical Computing. Vienna: R Foundation for Statistical Computing.
Rennie, S. J., Pattiaratchi, C. P., and McCauley, R. D. (2007). Eddy formation through the interaction between the Leeuwin Current, Leeuwin Undercurrent and topography. Deep Sea Res. II Topic. Stud. Oceanogr. 54, 818–836. doi: 10.1016/j.dsr2.2007.02.005
Reynolds, R. W., Rayner, N. A., Smith, T. M., Stokes, D. C., and Wang, W. (2002). An improved in situ and satellite SST analysis for climate. J. Clim. 15, 1609–1625. doi: 10.1175/1520-0442(2002)015<1609:AIISAS>2.0.CO;2
Ridgway, K. R., and Godfrey, J. S. (2015). The source of the Leeuwin current seasonality. J. Geophys. Res. Oceans 120, 6843–6864. doi: 10.1002/2015jc011049
Rockingham Regional Environment Centre Naragebup (2015). Available online at: http://naragebup.org.au/
Salmon, M., Hamann, M., and Wyneken, J. (2010). The development of early diving behavior by juvenile flatback sea turtles (Natator depressus). Chelonian Conserv. Biol. 9, 8–17. doi: 10.2744/CCB-0803.1
Scales, K., Lewis, J., Lewis, J., Castellanos, D., Godley, B., and Graham, R. (2011). Insights into habitat utilisation of the hawksbill turtle, Eretmochelys imbricata (Linnaeus, 1766), using acoustic telemetry. J. Exp. Mar. Biol. Ecol. 407, 122–129. doi: 10.1016/j.jembe.2011.07.008
Scott, R., Marsh, R., and Hays, G. C. (2014). Ontogeny of long distance migration. Ecology, 95, 2840–2850. doi: 10.1890/13-2164.1
Shillinger, G. L., Di Lorenzo, E., Luo, H., Bograd, S. J., Hazen, E. L., Bailey, H., et al. (2012). On the dispersal of leatherback turtle hatchlings from Mesoamerican nesting beaches. Proc. R. Soc. B Biol. Sci. 279:2391. doi: 10.1098/rspb.2011.2348
Smith, R. L., Huyer, A., Godfrey, J. S., and Church, J. A. (1991). The Leeuwin Current off Western Australia, 1986–1987. J. Phys. Oceanogr. 21, 323–345.
Taylor, J., and Pearce, A. (1999). Ningaloo Reef currents: implications for coral spawn dispersal, zooplankton and whale shark abundance. J. R. Soc. West. Aust. 82, 57–65.
The Turtle Hospital (2017). The Turtle Hospital. Rescue, Rehab, Release. Available online at: http://www.turtlehospital.org/about-us/
Verspecht, F., and Pattiaratchi, C. (2010). On the significance of wind event frequency for particulate resuspension and light attenuation in coastal waters. Cont. Shelf Res. 30, 1971–1982. doi: 10.1016/j.csr.2010.09.008
Wallace, A. (2012). Wing, Sea World Joins Forces to Save Sea Turtles, Cape Canaveral Air Force Station, Fla [Press release]. Cape Canaveral: State News Service. Retrieved from Factiva.
Walker, T., and Parmenter, C. (1990). Absence of a pelagic phase in the life cycle of the flatback turtle, Natator depressa (Garman). J. Biogeogr. 17, 275–278.
Webster, M., and Petkovic, P. (2005). Australian Bathymetry and Topography Grid, June 2005, Vol. 12. Geoscience Australia Record, 30. Canberra, ACT.
Whittock, P. A., Pendoley, K. L., and Hamann, M. (2014). Inter-nesting distribution of flatback turtles Natator depressus and industrial development in Western Australia. Endanger Species Res. 26, 25–38. doi: 10.3354/esr00628
Woo, M., Pattiaratchi, C., and Schroeder, W. A. (2006). Summer surface circulation along the Gascoyne continental shelf, Western Australia. Cont. Shelf Res. 26, 132–152. doi: 10.1016/j.csr.2005.07.007
Wood, S. N. (2011). Fast stable restricted maximum likelihood and marginal likelihood estimation of semiparametric generalized linear models. J. R. Stat. Soc. B 73, 3–36. doi: 10.1111/j.1467-9868.2010.00749.x
Keywords: decision support, Leeuwin Current, Western Australia, lost years
Citation: Robson NA, Hetzel Y, Whiting S, Wijeratne S, Pattiaratchi CB, Withers P and Thums M (2017) Use of Particle Tracking to Determine Optimal Release Dates and Locations for Rehabilitated Neonate Sea Turtles. Front. Mar. Sci. 4:173. doi: 10.3389/fmars.2017.00173
Received: 24 January 2017; Accepted: 18 May 2017;
Published: 13 June 2017.
Edited by:
Mariana M. P. B. Fuentes, Florida State University, United StatesReviewed by:
Nathan Freeman Putman, University of Miami, United StatesErin Seney, University of Central Florida, United States
Graeme Clive Hays, Deakin University, Australia
Copyright © 2017 Robson, Hetzel, Whiting, Wijeratne, Pattiaratchi, Withers and Thums. This is an open-access article distributed under the terms of the Creative Commons Attribution License (CC BY). The use, distribution or reproduction in other forums is permitted, provided the original author(s) or licensor are credited and that the original publication in this journal is cited, in accordance with accepted academic practice. No use, distribution or reproduction is permitted which does not comply with these terms.
*Correspondence: Natalie A. Robson, nrobson_92@hotmail.com