A Holistic Approach to Fishery Management: Evidence and Insights from a Central Mediterranean Case Study (Western Ionian Sea)
 Tommaso Russo1,2†
  Isabella Bitetto3*†
  Pierluigi Carbonara3
  Roberto Carlucci4 Lorenzo D'Andrea1,2
  Maria T. Facchini3
  Giuseppe Lembo3 Porzia Maiorano4
  Letizia Sion4
  Maria T. Spedicato3 Angelo Tursi4 Stefano Cataudella1
- 1Laboratory of Experimental Ecology and Aquaculture, University of Rome Tor Vergata, Rome, Italy
- 2CoNISMa, Rome, Italy
- 3COISPA Tecnologia and Ricerca, Bari, Italy
- 4Department of Biology, University of Bari Aldo Moro, Bari, Italy
The new Common Fisheries Policy (CFP) is designed to represent an appropriate response to the uncertainties and challenges facing the fisheries sector. It also adopts a holistic approach to fisheries management, considering all factors driving fishers' behavior, and ultimately, the long-term maintenance of living resources. The most reliable way to pursue these aims could be represented by a change in the exploitation pattern, in order to guarantee the sustainability of fisheries without compromising their socioeconomic viability. In this paper, the demersal fisheries of the Ionian Sea [Geographic Sub-area (GSA) 19] were analyzed with respect to their spatial, temporal, economic, and biological characteristics in terms of four key species for fisheries, namely European hake, red mullet, giant red shrimp, and deep-water rose shrimp. Specifically, (1) a quantitative procedure was applied to break down the whole system (including small-scale fleet components) into a series of fishing grounds using input data about fishing efforts; (2) the different fleet segments were defined as a combination of main gear and fishing grounds; (3) the effort and production by fleet segment were derived according to biological samplings of commercial data (Data Collection Framework for the collection and management of fisheries data, DCF), information on localization of nursery and spawning grounds, and expert knowledge; and (4) all this information was used to feed a bioeconomic modeling tool (BEMTOOL), and to explore alternative exploitation patterns. A series of scenarios including the status quo were defined, starting from the actual management approach based on temporal fishing closure. The results showed that significant improvements in the exploitation pattern could be achieved by setting up spatial and/or temporal gear-specific bans of the fishing activity. More specifically, scenarios based on a 3-month fishing ban for trawlers are expected to provide high rebuilding of the spawning stock biomass (SSB) for all target stocks, and at the same time, result in a remarkable reduction of discards. When combined with a seasonal fishing ban for small-scale fleets equipped with nets and longlines, this approach could lead to a significant improvement in all indicators, but especially the SSB of the exploited species.
Introduction
Following the cornerstone World Summit on Sustainable Development of Johannesburg in 2002, in which the European Union (EU) committed to acting against the continued decline of many fish stocks, the Common Fisheries Policy (CFP; EC, 2013) has been further developed and adapted to guarantee the conservation of marine living resources and the sustainable management of fisheries. The core of the reformed CFP is explicitly identified with the concept of adaptation of fishing activities to exploitation rates that maintain or restore the populations of harvested stocks above levels that can produce the maximum sustainable yield (MSY). Different strategies have been identified in the CFP to pursue this aim, including the effective implementation of an ecosystem approach to fishery management (EAFM) and the progressive reduction of discards. However, the CFP undertakes to ensure the continuation of viable fishing activities while explicitly referring to economic and social components. In fact, the protection of marine living resources and the socioeconomic growth of the fishery sector should not be considered conflicting targets; accordingly, the long-term EU Blue Growth strategy (EC, 2014) intends to promote the growth of the fishery sector.
Recently, following the United Nations Sustainable Development Summit 2015 (New York, 25–27 September), the General Fisheries Commission for the Mediterranean (GFCM) approved the resolution on the midterm strategy (2017–2020) toward the sustainability of Mediterranean and Black Sea fisheries (Resolution GFCM/40/2016/2). This resolution aims to reverse the alarming trend of the status of commercially exploited stocks, while supporting livelihoods for coastal communities and mitigating the effects of fisheries on the ecosystem, by 2020.
In the Mediterranean Sea, the fisheries management is set at the scale of Geographical Sub-areas (GSAs; Figure 1A) and based on the control of fishing capacity, selectivity, and effort in space and time; moreover, quota-based approaches have been applied for a few species, including benthic species or highly migratory shared stocks. Given the ineffectiveness of the current Mediterranean management system (Cardinale and Scarcella, 2017), a new generation of approaches is emerging (Holland, 2003; Zeller and Reinert, 2004; McHich et al., 2006; Pelletier et al., 2009; Dunn et al., 2011; Sampson et al., 2011; Bastardie et al., 2014; Campbell et al., 2014; Russo et al., 2014a; Rossetto et al., 2015). These modern approaches have been devised and developed to investigate the status of living resources as a function of the spatial and temporal management of fishing efforts, while some of them also consider socioeconomic consequences and fishery interactions. A common thread of these models is that regulating the access to fishing grounds could be an effective approach for protecting critical life stages and improving the exploitation pattern; this has resulted in a combination of fleet and gear selectivity of different fishing tactics while also considering the accessibility and vulnerability of fish population life stages (Recommendation GFCM/40/2016/4).
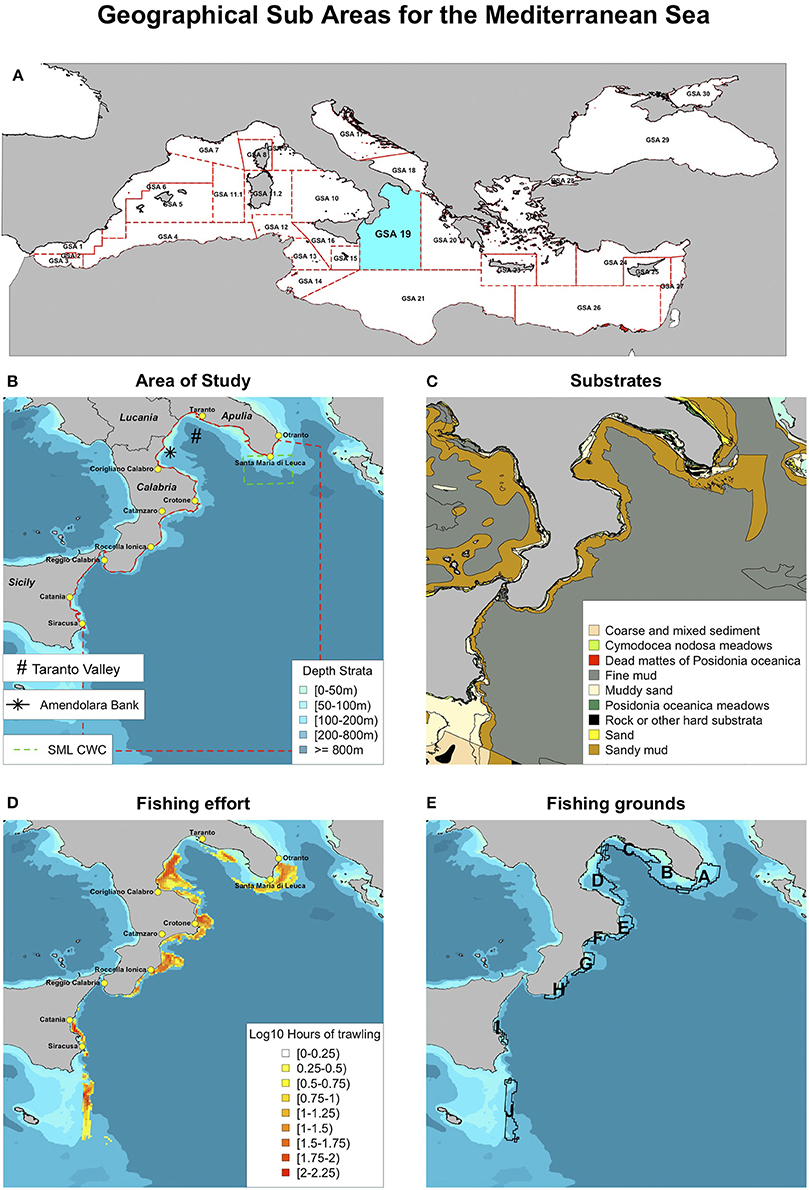
Figure 1. (A) The fisheries management set at the scale of Geographical Sub-Areas in the Mediterranean Sea; (B) Study area (GSA 19) with the main bathymetric strata and the harbors; SML CWC stands for Santa Maria di Leuca cold-water coral; (C) sea bottom substrates as derived from the European Marine Observation Data Network (EMODnet) Seabed Habitats project (www.emodnet-seabedhabitats.eu/); (D) yearly trawling effort (mean for 2008–2015) for vessel monitoring system (VMS)-equipped vessels with a length-over-all (LOA) >15 m with respect to a 3 × 3 km grid; (E) fishing grounds returned by the constrained clustering analysis.
This study focuses on the Western Ionian Sea (GSA 19), which is characterized by a narrow continental shelf with a steep slope (Capezzuto et al., 2010; Maiorano et al., 2010). Here, the fishing vessels targeting demersal resources are distributed in the 10 main harbors along the coast (Carbonara, 2013; Carlucci et al., 2015; Figure 1B). The authors' direct experiences in DCF (https://ec.europa.eu/fisheries/cfp/fishing_rules/data_collection) fishery samplings have evidenced that the fleets operate in fishing grounds close to the respective harbors and mainly exploit the fishing grounds that are distributed on the shelf and the nearest portion of slope, avoiding moving farther out to reduce both fuel consumption and interference with fleets from other harbors. This spatial fidelity could be proactively used to manage demersal trawling in GSA 19 by regulating the different fleets' access to the diverse fishing grounds. Consequently, deepened characterization of the fishing grounds with respect to both resources and fleets interacting in them could be the first step for the identification of management scenarios aimed at guaranteeing the recovery of stocks and the long-term sustainability of fishing activities. This also in agreement with the regionalized approach (one of the principles of good governance of the CFP), which comprises the implementation of management actions that consider fisheries' regional specificities (EC, 2013).
This study reports on the preliminary results of a new approach that was inspired by the CFP. This involves a combined application of a spatial-based analysis of the fishing effort and a bioeconomic platform that allows simulation and exploration of a large set of management rules.
The original approach is applied to the demersal fishery of GSA 19 (Figure 1B). To this aim, the data provided by the Vessel Monitoring System (VMS), Community Fishing Fleet Register (http://ec.europa.eu/fisheries/fleet/index.cfm) data, and DCF biological samplings of commercial data are used to characterize the fishing grounds. Spatially defined fleet segments have been identified that combine the main gear and the fishing ground. Then, the derived information on the effort, exploitation pattern, and production by fleet segment are used as input for an integrated bioeconomic modeling tool (BEMTOOL; Rossetto et al., 2015; Spedicato, 2016). The BEMTOOL platform was developed in the Mediterranean Halieutic Resources Evaluation and Advice (MAREA) framework project (MARE/2009/05-Lot 1) to inform and support the management of stocks and fleets. BEMTOOL was applied to forecast the biological and socioeconomic effects of different management scenarios, including temporal gear-specific bans and alternate closures of selected fishing grounds. The BEMTOOL platform allows forecasting how different harvesting and management strategies affect the dynamics of the following: (1) the spawning stock biomass (SSB) under different conditions of exploitation; and (2) fishing mortality and the related fishery outputs in terms of total and by-fleet-segment catches (separating landings and discards) and revenues.
As observed by Froese et al. (2016), no attempt has been made so far to disentangle two different effects influencing the size structure of an exploited population, namely fishing mortality and the minimum size limits. The scenarios were specifically designed to make a first attempt at disentangling these two effects based on the time of offspring of the investigated species. Scenarios' results were evaluated in terms of the benefit for the SSB of target stocks, decrease of the overall fishing mortality, lowering of the landing, and reduction of the discards.
Materials and Methods
Study Area
The GSA 19 covers a surface of about 16,500 km2 (MEDITS, 2016) in the depth range of 10–800 m along a coastline of about 1,000 km encompassing four administrative regions, namely Apulia, Lucania, Calabria, and Sicily (Maiorano et al., 2010; Figure 1B). The Western Ionian Sea is geomorphologically divided into two sectors by the Taranto Valley, which exceeds 2,200 m in depth. The former is located between the Taranto Valley and the Apulia region and is represented by a broad continental shelf. Along Calabria and Sicily, the shelf is generally extremely limited, with the shelf break located at a depth of 30–100 m. Many submarine canyons are located along these coasts, playing an important role in the transport of terrigenous debris from coastal waters to deeper grounds. These habitats are unsuitable for trawling and represent a sheltered site for species during sensitive phases of their lifecycles (Capezzuto et al., 2010).
In the circalittoral zone along the Apulia and Calabria coasts, a fine mud substrate is evident, with the biocenosis of the terrigenous mud widespread from a depth of 70–80 m (Figure 1C). Specifically, the biocenosis of the detritic shelf-edge, always within the fine mud substrate, is often characterized by the dominance of the sea lily Leptometra phalangium, which is distributed on the shelf edge throughout the Western Ionian Sea; over the continental slope, the biocenosis of the bathyal mud extends, with the facies characterized by Funiculina quadrangularis and Isidella elongata, even if it has almost completely disappeared due to trawling. These two facies are often associated to the presence of commercial species, such as the deep-water pink shrimp (Parapenaeus longirostris) and Norway lobster (Nephrops norvegicus) for the former and blue and red shrimp (Aristeus antennatus) and giant red shrimp (Aristaeomorpha foliacea) for the latter.
Two important habitats have been recognized far from the Apulian and Calabrian coasts, namely the Santa Maria di Leuca cold-water coral (SML CWC) area and the Amendolara Seamount, respectively (Figure 1B). The SML CWC represents a rare example of living Madrepora-dominated coral communities distributed over an area of about 2,000 km2 between about 120 and 1,400 m in depth (D'Onghia et al., 2010, 2012, 2016; Vassallo et al., 2017). Fishing activities using mostly trawl nets and longlines are carried out around the SML CWC (D'Onghia et al., 2012, 2016). In fact, the presence of coral mounds is known to the local fishermen, who experience gear damage and losses. Considering the effect of trawling, and to a lesser extent, other fishing gear, the GFCM created a new legal category of Fishery Restricted Area (FRA) on the SML CWC, recommending the prohibition of towed gears. However, to date, no effective management measures have been adopted, and unauthorized operation may still take place close to or even inside the northward limit of the FRA (D'Onghia et al., 2016). The Amendolara seamount southwestern Capo Spulico extends over an area of about 31 km2, rising from 200 up to about 20 m below the surface. The Amendolara seamount is characterized by coarse sand and coastal detritic biocenoses, as well as a wide diversity of fish, crustaceans, and cephalopods sought by local fishers.
The main target species in landing value and volume of the more relevant fisheries in GSA 19 are as follows: European hake (Merluccius merluccius), red mullets (Mullus barbatus and Mullus surmuletus), cuttlefish (Sepia officinalis), octopus (Octopus vulgaris), common Pandora (Pagellus erythrinus), deep-water rose shrimp, giant red shrimp, and blue and red shrimp. These stocks are mainly exploited by vessels, with a length-over-all (LOA) of 6–12 m, for the small-scale fishery, and with a LOA of 12–18 m for the trawlers.
Six main demersal fisheries have been identified in the GSA [Scientific Technical and Economic Committee for Fisheries (STECF), 2015], as follows: set longlines targeting demersal fish, set gillnets targeting demersal species, trammel nets targeting demersal species, bottom otter trawl targeting demersal species, bottom otter trawl targeting deep-water species, and bottom otter trawl targeting mixed demersal and deep-water species. Figure 2 shows the relationship between species distributions in the different fishing grounds and effort activity/target species for the different fleet segments.
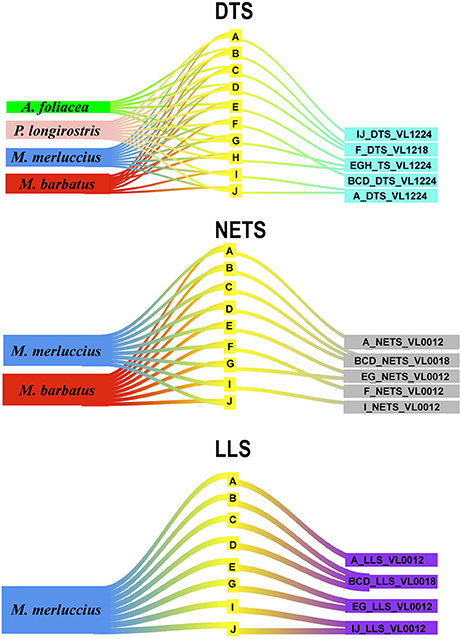
Figure 2. Sankey plots (Weiner, 2015) representing the relationship between species distributions in the different fishing grounds and effort activity/target species for the different fleet segments. DTS stands for bottom otter trawl, NETS stands for gill net and trammel nets, LLS stands for longliners, the fishing grounds of activities are coded from A to J. VL stands for vessel length. The fleet segment codification is built as a concatenation of fishing ground, gear, and vessel length range.
Data
Different types of data were used for the objectives of this study, as follows:
1. VMS data, which were employed for inferring the activity and fishing effort of vessels with a LOA >15 m at a fine spatial level;
2. The number of vessels, gross tonnage (GT), power (KW), and LOA from the Community Fishing Fleet Register in 2008–2015 for all the types of vessels;
3. Fishing activity (average fishing days per vessel) from DCF effort data and VMS data;
4. Landings and discards of the main target species by gear and fleet from DCF production data;
5. Fleet selectivity by gear and fishing ground, derived from the composition of catches observed in DCF biological samplings of commercial data; and
6. Localization of nursery and spawning grounds of the target species from Mediterranean Sensitive Habitats—MEDISEH project outcomes (European project MEDISEH from MAREA Framework).
A detailed description of these data is given below.
The activity of fishing vessels with a LOA larger than 15 m was analyzed using the data provided by the VMS. The VMS was introduced by the European Union for remote control of fishing vessels (EC, 2003, 2009), and it consists of an automatic transmitting station (the so-called blue box), which periodically sends information about vessel position, speed, and prow heading (EC, 2011) via satellite transmission. VMS data are widely used in the scientific literature for the analysis of fishing effort patterns (Lee et al., 2010; Campbell et al., 2014; Joo et al., 2015) and the assessment of fishing impacts (Gerritsen et al., 2013; Eigaard et al., 2016; Russo et al., 2016b). The VMSbase R package (Russo et al., 2014a), which implements the procedures described in Russo et al. (2011a,b); Russo et al. (2013, 2016a), was used to process the VMS data related for the full examined temporal range, comprising the years 2008–2015 (8 years). A complete description of the standard procedure to obtain high-frequency (10 min) fishing set positions and then a quantitative assessment of trawling effort is reported in Russo et al. (2014a). Basically, this procedure comprises the following steps: (1) data cleaning (removal of redundant or erroneous pings); (2) partitioning of VMS data with respect to the fishing trips (sequence of pings starting from and ending at a given harbor) of each fishing vessel; (3) interpolation to increase the native frequency (ranging between 1 and 2 h) to 10 min; (4) estimation of the sea bottom depth corresponding to each interpolated ping using the function provided by the “marmap” package (Pante and Simon-Bouhet, 2013); and (5) identification of fishing set positions using a combined speed/depth filter.
At the end of this procedure, a dataset containing the fishing set positions (defined by two spatial and one temporal coordinates) for 94 vessels operating in the GSA 19 was obtained. These 94 trawlers were selected from a larger list of over 200 vessels based on a screening of their activity with respect to the set of 32 seasons (from winter 2008 to autumn 2015). Thus, trawlers monitored in fewer than eight quarters in the time series of 2008–2015 were excluded from the actual fleet exploiting the study area.
According to the Community Fishing Fleet Register, in 2008–2015, small-scale fleet segments counted 1,141 vessels registered in 26 ports. These vessels were classified as using nets [gillnets (GNS) and trammel nets (GTR)] and longlines (LLS) as prevalent gears. Annual data on vessels' characteristics (GT, KW, number of vessels by port) were available aggregated by gear and LOA.
In this analysis, we retained 857 vessels (75.1% of the small-scale fleet) from the 18 ports linked to the 10 fishing grounds identified with VMS data. The DCF landing and discard data by species were extracted by the Mediterranean and Black Sea DCF official website (https://stecf.jrc.ec.europa.eu/dd/medbs).
The landing of the three fleet components considered in the case study (trawlers, nets—gillnets and trammel nets—and longlines) represents 62% of the total production of the area (DCF data for 2015). The target species considered are European hake, red mullet, deep-water pink shrimp, and giant red shrimp, representing 33% of the total landing of the selected fleet components.
The length frequency distributions of these species observed in the DCF biological samplings of commercial data (catch by gear) were used to drive the modeling of the exploitation pattern (selectivity) for each fleet segment. This information was also corroborated by data related to the location of sensitive habitats (nursery areas and spawning grounds) derived from the MEDISEH project (Figure S1 in Supplementary Material).
Identification of Fishing Grounds
The VMS dataset was divided into a set of 32 seasons (from winter 2008 to autumn 2015), and for each season, the total amount of fishing days was registered for each cell of a 3 × 3-km2 grid defined for the whole GSA 19. This allowed a graphical inspection of 32 maps of the fishing effort (not reported for the sake of brevity). This inspection revealed that the trawling effort is basically distributed in a short number of spatially separated unit groups of cells. This pattern persists when the mean yearly pattern is inspected (Figure 1D).
The best partitioning of grid cells with respect to the mean yearly pattern of the trawling effort was identified using the constrained clustering approach provided by the “skater” function of the R package labeled “spdep” (Bivand et al., 2016). This analysis returned a set of 10 fishing grounds (Figure 1E), representing the list of areas—defined as sets of contiguous cells—representing the “playing field” for the fishing activity. It should be observed that the constrained clustering applied on the mean yearly trawling effort confirmed the visual pattern represented in Figure 1D. Each of these fishing grounds was evaluated using the information on the localization of nurseries and spawning grounds of the main target species in the present study.
The total number of vessels using nets and longlines was obtained from 2008 to 2015 by splitting the overall number of vessels with main gear nets and longlines in the For every quarter, each vessel was assigned to a unique fishing ground according to the percentage of fishing days; this avoided counting a vessel more than once. The seasonal activity of trawlers with respect to the 10 fishing grounds obtained from the VMS data was integrated by combining expert knowledge (regarding target species and fishing behavior) and the data collected on board commercial vessels during the sampling activities of the Data Collection Framework (EC, 2008) in the GSA 19 (e.g., Carbonara, 2013, 2015). Based on the LOA and target species of the visiting vessels, the 10 main fishing grounds were then aggregated in five trawling areas corresponding to five fleet segments (Table 1).

Table 1. Fleet segment definition with respect to the gear (DTS stands for bottom otter trawl, NETS stands for gill net and trammel nets, LLS stands for longliners), the fishing grounds of activities, and the target species: M. merluccius, M. barbatus, P. longirostris, A. antennatus.
The number of average fishing days, GT, and KW per fishing ground for trawlers was seasonally derived from VMS data based on the vessels visiting the fishing grounds. To include trawlers that are not obliged to use the VMS (LOA of 12–15 m), a multiplicative correction factor was applied to the vessels, average GT, and average KW of each identified fleet segment (combination of gear and fishing ground) using the VMS. The correction factor was given by the ratio between the number of vessels (between 12 and 24 m and with trawl as main gear) reported in the Community Fishing Fleet Register and the number of vessels monitored by the VMS that were allocated to the same fishing grounds. The final number of fishing vessels by fleet segment is reported in Table S1 in the Supplementary Material, while the correction factors applied are reported in Table S2 in the Supplementary Material.
Regarding the small-scale fleet segments, the association between the vessels registered in each port and the fishing grounds was determined by cross-checking the expert knowledge on fishing habits and data from on-board biological sampling from DCF observations. Finally, nets and longlines were divided into five and four fleet segments, respectively (Table 1). The estimation of the number of vessels by gear and fishing grounds were obtained according to the following steps:
(i) The total number of vessels using nets and longlines was obtained from 2008 to 2015 by splitting the overall number of vessels with main gear nets and longlines in the Community Fishing Fleet Register according to the DCF production data; and
(ii) The number of vessels per gear obtained in the previous step was split among the fishing grounds proportionally to the units registered in each port (and thus associated with each fishing ground) according to the Community Fishing Fleet Register, under the assumption that small-scale vessels operate closer to the associated port than larger vessels do.
The related fishing effort deployed was obtained in terms of average number of fishing days by gear and year, and it was estimated by dividing the total number of fishing days carried out in the GSA, as obtained from the DCF data, by the number of vessels derived in step (i). The seasonality of fishing was determined according to the quarterly DCF activity data, assuming that all the fleet segments engaged in the same fishing activity used nets or longlines. The average GT and KW per vessel were derived by the Community Fishing Fleet Register, averaging the values of the vessels registered in the selected ports by main gear (Table S3 in Supplementary Material).
Association of Landings/Discards with Fishing Grounds and Fleet Segments
The times series of landings and discards for the four target species were obtained from the official DCF data. However, these data were not associated with the spatially defined fleet segments identified in the present work. To obtain this aggregation level, the production by gear and species was split among the spatially defined fleet segments by combining the information on fishing effort (number of vessels and KW) and the probability of finding a nursery and/or a spawning ground hotspot (as from the MEDISEH project outputs) in the associated fishing ground, according to the following relationship:
where L is the landing, y is the year, f is the fleet segment, g is the gear (trawlers, nets, and longlines), and sens_scores is a weight calculated as 1 + the mean probability of finding a hotspot (nursery or spawning ground) in the fishing ground of species s. A similar procedure was followed to split the discards.
Through this relationship, landings and discards are assumed positively and linearly dependent on the number and power of vessels, as well as the availability of stock in the fishing ground. The total landing was split using the same formula, omitting the sens_scores coefficients. The consequences of three management scenarios alternative to the status quo were investigated using the BEMTOOL model (Rossetto et al., 2015; Spedicato, 2016; see Section Simulated Scenarios in BEMTOOL).
Modeling: The BEMTOOL Platform
The BEMTOOL platform incorporates six operational modules, as follows: Biological, Pressure (the core model is ALADYM; Lembo et al., 2009), Economic, Behavioral, Policy/Harvest Rules, and Multi Criteria Decision Analysis (MCDA). BEMTOOL follows a multi-fleet approach and simulates the effects of several management trajectories on stocks and fisheries on a fine time scale (month). The model accounts for fleet interactions, length/age-specific selection effects, discards, and socioeconomic performance. A wide set of biological, pressure, and economic indicators is the default output. In this study, SSB, landings, discards, and revenues were considered the prominent indicators.
The most recent results presented in the STECF and GFCM stock assessment working groups for the Mediterranean were used to parameterize the different components of BEMTOOL model. Specifically, the results of the following assessments were used: European hake (FAOSAC, 2015), red mullet (FAOSAC, 2014), giant red shrimp [FAOSAC, 2014; Scientific Technical and Economic Committee for Fisheries (STECF), 2016b], and deep-water rose shrimp (Facchini et al., 2016; FAOSAC, 2017).
In Table 2, a summary of the biological parameters is presented, while the recruitment and total mortality times series used to simulate each stock in hind-casting mode are shown in Figure S3 in the Supplementary Material. The same natural mortality was assumed in all years (Figure S3 in Supplementary Material).
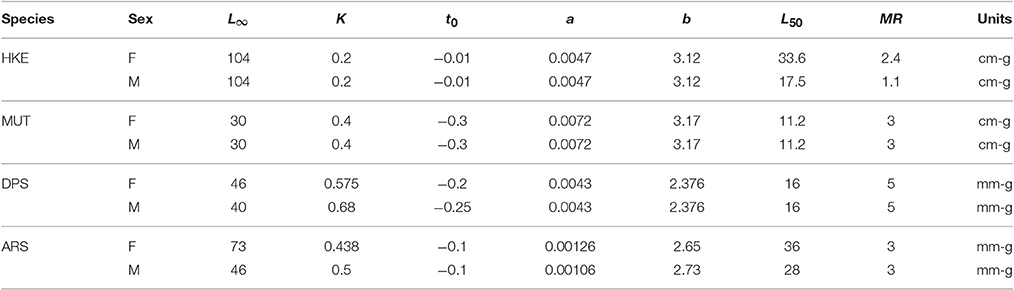
Table 2. Biological parameters per stock L∞, K, and t0 von Bertalanffy growth parameters, and b length-weight relationship coefficients, size at first maturity (L50), and maturity range (MR).
The uncertainty (process error) implemented in the model following the Monte Carlo paradigm allows a risk evaluation in terms of sustainability of the different management strategies. The process error was implemented using a lognormal multiplicative error with a mean of 0 and standard deviation of 0.3. This error was applied to the recruitment to take into account the uncertainty due to the process error; in turn, this was propagated to all relevant output indicators. Given that stock recruitment relationships were not available for the stocks studied in the present paper, a geometric mean of the last 3 years (recruitment values from the most recent stock assessments) was used for projecting the populations.
The effort of the different fleet segments was simulated according to the capacity, activity, power, and GT described in Section Identification of Fishing Grounds. Figure S4 in the Supplementary Material reports the selectivity functions used to shape the fishing mortality of the different stocks and fleet segments by size and age.
Discards were considered only for deep-water rose shrimp, European hake, and red mullet; they were negligible and not considered in the assessment of giant red shrimp. The discard volume was modeled according to a reverse ogive, with the following lengths at which 50% of individuals are discarded: 17 cm of total length for European hake, 10.5 cm of total length for red mullet, and 17 mm of carapace length for deep-water rose shrimp.
The revenues by species were by estimated applying average prices of each target species to the landing per species [Scientific Technical and Economic Committee for Fisheries (STECF), 2016a]. The same price was applied to all fleet segments. The total annual revenues of past and current years were approximated by means of a correction factor estimated by gear for 2013 (Mannini and Sabatella, 2015), which was given by the following formula:
where TL is the total landing by gear g, pg is the average price for the whole production for gear g, Lg is the landing of species s for gear g, and ps is the price of species s. The same correction factor was used to derive the total revenues in the forecast. The total landings by fleet segment in the forecast years were estimated with a correction factor calculated as the ratio between total landings and the sum of the target species in 2015.
Prices of all the target species were assumed to be inversely dependent on total landings according to the following relationship, with the elasticity coefficient equal to −0.2 (Camanzi et al., 2010):
where ps,fs,t is the price of the target species s for fleet segment fs at time t, Ls,fs,t is the landings of the target species s for fleet segment fs at time t, and εs,fs,landing represents the elasticity coefficient price-landings for species s and fleet segment fs (in €/kg).
Simulated Scenarios in BEMTOOL
A series of scenarios, including the status quo, was tested, and the effects of these scenarios were forecasted for the year 2023. This allowed to consider the time span in which the cohorts of the population of the longer-living species (European hake, about 15 years) in the pool of the target stocks reached the bulk for biomass. The definition of the scenarios was based on the reasoning that a temporal stop of fishing activity, for a whole calendar month, is already applied, and thus, there may be a higher level of acceptability for managers and stakeholders. A temporal stop is also generally viewed as a non-irreversible measure that can leave more room in the sector to adapt to possible social and economic consequences of management actions. To evaluate the performance of additional seasonal fishing bans to the 1-month measure already in place for trawlers in the area, three strategies were designed and projected for 2023 in addition the status quo, as follows:
• (S1) Status quo: fishing activity projected as in the current situation;
• (S2) Seasonal fishing ban for all trawlers in June and July (Seasonal FB DTS);
• (S3) Differentiated fishing ban for trawlers, as reported in Table 3 (Rotated FB DTS); and
• (S4) The same as Scenario 3 with the addition of the following:
• An extended seasonal fishing ban for A_DTS_VL1224, BCD_DTS_VL1224, and IJ_DTS_VL1224 in August (for half a month); and
• A seasonal fishing ban for small-scale fleets—longlines stopped from January to March and nets in May and November (Fishing ban extended ALL).
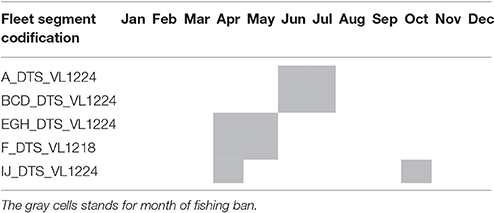
Table 3. Differentiated fishing ban related to scenario S3.
The rationale of scenario 2 was to extend the seasonal fishing ban for all trawlers for the 2 months with a remarkable occurrence of recruits of the target species considered in the present paper.
The aim of scenario 3 was to search for a trade-off between the need to reducing the fishing impact while ensuring a certain availability of landings, which is generally considered an issue by fishers. The differentiated fishing ban was conceived to seasonally stop the following:
• Fleets with a higher share of production (BCD_DTS_VL1224 and A_DTS_VL1224 fleet segment) in June and July, as in scenario 2;
• Fleets EGH_DTS_VL1224 and F_DTS_VL1218, which have deep-water rose shrimp and giant red shrimp as their main targets in April and March, months that are quite important for the recruitment of these species; and
• Fleet IJ_DTS_VL1224 in April and October, given the presence of European hake and deep-water rose shrimp, for which recruitment is important in these months, in the macro-area of the hotspot nurseries.
Scenario 4 aimed to further reduce the fishing mortality for all the fleets, thereby limiting the impact of the fleet segment generally targeting the adult component of the target stocks. The change in activity (number of days × vessels) is shown in Table S4 of the Supplementary Material for each fleet segment and scenario.
Results
Regarding the identification of fishing grounds (Figure 1E), it is remarkable that the fishing ground A overlaps with the persistent nursery areas of European hake and giant red shrimp, located on the shelf and shelf break/upper slope between Otranto and Santa Maria di Leuca, respectively (Figure S1 in Supplementary Material). On the same fishing ground, there is also an overlap in the spawning areas of giant red shrimp and deep-water rose shrimp (Carlucci et al., 2009; Colloca et al., 2015; Druon et al., 2015; Figure S1 in Supplementary Material). Fishing grounds B and C, in the areas off Gallipoli and Taranto, respectively, share common characteristics. Specifically, the nursery area of giant red shrimp and the spawning area of deep-water rose shrimp are exploited in both fishing grounds (Figure 2).
The spawning area of red mullet observed offshore at Policoro on the shelf bottoms down to 100–150 m seems to be shared between fishing grounds C and D (Figure 2). However, this fishing ground also seems to be characterized by the exploitation of European hake, giant red shrimp, and deep-water rose shrimp around the Amendolara Seamount, on the shelf and shelf break/upper slope, respectively.
The fishing grounds off Crotone (E) and Roccella Ionica (G) seem to be exploited for catching blue and red shrimp and giant red shrimp. Indeed, the configuration of the bottom, with its extremely narrow shelf, is suitable for deep fishing. These fishing grounds also include the nursery areas of deep-water rose shrimp on the shelf break and the spawning area of deep-water rose shrimp on the upper slope. Furthermore, the fishing grounds of Catanzaro (F) and Reggio Calabria (H) are located on the shelf, where a spawning area of red mullet was detected overlapping with the biocenoses of coarse and fine well-sorted sands and the biocenoses of terrigenous muds.
Fishing ground I (area off Catania) includes an aggregation area for the recruits and spawners of deep-water rose shrimp (Figure S1 in Supplementary Material). In this fishing ground, a partial overlap with the shallower nursery area of European hake and the spawning area of red mullet also occurs on the bottom down to a depth of 200 m (Figure 2).
Finally, fishing ground J, south of Portopalo di Capo Passero, is an area where the trawling activity is concentrated from late spring to the autumn. The main target species is deep-water rose shrimp. Indeed, this fishing ground includes aggregation areas for both recruits and spawners.
The major amount of production is caught by the fleet segments fishing in fishing grounds B, C, and D for all species under consideration. Especially, about the 85% of the deep-water rose shrimp production is fished by fleet segments BCD_DTS_VL1224 and IJ_DTS_VL1224. The results of the associations among landings/discard and fishing grounds-fleet segments are reported in the Supplementary Material (Figure S2).
Considering the simulation of management scenarios, the model results highlight the highest rebuilding of the SSB for all target stocks in S4, whereas maintaining the status quo in terms of fishing activity and exploitation pattern would lead to the lowest predicted SSB level (Figure 3). This is expected because, among the tested management strategies, S4 was devised to have a more efficient impact on the reduction of fishing mortality and the change in the exploitation pattern through a seasonal fishing ban affecting all fleet segments in several periods. These periods span almost all year round, with an overlap of only 2 months among the fleet segments EFGH_DTS, IJ_DTS, and nets.
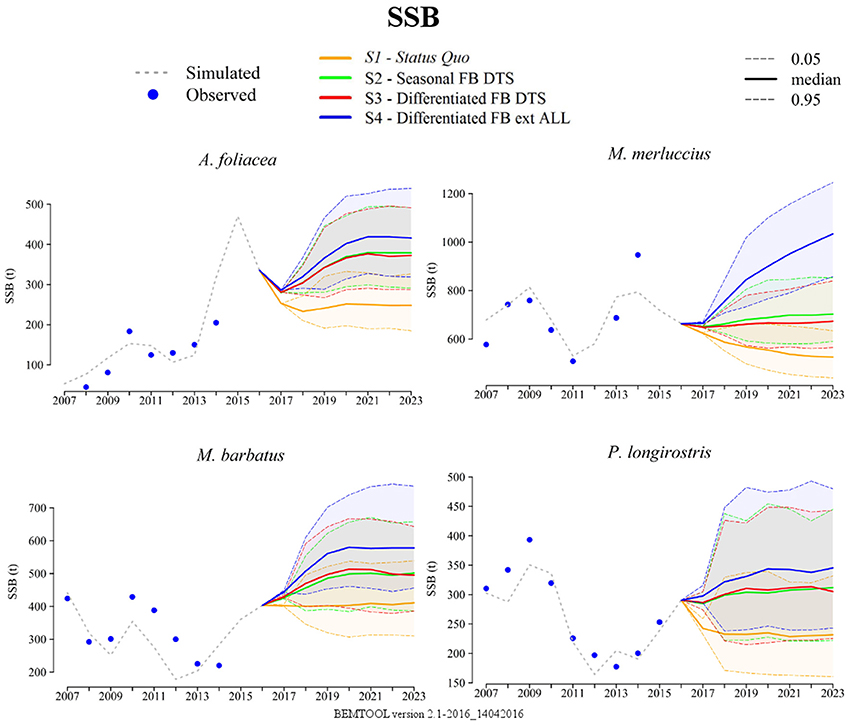
Figure 3. Comparison among the scenarios for the spawning stock biomass (SSB) of the four target stocks in the hindcasting (2007–2016) and forecasting (2017–2023) timelines. Dotted line, Hindcasting from the bioeconomic modeling tool (BEMTOOL); Blue points, estimates from stock assessments.
The projections of discards (Figure 4) show that S3 and S4 have similar results, as discards are exclusively due to trawlers and the two scenarios differ only by a seasonal fishing ban that is half a month longer for trawlers in S4. Moreover, the seasonal fishing bans involving nets and longlines do not affect discards. The lowest values of discards correspond to S2 for deep-water rose shrimp and European hake, while lesser discards of red mullet are predicted in S3 and S4.
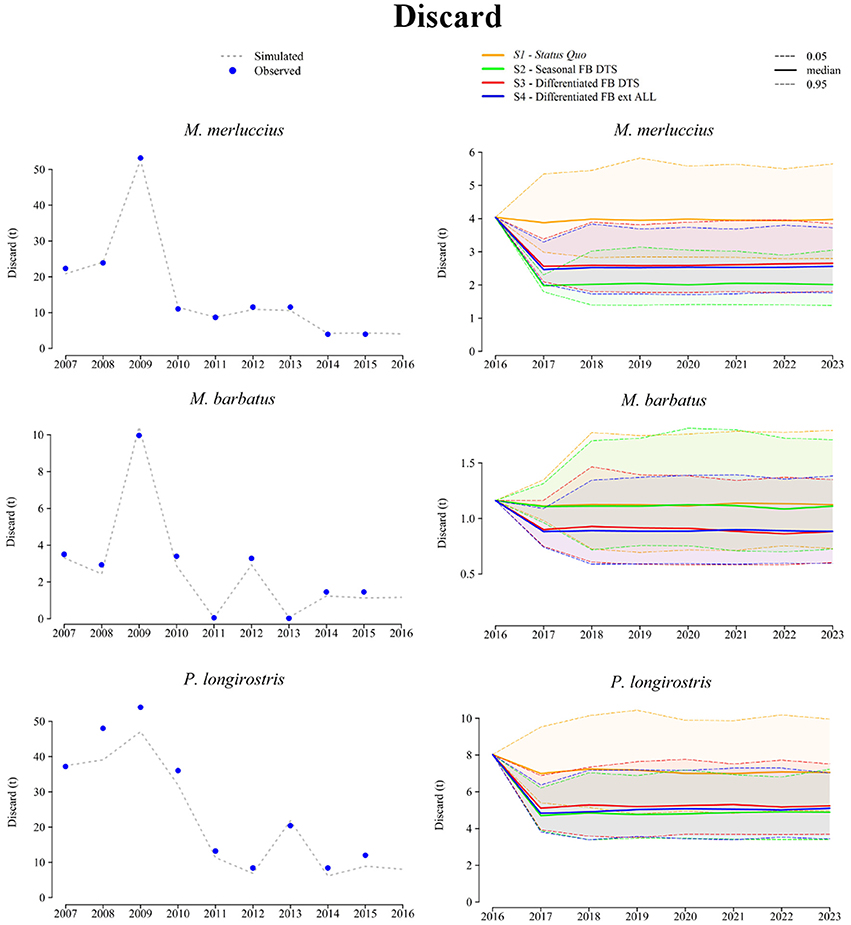
Figure 4. Comparison among the scenarios of discards (trawlers) of European hake, red mullet, and deep-water rose shrimp in the hindcasting (2007–2016) and forecasting (2017–2023) timelines. Dotted line, Hindcasting from the bioeconomic modeling tool (BEMTOOL); Blue points, observed discard (DCF data).
For European hake and giant red shrimp, the forecasts of landings (Figure 5) under S2 and S3 do not differ substantially from the status quo, exhibiting only a slight improvement. This effect is amplified for European hake under S4 (Figure 5), given that the landing of this stock is made up of 40% from trawlers and of 60% from nets and longlines (Figures 6, 7).
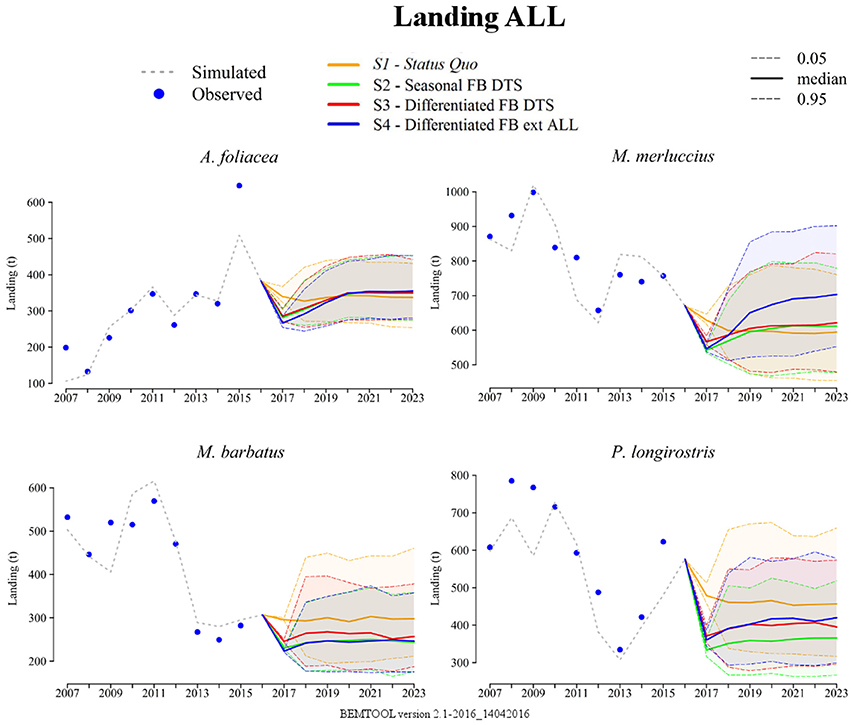
Figure 5. Comparison among the scenarios of landings (all fleet segments) by target stocks in the hindcasting (2007–2016) and forecasting (2017–2023) timelines. Dotted line, Hindcasting from the bioeconomic modeling tool (BEMTOOL); Blues points, observed landing (DCF data).
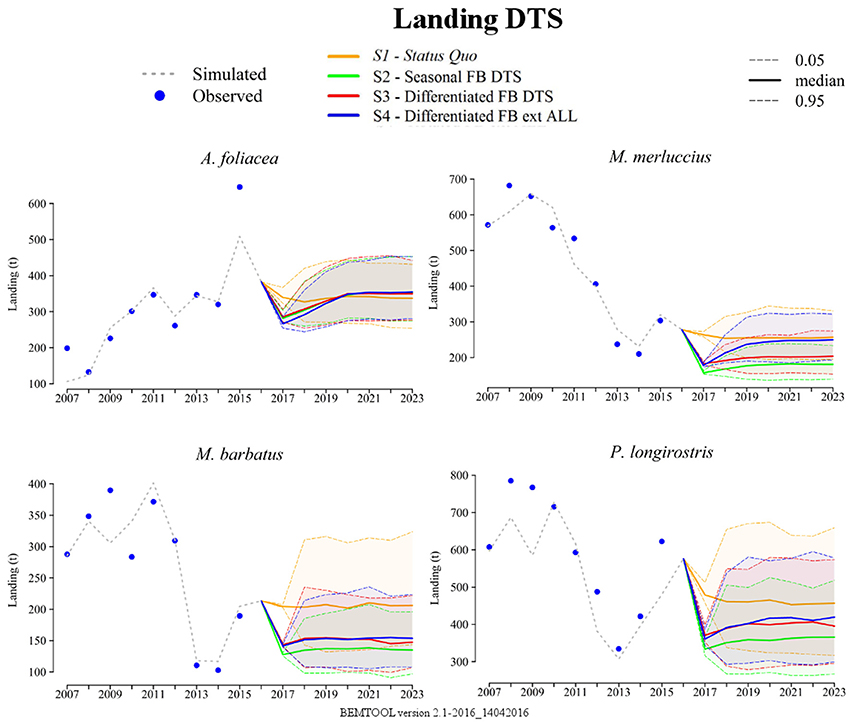
Figure 6. Comparison among the scenarios of landings (trawlers) by target stocks in the hindcasting (2007–2016) and forecasting (2017–2023) timelines. Dotted line, Hindcasting from the bioeconomic modeling tool (BEMTOOL); Blues points, observed landing (DCF data).
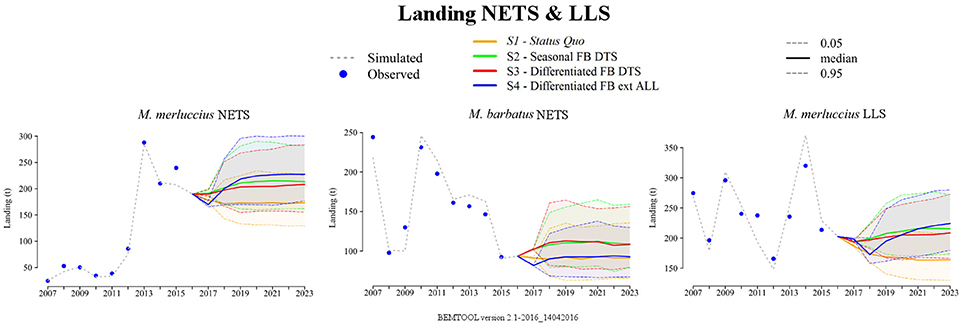
Figure 7. Comparison among the scenarios of landings (nets and longlines) of European hake and red mullet in the hindcasting (2007–2016) and forecasting (2017–2023) timelines. Dotted line, Hindcasting from the bioeconomic modeling tool (BEMTOOL); Blues points, observed landing (DCF data).
If the fleet segments are considered, the landings of trawlers predicted for 2023 for the status quo slightly exceed (upper limit of confidence intervals) those of S2, S3, and S4, except for giant red shrimp, which presents the same slight improvement in the alternative scenarios. This was expected, as the fleet segment BCD_DTS_VL1224—which is responsible for most fishing activity in the area—has the higher share (86%) of production for this species. Indeed, the landing projections produced extremely similar results, as this fleet segment halts in June and July in all the three scenarios.
Interestingly, the model outcome revealed that the rotated fishing ban of DTS (S3) would result in less severe reductions in the landings for all gears and revenues for all the species than the seasonal DTS fishing ban (S2) would, while showing an equivalent improvement in SSB (Figure 8). Especially, for European hake, S4 shows basically the same performance as the status quo for DTS landing, but it leads to slightly better results for longlines and nets. Nevertheless, setting the fishing ban even for net fleet segments would frustrate the advantages in terms of red mullet landings from other fleets that could be obtained if the fishing ban were applied only to trawlers, both in the seasonal and differentiated strategies. For longliners and nets targeting European hake, the level of predicted landings for 2023 is comparable in the three scenarios and slightly higher than in the status quo (Figure 7).
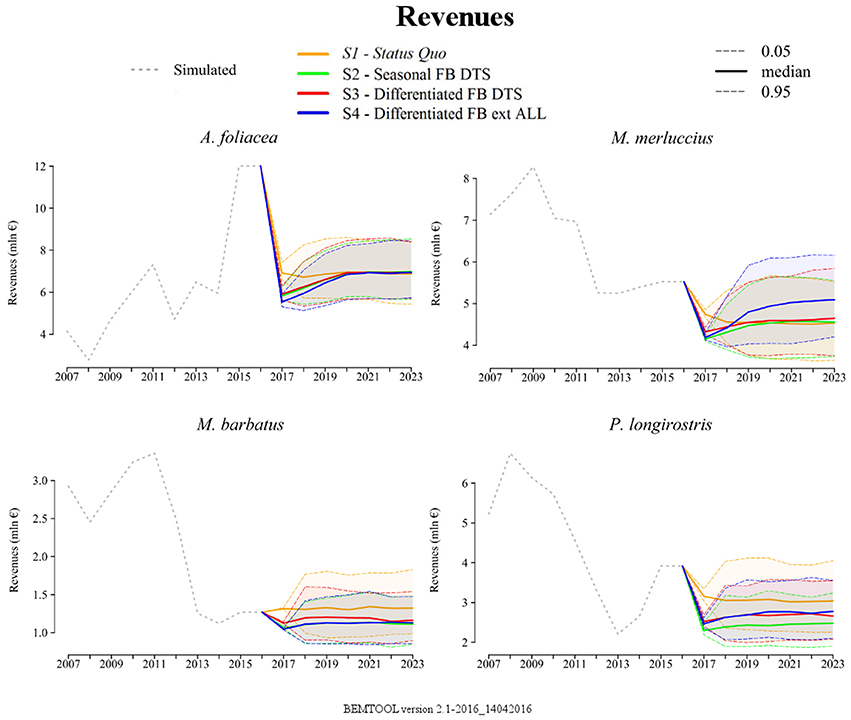
Figure 8. Comparison among the scenarios of revenues (all gear) in the hindcasting (2007–2016) and forecasting (2017–2023) timelines. Dotted line, Hindcasting from the bioeconomic modeling tool (BEMTOOL).
The performances of the three scenarios compared to the status quo are synthesized in Figure 9, considering the percentage variations of the contributions of the six main model-based indicators, as follows: SSB, landings of target species, landings of other species, discards, revenues for target species, and revenues for other species. S4 is expected to give better results in terms of the different indicators, but focusing on SSB, this would increase considerably compared to the other two scenarios. However, the global performances of S2 and S3 were extremely similar, and the effects of the two scenarios are equivalent in terms of overall influence on the pool of indicators considered in the predictions.
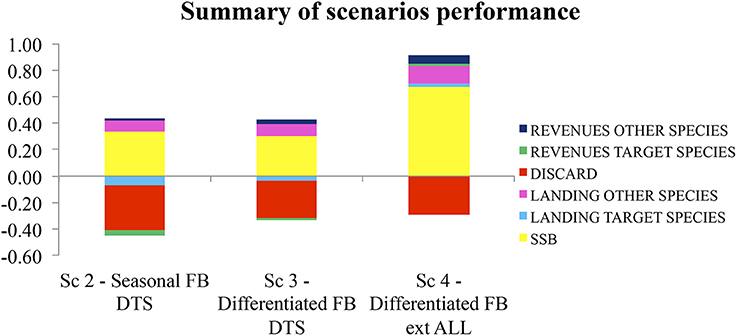
Figure 9. Summary of the performance of the management scenarios compared to the status quo (difference in %) considering the following model-based indicators: spawning stock biomass (SSB), landing of target species, landing of other species, discards, revenues of target species, and revenues of other species.
Discussion
As a first general consideration, the results of this study support the idea that managing the access to fishing grounds by means of gear-specific regulation could have relevant effects on both the status of living marine resources and the economic aspects of fisheries. This is in agreement with previous theoretical explorations (Holland, 2003; Zeller and Reinert, 2004; Pelletier et al., 2009; Dunn et al., 2011; Dowling et al., 2012; Rassweiler et al., 2012; Russo et al., 2014b; Scarcella et al., 2014; Spedicato, 2016) and empirical observations (Begg and Marteinsdottir, 2003; Rouyer et al., 2008) in this field. However, the novelty of this study could be evidenced mainly in the following elements:
(i) While previous studies combined different data sources, such as VMS and landing data (Campbell et al., 2014) or VMS and logbooks (Chang, 2011; Gerritsen and Lordan, 2011; Russo et al., 2016b) to investigate the behavior and potential management of large vessels, the present study instead considered all relevant fleet segments (including small-scale fisheries) with their specific spatial allocation and gear, modeling, and forecasting of management effects;
(ii) We integrated a wide heterogeneous set of data and expert knowledge to characterize fleet segments through their effort, production, and selectivity. These sets of information ranged from satellite tracking device (i.e., VMS) data to empirical observations carried out within the routine DCF activities. This characterization of fisheries dynamics has been crucial for the simulation approach;
(iii) A considerable effort was devoted to the design of specific scenarios calibrated to the characteristics of the fisheries and the main target resources of the study area; and
(iv) All aspects of fishing activity, from revenues to discards, were considered, thereby anticipating the next challenge of fisheries management regarding the landing obligation [Scientific Technical and Economic Committee for Fisheries (STECF), 2015].
In the Mediterranean, stock conditions and fleet production are generally impaired by a combination of high fishing mortality and suboptimal exploitation patterns, with many small-sized catches determined by technical characteristics, such as the small mesh size in the trawl cod-end. In fact, some recent studies have reported that a rough reduction in the fishing mortality without any change in the fishing selectivity will not determine rebuilding of stock biomass and maintenance of fisheries' yields and revenues at an acceptable level (Colloca et al., 2013). The results of the present paper confirmed this finding, showing that the potential losses caused by the reduced activity were overcompensated by the positive effect of such reduction on the stock productivity. Moreover, stock rebuilding (occurring when the exploitation pattern changes toward larger sizes in species with longer life spans) and the effect of reduced pressure are thus propagated over several cohorts. Looking back at the seminal works in fisheries sciences (e.g., Beverton and Holt, 1957), the optimal fishing mortality for an exploited stock relies on the relative exploitation pattern. This means that a simple reduction in the fishing mortality cannot guarantee sustainable conditions if it is not combined with a relatively low exploitation of immature fish. This has also been recently underlined in the Report of the Working Group on the Assessment of Demersal Stocks in the North Sea and Skagerrak (ICES, 2015): “There is a need to reduce fishing induced mortality on North Sea cod further, particularly for younger ages, in order to allow more fish to reach maturity and increase the probability of good recruitment.”
The current technical regulations at the European Mediterranean level (EU, 2006) on the minimum landing size for a group of key species and the increase of cod-end mesh size to improve selectivity for trawlers do not seem sufficient to recover fish stocks from overexploitation [Scientific Technical and Economic Committee for Fisheries (STECF), 2016a; Cardinale and Scarcella, 2017], probably due to difficulties in the control procedures, as well as in the level of compliance. In addition, a positive effect of the landing obligation on this issue is quite uncertain so far. This paper made an effort in this direction by evaluating the effect of alternative management measures on the discards of the investigated species. Indeed, the additional protection in August implemented in S4 and the seasonal ban of IJ_DTS_VL1224—the second most important fleet segment in terms of capacity—in October decreased the discard volume of red mullet. In this month, there is still a high presence of the young-of-the-year of red mullet, given the effects of the already enforced seasonal fishing ban currently implemented in September.
The case study implemented in this paper is considered to be sufficiently representative of the demersal fishery in GSA 19, because it includes a consistent part of the fleet exploiting the demersal species in the area. In addition, the gears considered represent 62% of the total production in the area, and the target species—European hake, red mullet, deep-water rose shrimp, and giant red shrimp—make up 33% of demersal species' total landing. They are the targets driving the fisheries configuration in the area [Scientific Technical and Economic Committee for Fisheries (STECF), 2016a].
The landings forecasted in the status quo, maintaining the current exploitation pattern and fishing activity, were extremely consistent with historical data for all the examined species, returning 2023 landing volumes in line with the level observed in the last years of the time series. In contrast, the landings forecasted for 2023 for European hake were expected to decrease in comparison with those observed in the time series of the last years, thereby continuing the observed decline. Regarding the SSB, the status quo simulations showed a substantial increase only for giant red-shrimp in 2015, supported by a gain of the same magnitude in the observed landings of the same year. This relevant trend is due to the hefty 2013-year class (Mannini and Sabatella, 2015), confirmed even by the observations in the scientific trawl survey in the Mediterranean (MEDITS). Thus, for this species, the SSB projections exceed those of the time series due to the assumption of a stock recruitment relationship, represented by the geometric mean of the last 3 years (2013–2015) and influenced by the peak in recruitment observed in 2013.
For the other species, the SSB projections in the status quo are generally in line with the historical estimates of recent stock assessments. The lack of reliable stock recruitment relationships other than the geometric mean are generally mitigated by the timeline of the predictions in the designed scenarios and by the fact that the measures proposed and the introduced uncertainty are buffers against recruitment failures.
The methods assume that the present bioeconomic conditions (recruitment, stock abundance, and fish prices) will not change substantially in 2017–2023, unless they change due to the designed management measures. Full compliance with such measures is also assumed, and the reduction in fishing effort is linearly translated into a reduction in fishing mortality (lacking other complementary information), under the assumptions of nearly constant or randomly varying catchability according to time but varying catchability among the fleets. Furthermore, the modeling exercise did not consider some possible rearrangements of fleets in terms of both absolute size and relative presence of each gear.
The scenarios designed were specifically conceived to protect juveniles of the exploited populations both in space and time, considering both the recruitment time and the exploitation pattern of the vessels fishing in the different fishing grounds. The alternating fishing ban (Dunn et al., 2011; Rassweiler et al., 2012; Russo et al., 2014b; Plagányi et al., 2015) can be considered a management strategy that, given a feasible control in the harbors—as for the seasonal fishing ban—could efficiently change the exploitation pattern, thereby redirecting the fishing activity toward biggest individuals and making the harvest strategy more viable. Indeed, this alternating fishing ban could produce a less severe impact on landings and revenues than the seasonal fishing ban does, while having almost the same effect on the improvement in the SSB and reducing the proportion of smaller individuals, which are less profitable in the market. Indeed, Beverton and Holt's paradigm calls for fishing across the widest possible ranges of species, stocks, and sizes in an ecosystem, in proportion to their natural productivity (Garcia et al., 2012), the so-called balanced harvesting (Zhou et al., 2010; Garcia et al., 2012; Rochet et al., 2013). Balanced harvesting, in line with EAFM, aims to minimize the effects of fishing on marine fish communities and ecosystems by protecting juvenile fish from fishing and taking adults in proportion to their productivity (Jacobsen et al., 2013). In other words, moderate fishing rates addressing more productive cohorts would relax the impact on the population size structure and lead to higher yields (Froese et al., 2008). Nevertheless, no attempt has been made so far to disentangle the effects of fishing mortality and minimum size limits on the size structure of an exploited population (Froese et al., 2016). The present work contributes in this direction, given that fishing effort reduction was modeled using the time of offspring occurrence as a driving factor in establishing fishing closure. This was possible given the flexibility of the bioeconomic model, which allows a parameterization in the biological core model at the month scale.
Here, fleet performances were evaluated only in terms of revenues, which are considered a meaningful indicator representing the socioeconomic consequences of the different scenarios in a relatively complete way. This because the fleet of each harbor operates in the nearest portion of shelf and/or slope, and thus the costs (variable, fixed, capital, and labor) are also equivalent in the implemented management measures.
According to Spedicato (2016), in GSA 18 (contiguous to GSA 19), the costs (summing up fixed, variable, capital, and labor costs) supported by trawlers between 12 and 18 m are, on average (2008–2014), 74% of the total revenues, while for longlines, they are about 63%, and for small-scale fishery they are about 86%. The fixed costs sustained by vessels independently from the fishing activity (administration, obligatory insurance, fishing license, harbor charges, etc.) were reported to be about 4%, while the labor cost was about 25%, and the variable costs were about 35%. The same percentages can be reasonably assumed to be supported by the GSA 19 fleet.
In the proposed scenario, vessel owners should support the fixed, capital, and investment costs entirely. However, applying the explored management measures, revenues similar to the historical values for GSA 19 are expected; this is because, in the future, the fleets may be able to reach or even exceed the current level of profit. This may counterbalance the risk of underutilization for some stocks.
Indeed, as shown by the present study, the remarkable benefit obtained for European hake stock, as well as the increase of the overall landing in S4 scenario, compensates for the slight underutilization of red mullet and deep-water rose shrimp. This is the consequence of a combination of several factors, such as the life history traits of these species (faster growth rates, shorter lifespans) and an exploitation pattern that is less affected by the occurrence of small individuals for the species.
There is an urgent need for management measures in addition to those currently in place to avoid a further deterioration of the productivity of the stocks being overexploited (e.g., fishing mortality of hake largely exceeding the reference point; FAOSAC, 2015). This is also important because landings of key species are in sharp decline, while the fishing effort appears slightly reduced.
The results of this study, although obtained using a simulation-based approach, clearly confirmed that significant improvements of stock conditions could be achieved by protecting critical life stages through the fishing bans of well-defined areas and times. Future developments of this work could address the exploration of alternative scenarios related to changes in fleet capacity (i.e., fleet segment size) and/or technical aspects of gears that influence selectivity. Furthermore, it could be interesting and potentially useful to set up a roadmap based on stakeholder involvement to identify shared scenarios to be evaluated (e.g., Lembo et al., submitted). This could guarantee more reliable advice for the management bodies, even supporting the participative component that represents another key aspect of the new CFP.
Author Contributions
All authors listed have made a substantial, direct and intellectual contribution to the work, and approved it for publication.
Conflict of Interest Statement
The authors declare that the research was conducted in the absence of any commercial or financial relationships that could be construed as a potential conflict of interest.
Acknowledgments
The data used in this paper were collected under the European framework for the collection and management of fisheries data (Data Collection Framework) supported by the European Commission (DGMARE) and the Italian Ministry of Agriculture, Food and Forestry Policies (MIPAAF). This work was also supported by the MIPAAF research project “Basi scientifiche e strumenti a supporto dei Piani di Gestione della pesca nell'ambito della Politica Comune della Pesca e delle politiche ambientali ed economiche.” The funders had no role in study design, data collection and analysis, decision to publish, or preparation of the manuscript. We are grateful to the colleagues of the respective laboratories engaged in the data collection.
Supplementary Material
The Supplementary Material for this article can be found online at: https://www.frontiersin.org/article/10.3389/fmars.2017.00193/full#supplementary-material
References
Bastardie, F., Rasmus Nielsen, J., and Mietheb, T. (2014). DISPLACE: a dynamic, individual-based model for spatial fishing planning and effort displacement — integrating underlying fish population models. Can. J. Fish. Aquat. Sci. 71, 366–386. doi: 10.1139/cjfas-2013-0126
Begg, G. A., and Marteinsdottir, G. (2003). Spatial partitioning of relative fishing mortality and spawning stock biomass of Icelandic cod. Fish. Res. 59, 343–362. doi: 10.1016/S0165-7836(02)00025-5
Beverton, R. J. H., and Holt, S. J. (1957). On the Dynamics of Exploited Fish Populations, Vol. 19. Fishery Investigations/Ministry Of Agriculture, Fisheries And Food, Great Britain (2 Sea Fish.), 533.
Bivand, R., Altman, M., Anselin, L., Assunção, R., Berke, O., Bernat, A., et al. (2016). Package “spdep” Spatial Dependence: Weighting Schemes, Statistics and Models. p. 232. Available online at: https://cran.r-project.org/web/packages/spdep/index.html
Camanzi, L., Mulazzani, L., and Malorgio, G. (2010). Northern Adriatic Ex-vessel Markets' Integration: An Empirical Investigation on Small Pelagic Species. EAFE Work. “Optimising Value Chain. Fish. Available online at: http://www.helsinki.fi/economics-management/research/yle/research/research_areas/presentations/Camanzi_Mulazzani_Malorgio_2010_EAFE_Helsinki_slides.ppt
Campbell, M. S., Stehfest, K. M., Votier, S. C., and Hall-Spencer, J. M. (2014). Mapping fisheries for marine spatial planning: Gear-specific vessel monitoring system (VMS), marine conservation and offshore renewable energy. Mar. Policy 45, 293–300. doi: 10.1016/j.marpol.2013.09.015
Capezzuto, F., Carlucci, R., Maiorano, P., Sion, L., Battista, D., Giove, A., et al. (2010). The bathyal benthopelagic fauna in the north-western Ionian Sea: structure, patterns and interactions. Chem. Ecol. 26, 199–217. doi: 10.1080/02757541003639188
Carbonara, P. (2013). Programma Nazionale Italiano per la Raccolta di Dati Alieutici. Campionamento Biologico delle Catture. Sezioni C ed E. Rapp. Final. GSA 19 Mar Ionio, COISPA Tecnologia e Ricicerca, Italia, p. 158.
Carbonara, P. (2015). Programma Nazionale Italiano per la Raccolta di Dati Alieutici. Campionamento Biologico delle Catture. Sezioni C ed E. Rapp. Final. GSA 19 Mar Ionio, COISPA Tecnologia e Ricicerca, Italia, p. 75.
Cardinale, M., and Scarcella, G. (2017). Mediterranean sea: a failure of the european fisheries management system. Front. Mar. Sci. 4:72. doi: 10.3389/fmars.2017.00072
Carlucci, R., Lembo, G., Maiorano, P., Capezzuto, F., Marano, C. A., Sion, L., et al. (2009). Nursery areas of red mullet (Mullus barbatus), hake (Merluccius merluccius) and deep-water rose shrimp (Parapenaeus longirostris) in the Eastern-Central Mediterranean Sea. Estuar. Coast. Shelf Sci. 83, 529–538. doi: 10.1016/j.ecss.2009.04.034
Carlucci, R., Maiorano, P., Sion, L., D'Onghia, G., and Tursi, A. (2015). The Sustainability of Fishingin the Southern Adriatic and Northern Ionian Seas. Available online at: http://www.unimc.it/maremap/it/pubblicazioni/Carluccietal.WP1_2015.pdf
Chang, S.-K. (2011). Application of a vessel monitoring system to advance sustainable fisheries management—benefits received in Taiwan. Mar. Policy 35, 116–121. doi: 10.1016/j.marpol.2010.08.009
Colloca, F., Cardinale, M., Maynou, F., Giannoulaki, M., Scarcella, G., Jenko, K., et al. (2013). Rebuilding Mediterranean fisheries: a new paradigm for ecological sustainability. Fish Fish. 14, 89–109. doi: 10.1111/j.1467-2979.2011.00453.x
Colloca, F., Garofalo, G., Bitetto, I., Facchini, M. T., Grati, F., Martiradonna, A., et al. (2015). The seascape of demersal fish nursery areas in the North Mediterranean Sea, a first step towards the implementation of spatial planning for trawl fisheries. PLoS ONE 10:e0119590. doi: 10.1371/journal.pone.0119590
D'Onghia, G., Calculli, C., Capezzuto, F., Carlucci, R., Carluccio, A., Grehan, A., et al. (2016). Anthropogenic impact in the Santa Maria di Leuca cold-water coral province (Mediterranean Sea): observations and conservation straits. Deep Sea Res. II Top. Stud. Oceanogr. doi: 10.1016/j.dsr2.2016.02.012
D'Onghia, G., Maiorano, P., Carlucci, R., Capezzuto, F., Carluccio, A., Tursi, A., et al. (2012). Comparing deep-sea fish fauna between coral and non-coral “megahabitats” in the Santa Maria di Leuca cold-water coral province (Mediterranean Sea). PLoS ONE 7:e44509. doi: 10.1371/journal.pone.0044509
D'Onghia, G., Maiorano, P., Sion, L., Giove, A., Capezzuto, F., Carlucci, R., et al. (2010). Effects of deep-water coral banks on the abundance and size structure of the megafauna in the Mediterranean Sea. Deep. Res. II Top. Stud. Oceanogr. 57, 397–411. doi: 10.1016/j.dsr2.2009.08.022
Dowling, N. A., Wilcox, C., Mangel, M., and Pascoe, S. (2012). Assessing opportunity and relocation costs of marine protected areas using a behavioural model of longline fleet dynamics. Fish Fish. 13, 139–157. doi: 10.1111/j.1467-2979.2011.00422.x
Druon, J. N., Fiorentino, F., Murenu, M., Knittweis, L., Colloca, F., Osio, C., et al. (2015). Modelling of European hake nurseries in the Mediterranean Sea: an ecological niche approach. Prog. Oceanogr. 130, 188–204. doi: 10.1016/j.pocean.2014.11.005
Dunn, D. C., Boustany, A. M., and Halpin, P. N. (2011). Spatio-temporal management of fisheries to reduce by-catch and increase fishing selectivity. Fish Fish. 12, 110–119. doi: 10.1111/j.1467-2979.2010.00388.x
EC (2003). Commission Regulation (EC) No 2244/2003 of 18 December 2003 laying down detailed provisions regarding satellite-based Vessel Monitoring Systems. Off. J. Eur. Union L333, 17–27. Available online at: http://eur-lex.europa.eu/legal-content/EN/TXT/PDF/?uri=CELEX:32003R2244&from=EN
EC (2008). Council Regulation (EC) No. 199/2008 concerning the establishment of a Community framework for the collection, management and use of data in the fisheries sector and support for scientific advice regarding the Common Fisheries Policy. Off. J. Eur. Union L60, 1–12. Available online at: http://eur-lex.europa.eu/legal-content/EN/TXT/PDF/?uri=CELEX:32008R0199&from=EN
EC (2009). Council Regulation (EC) No. 1224/ 2009 of 20 November 2009 Establishing a Community control system for ensuring compliance with the rules of the Common Fisheries Policy. Off. J. Eur. Union L343, 1–50. Available online at: http://eur-lex.europa.eu/legal-content/EN/TXT/PDF/?uri=CELEX:32009R1224&from=EN
EC (2011). Commission Implementing Regulation (EU) No. 404/2011 of 8 April 2011 laying down detailed rules for the implementation of Council Regulation (EC) No 1224/2009 establishing a Community control system for ensuring compliance with the rules of the Common Fisheries Policy. Off. J. Eur. Union L112, 1–30. Available online at: http://eur-lex.europa.eu/legal-content/EN/TXT/PDF/?uri=CELEX:32011R0404&from=EN
EC (2013). Regulation No 1380/2013 of the European Parliament and of the Council of 11 December 2013 on the Common Fisheries Policy. Off. J. Eur. Union L354/22, 22–61. Available online at: http://eur-lex.europa.eu/legal-content/EN/TXT/PDF/?uri=CELEX:32013R1380&from=EN
EC (2014). Innovation in the Blue Economy: Realising the Potential of Our Seas and Oceans for Jobs and Growth. Available online at: http://eur-lex.europa.eu/legal-content/EN/TXT/PDF/?uri=COM:2014:254:REV1&from=EN
Eigaard, O. R., Bastardie, F., Breen, M., Dinesen, G. E., Hintzen, N. T., Laffargue, P., et al. (2016). Estimating seabed pressure from demersal trawls, seines, and dredges based on gear design and dimensions. ICES J. Mar. Sci. 73, 27–43. doi: 10.1093/icesjms/fsv099
EU (2006). Council Regulation (EC) No. 1967/2006 of 21 December 2006 Concerning Management Measures for the Sustainable Exploitation of Fishery Resources in the Mediterranean Sea, Amending Regulation (EEC) No. 2847/93 and Repealing Regulation (EC) No. 1626/94, EU. Available online at: http://nationallegislation.gfcmsecretariat.org/img_auth.php/c/c5/1967-2006.pdf
Facchini, M. T., Carlucci, R., Bitetto, I., Capezzuto, F., Carbonara, P., Casciaro, L., et al. (2016). “Assessment of deep water rose shrimp, Parapenaeus longirostris in GSA19,” in GFCM Working Groups on Stock Assessment of Demersal Species (WGSAD) (Rome).
Froese, R., Stern-Pirlot, A., Winker, H., and Gascuel, D. (2008). Size matters: how single-species management can contribute to ecosystem-based fisheries management. Fish. Res. 92, 231–241. doi: 10.1016/j.fishres.2008.01.005
Froese, R., Walters, C., Pauly, D., Winker, H., Weyl, O. L. F., Demirel, N., et al. (2016). A critique of the balanced harvesting approach to fishing. ICES J. Mar. Sci. 73, 1640–1650. doi: 10.1093/icesjms/fsv122
Garcia, S. M., Kolding, J., Rice, J., Rochet, M.-J., Zhou, S., Arimoto, T., et al. (2012). Reconsidering the consequences of selective fisheries. Science 335, 1045–1047. doi: 10.1126/science.1214594
Gerritsen, H. D., Minto, C., and Lordan, C. (2013). How much of the seabed is impacted by mobile fishing gear? Absolute estimates from Vessel Monitoring System (VMS) point data. ICES J. Mar. Sci. 70, 523–531. doi: 10.1093/icesjms/fst017
Gerritsen, H., and Lordan, C. (2011). Integrating vessel monitoring systems (VMS) data with daily catch data from logbooks to explore the spatial distribution of catch and effort at high resolution. ICES J. Mar. Sci. 68, 245–252. doi: 10.1093/icesjms/fsq137
Holland, D. S. (2003). Integrating spatial management measures into traditional fishery management systems : the case of the Georges Bank multispecies groundfish fishery. 3139, 915–929. doi: 10.1016/s1054-3139(03)00097-3
ICES (2015). Report of the Working Group on the Assessment of Demersal Stocks in the North Sea and Skagerrak (WGNSSK), 28 April-7 May, ICES HQ Copenhagen, Denmark. ICESCM 2015/ACOM:13. p. 1031.
Jacobsen, N. S., Gislason, H., and Andersen, K. H. (2013). The consequences of balanced harvesting of fish communities. Proc. R. Soc. B Biol. Sci. 281:20132701. doi: 10.1098/rspb.2013.2701
Joo, R., Salcedo, O., Gutierrez, M., Fablet, R., and Bertrand, S. (2015). Defining fishing spatial strategies from VMS data: insights from the world's largest monospecific fishery. Fish. Res. 164, 223–230. doi: 10.1016/j.fishres.2014.12.004
Lee, J., South, A. B., and Jennings, S. (2010). Developing reliable, repeatable, and accessible methods to provide high-resolution estimates of fishing-effort distributions from vessel monitoring system (VMS) data. ICES J. Mar. Sci. 67, 1260–1271. doi: 10.1093/icesjms/fsq010
Lembo, G., Abella, A., Fiorentino, F., Martino, S., and Spedicato, M. T. (2009). ALADYM: an age and length-based single species simulator for exploring alternative management strategies. Aquat. Living Resour. 22, 233–241. doi: 10.1051/alr/2009024
Maiorano, P., Sion, L., Carlucci, R., Capezzuto, F., Giove, A., Costantino, G., et al. (2010). The demersal faunal assemblage of the north-western Ionian Sea (central Mediterranean): current knowledge and perspectives. Chem. Ecol. 26, 219–240. doi: 10.1080/02757541003693987
Mannini, A., and Sabatella, R. F. (2015). Annuario sullo stato delle risorse e sulle strutture produttive dei mari italiani. Biol. Mar. Mediterr. 22, 358. Available online at: http://www.nisea.eu/dir/wp-content/uploads/2017/01/Annuario-SIBM-NISEA-2015.pdf
McHich, R., Charouki, N., Auger, P., Ra, N., and Ettahiri, O. (2006). Optimal spatial distribution of the fishing effort in a multi fishing zone model. Ecol. Modell. 197, 274–280. doi: 10.1016/j.ecolmodel.2006.03.026
MEDITS (2016). MEDITS- International Bottom Trawl Survey in the Mediterranean: Instruction Manual Version 8. 177. Available online at: http://www.sibm.it/MEDITS%202011/principaledownload.htm
Pante, E., and Simon-Bouhet, B. (2013). marmap: a package for importing, plotting and analyzing bathymetric and topographic data in R. PLoS ONE 8:e73051. doi: 10.1371/journal.pone.0073051
Pelletier, D., Mahevas, S., Drouineau, H., Vermard, Y., Thebaud, O., Guyader, O., et al. (2009). Evaluation of the bioeconomic sustainability of multi-species multi-fleet fisheries under a wide range of policy options using ISIS-Fish. Ecol. Modell. 220, 1013–1033. doi: 10.1016/j.ecolmodel.2009.01.007
Plagányi, É. E., Skewes, T., Murphy, N., Pascual, R., and Fischer, M. (2015). Crop rotations in the sea: increasing returns and reducing risk of collapse in sea cucumber fisheries. Proc. Natl. Acad. Sci. U.S.A. 112, 6760–6765. doi: 10.1073/pnas.1406689112
Rassweiler, A., Costello, C., and Siegel, D. a. (2012). Marine protected areas and the value of spatially optimized fishery management. Proc. Natl. Acad. Sci. U.S.A. 109, 11884–11889. doi: 10.1073/pnas.1116193109
Rochet, M., Burny, C., Spedicato, M., Trenkel, V., and Collie, J. (2013). Does Fisheries Selectivity Affect Food Web Dynamics in a Way that Needs to be Managed? ICES CM 2013/E:03. Available online at: http://ices.dk/sites/pub/CM%20Doccuments/CM-2013/Theme%20Session%20E%20contributions/E0313.pdf
Rossetto, M., Bitetto, I., Spedicato, M. T., Lembo, G., Gambino, M., Accadia, P., et al. (2015). Multi-criteria decision-making for fisheries management: a case study of Mediterranean demersal fisheries. Mar. Policy 53, 83–93. doi: 10.1016/j.marpol.2014.11.006
Rouyer, T., Fromentin, J.-M., Ménard, F., Cazelles, B., Briand, K., Pianet, R., et al. (2008). Complex interplays among population dynamics, environmental forcing, and exploitation in fisheries. Proc. Natl. Acad. Sci. U.S.A. 105, 5420–5425. doi: 10.1073/pnas.0709034105
Russo, T., Andrea, L. D., Parisi, A., Martinelli, M., Belardinelli, A., Boccoli, F., et al. (2016a). Assessing the fishing footprint using data integrated from different tracking devices: issues and opportunities. Ecol. Indic. 69, 818–827. doi: 10.1016/j.ecolind.2016.04.043
Russo, T., Carpentieri, P., Fiorentino, F., Arneri, E., Scardi, M., Cioffi, A., et al. (2016b). Modeling landings profiles of fishing vessels: an application of self-organizing maps to VMS and logbook data. Fish. Res. 181, 34–47. doi: 10.1016/j.fishres.2016.04.005
Russo, T., D'Andrea, L., Parisi, A., and Cataudella, S. (2014a). VMSbase: an R-package for VMS and logbook data management and analysis in fisheries ecology. PLoS ONE 9:e100195. doi: 10.1371/journal.pone.0100195
Russo, T., Parisi, A., and Cataudella, S. (2011a). New insights in interpolating fishing tracks from VMS data for different métiers. Fish. Res. 108, 184–194. doi: 10.1016/j.fishres.2010.12.020
Russo, T., Parisi, A., and Cataudella, S. (2013). Spatial indicators of fishing pressure: preliminary analyses and possible developments. Ecol. Indic. 26, 141–153. doi: 10.1016/j.ecolind.2012.11.002
Russo, T., Parisi, A., Garofalo, G., Gristina, M., Cataudella, S., and Fiorentino, F. (2014b). SMART: a spatially explicit bio-economic model for assessing and managing demersal fisheries, with an application to italian trawlers in the strait of sicily. PLoS ONE 9:e86222. doi: 10.1371/journal.pone.0086222
Russo, T., Parisi, A., Prorgi, M., Boccoli, F., Cignini, I., Tordoni, M., et al. (2011b). When behaviour reveals activity: assigning fishing effort to métiers based on VMS data using artificial neural networks. Fish. Res. 111, 53–64. doi: 10.1016/j.fishres.2011.06.011
Sampson, D. B., Scott, R. D., and Quinn, T. (2011). A spatial model for fishery age-selection at the population level. Can. J. Fish. Aquat. Sci. 68, 1077–1086. doi: 10.1139/f2011-044
Scarcella, G., Grati, F., Raicevich, S., Russo, T., Gramolini, R., Scott, R. D., et al. (2014). Common sole in the northern and central Adriatic Sea: spatial management scenarios to rebuild the stock. J. Sea Res. 89, 12–22. doi: 10.1016/j.seares.2014.02.002
Scientific Technical and Economic Committee for Fisheries (STECF) (2015). Landing Obligation—Part 5 (Demersal Species for NWW, SWW and North Sea).
Scientific Technical and Economic Committee for Fisheries (STECF) (2016a). Mediterranean Assessments Part 2 (STECF 16-08).
Scientific Technical and Economic Committee for Fisheries (STECF) (2016b). Monitoring the Performance of the Common Fisheries Policy (STECF-16-05) Corrigendum to (STECF-16-03). EUR 27758 EN, JRC. Luxembourg: Publications Office of the European Union.
Spedicato, M. T. (2016). Study on the Evaluation of Specific Management Scenarios for the Preparation of Multiannual Management Plans in the Mediterranean and the Black Sea. CALL MARE/2014/27, CONTRACT NUMBER - EASME/EMFF/2014/1.3.2.7/SI2.703 193. Final Report.
Vassallo, P., D'Onghia, G., Fabiano, M., Maiorano, P., Lionetti, A., Paoli, C., et al. (2017). A trophic model of the benthopelagic fauna distributed in the Santa Maria di Leuca cold-water coral province (Mediterranean Sea). Energy Ecol. Environ. 2, 114–124. doi: 10.1007/s40974-016-0047-2
Weiner, J. (2015). Package “riverplot.” Available online at: https://cran.r-project.org/web/packages/riverplot/index.html
Zeller, D., and Reinert, J. (2004). Modelling spatial closures and fishing effort restrictions in the Faroe Islands marine ecosystem. Ecol. Modell. 172, 403–420. doi: 10.1016/j.ecolmodel.2003.09.020
Keywords: spatial management, exploitation pattern, simulations, forecast, sustainability
Citation: Russo T, Bitetto I, Carbonara P, Carlucci R, D'Andrea L, Facchini MT, Lembo G, Maiorano P, Sion L, Spedicato MT, Tursi A and Cataudella S (2017) A Holistic Approach to Fishery Management: Evidence and Insights from a Central Mediterranean Case Study (Western Ionian Sea). Front. Mar. Sci. 4:193. doi: 10.3389/fmars.2017.00193
Received: 17 March 2017; Accepted: 06 June 2017;
Published: 21 June 2017.
Edited by:
Sebastian Villasante, Universidade de Santiago de Compostela, SpainReviewed by:
Tomaso Fortibuoni, National Institute of Oceanography and Experimental Geophysics, ItalySanja Matic-Skoko, Institute of Oceanography and Fisheries, Croatia
Copyright © 2017 Russo, Bitetto, Carbonara, Carlucci, D'Andrea, Facchini, Lembo, Maiorano, Sion, Spedicato, Tursi and Cataudella. This is an open-access article distributed under the terms of the Creative Commons Attribution License (CC BY). The use, distribution or reproduction in other forums is permitted, provided the original author(s) or licensor are credited and that the original publication in this journal is cited, in accordance with accepted academic practice. No use, distribution or reproduction is permitted which does not comply with these terms.
*Correspondence: Isabella Bitetto, bitetto@coispa.it
†These authors have contributed equally to this work.