Genetic Population Structure and Demographic History of the Widespread Common Shipworm Teredo navalis Linnaeus 1758 (Mollusca: Bivalvia: Teredinidae) in European Waters Inferred from Mitochondrial COI Sequence Data
 Ronny Weigelt
 Heike Lippert
 Ulf Karsten
 Ralf Bastrop
- 1Applied Ecology and Phycology, Institute of Biological Sciences, University of Rostock, Rostock, Germany
- 2Animal Physiology, Institute of Biological Sciences, University of Rostock, Rostock, Germany
The first documented scientific reports of the common marine shipworm Teredo navalis (Bivalvia) for Central European waters date back to the time between 1700 and 1730 in the Netherlands. During the following centuries there were several irregular mass occurrences reported for both the North Sea and the Baltic Sea. These events were accompanied by massive destruction of wooden ships and coastal protection structures. In this study, the first population analysis of T. navalis is presented with the aim to detect the genetic population structure in the waters of Central Europe. The mtDNA COI (cytochrome c oxidase subunit I) locus was found as suitable molecular marker and hence a 675 bp gene fragment was studied. A total of 352 T. navalis specimens from 13 different sampling sites distributed across Central Europe were examined. Subsequently, various population genetic indices including FST values and an AMOVA analysis were applied for the description of the population structure. To visualize the distribution of haplotypes at the different sampling sites two median-joining networks were calculated. In addition, the past demographic structure of the T. navalis population was analyzed, among others by calculating Tajima's D, Fu's F and the mismatch distribution. Finally, all computations of the population genetic indices could not reveal differentiated populations or any kind of distinct population structure in T. navalis. The network analyses revealed “star-like” patterns without differentiated substructures or demes. Therefore, it can be assumed that a sudden expansion of this species took place without any indications of neither a bottleneck nor a founder effect for the study area. The results of this study support the concept of a regional panmictic population in the waters of Central Europe with unhindered migration of individuals (e.g., via pelagic larvae) between the various sampling sites as reflected by a high gene flow.
Introduction
Marine wood-boring Bivalvia are well known in European waters for a long time and according to the latest findings, nine different shipworm species (Teredinidae) are currently known in this region (Borges et al., 2012). They are typically associated with natural and man-made wood such as mangrove roots in tropical regions, coastal protection and harbor facilities as well as floating structures such as wooden ships and driftwood. Since these xylotrophic organisms decompose wood much faster than marine fungi or bacteria (Borges, 2007), they have caused considerable damage in Europe and worldwide over the last centuries (Distel et al., 2011). One of the most widespread and most destructive wood-boring Teredinidae in European waters is the common marine shipworm Teredo navalis. Since the origin and natural habitat of T. navalis is still unclear this species is currently considered cryptogenic and invasive in European waters (Borges et al., 2014).
A closer look into the literature shows that reports of shipworms from the South of Europe are considerably more abundant and earlier noted than for the North (Redeke, 1912; Moll, 1914). The first descriptions from the Mediterranean Sea date back to the authors of the classical antiquity like Aristoteles, Ovid, and Pliny (Redeke, 1912; Moll, 1914). They mentioned different kinds of shipworms, but the species involved were unknown. The next observations of Teredinidae in the Mediterranean Sea dated considerably later from the sixteenth to seventeenth century (Moll, 1914; Streftaris et al., 2005) and thus coincide with reports from Central Europe (North Sea).
The first credible proofs of T. navalis for Central European waters are reported from several authors for the North Sea around 1700–1730, the years of the first documented mass outbreak in the coastal waters of the Netherlands (e.g., Vrolik et al., 1860; Van Benthem Jutting, 1943). All authors assigned the attacks of wooden coastal protection structures unanimously to T. navalis. For many non-indigenous marine species mass occurrences typically have been described some years after their introduction (Gollasch et al., 2009), often resulting in their discovery. Also the sample material for the species description of T. navalis by Linnaeus in the year 1758, was collected in the Netherlands during this time by Sellius (Redeke, 1912).
For the Baltic Sea the first observations of T. navalis were documented from the Bay of Kiel in 1835 (Meyer and Möbius, 1865). The last and ever-present mass occurrence for the Baltic Sea was recorded in 1993 (Sordyl et al., 1998). Since then a stable and self-reproducing population has been established at the southern Baltic Sea coast, as Sordyl et al. (1998) detected free-swimming larvae of T. navalis in the water column. The current distribution of this species in the North Sea and Baltic Sea can be considered as stable as reflected by several recent studies (e.g., Paalvast and van der Velde, 2011; Appelqvist et al., 2015a; own unpublished data).
Although, much is still unknown about the ecology and especially the physiology of T. navalis, temperature, salinity and water currents determine to a great extent the distribution of this species. Regarding the required abiotic conditions for reproduction and growth, the optimum salinity ranges between 7 and 35 (Blum, 1922; Nair and Saraswathy, 1971) while the optimum water temperature is between 15 and 25°C (Roch, 1932; Kristensen, 1969). Teredo navalis is a protandric hermaphrodite species reaching sexual maturity seven to 8 weeks after metamorphosis (Grave, 1942). The larvae are released into the water column ~5 days after fertilization with a high release capacity of up to five million larvae per female and year (Kaestner, 1982). This short maturation period in combination with a high larvae release leads to a high reproductive potential. In combination with a short generation time this could result in about three to four generations per year. For the cold temperate waters in Central Europe, however, only one generation per year is expected for this species (see Section Genetic differentiation of populations).
Little is known so far whether T. navalis was absent between the mentioned mass occurrences or survived in reduced populations. This leads to the question whether the reported periodic mass occurrences of T. navalis in the North Sea and the Baltic Sea during the nineteenth and twentieth century, are reflected in their current distribution and population structure. Therefore, in the present study it was evaluated, whether and to what degree T. navalis is genetically structured. The conceivable existence of a self-containing Baltic Sea population separated from a North Sea/Atlantic Ocean population was a second question to be addressed. Furthermore, a third aim was to assess the possibility of a demographic expansion of T. navalis in the past together with the attempt to determine the point of origin of this expansion in time.
The COI (cytochrome c oxidase subunit I) locus has been proven to be a useful marker in population genetics and was employed in many studies for species analyses of the Bivalvia (e.g., Sirna Terranova et al., 2006; Sá-Pinto et al., 2012; Vergara-Chen et al., 2013). While in a previous study specific COI primers were provided for the first time and different regions in Europe and North America were investigated with respect to species identification, Weigelt et al. (2016) showed that no sibling species of T. navalis exist in the North Atlantic and the adjacent European seas. The present study investigated T. navalis in Central Europe marine waters at the population genetic level. Therefore, the genetic diversity of 352 T. navalis specimens collected along a salinity gradient was determined by comparing different sampling sites from Brittany in the west to the southern Baltic Sea in the east.
Materials and Methods
Sampling and Storage
A total number of 352 specimens of T. navalis was analyzed. Collecting took place during two time periods between 1999–2000 and 2011–2016 at 13 different sampling sites in Central Europe marine waters (Figure 1). A complete list of all specimens examined in this study as well as an overview of all sampling sites and the corresponding GPS coordinates are given in Table S1 in the supplementary data.
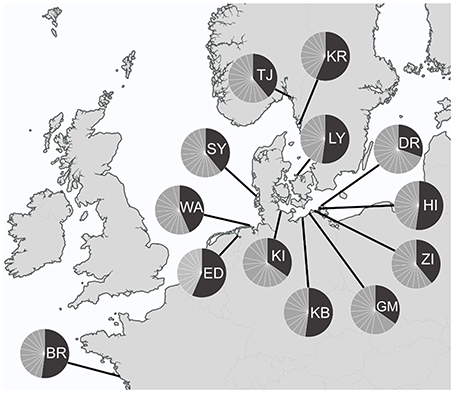
Figure 1. Sampling sites with COI haplotypes frequencies per sampling site. Dark gray: the most common haplotype Tn1, light gray: all other haplotypes. BR, Brittany; ED, Emden; WA, Wangerooge; SY, Sylt; TJ, Tjärnö; KR, Kristineberg; LY, Lynaes; KI, Kiel; KB, Kühlungsborn; GM, Graal-Müritz; ZI, Zingst; HI, Hiddensee; DR, Dranske.
The specimens were collected from submerged permanent sources like wooden coastal protection structures and from deployed test panels which consisted of non-durable pine wood (Pinus sylvestris) suitable for sampling teredinids (DIN EN 275, 1992; Borges et al., 2014). The taxonomic nomenclature is according to Turner (1966, 1971). Specimens from 1999 to 2000 were stored frozen at −60°C and later transferred into 96% ethanol. All other specimens were directly stored in 96% ethanol prior to further DNA analysis.
DNA Extraction, Amplification, and Sequencing
The DNA was extracted from mantle and muscle tissue by using “innuPREP Forensic Kit” (Analytik Jena) following protocol five of the user manual and the final elution volume was 200 μl. The mitochondrial COI gene fragment was amplified using polymerase chain reaction (PCR) performed with different primer pairs. The PCR amplification parameters and the different combinations of primers applied are shown in Table 1. All PCR reactions were performed with Analytik Jena FlexCycler in a 30 μl reaction volume consisting of 10x PCR buffer, 4.0 mM MgCl2, 0.75 U Moltaq (Molzym GmbH & Co.KG), 62.5 μM of each dNTP, 1 pmol of each COI primer and 3 μl DNA template. Thereafter, 5 μl of each PCR product were visualized under UV-light in 1% agarose gel and checked manually. PCR products were purified with “innuPREP Gel Extraction Kit” (Analytik Jena) following the manufacturer protocol and then used for sequencing. The sequencing of PCR products was performed using dideoxy chain termination method and cycle sequencing (Sanger et al., 1977) using “BigDye® Terminator v.1.1 Cycle Sequencing Kit” (Applied Biosystems). The primers used for sequencing were the same as those for PCR amplification. Sequencing products were purified following the GenomeLab Sequencing Chemistry Protocol 3.2 (Beckman Coulter).
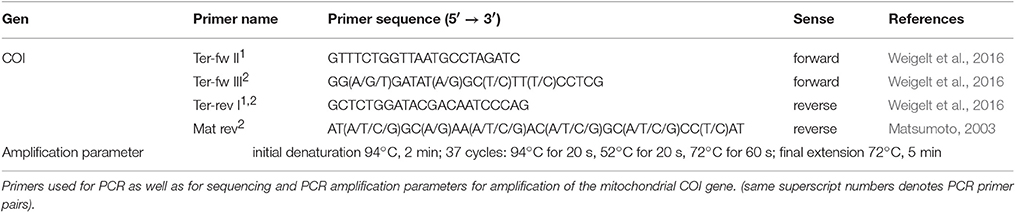
Table 1. PCR parameter.
The cycle sequencing products were analyzed by using capillary separation on an Applied Biosystems Genetic Analyzer 3130xl (Hitachi) and were sequenced in both directions. All sequences obtained in this study were deposited to NCBI GenBank. For detailed information about all sequences determined, the GenBank accession numbers (MF071107–MF071198) and a complete list of all haplotypes, see Table S1 in the supplementary data.
Phylogenetic Analyses
Recorded COI sequences were manually checked and aligned with BioEdit (Hall, 1999) using the ClustalW (Thompson et al., 1994) algorithm. The common population indices such as number of haplotypes (H), haplotype diversity (Hd), nucleotide diversity (π), the number of nucleotide differences (k) plus their corresponding standard deviations were obtained from all 13 sampling sites using the program DnaSP (Librado and Rozas, 2009). Phylogenetic analyses were performed using MEGA6 (Tamura et al., 2013) and PopArt 1.7 (http://popart.otago.ac.nz). For calculating the two phylogenetic networks the median-joining method (Bandelt et al., 1999) implemented in PopArt 1.7 was used.
Genetic Differentiation of Populations
For the different calculations of the genetic population structure a first dataset (DS 1) was created. From each of the 13 sampling sites 23 specimens (DS 1, n = 299) were taken for analysis to avoid under-sampling due to small sample sizes. For a second dataset (DS 2) specimens from a small scale sampling area between the two sampling sites Kühlungsborn and Zingst were pooled. From each of the two time periods 1999–2000 and 2011–2015 36 specimens (DS 2, n = 72) were taken for temporal analysis. 19 specimens belong to both data sets (for details see Table S1).
The comparisons between the different sampling sites for DS 1 were performed calculating population pairwise FST values as implemented in Arlequin 3.5.1.3 (Excoffier and Lischer, 2010). The significance of the FST values was tested with 10,000 permutations. Hierarchical analysis of molecular variance (AMOVA; Excoffier et al., 1992) was performed to test the genetic variance of two pre-defined groups: North Sea and Baltic Sea. The level of significance was also determined by means of 10,000 permutations.
To test for effects of past demographic events, like e.g., bottleneck effects or population expansions, the null hypothesis of neutral evolution of the COI locus was tested using Tajima's D test (Tajima, 1989) and Fu's F test (Fu, 1997) as implemented in Arlequin 3.5.1.3. The significance of both statistical tests was evaluated by 10,000 replicates. Moreover, Ramos-Onsins and Rozas” R2 value (Ramos-Onsins and Rozas, 2002) was calculated since it is more stable for small sample sizes. The statistical significance was checked with 1,000 permutations. The latter calculation was done with DnaSP (Librado and Rozas, 2009).
To examine the possibility of a past demographic expansion a mismatch analysis by examination of frequency distributions of pairwise differences between sequences for DS 1 was done (Rogers and Harpending, 1992). The distribution is multimodal for populations at a demographic equilibrium, but unimodal for populations during a recent demographic or range expansion (Slatkin and Hudson, 1991; Rogers and Harpending, 1992; Excoffier, 2003). The sum of square deviations (SSD) between two mismatch distributions was also calculated with Arlequin 3.5.1.3.
The associated mismatch parameter Tau (τ) was used to estimate the time elapsed since the expected expansion started in the past. According to the equation t = τ/2u, the mutation rate (u) for the gene under study was needed. In the absence of a specific substitution rate for the COI gene for T. navalis, two different molluscan specific substitution rates of 1.0% per million years (Strasser and Barber, 2009) (u = 6.75 * 10−6) and 2.0% per million years and site (Layton et al., 2014) (u = 1.35 * 10−5) were used. The generation time adopted was one year for Bivalvia in cold temperate waters (based on own unpublished data for T. navalis).
Results
Genetic Diversity
The COI locus provided reproducible results and hence was used for the aims of the present study. In a first step, the 299 COI sequences from the 13 sampling sites of DS 1 were taken to calculate the various population indices. The population genetic indices such as the total number of haplotypes, the haplotype diversity, the nucleotide diversity and the number of average nucleotide differences for all sampling sites are shown in Table 2.
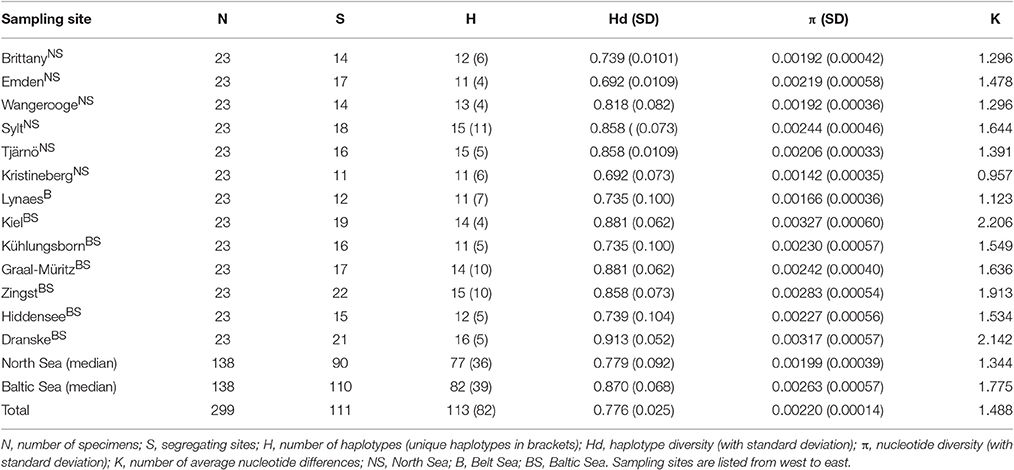
Table 2. Population genetic indices for all sampling sites.
The DS 1 contained 114 mutations with 111 segregating sites resulting in 113 different haplotypes. The Hd for the whole DS 1 was 0.776. The highest haplotype diversities were found at the most eastern sampling site Dranske (Baltic Sea) (0.913), followed by Kiel and Graal-Müritz (both Baltic Sea) (0.881) and Sylt (North Sea), Tjärnö (Skagerrak) and Zingst (Baltic Sea) (0.858). The lowest haplotype diversities were determined for the sampling sites Emden (Ems estuary, North Sea) and Kristineberg (Skagerrak) (0.692). The nucleotide diversity showed similar trends with the highest diversities found at the sampling sites Kiel (0.00327) and Dranske (0.00317) and the lowest at the sampling site Kristineberg (0.00142). All genetic diversity values including standard deviations as well as the number of nucleotide differences (k) are given in Table 2.
The analyses of DS 2, which contained 72 COI sequences, resulted in 39 segregating sites with 31 haplotypes. The total Hd for DS 2 was calculated as 0.775, which is almost identical to DS 1 (0.776).
Genetic Population Structure
A median-joining network was calculated for each of the two datasets (DS 1 and DS 2). Both of them showed a “star-like” phylogeny with one predominant central haplotype (Figures 2, 3). The haplotype network of DS 1 (Figure 2) was subdivided into the most abundant central haplotype Tn1, which included 134 sequences, and the remaining 112 haplotypes with one to six sequences each. The central haplotype Tn1 is represented in 44.8% of all specimens, whereas another 30 haplotypes are shared by more than one individual (27.4%). For Tn1 the highest frequency was found at Emden (Ems estuary, North Sea) and Kristineberg (Skagerrak) (56.5%) and the lowest at Kiel (Baltic Sea) (30.4%). The different haplotype frequencies for all sampling sites are shown in Figure 1. The highest absolute number of haplotypes was determined at Dranske (Baltic Sea) (16) followed by Sylt (North Sea) and Tjärnö (Skagerrak) (15), the lowest numbers for Emden (Ems estuary, North Sea), Kristineberg (Skagerrak), Lynaes and Kühlungsborn (all Baltic Sea) (11).
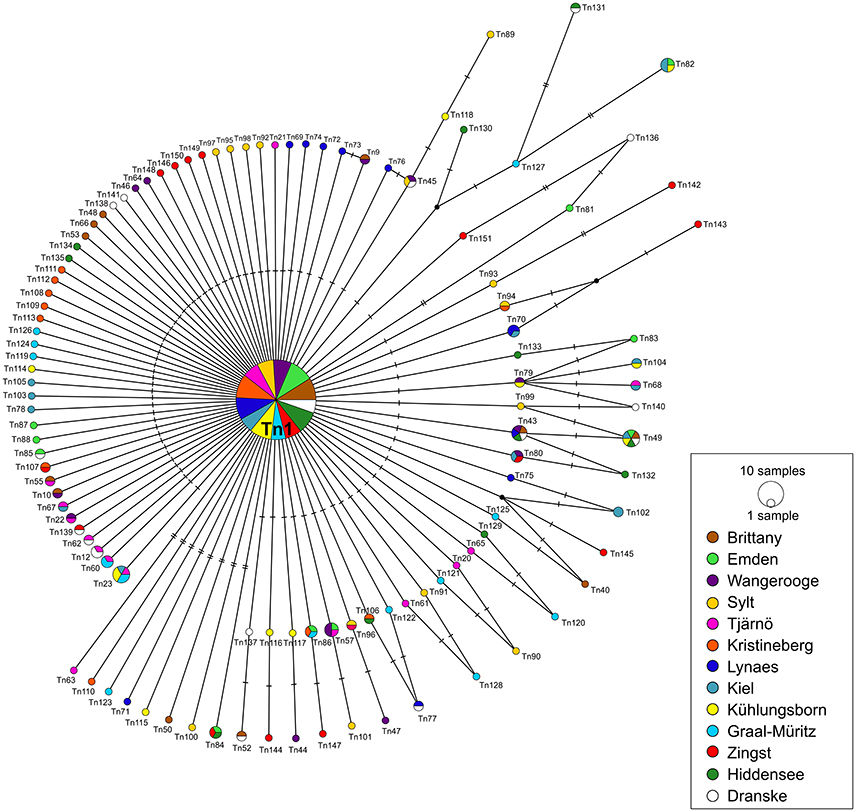
Figure 2. COI haplotype network of DS 1 (n = 299) based on median-joining analysis. Each circle represents a different haplotype. The size is proportional to the number of individuals sharing the same haplotype. Small black dots are median vectors indicating not sampled or missing haplotypes. Short black bars correspond to the number of mutation steps between the haplotypes (one to seven). Sampling sites listed from west to east.
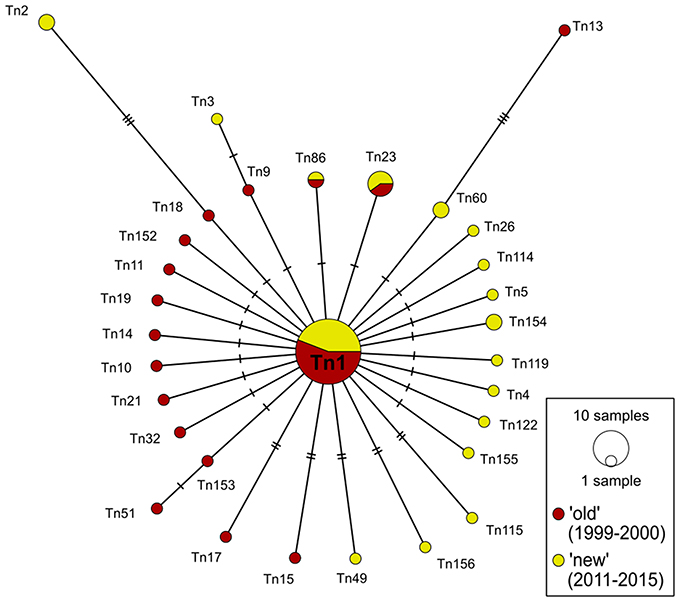
Figure 3. COI haplotype network of DS 2 (n = 72) based on median-joining analysis. Each circle represents a different haplotype. The size is proportional to the number of individuals sharing the same haplotype. Small black dots are median vectors indicating not sampled or missing haplotypes. Short black bars correspond to the number of mutation steps between the haplotypes (one to eight).
82 unique haplotypes (27.8% of DS 1) occurred only at one respective sampling site. These unique haplotypes constituted the largest proportion (72.6%) of haplotypes to the network and were three or less mutation steps distinct from Tn1. On the other hand 31 haplotypes were found at more than one sampling site, which corresponded to a share of 27.4%. The highest percentage of unique haplotypes per sampling site was determined at Sylt (North Sea) (73.3%), the lowest for Kiel (Baltic Sea) (28.6%). The largest genetic distance between two haplotypes of the median-joining network was seven mutation steps (Figure 2).
As described above, the 72 specimens for DS 2 were collected during two periods from 1999 to 2000 (“old”) and from 2011 to 2015 (“new”). The total of 31 different haplotypes in this network splitted up into three shared haplotypes determined for both time periods and in additional 14 haplotypes each found only in one of the two time periods (Figure 3). Unique haplotypes contributed with 90.4% to the whole network. The different haplotypes of DS 2 formed, similarly to DS 1, a “star-like” network with the dominant haplotype Tn1 in the center. This ancestral haplotype represented 50% of all specimens (n = 36) included in the network, which was divided with a ratio of 55.6%: 44.4% in “old” (n = 20) and “new” (n = 16) sequences, respectively. The other 36 specimens distributed to one haplotype consisting of three sequences (n = 3), four haplotypes of two sequences (n = 8) and finally 25 sequences which were represented by only one individual specimen.
As shown in Tables 3, 4 none of the more sensitive values for the evaluation of population structures (FST and AMOVA) showed a significant population differentiation for the area under investigation. The pairwise FST values ranged from −0.0150 to 0.0172, and were not significant at any sampling site (Table 3). According to Wright (1978) such values indicate a very low differentiation between the sampling sites.
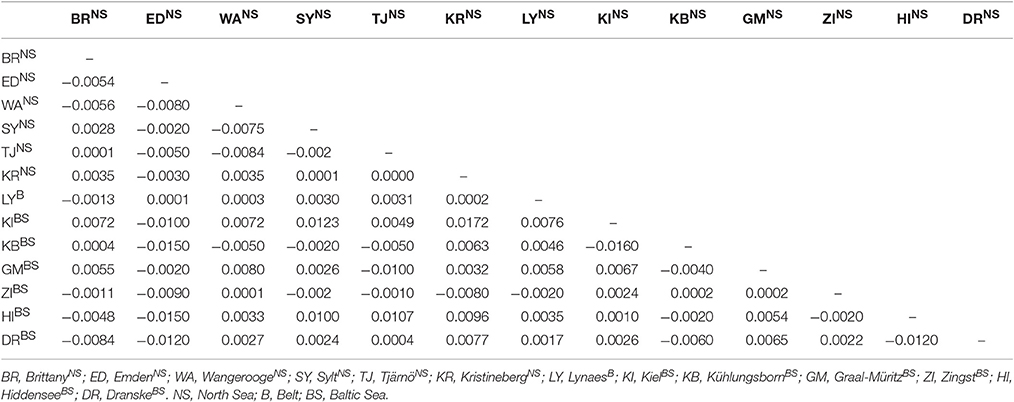
Table 3. FST values (pairwise differences) for the different sampling sites included in DS 1.
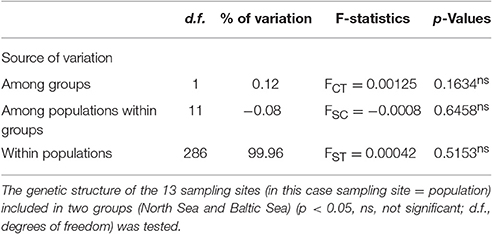
Table 4. Values of hierarchical AMOVA analysis of DS 1.
The hierarchical AMOVA analysis revealed a low value of 0.12% for the genetic variation among the two groups that have been sampled (North Sea and Baltic Sea). For the differentiation of populations (= sampling sites) within the two groups a negative value of −0.08 was calculated. The highest value of variation (99.96%) was calculated for the genetic variation within the populations (= sampling sites). All three values were not significant (Table 4).
Genetic Inferences of Historical Demography
Tajima's D and Fu's F test yielded negative and highly significant values (Table 5) for DS 1 indicating a recent demographic population expansion (Tajima, 1989; Fu, 1997). This is supported also by the R2 statistics which was significant as well (Table 5). To detect population growth the R2 test is more sensitive for small sample sizes (Ramos-Onsins and Rozas, 2002).
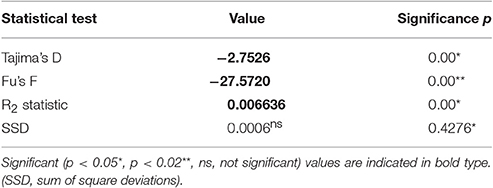
Table 5. Results of neutrality tests of demographic parameters for dataset 1.
The mismatch distribution of DS 1 is closely fitted to a model of sudden expansion (Figure 4). The corresponding graph of the mismatch distribution for the sudden expansion model showed a unimodal curve progression indicating a demographic expansion of T. navalis in the past. The corresponding SSD-value (Table 5) is not significant which reveals that the population is still in an expansion phase and not at equilibrium (Schneider and Excoffier, 1999).
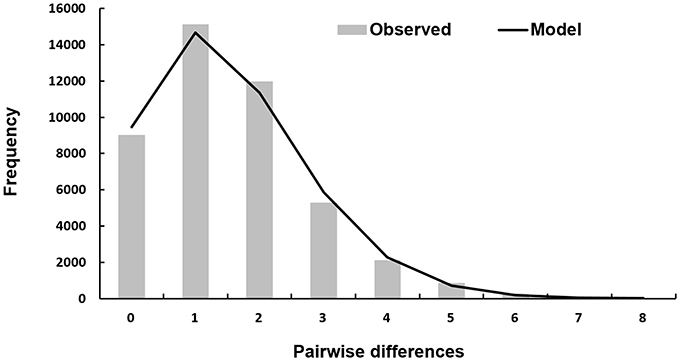
Figure 4. Mismatch distribution of DS 1. Observed pairwise differences between 299 sequences for DS 1 (bars) and the expected mismatch distributions under the sudden expansion model (solid line).
With the associated τ-value of 1.5 for DS 1 and the different substitution rates of 1.0 and 2.0% for Bivalvia a time span for the beginning of the expansion was calculated. Assuming a mutation rate between 6.75 * 10−6 and 1.35 * 10−5 for the COI gene per generation and a generation time of one per year, the hypothetical beginning of the expansion took place ~55,556–111,111 years ago.
Discussion
In a previous study specific COI primers for T. navalis were introduced and COI sequence data were obtained for the first time of molecular species identification on samples collected in different regions in Europe and North America (Weigelt et al., 2016). In the present study the main goal was to evaluate the population structure of T. navalis in Central European waters.
The two calculated median-joining networks showed a “star-like” phylogeny and the frequency of the central haplotype (Tn1) was dominating the complete network in both cases. The shared haplotypes in DS 1 (27.4%) are arbitrarily distributed over all locations and without clear geographic distribution pattern, mainly because all sampling sites were represented in the central haplotype (Figure 2). The proportion of three shared haplotypes in DS 2 (9.6% of all haplotypes) for a small scale sampling area between the two sampling sites Kühlungsborn and Zingst (~100 km apart) over the time scale of 16 years appeared to be low. This might be explained by the loss of haplotypes through genetic drift or possibly rather the gain of new haplotypes in this area by gene flow. The proportion of unique haplotypes in both networks are 72.6% (DS 1) and 80.7% (DS 2), respectively. These comparatively high proportions of unique haplotypes of both networks in relation to all haplotypes can be interpreted as one indicator for an expanding population (Slatkin and Hudson, 1991; Fu, 1997). It is most likely that all of these haplotypes originated from the predominant ancestral haplotype Tn1 after the expected sudden population expansion. Such a pattern and interpretation has been reported before for other marine bivalves, such as Mya arenaria (Lasota et al., 2016).
Some unique haplotypes from the initial study (Weigelt et al., 2016) are no longer unique since in the present study they could also been recorded at different sampling sites. This could be an indication for a high genetic diversity which might be reflected by high abundances. Up to 700 animals per dm2 have been observed in pine wood panels during the investigation period (own unpublished data), which is quite high compared to other regions like the Kattegat (Appelqvist et al., 2015b). Moreover, the network analyses of both datasets revealed no differentiated substructures or demes. These results corresponded with findings from a previous study (Weigelt et al., 2016) in which the determined shape of the network was almost identical.
Since the network analyses displayed no signs of a population structure, the genetic diversity of the different sampling sites was investigated. The haplotype diversity ranged from 0.692 to 0.913 which are common values for Bivalvia (e.g., Mao et al., 2011; Li et al., 2015). Thus, no decrease of the haplotype diversity toward the eastern distribution border of T. navalis along the salinity gradient in the Baltic Sea could be demonstrated. Even the easternmost sampling site Dranske (Rügen) showed the highest haplotype diversity and the second highest nucleotide diversity of all sampling sites. At this point it can be summarized, that indications for a founder effect, a bottleneck effect or a generally reduced genetic diversity at the edge of the distribution of T. navalis in the Baltic Sea could not be confirmed by the present study.
Also the calculated pairwise FST values showed no differentiation between the 13 sampling sites since the values ranged only from −0.0150 to 0.0172 for DS 1. These are common FST values for Bivalvia, since Lasota et al. (2004) found for Mya arenaria average FST values of 0.01 to 0.03 between populations which were hundreds of kilometers apart. Following Wright (1978), FST values from −1 to 0.05 indicate only a very slight genetic differentiation between populations. Negative FST values have to be considered as zero values which means that there is no genetic subdivision between the sampling sites especially as none of the values of the present study were significant. Therefore, it is not possible to identify a population structure for T. navalis by the calculated FST values of pairwise differences. Likewise, no differentiation in the population structure can be detected by the AMOVA analysis in DS 1 since almost 100% of the variation are within the sampling sites and not among them (Table 4).
All data presented in this study clearly indicate a lack of genetically differentiated populations in T. navalis between Brittany and the Baltic Sea, and hence might be interpreted as a regional European panmictic population, which, by definition, assumes that there exists no mating restrictions upon this population. The theoretical framework for a panmictic population of T. navalis is, however, not highly probable, because an unrestricted mating between the sessile adults from Brittany to the Baltic Sea along a coastline of ca. 3,900 km seems not to be possible. In addition, water exchange between the North Sea and Baltic Sea is restricted, which also hampers unrestricted mating. Otherwise no biogeographical break could be estimated between the highly saline North Sea and the brackish Baltic Sea and a panmictic population structure of T. navalis can be observed. Nonetheless, the determined panmixia for T. navalis stands in contrast to recent studies on other marine Bivalvia in the North Sea and Baltic Sea which always displayed a sharp differentiation in the genetic population structure between inside and outside the Baltic Sea (Johannesson and André, 2006; Johannesson et al., 2011). In comparison, the two median values of the haplotype as well as the nucleotide diversity of the Baltic Sea are slightly larger than those from the North Sea (Table 2). In this context, the results of the present study of T. navalis cannot confirm the findings of a species-by-species meta-analysis of Johannesson and André (2006). These authors showed that a majority of Baltic Sea populations lost genetic diversity compared to populations of the same species in the Atlantic Ocean and adjacent waters. The only exception found in their meta-analysis was Macoma balthica which was 30% more diverse inside the Baltic Sea than outside because of two genetically distinct lineages (Johannesson and André, 2006), an Atlantic lineage in the western and a Pacific lineage in the eastern part of the Baltic Sea (Nikula et al., 2008). However, the occurrence of different genetic lineages can be excluded for T. navalis (Weigelt et al., 2016).
Since all sampling sites were not differentiated from each other, the sites seem to be connected by a high gene flow. As restricted gene flow has been reported to cause genetic population structuring (Sá-Pinto et al., 2012), in the present study unrestricted gene flow seems to be still ongoing as no genetic population structure has been determined in T. navalis. Also for other marine invertebrates with a high dispersal potential and high abundances such as Holothuria polii, unrestricted gene flow is followed by a low population genetic structure over small spatial scales (Vergara-Chen et al., 2010). High dispersal potential and high gene flow of marine invertebrates favors genetic homogenization of populations over broad geographical distances (Maltagliati et al., 2010). Genetic homogeneity and a limited genetic structure has also been observed in other bivalve species, for instance in the invasive soft-shell clam Mya arenaria (Lasota et al., 2004; Strasser and Barber, 2009).
The observation that all sampling sites hardly differ genetically is a strong indication that all animals originate from only one source population, which is still unknown. Since the first reports on the occurrence of T. navalis in Central Europe date back to the years 1700–1730, the first settlement of this species has presumably be taken place at the coast of the Netherlands. This nation was one of the world's leading global trading nations at that time. Since all other reports on T. navalis from this area were mentioned later, a successive range expansion from this starting point in the North Sea to the adjacent waters is the most likely explanation. At this point, the life history strategy of T. navalis is helpful as it is very effective during the successful colonization of new patchy habitats (Borges et al., 2014) and the associated further spread into new areas. Due to the pelagic larval stadium a range expansion into the Baltic Sea via the Skagerrak, the Kattegat and through the Danish Straits seems very likely. Natural range expansions from the North Sea into the Baltic Sea are well known from other marine organisms, e.g. for the dinoflagellate Prorocentrum minimum (Hajdu et al., 2000) or the polychaete Marenzelleria viridis (Essink and Kleef, 1993; Blank et al., 2008).
The importance of oceanographic connectivity for the population structure of marine invertebrates with pelagic larval stages was documented by several authors (e.g., Seebens et al., 2013; Wrange et al., 2016). Since populations of marine bivalves are often characterized by high gene flow among different sampling sites, the absence of a population structure over hundreds of kilometers is not uncommon (Vierna et al., 2012, and references therein). It seems that oceanographic connectivity explains regional genetic structure, rather than geographic distance (Wrange et al., 2016), especially in the context with the dispersal potential of bivalve larvae. As previously mentioned, the short generation time in combination with the high output of larvae and a pelagic lifestyle of up to 34 days in the water column (Nair and Saraswathy, 1971) could lead to a wide spreading via water currents. However, this would not explain a continuous exchange of larvae between the most distant regions investigated in this study (Brittany vs. Baltic Sea). Appelqvist et al. (2015a) simulated in a biophysical model a maximum spreading of T. navalis larvae by about 400 km for four different locations in the southern Baltic Sea. In addition, there are also temporal warm water inflows of sea surface water documented for the Baltic Sea, particularly in summer such as in July 2002 and 2003 (Feistel et al., 2004). Such irregular water masses could act as vector for an increased input of T. navalis larvae from the North Sea to the Baltic Sea.
Theoretically, also anthropogenic activities via ballast water transport might contribute to a steady distribution of T. navalis larvae between different biogeographic regions. Previous studies on marine invertebrates have proven that long distance dispersal can be enhanced by human-mediated vectors (Wrange et al., 2016) and hence have a great influence on the biogeographic distribution and finally on the population genetic structure of a species. Additionally, the location of all sampling sites in an area with a high transport ship traffic (e.g., the area of the Kadetrinne in the Baltic Sea is on average passed by 50,000 ships every year; WSA, 2014) and the previously mentioned presence of T. navalis larvae in ballast water (Gollasch, 2002) may play a very important role in the distribution of teredinid species (Borges et al., 2014). A spread of larvae via ballast water also against the main prevailing currents (Seebens et al., 2013) might be responsible to transport larvae across biogeographical boundaries (Canales-Aguirre et al., 2015), which finally favors an increased gene flow. In the light of our data, however, a range expansion from the North Sea into the Baltic Sea by the prevailing water currents is the most likely explanation for the observed population genetic structure of T. navalis in both the North Sea and the Baltic Sea.
In the subsequent analyses of the demographic history, the entire dataset (DS 1) was treated as one panmictic population. Fragmentation of habitats in the past may cause population structuring e.g., in form of a genetic bottleneck followed by a sudden demographic expansion (Strasser and Barber, 2009; Lasota et al., 2016). As stated before all analysis of the historical demographic situation of T. navalis came to the same result indicating a sudden population expansion after a historical decrease event. The significant negative values of Tajima's D and Fu's F test as well as the significant R2 statistics (Table 5) support this assumption (Maltagliati et al., 2010). Also the data of the mismatch distribution analysis support these result. With the determined τ-value (1.5) in combination with the different substitution rates of 1.0 and 2.0% per million years for the COI gene and the assumed generation time of one per year, the calculated starting point for the sudden expansion was ~55,556–111,111 years ago. The geographical starting point of the expansion of T. navalis cannot be determined with the data of this study, but is unlikely to be located in the Central Europe marine waters due to the last glaciation of Europe. The last great glaciation in Europe ended ~10,000 years before present. At that time parts of the North Sea and the whole Baltic Sea were covered by glaciers (e.g., Grunewald and Scheithauer, 2010). Thus, they could not act as a refugium for a surviving population of T. navalis since all marine life was extinguished at that time. As some authors even assume a glacial ice cover south to the Iberian Peninsula (Grunewald and Scheithauer, 2010), the hypothetical territorial starting point of this sudden expansion, if it has been in Europe, could only be in the Mediterranean Sea or south-west of the Iberian Peninsula. However, the place of origin cannot be verified with the present data set. Therefore, the status of T. navalis should still remain cryptogenic as defined by Carlton (1996).
In conclusion, this study shows a high level of genetic diversity and gene flow in the investigated area for the examined mtDNA COI gene. This is reflected by the presence of a regional panmictic population of T. navalis in the waters of Central Europe. The lack of any genetic population structure indicates for the expansion history only one source population. Nevertheless, in case of T. navalis it seems that the use of this marker is not suitable to answer all questions of the population structure and the expansion history. For a deeper understanding of the colonization history of European marine waters by T. navalis, the use of highly polymorphic markers such as e.g. microsatellites would be recommended for future investigation.
Author Contributions
RW, HL, and RB collected the samples. RW and RB acquired the sequence data and all authors analyzed and interpreted the data. RW drafted the work and all authors critically revised the work and approved the final manuscript.
Conflict of Interest Statement
The authors declare that the research was conducted in the absence of any commercial or financial relationships that could be construed as a potential conflict of interest.
Acknowledgments
We are very grateful to the following persons for providing samples to us: Luisa Borges, Christin Appelqvist, and Anne Marie Eriksen. Also, we would like to thank the Water and Marine Office Emden as well as the harbor master on the East Frisian Island Wangerooge. The authors are very thankful to Michael Bugenhagen for the permission of field work in the groyne systems of the southern Baltic Sea, and to the State Agency for Agriculture and Environment of Central Mecklenburg (StALU MM) which partially funded this work. Finally, we would like to thank Rica Wegner and Johannes Höhn for supporting the dive team during field work.
Supplementary Material
The Supplementary Material for this article can be found online at: https://www.frontiersin.org/article/10.3389/fmars.2017.00196/full#supplementary-material
References
Appelqvist, C., Al-Hamdani, Z. K., Jonsson, P. R., and Havenhand, J. N. (2015a). Climate envelope modeling and dispersal simulations show little risk of range extension of the shipworm, Teredo navalis (L.), in the Baltic Sea. PLoS ONE 13:10. doi: 10.1371/journal.pone.0119217
Appelqvist, C., Havenhand, J., and Toth, G. B. (2015b). Distribution and abundance of teredinids along the Swedish coast - are shipworms invading the Baltic Sea? J. Mar. Biol. Assoc. UK 95, 783–790. doi: 10.1017/S0025315414001830
Bandelt, H. J., Forster, P., and Röhl, A. (1999). Median-joining networks for inferring intraspecific phylogenies. Mol. Biol. Evol. 16, 37–48. doi: 10.1093/oxfordjournals.molbev.a026036
Blank, M., Laine, A. O., Jürss, K., and Bastrop, R. (2008). Molecular identification key based on PCR/RFLP for three polychaete sibling species of the genus Marenzelleria, and the species' current distribution in the Baltic Sea. Helgol. Mar. Res. 62, 129–141. doi: 10.1007/s10152-007-0081-8
Blum, H. F. (1922). On the effect of low salinity on Teredo navalis. Univ. Calif. Publ. Zool. 22. 349–368.
Borges, L. M. S. (2007). Biogeography of Wood Boring Organisms in European Coastal Waters and New Approaches to Controlling Borer Attack. Ph.D. thesis, Portsmouth University.
Borges, L. M. S., Merckelbach, L. M., Sampaio, I., and Cragg, S. M. (2014). Diversity, environmental requirements, and biogeography of bivalve wood-borers (Teredinidae) in European coastal waters. Front. Zool. 11:13. doi: 10.1186/1742-9994-11-13
Borges, L. M. S., Sivrikaya, H., Le Roux, A., Shipway, R., Cragg, S. M., and Costa, F. O. (2012). Investigating the taxonomy and systematics of marine wood borers (Bivalvia: Teredinidae) combining evidence from morphology, DNA barcodes and nuclear locus sequences. Invertebr. Syst. 26, 572–582. doi: 10.1071/IS12028
Canales-Aguirre, C. B., Quiñones, A., Hernández, C. E., Neill, P. E., and Brante, A. (2015). Population genetics of the invasive cryptogenic anemone, Anemonia alicemartinae, along the southeastern Pacific coast. J. Sea Res. 102, 1–9. doi: 10.1016/j.seares.2015.03.005
Carlton, J. T. (1996). Biological invasions and cryptogenic species. Ecology 77, 1653–1655. doi: 10.2307/2265767
DIN EN 275 (1992). Wood Preservatives; Determination of the Protective Effectiveness against Marine Borers.
Distel, D. L., Amin, M., Burgoyne, A., Linton, E., Mamangkey, G., Morrill, W., et al. (2011). Molecular phylogeny of Pholadoidea Lamarck, 1809 supports a single origin for xylotrophy (wood feeding) and xylotrophic bacterial endosymbiosis in Bivalvia. Mol. Phylogenet. Evol. 61, 245–254. doi: 10.1016/j.ympev.2011.05.019
Essink, K., and Kleef, H. L. (1993). Distribution and life cycle of the North American spionid polychaete Marenzelleria viridis (Verrill, 1873) in the Ems estuary. Neth. J. Aquat. Ecol. 27, 237–246. doi: 10.1007/BF02334787
Excoffier, L. (2003). Patterns of DNA sequence diversity and genetic structure after a range expansion: lessons from the infinite-island model. Mol. Ecol. 13, 853–864. doi: 10.1046/j.1365-294X.2003.02004.x
Excoffier, L., and Lischer, H. E. (2010). Arlequin suite ver 3.5: a new series of programs to perform population genetics analyses under Linux and Windows. Mol. Ecol. Res. 10, 564–567. doi: 10.1111/j.1755-0998.2010.02847.x
Excoffier, L., Smouse, P. E., and Quattro, J. M. (1992). Analysis of molecular variance inferred from metric distances among DNA haplotypes: application to human mitochondrial DNA restriction data. Genetics 131, 479–491.
Feistel, R., Nausch, G., Heene, T., Piechura, J., and Hagen, E. (2004). Evidence for a warm water inflow into the Baltic Proper in summer. Oceanologica 46, 581–598.
Fu, Y. X. (1997). Statistical tests of neutrality of mutations against population growth, hitchhiking and background selection. Genetics 147, 915–925.
Gollasch, S. (2002). The importance of ship hull fouling as a vector of species introductions into the North Sea. Biofouling 18, 105–121. doi: 10.1080/08927010290011361
Gollasch, S., Haydar, D., Minchin, D., Wolff, W. J., and Reise, K. (2009). “Introduced aquatic species of the North Sea coasts and adjacent brackish waters,” in Biological Invasions in Marine Ecosystems: Ecological, Management, and Geographic Perspectives, ed G. Rilov (Berlin: Springer), 507–528.
Grave, B. H. (1942). The sexual cycle of the shipworm, Teredo navalis. Biol. Bull. 82, 438–445. doi: 10.2307/1537989
Grunewald, K., and Scheithauer, J. (2010). Europe's southernmost glaciers: response and adaptation to climate change. J. Glaciol. 56, 129–142. doi: 10.3189/002214310791190947
Hajdu, S., Edler, L., Olenina, I., and Witek, B. (2000). Spreading and establishment of the potentially toxic dinoflagellate Prorocentrum minimum in the Baltic Sea. Int. Rev. Hydrobiol. 85, 561–575. doi: 10.1002/1522-2632(200011)85:5/6<561::AID-IROH561>3.0.CO;2-3
Hall, T. A. (1999). BioEdit: a user-friendly biological sequence alignment editor and analysis program for Windows 95/98/NT. Nucl. Acids Symp. Ser. 41, 95–98.
Johannesson, K., and André, C. (2006). Life on the margin: genetic isolation and diversity loss in a peripheral marine ecosystem, the Baltic Sea. Mol. Ecol. 15, 2013–2029. doi: 10.1111/j.1365-294X.2006.02919.x
Johannesson, K., Smolarz, K., Grahn, M., and André, C. (2011). The future of Baltic Sea populations: local extinction or evolutionary rescue? Ambio 40, 179–190. doi: 10.1007/s13280-010-0129-x
Kaestner, A. (1982). Lehrbuch der Speziellen Zoologie, Bd. I: Wirbellose Tiere. Teil 3: Mollusca, Sipunculida, Echiurida, Annelida, Onychophora, Tardigrada, Pentastomida. Jena: Fischer.
Kristensen, E. (1969). Attacks by Teredo navalis L. in inner Danish waters in relation to environmental factors. Vidensk. Meddr Dansk Naturh. Foren. 132, 199–201.
Lasota, R., Hummel, H., and Wolowicz, M. (2004). Genetic diversity of European populations of the invasive soft-shell clam Mya arenaria (Bivalvia). J. Mar. Biol. Assoc. 84, 1051–1056. doi: 10.1017/S0025315404010409h
Lasota, R., Pierscieniak, K., Garcia, P., Simon-Bouhet, B., and Wolowicz, M. (2016). Large-scale mitochondrial COI gene sequence variability reflects the complex colonization history of the invasive soft-shell clam, Mya arenaria (L.) (Bivalvia). Estuar. Coast. Shelf. Sci. 181, 256–265. doi: 10.1016/j.ecss.2016.08.033
Layton, K. K., Martel, A. L., and Hebert, P. D. (2014). Patterns of DNA barcode variation in Canadian marine molluscs. PLoS ONE 9:e95003. doi: 10.1371/journal.pone.0095003
Li, S., Li, Q., and Yu, H. (2015). Genetic variation and population structure of the Pacific oyster Crassostrea gigas in the northwestern Pacific inferred from mitochondrial COI sequences. Fish Sci. 81, 1071–1082. doi: 10.1007/s12562-015-0928-x
Librado, P., and Rozas, J. (2009). DnaSP v5: A software for comprehensive analysis of DNA polymorphism data. Bioinformatics 25, 1451–1452. doi: 10.1093/bioinformatics/btp187
Maltagliati, F., Di Giuseppe, G., Barbieri, M., Castelli, A., and Dini, F. (2010). Phylogeography and genetic structure of the edible sea urchin Paracentrotus lividus (Echinodermata: Echinoidea) inferred from the mitochondrial cytochrome b gene. Biol. J. Linn. Soc. 100, 910–923. doi: 10.1111/j.1095-8312.2010.01482.x
Mao, Y., Gao, T., Yanagimoto, T., and Xiao, Y. (2011). Molecular phylogeography of Ruditapes philippinarum in the northwestern Pacific Ocean based on COI gene. J. Exp. Mar. Biol. Ecol. 407, 171–181. doi: 10.1016/j.jembe.2011.06.002
Matsumoto, M. (2003). Phylogenetic analysis of the subclass Pteriomorphia (Bivalvia) from mtDNA COI sequences. Mol. Phylogenet. Evol. 27, 429–440. doi: 10.1016/S1055-7903(03)00013-7
Meyer, H. A., and Möbius, K. (1865). Fauna der Kieler Bucht, Bd. I: Die Hinterkiemer oder Opisthobranchia. Leipzig: Verlag von Wilhelm Engelmann.
Nair, N. B., and Saraswathy, M. (1971). The biology of wood boring teredinid molluscs. Adv. Mar. Biol. 9, 335–509. doi: 10.1016/S0065-2881(08)60345-4
Nikula, R., Strelkov, P., and Väinöläa, R. (2008). A broad transition zone between an inner Baltic hybrid swarm and a pure North Sea subspecies of Macoma balthica (Mollusca, Bivalvia). Mol. Ecol. 17, 1505–1522. doi: 10.1111/j.1365-294X.2007.03688.x
Paalvast, P., and van der Velde, G. (2011). New threats of an old enemy: the distribution of the shipworm Teredo navalis L. (Bivalvia: Teredinidae) related to climate change in the Port of Rotterdam area, the Netherlands. Mar. Pollut. Bull. 62, 1822–1829. doi: 10.1016/j.marpolbul.2011.05.009
Ramos-Onsins, S. E., and Rozas, J. (2002). Statistical properties of new neutrality tests against population growth. Mol. Biol. Evol. 19, 2092–2100. doi: 10.1093/oxfordjournals.molbev.a004034
Redeke, H. C. (1912). Über den Schiffsbohrwurm und sein Vorkommen in Fischerfahrzeugen. Fischerboote 4, 389–394.
Roch, F. (1932). Einige Beobachtungen zur Ökologie und Physiologie von Teredo navalis L. Arkiv för Zoologi, Vol. 24A. Stockholm: Almqvist & Wiksell.
Rogers, A. R., and Harpending, H. (1992). Population growth makes waves in the distribution of pairwise genetic differences. Mol. Biol. Evol. 9, 552–569.
Sanger, F., Nicklen, S., and Coulson, A. R. (1977). DNA sequencing with chain-terminating inhibitors. Proc. Natl. Acad. Sci. U.S.A. 74, 5463–5467. doi: 10.1073/pnas.74.12.5463
Sá-Pinto, A., Branco, M. S., Alexandrino, P. B., Fontaine, M. C., and Baird, S. J. E. (2012). Barriers to gene flow in the marine environment: insights from two common intertidal limpet species of the Atlantic and Mediterranean. PLoS ONE 7:e50330. doi: 10.1371/journal.pone.0050330
Schneider, S., and Excoffier, L. (1999). Estimation of past demographic parameters from the distribution of pairwise differences when the mutation rates vary among sites: application to human mitochondrial DNA. Genetics 152, 1079–1089.
Seebens, H., Gastner, M. T., and Blasius, B. (2013). The risk of marine bioinvasion caused by global shipping. Ecol. Lett. 16, 782–790. doi: 10.1111/ele.12111
Sirna Terranova, M., Lo Brutto, S., and Arculeo, M. (2006). Population structure of Brachidontes pharaonis (P. Fisher, 1870) (Bivalvia, Mytilidae) in the Mediterranean Sea, and evolution of a novel mtDNA polymorphism. Mar. Biol. 150, 89–101. doi: 10.1007/s00227-006-0330-4
Slatkin, M., and Hudson, R. R. (1991). Pairwise comparisons of mitochondrial DNA sequences in stable and exponentially growing populations. Genetics 129, 555–562.
Sordyl, H., Bönsch, R., Gercken, J., Gosselck, F., Kreuzberg, M., and Schulze, H. (1998). Verbreitung und Reproduktion des Schiffsbohrwurms Teredo navalis L. an der Küste Mecklenburg-Vorpommerns. Deutsche Gewässerkundliche Mitteilungen 42, 142–149.
Strasser, C. A., and Barber, P. H. (2009). Limited genetic variation and structure in softshell clams (Mya arenaria) across their native and introduced range. Conserv. Genet. 10, 803–814. doi: 10.1007/s10592-008-9641-y
Streftaris, N., Zenetos, A., and Papathanasiou, E. (2005). Globalisation in marine ecosystems: the story of non-indigenous marine species across European seas. Oceanogr. Mar. Biol. Ann. Rev. 43, 419–453.
Tajima, F. (1989). Statistical method for testing the neutral mutation hypothesis by DNA polymorphism. Genetics 123, 585–595.
Tamura, K., Stecher, G., Peterson, D., Filipski, A., and Kumar, S. (2013). MEGA6: molecular evolutionary genetics analysis version 6.0. Mol. Biol. Evol. 30, 2725–2729. doi: 10.1093/molbev/mst197
Thompson, J. D., Higgins, D. G., and Gibson, T. J. (1994). CLUSTAL W: improving the sensitivity of progressive multiple sequence alignment through sequence weighting, position-specific gap penalties and weight matrix choice. Nucl. Acids Res. 22, 4673–4680. doi: 10.1093/nar/22.22.4673
Turner, R. D. (1966). A Survey and Illustrated Catalogue of the Teredinidae. Cambridge: Museum of Comparative Zoology, Harvard University.
Turner, R. D. (1971). “Methods of identification of marine borers and fungi,” in Marine Borers, Fungi and Fouling Organisms of Wood, eds E. B. G. Jones and S. K. Eltringham (Paris: Organisation for Economic Co-operation and Development), 18–63.
Vergara-Chen, C., González-Wangüemert, M., Marcos, C., and Pérez-Ruzafa, A. (2010). Genetic diversity and connectivity remain high in Holothuria polii (Delle Chiaje 1823) across a coastal lagoon-open sea environmental gradient. Genetica 138, 895–906. doi: 10.1007/s10709-010-9472-x
Vergara-Chen, C., González-Wangüemert, M., Marcos, C., and Pérez-Ruzafa, A. (2013). Small-scale genetic structure of Cerastoderma glaucum in a lagoonal environment: potential significance of habitat discontinuity and unstable population dynamics. J. Mollus. Stud. 79, 230–240. doi: 10.1093/mollus/eyt015
Vierna, J., Jensen, K. T., González-Tizón, A. M., and Martínez-Lage, A. (2012). Population genetic analysis of Ensis directus unveils high genetic variation in the introduced range and reveals a new species from the NW Atlantic. Mar. Biol. 159, 2209–2227. doi: 10.1007/s00227-012-2006-6
Vrolik, W., Harting, P., Storm Buysing, D. J., van Ordt, J. W. L., and von Baumhauer, E. H. (1860). Verslag over den Paalworm. Natuurkundige Afdeeling der Koninklijke Nederlandsche Akademie van Wettenschappen, Amsterdam, 1–153.
Weigelt, R., Lippert, H., Borges, L., Appelqvist, C., Karsten, U., and Bastrop, R. (2016). First time DNA barcoding of the common shipworm Teredo navalis Linnaeus 1758 (Mollusca: Bivalvia: Teredinidae): Molecular-taxonomic investigation and identification of a widespread wood-borer. J. Exp. Mar. Biol. Ecol. 475, 154–162. doi: 10.1016/j.jembe.2015.11.008
Wrange, A. L., Charrier, G., Thonig, A., Alm Rosenblad, M., Blomberg, A., and Havenhand, J. N. (2016). The sory of a hitchhiker: population genetic patterns in the invasive barnacle Balanus (Amphibalanus) improvisus Darwin 1854. PLoS ONE 11:e0147082. doi: 10.1371/journal.pone.0147082
Keywords: Teredo navalis, teredinidae, bivalvia, genetic diversity, demographic expansion, COI, Baltic Sea, North Sea
Citation: Weigelt R, Lippert H, Karsten U and Bastrop R (2017) Genetic Population Structure and Demographic History of the Widespread Common Shipworm Teredo navalis Linnaeus 1758 (Mollusca: Bivalvia: Teredinidae) in European Waters Inferred from Mitochondrial COI Sequence Data. Front. Mar. Sci. 4:196. doi: 10.3389/fmars.2017.00196
Received: 20 February 2017; Accepted: 09 June 2017;
Published: 30 June 2017.
Edited by:
Tito Monteiro da Cruz Lotufo, University of São Paulo, BrazilReviewed by:
Pierre Boudry, French Research Institute for Exploitation of the Sea, FranceRodrigo Maggioni, Federal University of Ceará, Brazil
Copyright © 2017 Weigelt, Lippert, Karsten and Bastrop. This is an open-access article distributed under the terms of the Creative Commons Attribution License (CC BY). The use, distribution or reproduction in other forums is permitted, provided the original author(s) or licensor are credited and that the original publication in this journal is cited, in accordance with accepted academic practice. No use, distribution or reproduction is permitted which does not comply with these terms.
*Correspondence: Ronny Weigelt, ronny.weigelt@uni-rostock.de