Atmospheric Deposition Effects on Plankton Communities in the Eastern Mediterranean: A Mesocosm Experimental Approach
 Tatiana M. Tsagaraki1,2*
  Barak Herut3
  Eyal Rahav3,4
  Ilana R. Berman Frank4
  Anastasia Tsiola1
  Manolis Tsapakis1
  Antonia Giannakourou5
  Alexandra Gogou5 Christos Panagiotopoulos6
  Kalliopi Violaki7
  Stella Psarra1
  Anna Lagaria1
  Epaminondas D. Christou5
  Nafsika Papageorgiou1 Soultana Zervoudaki5
  Ma L. Fernandez de Puelles8
  Nikolaos Nikolioudakis9,10
  Travis B. Meador11 Tsuneo Tanaka12
  Maria L. Pedrotti13,14
  Michael D. Krom15,16
  Paraskevi Pitta1
- 1Institute of Oceanography, Hellenic Centre for Marine Research, Heraklion, Greece
- 2Department of Biology, University of Bergen, Bergen, Norway
- 3Israel Oceanographic and Limnological Research, National Institute of Oceanography, Haifa, Israel
- 4Mina and Everard Goodman Faculty of Life Sciences, Bar-Ilan University, Ramat-Gan, Israel
- 5Hellenic Centre for Marine Research, Institute of Oceanography, Anavyssos Attikis, Greece
- 6Mediterranean Institute of Oceanography, Institut de Recherche pour le Développement (IRD), Centre National de la Recherche Scientifique, Université de Toulon, Aix Marseille Université, Marseille, France
- 7Environmental Chemistry Processes Laboratory, Department of Chemistry, University of Crete, Heraklion, Greece
- 8Centro de Baleares, Instituto Español de Oceanografia, Palma de Mallorca, Spain
- 9Institute of Marine Biological Resources and Inland Waters, Hellenic Centre for Marine Research, Heraklion, Greece
- 10Institute of Marine Research, Bergen, Norway
- 11MARUM Center for Marine Environmental Sciences, University of Bremen, Bremen, Germany
- 12Laboratoire d'Oceanographie Physique et Biogeochimique, University of the Mediterranean, Marseille, France
- 13Laboratoire d'Océanographie de Villefranche (LOV), Pierre-and-Marie-Curie University, Villefranche-sur-Mer, France
- 14Centre National de la Recherche Scientifique, Paris, France
- 15School of Earth and Environment, University of Leeds, Leeds, United Kingdom
- 16Department of Marine Biology, Charney School of Marine Sciences, University of Haifa, Haifa, Israel
The effects of atmospheric deposition on plankton community structure were examined during a mesocosm experiment using water from the Cretan Sea (Eastern Mediterranean), an area with a high frequency of atmospheric aerosol deposition events. The experiment was carried out under spring-summer conditions (May 2012). The main objective was to study the changes induced from a single deposition event, on the autotrophic and heterotrophic surface microbial populations, from viruses to zooplankton. To this end, the effects of Saharan dust addition were compared to the effects of mixed aerosol deposition on the plankton community over 9 days. The effects of the dust addition seemed to propagate throughout the food-web, with changes observed in nearly all of the measured parameters up to copepods. The dust input stimulated increased productivity, both bacterial and primary. Picoplankton, both autotrophic and heterotrophic capitalized on the changes in nutrient availability and microzooplankton abundance also increased due to increased availability of prey. Five days after the simulated deposition, copepods also responded, with an increase in egg production. The results suggest that nutrients were transported up the food web through autotrophs, which were favored by the Nitrogen supplied through both treatments. Although, the effects of individual events are generally short lived, increased deposition frequency and magnitude of events is expected in the area, due to predicted reduction in rainfall and increase in temperature, which can lead to more persistent changes in plankton community structure. Here we demonstrate how a single dust deposition event leads to enhancement of phytoplankton and microzooplankton and can eventually, through copepods, transport more nutrients up the food web in the Eastern Mediterranean Sea.
Introduction
Mineral dust is an important driver of biogeochemical cycles in the surface ocean and an integral component of the land-atmosphere-ocean system (Mahowald et al., 2005, 2008; Bryant, 2013). In the atmosphere, natural sources account for ~75% of atmospheric aerosols while anthropogenic sources account for the rest (Ginoux et al., 2012). The major component of natural aerosols is mineral dust from desert regions with the Sahara desert being the single largest source contributing 55% of global emissions (Ginoux et al., 2012). Elements leached from aerosols are an important source of biologically available nutrients, which support ocean productivity and marine ecosystem functioning especially in the offshore areas of the global ocean.
Supply of iron through atmospheric deposition to the ocean is well-documented and considered one of the main sources of this critical trace element to large ocean areas (Jickells, 2005 and references therein). It is a major reason why large areas of the global ocean are not Fe limited, as mineral dust provides sufficient iron to support primary productivity. Mineral dust can also provide an important source of P, both as labile phosphate and also as mineral apatite originating mainly from deserts (Mahowald et al., 2008). Under natural conditions, insoluble mineral apatite may drop through the surface layers without interacting with the biota but after acidification processes in the atmosphere, mainly interaction with pollutants such as NOx and SOx, it is converted into bioavailable phosphate (Nenes et al., 2011; Stockdale et al., 2016). Atmospheric input also represents a large and increasing source of anthropogenic inorganic N (mainly as NOx from industrial sources and cars and NH3 from agricultural sources as well as natural inputs from lightning and other sources). Atmospheric aerosols also contain important amounts of DON and DOP with largely unknown bioavailability (Markaki et al., 2010).
Atmospheric inputs (natural and polluted) are a particularly important source of external nutrients to the Mediterranean, because of its proximity to the Sahara desert to the south (Lawrence and Neff, 2009; Ganor et al., 2010) and the major anthropogenic atmospheric input from the north. Atmospheric inputs of inorganic nutrients to the Mediterranean Sea surface are considered a major nutrient influx, far exceeding riverine inputs in some regions (Guerzoni et al., 1999), representing 60% of the total external N input and 30% of the P input to the Eastern Mediterranean (Krom et al., 2004). The high mineral dust flux also results in relatively high concentrations of dissolved Fe, which prevent Fe limitation in surface waters (Statham and Hart, 2005). While the major source of atmospheric N to the Eastern Mediterranean is from anthropogenic sources, and can contain many other compounds related to anthropogenic activity (Myriokefalitakis et al., 2015), the greatest part of the P input is from mineral dust, mainly from the Sahara.
A prominent feature of the Mediterranean basin is the strong west to east gradient of primary productivity with an average of 120–131 gC m−2 yr−1 in the western Mediterranean compared to 56–76 gC m−2 yr−1 in the eastern Mediterranean (Crispi et al., 2002; Siokou-Frangou et al., 2010; Lazzari et al., 2012). There is a similar gradient in chlorophyll concentration (D'Ortenzio and Ribera d'Alcalà, 2009; Lazzari et al., 2012) and in nutrient concentrations (Pujo-Pay et al., 2011), which are also unusually low. Considering the high nitrate:phosphate molar ratios of 25–28:1 in the deep water (Krom et al., 1991) and high N:P ratios of DOM and POM, the system is often characterized as P starved (Krom et al., 2005). It has been found that P is the main limiting nutrient during the winter phytoplankton bloom (Krom et al., 1991). However, in summer conditions the surface waters of the EMS are likely N and P co-limited (Thingstad et al., 2005) and strictly N limitation has also been reported during mid-summer (Tanaka et al., 2011).
Phosphorus deposition from atmospheric sources has been estimated at ~0.5 mM P m−2 y−1 in the eastern Mediterranean (Herut and Krom, 1996; Carbo et al., 2005), while a typical deposition event contains ~0.05 g P L. Phosphorus input, regardless the source, has been shown to influence the community structure and production in the area (Fonnes Flaten et al., 2005; Pasternak et al., 2005; Lekunberri et al., 2010; Pitta et al., 2016). In general deposition events from the Sahara desert tend to have low leachable N:P ratios while those which include or have interacted with air masses from Europe have higher leachable N (e.g., Herut et al., 2016, this issue) and can reach very high N:P ratios (Markaki et al., 2010).
Lekunberri et al. (2010) measured a positive response to dust addition in bacterial production and abundance as well as in primary production and community respiration in a microcosm experiment in the NW Mediterranean. The response of primary producers was also documented previously in the Eastern Mediterranean by Herut et al. (2005) during a microcosm experiment and in mesocosm experiments by Rahav et al. (2016, this issue) and by Ridame and Guieu (2002), in the eastern and western Mediterranean, respectively. During the dry deposition season (May–September), Volpe et al. (2009) found a strong positive correlation between phytoplankton (measured as chlorophyll a concentration) and dust on a weekly timescale. However, the authors conclude that a link between dust deposition and changes in phytoplankton biomass cannot be established during the dust storm season since the results of this study could also be attributed to oceanographic conditions, mainly upwelling, deep convection and coastal freshwater outflow. Gallisai et al. (2014) suggest a different response, using a modeling approach, where the addition of nutrients though dust of desert origin, seems to stimulate production in the plankton community whereas when the dust is of European origin the feedbacks appear to be negative. The latter study attributes this mismatch to a high concentration of other pollutants (mainly Cu) in European origin dust, which, depending on the season can inhibit phytoplankton growth.
In a summary on the significance of this episodic nature of atmospheric deposition to low nutrient, low chlorophyll (LNLC) areas by Guieu et al. (2014), conclude that responses to any addition are not as simple as in the high nutrient areas. It is likely that the dust depositional flux containing P will increase in the Eastern Mediterranean basin as a result of the predicted decreased rainfall and increased temperature (IPCC, 2014). Furthermore, it is predicted under certain scenarios that there will also be increased flux of anthropogenic N to the basin (Lamarque et al., 2013). It is therefore an ecologically-important matter to investigate the nature of change induced by a sudden addition of nutrients from different origins (desert vs. anthropogenic origin).
The marine environment surrounding Crete in the Eastern Mediterranean is a typical example of an oligotrophic LNLC area where aeolian inputs could influence the marine pelagic ecosystem. Koçak et al. (2010) found that DIN and PO4 inputs dominated over riverine inputs. Atmospheric monitoring data show that strong dust outbreaks occur in January, February, May, and July–September, leading to deposition events in the Cretan Sea (Kalivitis et al., 2007). Our aim was to examine whether there is a direct connection between these deposition events and changes in plankton community abundance or growth rates. The mesocosm approach, utilized here, allowed us to monitor the development of the same microbial community over a number of days, while the large volume of the mesocosms (>1 m3) allowed experimentation with trophic groups up to copepods. The questions we aimed to address with the present experiment, with regards to the Eastern Mediterranean were: (I) how does a single dry deposition event affect the microbial food web, from viruses to zooplankton; and (II) does the source of dust (desert vs. mixed aerosol) make a difference to the type and magnitude of change observed.
We expected that inputs of nutrients from deposition (both types) would be primarily used by bacteria and incorporated into biomass, from there we hypothesized that the bacteria would be either controlled by increase of viruses, minimizing the transfer up the food web or by flagellate grazers, bypassing the classical food chain and transferring energy directly through microzooplankton to copepods. Alternatively small autotrophs benefiting from the dust input, would transport energy through the classical food chain. The channeling of nutrients through grazers is faster than the classical pathway, a process illustrated in Pitta et al. (2016), where, following a phosphorus addition, copepods respond by producing eggs within 2 days, (faster response) and then again after 5 and 7 days (slower response).
We further hypothesized that the observed response to the Saharan dust addition would be stronger compared to the mixed aerosol, primarily because more nutrients would be supplied through the Saharan dust and also because the mixed aerosols contain more potentially toxic compounds (e.g., Cu, Al) that could inhibit phytoplankton growth and thus result in a response more centered on the microbial loop.
Materials and Methods
Experimental Design and Sampling
The experiment was carried out at the mesocosm facilities of the Hellenic Centre for Marine Research (HCMR), Crete (CRETACOSMOS, http://cretacosmos.eu/). The facility consists of a 350 m3 land-based 5 m deep concrete tank, which is filled with seawater pumped directly into the tank, while the temperature is kept stable through continuous flow of pumped seawater. The mesocosm bags were incubated in the tank for the duration of the experiment. To fill the mesocosm bags, ~28 m3 of subsurface water (10 m) was collected from a location north of Heraklion city with the R/V Philia (35° 24.957 N, 25° 14.441 E, bottom depth: 170 m) using a rotary submersible pump. The seawater was pumped into acid-cleaned 1 m3 high density polypropylene tanks which were then transported to CRETACOSMOS. The duration of water acquisition, transportation and filling of the mesocosm bags was ~2 h per trip, five trips were needed to acquire the required volume of seawater. The nine mesocosm bags used in the experiment had a diameter of 1.32 m, a total volume of 3 m3 and were made of transparent food-grade polyethylene. Homogeneity during filling was ensured by distributing water from each 1 m3 tank equally into all the bags using timed intervals while filling. Once the mesocosms were filled, they were covered with a two layer lid (PVC & a nylon mesh) in order (I) to protect them from additional undesired atmospheric aerosols during the experiment and (II) to simulate the light intensity at 10 m (in situ sampling conditions). Finally the mesocosm bags were left to settle overnight before the treatments commenced. An airlift system (Jacobsen et al., 1995) ensured water mixing within the mesocosms.
On May 10th, initial samples were taken from all bags prior to any manipulation as a reference. Following sampling, mixed aerosols were added to 3 bags (1.0 mg L−1), Saharan dust (1.6 mg L−1) to three bags and another 3 served as controls. The amount of dust added is representative of a typical deposition event in the area (Herut et al., this issue). Sampling, with acid washed silicone tubes, was carried out daily for the first 4 days and beyond that point, every second day for a total of 9 days from addition (May 19th). All containers and apparatus for filling and sampling were also acid washed daily. Triplicates of treatments were labeled as Saharan Dust (SD), Aerosol (A), and Control (C) and will be referred to as such hereon (see further details in Herut et al., this issue). All measurements are presented in the text as the mean value of 3 replicates followed by the standard error of the mean in brackets. Where no SE is presented no replicate samples from mesocosms were measured.
Nutrients Released with Aerosol Addition
Details of leached nutrients are presented in detail in Herut et al. (2016, this issue). Briefly, dust collected locally was used in order to simulate the deposition events in the area, as realistically as possible. The dust added to the SD mesocosms released 36.8 nM inorganic nitrogen (NO3+NO2) and 3.9 nM PO4. In the A mesocosms the dust added released 54 nM inorganic nitrogen (NO3+NO2) and 3 nM PO4.
Dissolved Inorganic Nutrients
Water samples were collected daily and analyzed immediately for their phosphate concentrations using the MAGIC method (Rimmelin and Moutin, 2005). The detection limit was 0.8 nM for phosphate. Daily analysis of water samples for dissolved silicate, nitrite and nitrate was done according to Strickland and Parsons (1972), and for ammonium according to Ivancic and Degobbis (1984). The detection limits were 0.017 μM for nitrate and 0.019 μM for ammonium and 0.025 μM for silicate.
Dissolved Organic Carbon (DOC)
Samples for DOC analysis were transferred into dark glass bottles (precombusted at 330°C for 6 h) and then filtered through GF/F filters (precombusted at 450°C for 6 h). The filtrate was collected in 15 mL glass vials (precombusted at 450°C for 6 h) and acidified with 20 μl H3PO4 (85%). Samples were stored in the dark at 4°C until laboratory analysis by high-temperature combustion on a Shimadzu TOC 5000 analyzer, as described in Sohrin and Sempéré (2005). A four-point calibration curve was constructed daily using standards prepared by diluting a stock solution of potassium hydrogen phthalate in Milli-Q water. To avoid random errors associated with day-to-day instrument variability, all samples from a given treatment were analyzed in a single day. The procedural blanks (i.e., runs with Milli-Q water) ranged from 1 to 2 μM C whereas the analytical precision was within 2%. Operational average blanks related to transfer and storage of samples, filtration, and handling were 8.4 ± 2.5 μM C (n = 7).
Total Particulate Nutrients
Water samples collected from the mesocosms were filtered on 0.2, 0.6, 2, and 10 μm pore size polycarbonate (PC, 47 mm diameter) and Glass Fiber (GFF, 47 mm diameter) filters. The filters were air dried and stored and total particulate nutrients were measured using wavelength dispersive X-Ray Fluorescence (WDXRF) as described in Paulino et al. (2013). An S4 Pioneer XRF was used (Bruker-AXS, Karlruhe, Germany) at the department of Biology, University of Bergen. Size fractionated particulate Si, P, Fe, and Ca was measured on the PC filters and total C, N and P over 0.7 μm on the GFF filters. The detection limit is dependent on the peak-to-ground ratio of the spectral lines but the method has a detection limit for most of the elements at ~5 ppm, detection limits are included in Paulino et al. (2013).
Uptake of 33PO4
Samples (10 mL) for turnover time of PO4 were collected every day and measured using 33P-orthophosphate (Thingstad et al., 1993). Carrier-free 33P-orthophosphate (PerkinElmer, 370 MBq mL−1) was added to samples at a final concentration of 20–79 pM. Samples for the subtraction of the background and abiotic adsorption were fixed with 100% trichloroacetic acid (TCA) (final conc. 0.5%) before isotope addition. Samples were incubated under subdued (laboratory) illumination. The incubation time varied between 1 and 20 min. Incubation was stopped by a cold chase of 100 mM KH2PO4 (final conc. 1 mM). Subsamples (3.3 mL) were filtered in parallel onto 25 mm polycarbonate filters with 2, 0.6, and 0.2 μm pore sizes. After filtration, filters were placed in polyethylene scintillation vials with Ultima Gold (Packard), and radio-assayed. After the radioactivity of each filter was corrected for those of the blank filter obtained from fixed samples, phosphate turnover time (T[PO4]: h) was calculated as T[PO4] = −t/ln(1−f) where f is the fraction (no dimension) of added isotope collected on the 0.2 μm filter after the incubation time (t: h).
Alkaline Phosphatase Activity (APA)
Samples of APA were collected daily from every mesocosm treatment. One mL of sea water sample was added to the substrate MUF-P. The alkaline phosphatase (AP) hydrolyses the fluorogenic substrate MUF-P and yields a highly fluorescent product (methyllumbelliferon: MUF) and a phosphate group in equimolar concentrations (Rengefors et al., 2001; Sebastian et al., 2004). The MUF produced was detected as increase in fluorescence with spectrofluorometer (Hithachi F-2000, excitation-364 nm and emission-448 nm). A standard curve with MUF (Sigma Co.) was used to quantify the amount of MUF produced by APA, so the phosphate liberated in the reaction could be estimated.
Chlorophyll a
The amount of chlorophyll a corresponding to the 0.2–0.6, 0.6–2, and >2 μm size classes was measured fluorimetrically (Holm-Hansen et al., 1965). Samples for chlorophyll a analysis were sequentially filtered through 2, 0.6, and 0.2 μm polycarbonate filters (47 mm diameter) using moderate vacuum pressure (<200 mmHg). The filters were immediately extracted in 90% acetone at 4°C in the dark overnight (for 14–20 h). Chl a concentration was determined using a Turner TD-700 fluorometer. Total Chl a was calculated as the sum of the three size fractions.
Bacterial and Primary Production
Bacterial production (BP) was measured using the 3H-leucine method, according to Kirchman et al. (1985) and modifications by Smith and Azam (1992). For each mesocosm, duplicate samples (1.5 mL) and one trichloracetic acid (TCA) killed control were incubated in 2 mL tubes with a mixture of [4,5-3H] leucine (Perkin Elmer, specific activity 115 Ci mmol−1) and non-radioactive leucine at final concentrations of 16 and 7 nM, respectively. All samples were incubated for 2 h in the dark at in situ temperature. Incubation was terminated with the addition of 90 μL 100% TCA. Samples were then stored at 4°C in the dark until further processing. Centrifugation was carried out at 16,000 g for 10 min. After discarding the supernatant, 1.5 mL of 5% TCA was added, samples were vigorously shaken using a vortex and then centrifuged again at the same speed and duration. After discarding the supernatant, 1.5 mL of 80% ethanol was added, samples were shaken and centrifuged again. The supernatant was then discarded and 1.5 mL of scintillation liquid (Ultima Gold) was added. The radioactivity incorporated into the pellet was counted using a Packard Tri-Carb 4000TR scintillation counter. BP was calculated according to Kirchman et al. (1993), from the 3H-leucine incorporation rates.
Primary production (PP) was measured using the 14C incorporation method of Steeman-Nielsen (1952). Three light and one dark 320 mL polycarbonate bottles were filled with sample water from each mesocosm in the morning, inoculated with 5 μCi of NaH14CO3 tracer each, and incubated in the large concrete tank for 3 h around midday. After the incubation, samples were filtered through 0.2, 0.6, and 2 μm polycarbonate filters under moderate vacuum pressure placed in scintillation vials where 1 mL of 1% HCl solution was immediately added in order to remove excess 14C-bicarbonate overnight. Then, 4 mL scintillation fluor (Ultima Gold) was added to the vials, and samples' radioactivity was counted in a scintillation counter. Primary production (μg C L−1 h−1) was then calculated from the radioactivity (disintegrations per minute, dpm) measured in the light and dark samples.
Abundance of Viruses, Pico- and Nanoplankton and Flagellates
Samples for determining the abundance of virus-like particles (VLP), heterotrophic bacteria (HB) and picophytoplankton were collected daily and fixed with 25% 0.2 μm-filtered glutaraldehyde (0.5% final concentration). After remaining at 4°C for ~45 min, they were flash frozen in liquid nitrogen and transferred at −80°C until further processing. Frozen samples were thawed at room temperature and sub-samples were stained for viral and bacterial enumeration, according to Brussaard (2004) and Marie et al. (1999), respectively. For more details see Tsiola et al. (this issue).
Samples for flagellate counting were collected every day, fixed with glutaraldehyde (final concentration, 1%), and kept in the dark at 48°C. Flagellate cells were concentrated to ~10 mL−1 onto a 25-mm-diameter, 0.8-mm pore-sized black polycarbonate filter, stained with 406-diamidino-2-phenylindole (1 mg mL−1) for 10 min and finally collected on the filter (Porter and Feig, 1980). The filters were mounted on slides and stored frozen (−20°C). Autotrophic (ANF) and heterotrophic nanoflagellates (HNF) were examined on at least 50 fields at x1,000, using UV and blue excitations under an Olympus BX60 epifluorescence microscope. All cells were sized and divided into four categories (5, 5–10, and >10 μm) using an ocular micrometer.
Eukaryotic Microplankton Abundance
Samples for microplankton enumeration (250 mL) were preserved in acid lugol solution (final concentration 4%) and stored at 4°C in the dark before being analyzed within 3 months of collection.
Prior to the microscopic analysis the samples were left to settle in the collection bottles in the dark and after 48 h 150 mL was slowly siphoned away. The remaining100 mL were sedimented and further analyzed according to Utermöhl (1958) on an inverted microscope (Olympus IX70) using an image analysis system after 24 h sedimentation. Examination of the supernatant in 5 random samples showed minimal cell loss (0–4%) during the above sample concentration process.
Zooplankton Abundance, Copepod Egg Production, and Feeding Rates
Total abundance of zooplankton larger than 45 μm was determined at the beginning and the end of the mesocosm experiment, by collection of triplicate samples from the field. At the end of the experiment, the content of each one of the mesocosms was filtered through a 45 μm net, fixed with 4% buffered formalin, and analyzed using a dissecting microscope.
Copepod egg production and feeding rates were measured four times (11, 12, 15, and 16 May 2012) in each mesocosm treatment. For the egg production and feeding experiments, adult females of the dominant copepod species Clausocalanus furcatus, were used. The copepods were collected from the same area as the original water for the mesocosms. Water for the incubations was collected from each replicate mesocosm early in the morning and mixed (at a ratio of three to one) according to the respective treatment. For the estimation of egg production, 3–4 females were placed in each of six 620 ml glass jars (replicates) containing well-mixed 60 μm filtered water collected from each treatment. For the feeding experiments adult copepods (ca. 10–12 females, pre-conditioned for 24 h) were added to three of the bottles (1.3 L polycarbonate), whereas the other six served as initial (three) and control (three) bottles. For more details see Christou et al. (2016, this issue).
Transparent Exopolymer Particles (TEP)
Samples for TEP analyses were collected daily from each mesocosm. Ambient seawater (10 m depth) was also collected during 3 days prior to the experiment to assess the in situ concentration of TEP. Water samples (400 mL) were filtered on 0.4 μm Whatman polycarbonate filters (25 mm diameter) under low and constant vacuum (<150 mmHg) to preserve TEP state. The TEP concentrations were measured spectrophotometrically according to a dye-binding assay (Engel, 2009). Briefly, material retained in the filters was stained with 500 μl of an aqueous solution of 0.06% acetic acid (pH 2.5) and 0.02% Alcian Blue (Sigma, 8GX). Filters were then transferred into 25-ml tubes and incubated for 2 h with 6 mL of sulfuric acid (H2SO4, 80%) was added. Absorbance of these acid solutions was measured on a spectrophotometer (Shimadzu UV-Vis; UV-2501PC) at a wavelength of 787 nm. TEP values are expressed as xanthan gum weight equivalent (X equival L−1) calculated by means of a calibration curve.
Ratio of Heterotroph to Autotroph Abundance
In order to establish which of the two trophic strategies was favored by the community following the addition and if the trend was dependent on size, we compared the ratio of heterotroph and autotroph abundance. The plankton community abundance was divided into four categories: (a) the picoplankton (Heterotrophic bacteria: Synechococcus & APE), (b) HNF under 5 μm ESD: (Equivalent Spherical Diameter), ANF under 5 μm ESD, (c) HNF over 5 μm ESD: ANF over 5 μm ESD, and (d) Ciliates, Dinoflagellates, and Tintinnids: Diatoms. We assumed all dinoflagellates as potentially heterotrophic as in Loder et al. (2011). On days where abundance data was available for two or more size classes the logged total abundance between treatments was also compared.
Statistical Analysis
Experimental results were analyzed for significant changes over time and between treatments using repeated measures analysis of variance (RM-ANOVA), with a compound symmetry correlation structure and after checking if the assumptions for performing the analysis were met. The dependent variable was the measured parameter and the independent variables were the treatment type (Control, Saharan Dust, Aerosol) and time (day number). Where the interaction term between variables was not significant, it was removed.
On individual experimental days, one-way analysis of variance (one-way ANOVA) was used to assess whether there were statistically significant differences in measured parameters between treatments, the treatment type (Control, Saharan Dust, Aerosol) was the independent variable and again, the analysis was performed when assumptions were met. Following the one-way ANOVA, the differences between groups (as mean) were explored using Tukey's HSD test.
Where the employed ANOVA analyses showed statistically significant differences, the F ratio, degrees of freedom, confidence level are given in brackets as follows (Fdf = ratio, p < 0.05, eta squared). The effect size, eta squared (η2 one-way ANOVA) and partial eta squared (ηp2 RM ANOVA) are also indicated. Differences were considered significant at the 95.0% confidence level. All statistical analysis was performed using the IBM SPSS™ 22 software.
Results
The initial water characteristics used prior to the aerosol additions (SD or A) are discussed in Herut et al. (2016), this issue. The results presented here pertain to measurements from the mesocosm bags after filling was completed as described in the Materials and Methods Section.
Dissolved Nutrients
Mean initial phosphate concentration in the mesocosms was 13.6 nM (±1.45). After the addition of either SD or A the PO4 concentration decreased while no changes were observed in the C mesocosm. One-way ANOVA showed that prior to any addition, the A mesocosm bags had a significantly higher concentration of phosphate (F2 = 1 1.05, p = 0.01, η2 = 0.79); Average initial concentration 17.9 nM (±2.3), this difference was evident until Day 4 (Figure 1A).
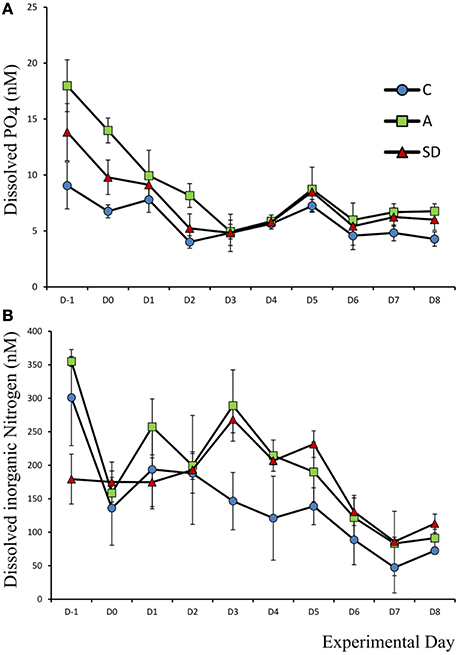
Figure 1. Concentration of dissolved (A) phosphate and (B) inorganic nitrogen, in each treatment over the course of the experiment.
Dissolved inorganic nitrogen (DIN) was calculated as the sum of NO2, NO3, and NH4 and was initially 270 nM (±15). One-way ANOVA showed that prior to addition the DIN concentration was higher in the C and A than the SD bags (F2 = 11.05, p = 0.01 η2 = 0.79). On Day 3 the DIN concentration was significantly higher in the mixed A treated mesocosms than the C (F2 = 10.56, p = 0.011, η2 = 0.78), with a mean concentration of 289 nM (±53.2) and 268 nM (±19.9) in the mixed aerosol and Saharan dust treatment, respectively (Figure 1B).
Prior to additions, the mean silicate concentration in all mesocosms was 1,230 nM (±49). A peak in the C and A treatments was measured on Day 1, where the concentration increased to a mean of 1,690 nM (±207) and 1,770 nM (±207), respectively (not shown). No significant differences were observed in silicate concentrations between treatments after the addition of dust.
Dissolved Organic Carbon (DOC)
Initial DOC concentrations for all mesocosm experiments ranged from 62 to 65 μM C. Values were lower, but close to DOC concentration at the sampling site (73 μMC) suggesting no contamination occurred during the seawater transfer. On Day 2, DOC concentrations increased by 12 and 8 μMC from their initial concentration for the SD and A mesocosms, respectively (Figure 2). These values are in agreement with the organic carbon content of the initial SD (8 μM C) and A (6 μM C) dust before addition to the mesocosm (data not shown). Overall, DOC concentration did not exhibit significant differences between the treatments.
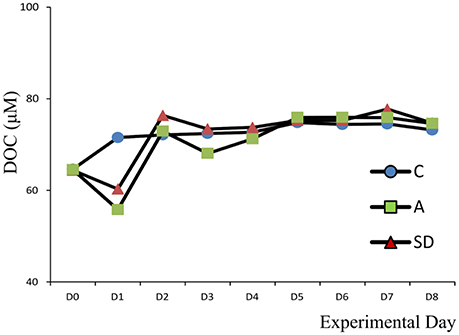
Figure 2. Dissolved organic carbon (DOC) concentration in the different treatments.
Particulate Nutrients
No significant differences were found for particulate carbon and nitrogen between treatments and days. Mean particulate carbon (Cpar) was 3.98 μM (±0.32) at the beginning of the experiment while particulate nitrogen (Npar) was 0.39 μM (±0.19). The corresponding particulate C:N ratio was 10:1, slightly higher than the typical Redfield ratio (6.6), suggesting a potential N limitation.
Mean particulate phosphorus (Ppar) was 0.08 μM (±0.01) at the beginning of the experiment. One-way ANOVA on individual days showed that on Day 2 addition Ppar was significantly higher in the SD treatment than both the A and C treatments (F2 = 22.9, p = 0.002, η2 = 1; Figure 3A). The particulate C:P ratio on D0 in the C tanks was 46.6 (±4.6), suggesting that particles were P replete (not shown).
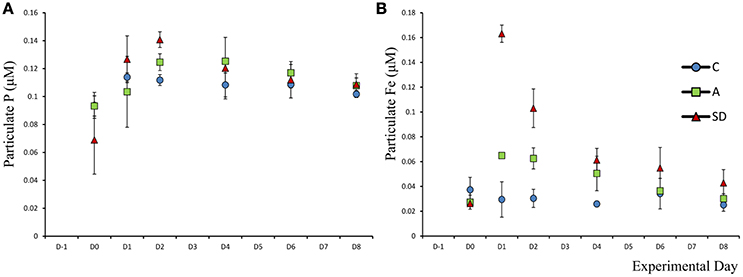
Figure 3. Total particulate phosphorus (P) (A) and Iron (Fe) (B) in each treatment.
Particulate Fe concentration changed considerably after both the SD and A additions. Initial Fe concentration was 0.037 μM (±0.006). In the A treatment, a significant increase in Fe was observed (F5 = 27.1, p = 0.001, η2 = 1), with values of 0.065 (±0.001) on D1 which remained at a similar concentration for one more day. In the SD mesocosms Fepar increased to 0.16 (±0.004) 1 day after addition (Figure 3B). Based on 1 one-way ANOVA analyses, Fepar differed significantly between all treatments on D1 (F2 = 211, p < 0.001, η2 = 1). The same applies for D2 (F2 = 32.3, p < 0.001, η2 = 0.89) and D4 (F2 = 10.3, p = 0.043, η2 = 0.67).
Phosphorus Turnover Time and Uptake
The mean turnover time T[PO4] of phosphorus was 1.05 (± 0.04) h in the beginning of the experiment. After aerosol addition, T[PO4] decreased significantly over time all mesocosms (F9 = 419, p < 0.001, ηp2 = 0.57) to reach a minimum of 0.08 (±0.003) h in both A & SD on Day 6. The turnover time was higher in the control than the dust added mesocosms on Day 3(F2 = 34.15, p < 0.001, η2 = 0.92) and on most of the following days (Figure 4A).
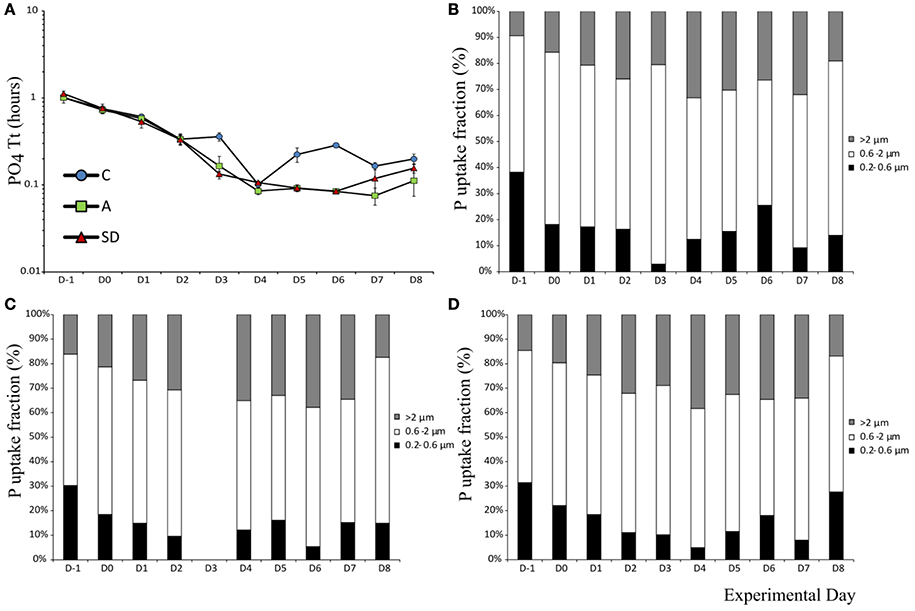
Figure 4. Phosphate turnover time (A) and uptake in different size fractions in the control (B), mixed aerosol (C), and Saharan dust (D) treatments.
Phosphorus uptake in the smallest fraction (0.2–0.6 μm) decreased in all treatments up to days 3–4, most of the P during these days was instead taken up by the fraction >2 μm. From the beginning, more than 50% of P uptake was mediated by the 0.6–2 μm fraction, which also displayed the smallest magnitude of change (Figures 4B–D).
Alkaline Phosphatase Activity
Alkaline phosphatase activity (APA) was low at the beginning of the experiment, the mean concentration was 1.90 (±0.23) nM MUF h−1. APA peaked in all mesocosms toward the end of the experiment, on Day 6, at 17.71 (±0.52), 16.96 (±6.22), and 13.60 (±9.49) nM MUF h−1 in the C, A, and SD treatments, respectively. Activity was higher in the control and mixed aerosol mesocosms, than in the Saharan dust treatment before the dust was added (F2 = 9.59, p = 0.014, η2 = 0.76), the same was the case up to Day 2 (Figure 5).
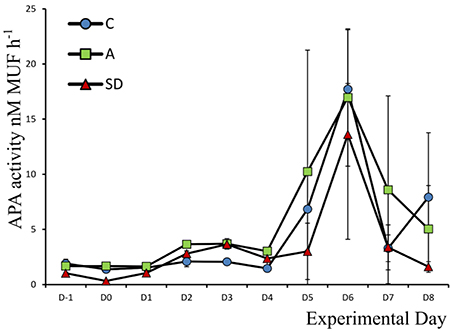
Figure 5. Alkaline phosphatase activity in each treatment.
Chlorophyll a
Total Chl a (>0.2 μm) prior to addition was 0.064 μg L−1. The Chl a levels followed the same trend in all mesocosms, with an overall increase of 1.5-fold in all treatments up to Day 3 where it peaked. Yet, the day after both aerosol types were added (D1), Chl a concentration was significantly higher than the control (F2 = 153, p < 0.001, η2 = 1). The trend continues with higher Chl a concentration in the A treated mesocosms (Figure 6A). Chl a size fractionation showed that the increase observed in the dust treated mesocosms was mostly due to changes in the fractions from 0.6–2 and >2 μm (Figures 6B–D).
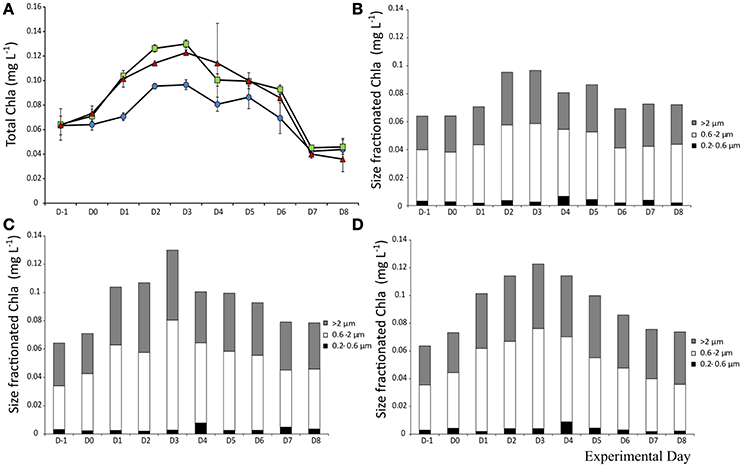
Figure 6. Total Chlorophyll a concentration (A) and contribution of each size fraction to total Chla a in the control (B), mixed aerosol (C), and Saharan dust (D) treatments.
Bacterial and Primary Production
Bacterial production (BP) prior to addition was 13.6 (±1.8) ng C L−1 h−1. The response on the day of dust addition (Day 0) was very fast in the A treatment, BP increased over 150%, to 31.5 (±2.4) ng C L−1 h−1 which was significantly more (F2 = 104.1, p < 0.001, η2 = 0.97) than both the SD and the control (Figure 7A). The following day, BP peaked in the mixed aerosol treatments, again with significant differences from the control (F2 = 18.6, p = 0.003, η2 = 0.86), but not between treatments, following the peak BP was decreasing to Day 4 (Figure 7A).
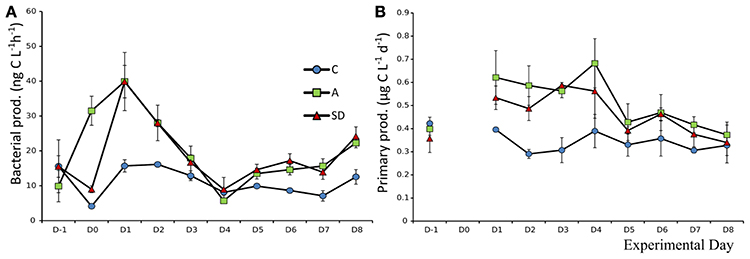
Figure 7. Bacterial production (A) and primary production (B) in each treatment.
Mean initial total primary production (PP), prior to addition, was 0.39 (±0.02) μg C L−1 h−1. From Day 1, the mixed aerosol added mesocosms showed significantly higher PP rates (F2 = 7.1, p = 0.025, η2 = 0.87), an increase of 56% compared to Day 0. On Day 2, the PP rates in both dust treatments were higher than the control (F2 = 19.7, p = 0.002, η2 = 0.7) but treatments did not differ between them until Day 3, when SD displayed its maximal values of 0.58 (±0.01SE) μg C L−1 h−1. Treatment A peaked 1 day later, reaching values of 0.68 (±0.06 SE) μg C L−1 h−1 (Figure 7B).
The size fractionation showed that observed differences were mostly due to changes in PP of the fractions 0.2–0.6 and 0.6–2 μm, which increased in the SD and A treatments on days 1–3. After that the fraction of PP >2 μm increased in the SD mesocosms but not in the A ones.
Abundance of Viruses, Pico- and Nanoplankton and Flagellates
Changes in viral abundance over time were similar in all mesocosms. Mean initial abundance was 6.6 × 10⁶ (±2.1 × 10⁵) individuals mL−1, which changed little until the end of the experiment. After the addition of dust, on Day 1, viral abundance in the A treatment was significantly higher (F2 = 16.54, p = 0.004, η2 = 0.85). The same response was observed on Day 3 for the SD treatment (F2 = 5.51, p = 0.044, η2 = 0.65) (Figure 8A). The virus to bacteria ratio was higher in the controls, with an increasing trend as the experiment progressed. The increasing trend was also observed for the dust added mesocosms, with no differences between them (Figure 8B).
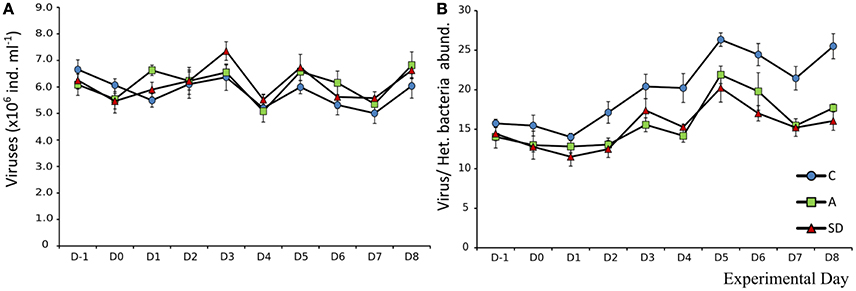
Figure 8. Abundance of viruses (A) and ratio of viral to bacterial abundance (B) in each treatment.
Mean heterotrophic bacteria (HB) abundance at the beginning of the experiment was 4.2 × 10⁵ (± 3.6 × 10³) cells mL−1. The abundance in control mesocosms decreased significantly over time (F9 = 219, p < 0.001, ηp2 = 0.97) to 2.3 × 10⁵ (±4.2 × 10³) cells mL−1 at the end of the experiment. In the aerosol treated mesocosms (SD and A), HB abundance was higher that the control on all days after addition (D1 onwards). HB peaked in A & SD on Day 1 at 5.17 × 10⁵(±1.2 × 10⁴) and 5.14 × 10⁵ (±2.4 × 10⁴) cells mL−1, respectively (Figure 9A). Abundance declined steadily until Day 5, after which it started increasing again in the dust treated mesocosms until the end of the experiment. No significant differences between dust types were detected (Figure 9A).
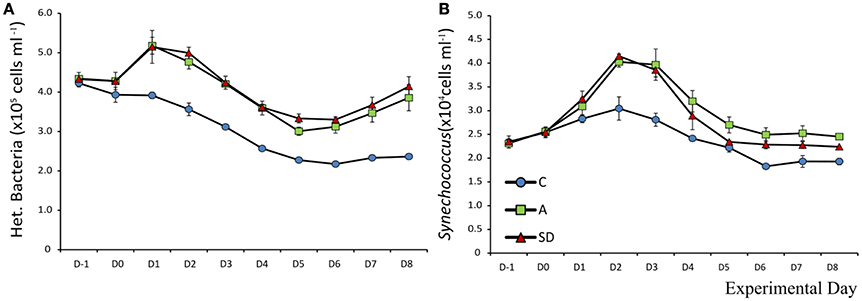
Figure 9. Abundance of (A) heterotrophic bacteria and (B) Synechococcus sp. in each treatment.
Initial mean Synechococcus abundance was 2.3 × 10⁴ (±105) cells mL−1. Significant changes over time were observed in all mesocosms (F9 = 150, p < 0.001, ηp2 = 0.96). Differences were significant only after the addition of SD or A. On D1 significantly more Synechococcus than the control were observed in the SD mesocosms (F2 = 6.1, p = 0.035, η2 = 0.67). From Day 2 onwards the abundance of Synechococcus in both the A and SD mesocosms was higher than the control until the end of the experiment. Synechococcus peaked in both treatments on D2 with a more than 70% increase from the beginning of the experiment at 4.0 × 10⁴ (±609) and 4.1 × 10⁴ (±257) cells mL−1in the A and SD mesocosms, respectively (Figure 9B).
Autotrophic picoeukaryotes (APE) also changed significantly over time, again with a very similar trend between all mesocosms (F9 = 224, p < 0.001, ηp2 = 0.97). Mean initial abundance was 1,335 (±34.1) cells mL−1. On Day 3 the SD mesocosms showed a significantly higher abundance than the control (F2 = 8.8, p = 0.016, η2 = 0.75), at 2,193 (±95) cells mL−1. After Day 3 a decrease was observed, to abundances much lower than the starting day, in all mesocosms (data not shown).
The mean abundance of autotrophic nanoflagellates (ANF) at the beginning of the experiment was 1,107 (±29) cells mL−1. One day after the addition significantly more ANF were observed in both A & SD mesocosms (F2 = 7.47, p < 0.05, η2 = 0.71). The abundance peaked on D2 at 1,741 (±183) and 2,013 (±183) cells mL−1 in the A and SD mesocosms, respectively (Figure 10A).
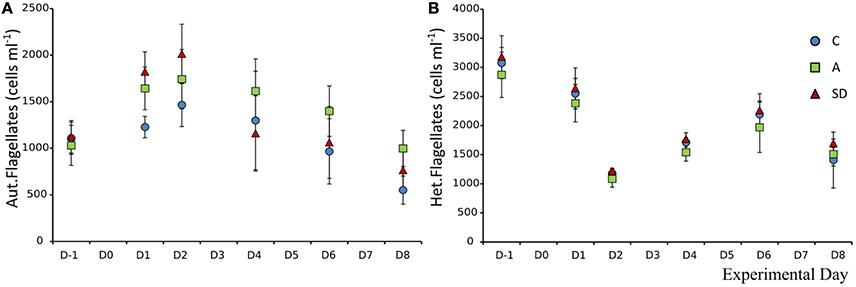
Figure 10. Abundance of autotrophic nanoflagellates (A) and heterotrophic nanoflagellates (B) in each treatment.
The size distribution of the autotrophic flagellates suggests that small flagellates were dominant in all treatments and days, with the size class under 5 μm making up more than 70% of the community total (data not shown). Heterotrophic nanoflagellates (HNF) did not display any significant differences between treatments and days. Their mean abundance at the beginning of the experiment was 3,073 (±90) cells mL−1. The abundance declined up to D2 to a mean abundance of 1,177 (±40) cells mL−1 (Figure 10B).
Eukaryotic Microplankton Abundance
Diatom abundance was high at the beginning of the experiment, dominated by the chain forming diatom Chaetoceros sp. at the sampling site with 2,500 cells L−1. The diatom population decreased during the experiment reaching a minimum of 920 cells L−1 in the C and A treatments on Day 8. In the SD the decline was sharper, the population halved in 2 days going from an initial abundance of 2,345 cells L−1 to 1,175 cells L−1. Dinoflagellate abundance was 665 cells L−1 at the beginning of the experiment. While in the C mesocosms minimal changes were observed throughout, the SD and A additions triggered different responses with nearly doubled dinoflagellate abundance at D1 (1,525 cells L−1) in the SD treatment. Initial average ciliate abundance (D-1) was 145 cells L−1, the abundance increased in all mesocosms and was highest in the SD treatment. On Day 8, in the SD mesocosms, ciliate abundance was almost 10 times higher than the start, at 1,530 cells L−1, which was also the highest abundance measured. Loricate tintinnids also increased, from an initial abundance of 35 cells L−1 to a final abundance of 1,213 cells L−1 in the A treatment (Figures 11A–D).
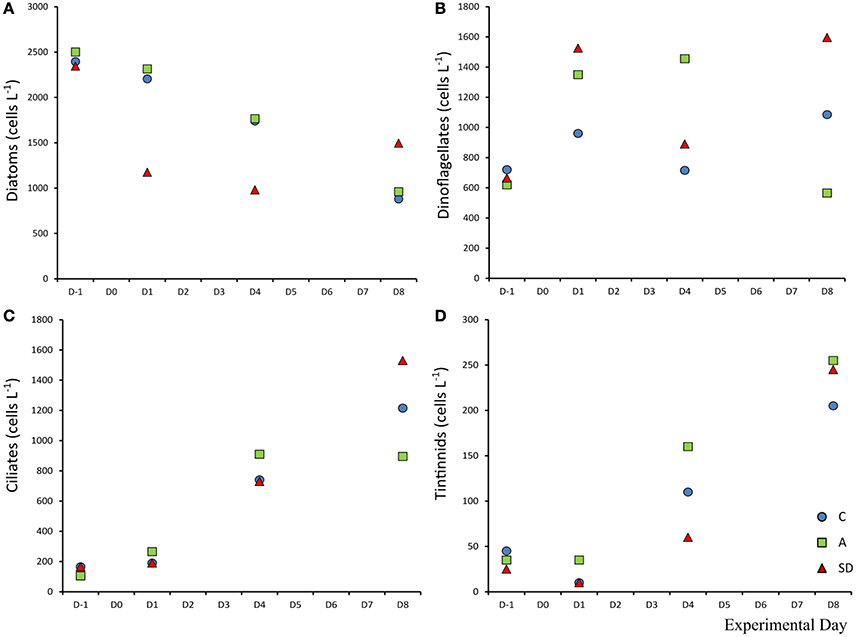
Figure 11. Abundance of diatoms (A), dinoflagellates (B), ciliates (C), and tintinnids (D) in each treatment.
Zooplankton Abundance, Copepod Egg Production, and Feeding Rates
Total zooplankton abundance in the ambient seawater samples was 188 (±40) ind. m−3, at the end of the experiment mean zooplankton abundance decreased in all treatments but the differences were not statistically significant, (Figure 12A). Most of the zooplankton community consisted of copepods, with Clausocalanus sp. being the dominant genus (Christou et al., 2016, this issue). In the aerosol added treatments copepod egg production increased on Day 5 from an average of 0.8 eggs per individual per day, 1 day after addition to more than 5 eggs ind. day−1 (Figure 12B). Essential feeding was detected during all experiments on ciliates and dinoflagellates, whereas grazing on Chl a was lower. Both ciliates and dinoflagellates were cleared at comparable rates with marginally higher clearance rates for ciliates (Ciliates: 14–152 mL cop−1 day−1; Dinoflagellates: 22–97 mL cop−1 day−1), Chl a was cleared at much lower rates in most cases (2–54 mL cop−1 day−1; Christou et al., 2016, this issue).
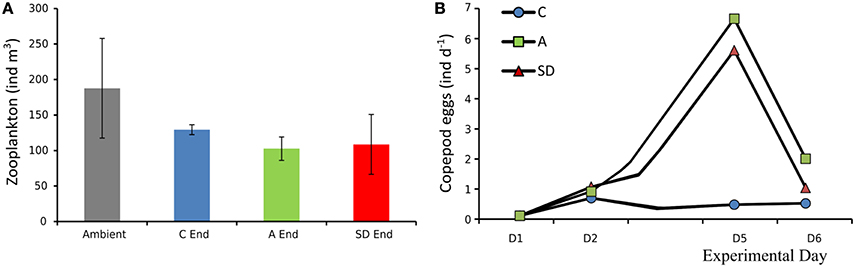
Figure 12. Initial zooplankton abundance (ambient water) and at the end of the experiment (A), copepod egg production in mesocosms (B).
Transparent Exopolymer Particles (TEP)
Transparent exopolymer particles did not display any significant differences between treatments and days. The exception was Day 6 where one way ANOVA showed significantly more TEP in the SD treated mesocosms than in the A or control mesocosms (F2 = 7.56, p = 0.023, η2 = 0.72). At the beginning of the experiment, mean TEP concentration was 118.5 (±5.05) xanthan eq. μg L−1. Then an increase in TEP concentration was observed with maximum values of 188.4 (±15) and 203.7 (±25) xanthan eq. μg L−1 in SD and A mesocosms on Day 6 and Day 7, respectively. While in the control mesocosms the average was 99.1 (±4.46).
Ratio of Heterotroph to Autotroph Abundance
Overall, the ratio between autotrophic and heterotrophic abundance of plankton groups showed an interesting pattern following the addition. The results of the comparison are shown in Figure 13. The H:A ratio decreased in all the size classes up to microplankton after the dust addition (Figure 13). The decrease lasted until days 2 and 3 after which slightly different trends were observed in each treatment. In the pico-fraction the heterotrophs dominated more in the Saharan dust addition while the H:A ratio remained lower than the initial ratio until the end of the experiment (Figure 13A). Small nanoflagellate H:A ratio returned to initial values in the control and SD but not the A treatment (Figure 13B) and the same is the case for the large nanoflagellates where the heterotrophs increased earlier in the SD treatment (Figure 13C). In the microplankton size fraction the heterotrophs increased in all treatments, the largest increase was observed in the SD (Figure 13D).
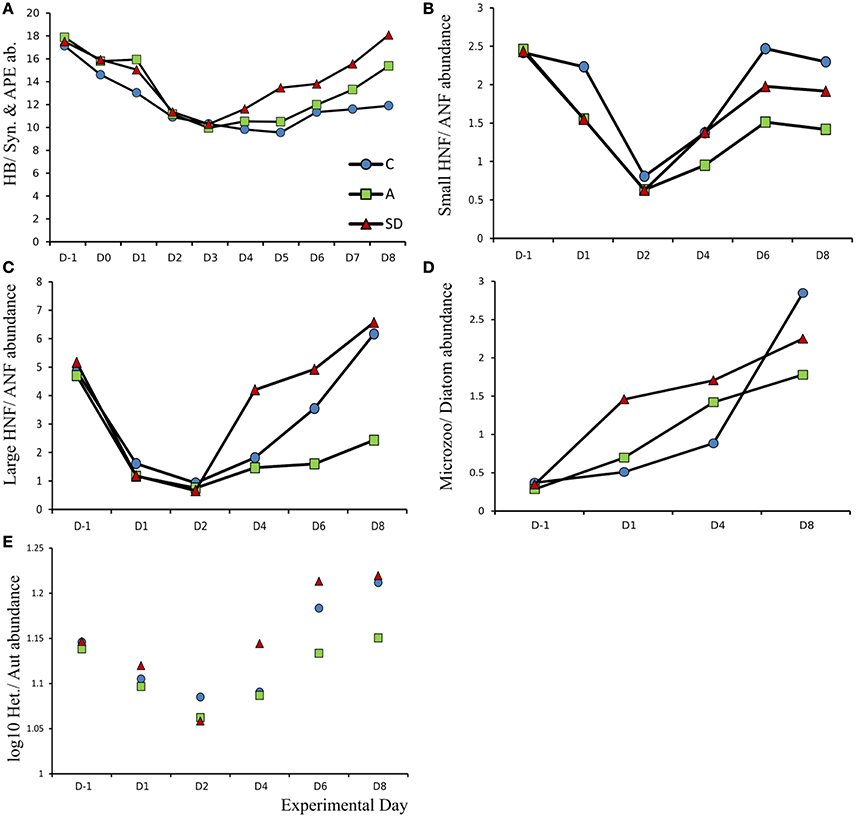
Figure 13. Ratio of heterotrophic to autotrophic abundance for (A) Heterotrophic bacteria (HB) vs. Synechococcus (Syn) and autotrophic pikoeukaryotes (APE), (B) Small (ESD < 5 μm) heterotrophic nanoflagellates (HNF) vs. small autotrophic nanoflagellates (ANF). (C) Large (ESD > 5 μm) heterotrophic nanoflagellates (HNF) vs. small autotrophic nanoflagellates (ANF) (D) Microzooplankton (Microzoo) vs. Diatoms and (E) Pooled total abundance (Log10) of heterotrophs vs. autotrophs.
Discussion
The impact of Saharan dust and mixed aerosol deposition on plankton communities was examined in the Eastern Mediterranean. The deposition resulted in changes in the plankton community at different scales and magnitudes, but throughout the monitored groups, from bacteria to zooplankton. To our knowledge, this is the first experiment demonstrating the transfer of atmospheric deposition effects to a higher trophic level. The copepod egg production increased in both sets of dust added mesocosms 5 days after the addition of dust. Although a small amount of nutrients was added, this constituted an important percentage increase in the total dissolved phosphate pool. In the SD 40% additional dissolved phosphate was added in comparison to 30% for the A. This <5 nM PO4 addition was enough to trigger a 0.04 mg L−1 increase in Chl a after 1 day (Herut et al., 2016, this issue).
Regarding our expectations for the changes in the plankton community we observed the expected transfer of energy to higher trophic levels. This transfer occurred through the classical food chain and not through a bypass of the microbial loop. It took 5 days for copepod egg production to increase, there were more autotrophs during the first 4 days of the experiment (Figure 13E) and the P turnover time decreased during the first 4 days. The dominance of the autotrophic pathway could be because of the high inoculum in the collected seawater, with many diatoms, ready to use the Nitrogen supply, likely co-limiting as indicated by the initial C:N ratio. The origin of dust added did not seem to change the observed community responses, thus our expectation regarding added effects of mixed aerosol was not met.
Marañón et al. (2010) demonstrated that the degree of oligotrophy influences the type of response to deposition, suggesting that in less oligotrophic conditions, since bacteria are less limited by inorganic nutrient supply, phytoplankton have a better chance of utilizing the supplied nutrients. Their results, from bioassay experiments in the Atlantic, show the bacterial response was more pronounced in ultraoligotrophic conditions and deposition affected the community rates more than the standing stocks while heterotrophs were more favored by autotrophs. In the present experiment, the response of bacterial production was faster and of larger magnitude than the primary production (Figure 7), but the autotrophs keeps being dominant in abundance for more days after addition (Figure 13E).
A difference in initial conditions is probably the reason for the variability in reported experimental results in other deposition effect studies. Deposition has been found to stimulate a response in abundance, community composition and rates as reviewed by Guieu et al. (2014). In a series of mesocosms in the western Mediterranean, Ridame et al. (2014) found an increase in primary production and Chl a concentration in response to deposition events. For heterotrophic bacteria, dust addition has been found to result in increased bacterial respiration, whereas repeating the addition in the same experiment, resulted in a decrease in bacterial abundance (Pulido-Villena et al., 2014). A decrease in bacterial abundance has also been observed in a microcosm experiment in 2008 (Pulido-Villena et al., 2008), while Herut et al. (2005) observed no changes in abundance but an increase in activity. Larger heterotrophs (nanoflagellates) did not respond to the dust deposition events in a mesocosm experiment performed in the western Mediterranean (Pulido-Villena et al., 2014). This is also highlighted in the review by Guieu et al. (2014), where the authors question whether the simple “fertilization” effect traditionally suggested as the overall response of HNLC regions, applies to LNLC regions also.
Our results suggest that sufficient nutrients were made available for both autotrophs and heterotrophs to utilize, an inference supported both by the P turnover time and the DOC results. Specifically, the turnover time decreased over the course of the experiment (Figure 5), meaning that what P was added with the dust was not in excess of the consumption by the plankton community. Concurrently, DOC concentration did not increase significantly suggesting that additional carbon fixation (due to increased PP) was not of large magnitude or rapidly consumed by bacteria. TEP formation also did not occur, further suggesting that there was little organic carbon accumulation due to increased production. The supplied nutrients were nevertheless enough to sustain the changes observed in the mesocosms with alkaline phosphatase production not starting until the final days of the experiment (Figure 6). Despite the rapid initial response of bacteria, the fast growing smaller autotrophs followed, and tipped the trophic balance (H:A) during the first days of the experiment. Even though bacterial abundance increased, viruses did not seem to respond numerically, the bacteria population also displayed internal changes in terms of DNA content and growth rate (Tsiola et al., 2016, this issue), likely connected to changes in the community structure to which the increased bacterial production was also attributed (Guo et al., 2016, this issue). The virus to bacteria ratio was higher in the control, suggesting that it was grazing and not viruses controlling the bacterial abundance in the dust added mesocosms.
Gasol et al. (1997) found that in oligotrophic environments, a high H:A ratio can be expected while, when nutrient availability increases, the H:A ratio is expected to decrease since the autotrophic community develops faster than the heterotrophs. The changes in the H:A ratio of plankton community abundance indicate that during the peak of observed effects, i.e., a couple of days after the addition of aerosols, the community became less heterotrophic than before addition (Figure 13E). Heterotrophs then increase as a response to the increased availability of prey and in this instance it appears that bottom up effects from the addition of nutrients via the dust, were swiftly mediated by grazing, a response also documented in Pulido-Villena et al. (2014). The H:A ratios further indicate that the Saharan dust treatment returned to more oligotrophic conditions faster than the aerosol, along with the control. This would suggest N and P co-limitation, not present in the A treatment because of the higher amount of leached NO3 provided with the dust. At the beginning of the experiment the diatom abundance was quite high, the dominant genus, Chaetoceros sp. is typically large, and one of the most commonly occurring blooming species in the Mediterranean (Siokou-Frangou et al., 2010; Rigual-Hernandez et al., 2013). After addition, the diatom abundance declined, indicating that smaller autotrophs (pico- and nano-fractions) managed to outcompete their larger counterparts for mineral nutrient resources right after addition. The copepod grazing experiments showed that this group produced more eggs in the dust treated mesocosms and thus, copepods were clearly able to capitalize on the increased growth of microplankton in a few days. As the clearance rates indicate (Christou et al., 2016, this issue), copepods grazed more on microzooplankton than on phytoplankton. In an experiment from the same area, where the response of copepods was measured following different levels of phosphate additions, Pitta et al. (2016) found that copepods almost doubled their egg and nauplii production after 2 days incubation at only 10 nM addition of phosphate. This immediate response was not observed in the present experiment, where it appears copepods responded to the increase of preferred prey after some days. However, the quality/quantity of prey was not sufficient to sustain an increase in copepod abundance as previously observed in a phosphorus addition mesocosm experiment (Pitta et al., 2016). From the information provided by the standing stocks and production of the different groups we can conclude that the larger heterotrophic eukaryotes were more favored than copepods by the conditions created in the mesocosms after the addition of dust.
Overall it appeared that the response to Saharan dust addition vs. the mixed aerosol was very similar and affected most components of the plankton community. Differences in responses between treatments were subtle and faded out when moving further up the food web and/or forward in time. When comparing responses to addition of Saharan Dust to ambient deposition from samples taken from a transect across the Mediterranean, Ternon et al. (2010) also found a response to both deposition types relative to the control but no significant differences in the magnitude of the response observed between the two types of deposition. This suggests that some common components in the two aerosol types may be responsible for the changes observed, as was the case in the present study. Considering the amount of nutrients added and the magnitude of changes observed it is remarkable that a ca. 3.5 nM addition of P can trigger changes that culminate in an increase of egg production by copepods. As mentioned, the system response to atmospheric deposition highly depends on the ambient conditions and trophic status of the system at the time of deposition, as well as on the timing of the deposition event. Whether or not we can predict this response is more the subject of modeling approaches, but during previous years deposition events in the eastern Mediterranean have increased both in frequency and intensity (Pey et al., 2013). Given the frequency of events it could be hypothesized that more persisting changes resulting from deposition can occur, especially in stratified waters. The implications can be far reaching as observed in Martínez-Garcia et al. (2011), as the coupling of dust to climate patterns also connects to long term cycling of nutrients and climate mediation and could also be connected to POC export events (Ternon et al., 2010).
Our results demonstrate that a single deposition event is enough to induce changes in the microbial food web that are measureable up to zooplankton. In spring conditions this could indicate that repeated deposition would make the system more productive. Although, the differences due to source of the dust were not conclusively observable in the standing stocks, there was some indication that production rates, as indicated by the bacterial production, were triggered faster where mixed aerosol was added. Future scenarios for the Mediterranean region predict rising temperature, which will influence circulation and stratification patterns, and decrease in precipitation (Somot et al., 2006; Giorgi and Lionello, 2008). The decrease in precipitation and increase in temperature (IPCC, 2014) suggest the trend for increased dry deposition will continue, and we can expect that surface inputs via the air-sea interface will become more important in this ecosystem. The results presented, indicate that the eastern Mediterranean system responses to deposition events, although episodic in nature, can significantly alter long term community dynamics.
Author Contributions
TMT: Performed experimental work and wrote the MS. PP and BH: Designed experiment, Secured funding, performed experimental work and contributed to the MS. ER, IBF, AT, MT, AnG, CP, KV, SP, AL, EDC, SZ, NN, MLP, and MDK: Performed experimental work and contributed to the MS. AlG, NP, MF, TM, and TT: Performed experimental work.
Conflict of Interest Statement
The authors declare that the research was conducted in the absence of any commercial or financial relationships that could be construed as a potential conflict of interest.
Acknowledgments
The work presented was financed by the EU-FP7 project “MESOAQUA: Network of leading MESOcosm facilities to advance the studies of future AQUAtic ecosystems from the Arctic to the Mediterranean” (grant agreement no. 228224) and by the project ADAMANT: Atmospheric deposition and Mediterranean sea water productivity (nr code/MIS: 383551), co-financed by the European Union (European Social Fund–ESF) and Greek national funds through the Operational Program “Education and Lifelong Learning” of the National Strategic Reference Framework (NSRF) (Research Funding Program: THALES). Funding for MDK was also provided by Leverhulme Trust entitled “Understanding the delivery of phosphorus nutrient to the oceans” Grant Number RPG 406.
The authors would like to thank G. Piperakis for his technical assistance throughout the experiment, and S. Zivanovic and E. Dafnomili for assistance with chemical analyses. The captain and the crew of the R/V Philia are thanked for their assistance during the transportation of water from the sea to the mesocosms.
References
Brussaard, C. P. D. (2004). Optimization of procedures for counting viruses by flow cytometry. Appl. Environ. Microbiol. 70, 1506–1513. doi: 10.1128/AEM.70.3.1506-1513.2004
Bryant, R. G. (2013). Recent advances in our understanding of dust source emission processes. Prog. Phys. Geogr. 37, 397–421. doi: 10.1177/0309133313479391
Carbo, P., Krom, M. D., Homoky, W. B., Benning, L. G., and Herut, B. (2005). Impact of atmospheric deposition on N and P geochemistry in the southeastern Levantine basin. Deep Sea Res. Part II Top. Stud. Oceanogr. 52, 3041–3053. doi: 10.1016/j.dsr2.2005.08.014
Christou, E., Zervoudaki, S., Fernandez de Puelles, M., Protopapa, M., Varkitzi, I., Pitta, P., et al. (2016). Response of the calanoid copepod Clausocalanus furcatus, to atmospheric deposition events: outcomes from a mesocosm study. Front. Mar. Sci. 3:35. doi: 10.3389/fmars.2017.00035
Crispi, G., Crise, A., and Solidoro, C. (2002). Coupled Mediterranean ecomodel of the phosphorus and nitrogen cycles. J. Mar. Syst. 33–34, 497–521. doi: 10.1016/S0924-7963(02)00073-8
D'Ortenzio, F., and Ribera d'Alcalà, M. (2009). On the trophic regimes of the Mediterranean Sea: a satellite analysis. Biogeosciences 6, 139–258. doi: 10.5194/bg-6-139-2009
Engel, A. (2009). “Determination of marine gel particles,” in Practical Guidelines for the Analysis of Seawater, ed O. Wurl (Boca Raton, FL: CRC Press), 125–142.
Fonnes Flaten, G. A., Skjoldal, E. F., Krom, M. D., Law, C. S., Mantoura, R. F. C., Pitta, P., et al. (2005). Studies of the microbial P-cycle during a Lagrangian phosphate-addition experiment in the Eastern Mediterranean. Deep Sea Res. Part II Top. Stud. Oceanogr. 52, 2928–2943. doi: 10.1016/j.dsr2.2005.08.010
Gallisai, R., Peters, F., Volpe, G., Basart, S., and Baldasano, J. M. (2014). Saharan dust deposition may affect phytoplankton growth in the Mediterranean sea at ecological time scales. PLoS ONE 9:e110762. doi: 10.1371/journal.pone.0110762
Ganor, E., Osetinsky, I., Stupp, A., and Alpert, P. (2010). Increasing trend of African dust, over 49 years, in the eastern Mediterranean. J. Geophys. Res. Atmos. 115. doi: 10.1029/2009jd012500
Gasol, J. M., del Giorgio, P. A., and Duarte, C. M. (1997). Biomass distribution in marine planktonic communities. Limnol. Oceanogr. 42, 1353–1363. doi: 10.4319/lo.1997.42.6.1353
Ginoux, P., Prospero, J. M., Gill, T. E., Hsu, N. C., and Zhao, M. (2012). Global-scale attribution of anthropogenic and natural dust sources and their emission rates based on MODIS Deep Blue aerosol products. Rev. Geophys. 50. doi: 10.1029/2012rg000388
Giorgi, F., and Lionello, P. (2008). Climate change projections for the Mediterranean region. Glob. Planet. Change 63, 90–104. doi: 10.1016/j.gloplacha.2007.09.005
Guerzoni, S., Chester, R., and Dulac, F. (1999). The role of atmospheric deposition in the biogeochemistry of the Mediterranean Sea. Prog. Ocenogr. 44, 147–190. doi: 10.1016/s0079-6611(99)00024-5
Guieu, C., Aumont, O., Paytan, A., Bopp, L., Law, C. S., Mahowald, N., et al. (2014). The significance of the episodic nature of atmospheric deposition to Low Nutrient Low Chlorophyll regions. Global Biogeochem. Cycles 28, 1179–1198. doi: 10.1002/2014GB004852
Guo, C., Xia, X., Pitta, P., Herut, B., Rahav, E., Berman-Frank, I., et al. (2016). Shifts in microbial community structure and activity in the ultra-oligotrophic eastern Mediterranean sea driven by the deposition of saharan dust and european aerosols. Front. Mar. Sci. 3:170. doi: 10.3389/fmars.2016.00170
Herut, B., and Krom, M. D. (1996). “Atmospheric input of nutrients and dust to the SE Mediterranean,” in Impact of Desert Dust across the Mediterranean, eds S. Guerzoni and R. Chester (Springer Netherlands), 349–358.
Herut, B., Rahav, E., Tsagaraki, T. M., Giannakourou, A., Tsiola, A., Psarra, S., et al. (2016). The potential impact of saharan dust and polluted aerosols on microbial populations in the East Mediterranean Sea, an overview of a mesocosm experimental approach. Front. Mar. Sci. 3:226. doi: 10.3389/fmars.2016.00226
Herut, B., Zohary, T., Krom, M. D., Mantoura, R. F. C., Pitta, P., Psarra, S., et al. (2005). Response of East Mediterranean surface water to Saharan dust: on-board microcosm experiment and field observations. Deep Sea Res. Part II Top. Stud. Oceanogr. 52, 3024–3040. doi: 10.1016/j.dsr2.2005.09.003
Holm-Hansen, O., Lorenzen, C. J., Holmes, R. W., and Strickland, J. D. H. (1965). Fluorometric determination of chlorophyll. ICES J. Mar. Sci. 30, 3–15. doi: 10.1093/icesjms/30.1.3
IPCC (2014). Climate Change 2014: Synthesis Report. Contribution of Working Groups I, II and III to the Fifth Assessment Report of the Intergovernmental Panel on Climate Change. Core Writing Team eds R. K. Pachauri and L. A. Meyer (Geneva: IPCC), 151.
Ivancic, I., and Degobbis, D. (1984). An optimal manual procedure for ammonia analysis in natural waters by the indophenol blue method. Water Res. 18, 1143–1147. doi: 10.1016/0043-1354(84)90230-6
Jacobsen, A., Egge, J. K., and Heimdal, B. R. (1995). Effects of increased concentration of nitrate and phosphate during a spring bloom experiment in mesocosm. J. Exp. Mar. Bio. Ecol. 187, 239–251. doi: 10.1016/0022-0981(94)00183-E
Jickells, T. D. (2005). Global Iron connections between Desert dust, Ocean biogeochemistry, and climate. Science 308, 67–71. doi: 10.1126/science.1105959
Kalivitis, N., Gerasopoulos, E., Vrekoussis, M., Kouvarakis, G., Kubilay, N., Hatzianastassiou, N., et al. (2007). Dust transport over the eastern Mediterranean derived from total ozone mapping spectrometer, aerosol robotic network, and surface measurements. J. Geophys. Res. Atmos. 112. doi: 10.1029/2006jd007510
Kirchman, D. L., Keil, R. G., Simon, M., and Welschmeyer, N. A. (1993). Biomass and production of heterotrophic bacterioplankton in the oceanic subarctic Pacific. Deep Sea Res. I Oceanogr. Res. Pap. 40, 967–988. doi: 10.1016/0967-0637(93)90084-G
Kirchman, D., K'nees, E., and Hodson, R. (1985). Leucine incorporation and its potential as a measure of protein synthesis by bacteria in natural aquatic systems. Appl. Environ. Microbiol. 49, 599–607.
Koçak, M., Kubilay, N., Tuğrul, S., and Mihalopoulos, N. (2010). Atmospheric nutrient inputs to the northern levantine basin from a long-term observation: sources and comparison with riverine inputs. Biogeosciences 7, 4037–4050. doi: 10.5194/bg-7-4037-2010
Krom, M. D., Herut, B., and Mantoura, R. F. C. (2004). Nutrient budget for the Eastern Mediterranean: implications for phosphorus limitation. Limnol. Oceanogr. 49, 1582–1592. doi: 10.4319/lo.2004.49.5.1582
Krom, M. D., Kress, N., Brenner, S., and Gordon, L. I. (1991). Phosphorus limitation of primary productivity in the eastern Mediterranean Sea. Limnol. Oceanogr. 36, 424–432. doi: 10.4319/lo.1991.36.3.0424
Krom, M. D., Thingstad, T. F., Brenner, S., Carbo, P., Drakopoulos, P., Fileman, T. W., et al. (2005). Summary and overview of the CYCLOPS P addition Lagrangian experiment in the Eastern Mediterranean. Deep Sea Res. Part II Top. Stud. Oceanogr. 52, 3090–3108. doi: 10.1016/j.dsr2.2005.08.018
Lamarque, J. F., Dentener, F., McConnell, J., Ro, C. U., Shaw, M., Vet, R., et al. (2013). Multi-model mean nitrogen and sulfur deposition from the Atmospheric Chemistry and Climate Model Intercomparison Project (ACCMIP): evaluation historical and projected changes. Atmos. Chem. Phys. 13, 7997–8018.
Lawrence, C. R., and Neff, J. C. (2009). The contemporary physical and chemical flux of aeolian dust: a synthesis of direct measurements of dust deposition. Chem. Geol. 267, 46–63. doi: 10.1016/j.chemgeo.2009.02.005
Lazzari, P., Solidoro, C., Ibello, V., Salon, S., Teruzzi, A., Béranger, K., et al. (2012). Seasonal and inter-annual variability of plankton chlorophyll and primary production in the Mediterranean Sea: a modelling approach. Biogeosciences 9, 217–233. doi: 10.5194/bg-9-217-2012
Lekunberri, I., Lefort, T., Romero, E., Vázquez-Domínguez, E., Romera-Castillo, C., Marrasé, C., et al. (2010). Effects of a dust deposition event on coastal marine microbial abundance and activity, bacterial community structure and ecosystem function. J. Plankton Res. 32, 381–396. doi: 10.1093/plankt/fbp137
Loder, M. G. J., Meunier, C., Boersma, M., Aberle, N., Löder, M. G. J., and Wiltshire, K. H. (2011). The role of ciliates, heterotrophic dinoflagellates and copepods in structuring spring plankton communities at Helgoland Roads, North Sea. Mar. Biol. 158, 1551–1580. doi: 10.1007/s00227-011-1670-2
Mahowald, N. M., Baker, A. R., Bergametti, G., Brooks, N., Duce, R. A., Jickells, T. D., et al. (2005). Atmospheric global dust cycle and iron inputs to the ocean. Global Biogeochem. Cycles 19. doi: 10.1029/2004GB002402
Mahowald, N., Jickells, T. D., Baker, A. R., Artaxo, P., Benitez-Nelson, C. R., Bergametti, G., et al. (2008). Global distribution of atmospheric phosphorus sources, concentrations and deposition rates, and anthropogenic impacts. Global Biogeochem. Cycles 22. doi: 10.1029/2008GB003240
Marañón, E., Fernández, A., Mouriño-Carballido, B., Martínez-García, S., Teira, E., Cermeño, P., et al. (2010). Degree of oligotrophy controls the response of microbial plankton to Saharan dust. Limnol. Oceanogr. 55, 2339–2352. doi: 10.4319/lo.2010.55.6.2339
Marie, D., Brussaard, C. P. D., Thyrhaug, R., Bratbak, G., and Vaulot, D. (1999). Enumeration of marine viruses in culture and natural samples by flow cytometry. Appl. Environ. Microbiol. 65, 45–52.
Markaki, Z., Loÿe-Pilot, M. D., Violaki, K., Benyahya, L., and Mihalopoulos, N. (2010). Variability of atmospheric deposition of dissolved nitrogen and phosphorus in the Mediterranean and possible link to the anomalous seawater N/P ratio. Mar. Chem. 120, 187–194. doi: 10.1016/j.marchem.2008.10.005
Martínez-Garcia, A., Rosell-Melé, A., Jaccard, S. L., Geibert, W., Sigman, D. M., and Haug, G. H. (2011). Southern Ocean dust–climate coupling over the past four million years. Nature 476, 312–315. doi: 10.1038/nature10310
Myriokefalitakis, S., Daskalakis, N., Mihalopoulos, N., Baker, A. R., Nenes, A., and Kanakidou, M. (2015). Changes in dissolved iron deposition to the oceans driven by human activity: a 3-D global modelling study. Biogeosciences 12, 3973–3992. doi: 10.5194/bg-12-3973-2015
Nenes, A., Krom, M. D., Mihalopoulos, N., Van Cappellen, P., Shi, Z., Bougiatioti, A., et al. (2011). Atmospheric acidification of mineral aerosols: a source of bioavailable phosphorus for the oceans. Atmos. Chem. Phys. 11, 6265–6272. doi: 10.5194/acp-11-6265-2011
Pasternak, A., Wassmann, P., and Riser, C. W. (2005). Does mesozooplankton respond to episodic P inputs in the Eastern Mediterranean? Deep Sea Res. Part II Top. Stud. Oceanogr. 52, 2975–2989. doi: 10.1016/j.dsr2.2005.09.002
Paulino, A. I., Heldal, M., Norland, S., and Egge, J. K. (2013). Elemental stoichiometry of marine particulate matter measured by wavelength dispersive X-ray fluorescence (WDXRF) spectroscopy. J. Mar. Biol. Assoc. U.K. 93, 2003–2014. doi: 10.1017/S0025315413000635
Pey, J., Querol, X., Alastuey, A., Forastiere, F., and Stafoggia, M. (2013). African dust outbreaks over the Mediterranean Basin during 2001–2011: PM 10 concentrations, phenomenology and trends, and its relation with synoptic and mesoscale meteorology. Atmos. Chem. Phys. 13, 1395–1410. doi: 10.5194/acp-13-1395-2013
Pitta, P., Nejstgaard, J. C., Tsagaraki, T. M., Zervoudaki, S., Egge, J. K., Frangoulis, C., et al. (2016). Confirming the “Rapid phosphorus transfer from microorganisms to mesozooplankton in the Eastern Mediterranean Sea” scenario through a mesocosm experiment. J. Plankton Res. 38, 1–20. doi: 10.1093/plankt/fbw010
Porter, K. G., and Feig, Y. S. (1980). The use of DAPI for identifying and counting aquatic microflora. Limnol. Oceanogr. 25, 943–948. doi: 10.4319/lo.1980.25.5.0943
Pujo-Pay, M., Conan, P., Oriol, L., Cornet-Barthaux, V., Falco, C., Ghiglione, J. F., et al. (2011). Integrated survey of elemental stoichiometry (C, N, P) from the western to eastern Mediterranean Sea. Biogeosciences 8, 883–899. doi: 10.5194/bg-8-883-2011
Pulido-Villena, E., Baudoux, A. C., Obernosterer, I., Landa, M., Caparros, J., Catala, P., et al. (2014). Microbial food web dynamics in response to a Saharan dust event: results from a mesocosm study in the oligotrophic Mediterranean Sea. Biogeosciences 11, 5607–5619. doi: 10.5194/bg-11-5607-2014
Pulido-Villena, E., Wagener, T., and Guieu, C. (2008). Bacterial response to dust pulses in the western Mediterranean: implications for carbon cycling in the oligotrophic ocean. Global Biogeochem. Cycles 22. doi: 10.1029/2007GB003091
Rahav, E., Shun-Yan, C., Cui, G., Liu, H., Tsagaraki, T. M., Giannakourou, A., et al. (2016). Evaluating the impact of atmospheric depositions on springtime dinitrogen fixation in the Cretan Sea (Eastern Mediterranean)—A mesocosm approach. Front. Mar. Sci. 3:180. doi: 10.3389/fmars.2016.00180
Rengefors, K., Pettersson, K., Blenckner, T., and Anderson, D. M. (2001). Species-specific alkaline phosphatase activity in freshwater spring phytoplankton : application of a novel method. J. Plankton Res. 23, 435–443. doi: 10.1093/plankt/23.4.435
Ridame, C., and Guieu, C. (2002). Saharan input of phosphate to the oligotrophic water of the open western Mediterranean Sea. Limnol. Oceanogr. 47, 856–869. doi: 10.4319/lo.2002.47.3.0856
Ridame, C., Dekaezemacker, J., Guieu, C., Bonnet, S., L'Helguen, S., and Malien, F. (2014). Contrasted Saharan dust events in LNLC environments: impact on nutrient dynamics and primary production. Biogeosciences 11, 4783–4800. doi: 10.5194/bg-11-4783-2014
Rigual-Hernandez, A. S., Barcena, M. A., Jordan, R. W., Sierro, F. J., Flores, J. A., Meier, K. J. S., et al. (2013). Diatom fluxes in the NW Mediterranean: evidence from a 12-year sediment trap record and surficial sediments. J. Plankton Res. 35, 1109–1125. doi: 10.1093/plankt/fbt055
Rimmelin, P., and Moutin, T. (2005). Re-examination of the MAGIC method to determine low orthophosphate concentration in seawater. Anal. Chim. Acta 548, 174–182. doi: 10.1016/j.aca.2005.05.071
Sebastian, M., Aristegui, J., Montero, M. F., Escanez, J., and Xavier Niell, F. (2004). Alkaline phosphatase activity and its relationship to inorganic phosphorus in the transition zone of the North-western African upwelling system. Prog. Oceanogr. 62, 131–150. doi: 10.1016/j.pocean.2004.07.007
Siokou-Frangou, I., Christaki, U., Mazzocchi, M. G., Montresor, M., Ribera d'Alcalá, M., Vaqué, D., et al. (2010). Plankton in the open Mediterranean Sea: a review. Biogeosciences 7, 1543–1586. doi: 10.5194/bg-7-1543-2010
Smith, D. C., and Azam, F. (1992). A simple, economical method for measuring bacterial protein synthesis rates in seawater using 3H-leucine. Mar. Microb. Food Webs 6, 107–114.
Sohrin, R., and Sempéré, R. (2005). Seasonal variation in total organic carbon in the northeast Atlantic in 2000–2001. J. Geophys. Res. Oceans 110. doi: 10.1029/2004jc002731
Somot, S., Sevault, F., and Déqué, M. (2006). Transient climate change scenario simulation of the Mediterranean Sea for the twenty-first century using a high-resolution ocean circulation model. Clim. Dynam. 27, 851–879. doi: 10.1007/s00382-006-0167-z
Statham, P. J., and Hart, V. (2005). Dissolved iron in the Cretan Sea (eastern Mediterranean). Limnol. Oceanogr. 50, 1142–1148. doi: 10.4319/lo.2005.50.4.1142
Steeman-Nielsen, E. (1952). The use of radio-active carbon (C14) for measuring organic production in the sea. ICES J. Mar. Sci. 18, 117–140. doi: 10.1093/icesjms/18.2.117
Stockdale, A., Krom, M. D., Mortimer, R. J. G., Benning, L. G., Carslaw, K. S., Herbert, R. J., et al. (2016). Understanding the nature of atmospheric acid processing of mineral dusts in supplying bioavailable phosphorus to the oceans. Proc. Natl. Acad. Sci. U.S.A. 113, 14639–14644. doi: 10.1073/pnas.1608136113
Strickland, J. D. H., and Parsons, T. R. (1972). A Practical Handbook of Seawater Analysis. Ottawa, ON: Fisheries Research Board of Canada.
Tanaka, T., Thingstad, T. F., Christaki, U., Colombet, J., Cornet-Barthaux, V., Courties, C., et al. (2011). Lack of P-limitation of phytoplankton and heterotrophic prokaryotes in surface waters of three anticyclonic eddies in the stratified Mediterranean Sea. Biogeosciences 8, 525–538. doi: 10.5194/bg-8-525-2011
Ternon, E., Guieu, C., Loÿe-Pilot, M. D., Leblond, N., Bosc, E., Gasser, B., et al. (2010). The impact of Saharan dust on the particulate export in the water column of the North Western Mediterranean Sea. Biogeosciences 7, 809–826. doi: 10.5194/bg-7-809-2010
Thingstad, T. F., Krom, M. D., Mantoura, R. F. C., Flaten, G. A. F., Groom, S., Herut, B., et al. (2005). Nature of phosphorus limitation in the ultraoligotrophic eastern Mediterranean. Science 309, 1068–1071. doi: 10.1126/science.1112632
Thingstad, T. F., Skjoldal, E. F., and Bohne, R. A. (1993). Phosphorus cycling and algal-bacterial competition in Sandsfjord, western Norway. Mar. Ecol. Prog. Ser. 99, 239–259. doi: 10.3354/meps099239
Tsiola, A., Tsagaraki, T. M., Giannakourou, A., Nikolioudakis, N., Yücel, N., Herut, B., et al. (2016). Bacterial growth and mortality after deposition of Saharan dust and mixed aerosols in the Eastern Mediterranean Sea: a mesocosm experiment. Front. Mar. Sci. 3:281. doi: 10.3389/fmars.2016.00281
Utermöhl, H. (1958). Zur vervollkommnung der quantitativen phytoplankton methodik. Mitteilungen Internationale Vereinigung Theoretische und Angewandte Limnologie 9, 1–38.
Keywords: microbial food-web, dust deposition, phytoplankton, zooplankton, Eastern Mediterranean, mesocosm
Citation: Tsagaraki TM, Herut B, Rahav E, Berman Frank IR, Tsiola A, Tsapakis M, Giannakourou A, Gogou A, Panagiotopoulos C, Violaki K, Psarra S, Lagaria A, Christou ED, Papageorgiou N, Zervoudaki S, Puelles MLFd, Nikolioudakis N, Meador TB, Tanaka T, Pedrotti ML, Krom MD and Pitta P (2017) Atmospheric Deposition Effects on Plankton Communities in the Eastern Mediterranean: A Mesocosm Experimental Approach. Front. Mar. Sci. 4:210. doi: 10.3389/fmars.2017.00210
Received: 22 December 2016; Accepted: 16 June 2017;
Published: 04 July 2017.
Edited by:
Angel Borja, AZTI Pasaia, SpainReviewed by:
Jacob Carstensen, Aarhus University, DenmarkVeljo Kisand, University of Tartu, Estonia
Copyright © 2017 Tsagaraki, Herut, Rahav, Berman Frank, Tsiola, Tsapakis, Giannakourou, Gogou, Panagiotopoulos, Violaki, Psarra, Lagaria, Christou, Papageorgiou, Zervoudaki, Puelles, Nikolioudakis, Meador, Tanaka, Pedrotti, Krom and Pitta. This is an open-access article distributed under the terms of the Creative Commons Attribution License (CC BY). The use, distribution or reproduction in other forums is permitted, provided the original author(s) or licensor are credited and that the original publication in this journal is cited, in accordance with accepted academic practice. No use, distribution or reproduction is permitted which does not comply with these terms.
*Correspondence: Tatiana M. Tsagaraki, tatiana.tsagaraki@uib.no