Diversity and Transcriptional Levels of RuBisCO Form II of Sulfur-Oxidizing γ-Proteobacteria in Coastal-Upwelling Waters with Seasonal Anoxia
 Bárbara Léniz
 Alejandro A. Murillo
 Salvador Ramírez-Flandes
 Osvaldo Ulloa
- Departamento de Oceanografía, Instituto Milenio de Oceanografía, Universidad de Concepción, Concepción, Chile
Seasonal wind-driven upwelling, high primary production in surface waters, and oxygen deficiency in subsurface waters characterize the coastal ecosystem of the subtropical eastern South Pacific (ESP), and shape the nature and dynamics of the microbial community structure and function. We investigated the diversity, abundance, and transcriptional levels of the gene encoding the large subunit form II of the RuBisCO enzyme (cbbM) in the pelagic microbial community at a continental-shelf site off central Chile over 2 years. We focused on cbbM genes affiliated with the sulfur-oxidizing γ-proteobacteria cluster, whose members are known to dominate in oxygen-deficient marine environments and are highly abundant in the study area. Phylogenetic analysis of cbbM sequences suggests the presence of a novel group of chemolithoautotrophs, closely related to the SUP05/ARCTIC96BD-19 clade. Through (RT)-qPCR, we studied the cbbM gene abundance and transcript dynamics over an annual cycle, finding a significantly higher number of cbbM copies per unit volume in months of active upwelling and at depths in which oxygen was scarce or absent. The same temporal pattern was observed at the transcriptional level. We also analyzed the relative expression of key genes for carbon, nitrogen and sulfur cycling in six metatranscriptomic datasets, for two characteristic periods within the annual cycle: the anoxic upwelling and the suboxic downwelling. Our results indicate that coastal waters of the subtropical ESP contain transcriptionally active populations of carbon fixing pelagic bacteria, whose dynamics is controlled, in large part, by fluctuations in oxygen levels. They also suggest that chemolithoautotrophic processes coupled to the sulfur and nitrogen cycles become increasingly important for the carbon economy of marine coastal waters as oxygen concentrations decline.
Introduction
The majority of primary production in the global ocean is carried out by cyanobacteria and photosynthetic eukaryotic algae in the upper ocean (the photic zone), using the Calvin-Benson-Bassham (CBB) cycle for inorganic carbon fixation. The CBB cycle is also used by chemolithoautotrophic bacteria to fix carbon in the dark ocean (Badger and Bek, 2007; Walsh et al., 2009). Thus, the CBB cycle, being one of the six carbon fixation pathways described to date (Berg, 2011; Hügler and Sievert, 2011), is the main carbon fixation mechanism utilized by extant autotrophic organisms (Raven, 2009; Berg, 2011).
The enzyme Ribulose-1,5-bisphosphate carboxylase-oxygenase (RuBisCO) is the key enzyme of the CBB cycle and the most abundant protein in nature (Ellis, 1979). Three molecular forms of bona fide functional RuBisCO, named I, II and III, have been described to be directly involved in the CBB cycle, and are found in cyanobacteria, proteobacteria, some archaea, algae, and plants. The form III has been found exclusively in archaea, and a IV form, also called “RuBisCO-like” protein, has been shown to be functional in the methionine salvage pathway in many organisms (Ellis, 1979; Elsaied and Naganuma, 2001; Alfreider et al., 2003; Madigan and Martinko, 2006; Badger and Bek, 2007; Parry et al., 2007; Tabita et al., 2007a, 2008). RuBisCO form I is found in most of chemo- and photoautotrophic bacteria, cyanobacteria, eukaryotic plankton, algae and plants, it is adapted to aerobic conditions and its role in carbon fixation by planktonic photoautotrophs (expression levels, rates of fixation and diel cycle) has been studied extensively in different aquatic environments (Pichard et al., 1993; Xu and Tabita, 1996; Corredor et al., 2004; Tabita et al., 2007a). Meanwhile, form II presents a low specificity factor s, which is a measure of the ability of the enzyme to discriminate between CO2 and O2 at a given ratio. This implies that form II is adapted to operate in low-O2 and high-CO2 concentration environments (Badger and Bek, 2007; Tabita et al., 2008), but studies on its expression levels and role in dark carbon fixation in natural communities are scarce.
An oceanic environment that presents high pCO2 and low dissolved O2 concentrations for the optimal functioning of the RuBisCO form II enzyme should be the so-called oxygen minimum zones (OMZs; Paulmier et al., 2011). The eastern South Pacific (ESP) is characterized by the presence of a major OMZ as a result of high primary productivity, low ventilation rates, and high biological O2 demand at mid depths (100–400 m) due to high levels of organic matter respiration. These conditions allow the development of permanent anoxic marine zones off Peru and northern Chile (Ulloa et al., 2012) and seasonal oxygen-deficient coastal waters at mid latitudes (~36°–40°S) (Helly and Levin, 2004; Sobarzo et al., 2007; Galán et al., 2009; Ulloa and Pantoja, 2009). These oxygen-deficient waters constitute unique habitats, where organic and inorganic compounds, including sulfur, nitrogen and carbon derivatives, are intensively recycled by microorganisms, mainly through anaerobic metabolic processes (Stevens and Ulloa, 2008; Canfield et al., 2010; Stewart et al., 2012; Ulloa et al., 2012).
Within the microbial community found in oxygen-deficient waters, there is a dominant γ-proteobacteria sulfur-oxidizing group (GSO), associated to a cluster first described by Sunamura et al. (2004) and designated as SUP05. This group of organisms has been identified in the Suiyo seamount hydrothermal plume (Sunamura et al., 2004; Kato et al., 2012), in the water column of the OMZ off northern Chile and Peru (Stevens and Ulloa, 2008; Canfield et al., 2010; Schunck et al., 2013), in the southwest African shelf, in Namibian coast (Lavik et al., 2009), in the seasonally anoxic fjord Saanich Inlet in British Columbia, Canada (Walsh et al., 2009; Zaikova et al., 2010), at a hydrothermal plume in Guaymas Basin, Gulf of California (Anantharaman et al., 2013), in the redoxclines of the central Baltic and Black Sea (Glaubitz et al., 2013), and in the seasonal OMZ off central Chile (Murillo et al., 2014). Phylogenomic analysis suggests that the SUP05 clade is closely related to chemoautotrophic, sulfur-oxidizing gill symbionts of deep-sea clams and mussels (Kuwahara et al., 2007; Roeselers et al., 2010). Genomics studies have determined that SUP05 metagenome harbors a diverse repertoire of genes implicated in the oxidation of reduced sulfur compounds (e.g., H2S, S2, and S°). Furthermore, its metagenome harbors genes associated with the CBB cycle for inorganic carbon fixation, and the gene encoding the RuBisCO form II enzyme, suggesting that the SUP05 cluster would be involved in chemoautotrophic carbon fixation in situ (Walsh et al., 2009; Murillo et al., 2014). On the other hand, inorganic carbon fixation by chemoautotrophic sulfur-oxidizing microorganisms may not only be important in anoxic and oxygen-deficient waters, but also along the oxygenated water column, under the photic zone (>200 m), and within biogeochemical hot spots in the deep ocean (Swan et al., 2011; Mattes et al., 2013). Two representatives of the γ-proteobacteria belonging to the SUP05/ARCTIC96BD-19 cluster were recently isolated, sequenced and proposed as candidate species: “Candidatus Thioglobus singularis” strain PS1. It was isolated from surface waters (5 m) in Puget Sound and is a member of the subclade ARCTIC96BD-19, closely related to SUP05 but associated to more oxygenated waters (Marshall and Morris, 2015). On the other hand, “Candidatus Thioglobus autotrophica” strain EF1, which was isolated from a redox gradient (60 m) in Effingham Inlet, British Columbia, Canada, is a member of the SUP05 subclade (Shah and Morris, 2015).
Our study area, Station 18, is 20 km off the coast of central Chile ~36°S, over the continental shelf (40 km East to West in extension), where a combination of meteorological and oceanographic factors allows the generation of seasonal coastal upwelling, with low O2 conditions, even anoxia, at mid depths (40–93 m bottom) (Muñoz et al., 2004; Sobarzo, 2004; Fuenzalida et al., 2009; Murillo et al., 2014). At this station, high rates of chemosynthetic production have been observed during the austral spring-summer periods (Farías et al., 2009), however, the organisms responsible for this production have not been identified. But, considering that both SUP05 and ARCTIC96BD-19 have been recognized as dominant members of the microbial community in oxygen-deficient waters (Stevens and Ulloa, 2008; Lavik et al., 2009; Walsh et al., 2009; Stewart et al., 2012; Wright et al., 2012; Glaubitz et al., 2013; Schunck et al., 2013), as well as in this particular seasonal OMZ (Murillo et al., 2014), we hypothesized that this group of γ-proteobacteria is an important component of the dark carbon fixation community in these seasonal upwelling waters, coupling three major oceanic cycles: (1) The nitrogen cycle, through the utilization of as electron acceptor; (2) The sulfur cycle, through oxidation of reduced sulfur species (e.g., H2S, S2 and S°) as electron donors and the energy derived of the reductive power production and electron flow canalized to (3) The carbon cycle, through the inorganic carbon fixation via the RuBisCO enzyme form II.
The principal aim of this study was therefore to determine the seasonal dynamics of the diversity, abundance, and transcriptional levels of the cbbM gene, coding the RuBisCO enzyme form II, of the sulfur-oxidizing γ-proteobacteria community to improve our understanding of the potential contribution of this numerical dominant group of organisms to the dark carbon cycle in the coastal upwelling zone off central Chile.
Materials and Methods
Study Site and Sample Collection
The study was carried out at a single station (Station 18) on the continental shelf off Central Chile (36°27.86′S, 73°10.12′W), 20 km offshore (Figure 1). This sampling station is part of the COPAS Time-Series Program (http://oceanografia.udec.cl/).
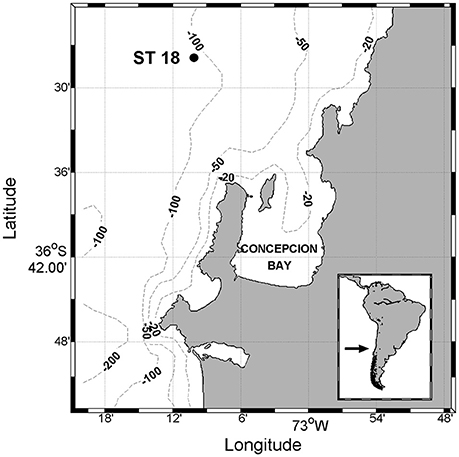
Figure 1. Study area, Time-Series Station 18 (36°27.86′S–73°10.12′W), located at 20 nautical miles from Dichato, Biobío region, Chile.
Discrete seawater samples were collected monthly at St. 18 at three water-column depths (5, 50 and 85 m) along the O2 gradient, from July 2010 to May 2011, onboard the RV Kay-Kay II. Temperature, salinity and O2 profiles were recorded from near the bottom (93 m depth) to the surface using a SeaBird 25 conductivity-temperature depth (CTD) profiler and SeaBird SB43 O2 sensor. Water samples for DNA, RNA, nutrients, chlorophyll a and flow cytometry were collected using 10-L Niskin bottles.
The water samples for DNA and RNA extraction were immediately pre-filtered onboard, first through a 20-μm mesh and then through a 1.6-μm GF/A filter (47 mm diameter APFA04700, Millipore), using a peristaltic pump (Cole-Parmer 7520-67 Masterflex). For DNA extraction, 10 L of seawater were filtered. The picoplanktonic community was collected onto a 0.2 μm Sterivex filter (SVGP01050, Millipore), which was filled with lysis buffer (50 mM Tris•HCl, 40 mM EDTA, and 0.73 M sucrose). Seawater samples for RNA extraction were filtered during 10 min, after which the filtrate volume was recorded. The picoplanktonic community was collected in a 0.2 μm Durapore filter (25 mm diameter, Millipore). Filters were immediately transferred to 2 mL cryovials containing 300 μL RNAlater (RNA Stabilization Reagent, QIAGEN).
Nutrients were measured in the laboratory, using standard methods (Grasshoff et al., 1999, modified from Strickland and Parson, 1972), ammonium was determined according to the fluorometric method of Holmes et al. (1999), and chlorophyll a with the method described by Arar and Collins (1997). Microbial community abundance was measured by flow cytometry. For this, 1350 μL of seawater was fixed with 150 μL glutaraldehyde (0.1% final concentration) and frozen until analysis. Subsamples of 500–300 μL were processed on a FACSCalibur flow cytometer with an iron-argon laser of 488 nm (Becton Dickinson), as follow: 500 μl of each sample were analyzed for auto-fluorescent cells detection during 5 min. with an average flux of 35 μl/min, using Forward-scattered light and Side-scattered light (FSC-SCC) parameters to estimate the cell size and the FL3 (670/LP nm) parameter for Chlorophyll-a detection and the FL2 (585/42 nm) parameter for phycoerythrin detection. The non-auto fluorescent community was analyzed through SYBR Green staining. 300 μl of sample were stained during 15 min in the darkness and then run during 3 min with a flux of 16 μL/min, FSC-SSC parameters were also used to estimate cellular size and the FL1 parameter (530/30 nm) to visualize the stained cells.
Nucleic Acids Extraction and cDNA Synthesis
Genomic DNA was extracted using a modified protocol from Galán et al. (2012). Briefly, 2 mg of lyzozyme in 40 μL lysis buffer was added to each filter and cells were lysed for 45 min at 37°C. Following the lysis, 100 μL of proteinase K and 100 μl SDS 20% were added to each filter and the sample was digested at 50°C for 2 h. The lysate was removed, and each filter was incubated with 1 mL of lysis buffer at 55°C for an additional 15 min. The total pooled lysates were then extracted, once with phenol-chloroform-isoamyl alcohol (25:24:1; pH 8) and once with chloroform-isoamyl alcohol (24:1), and samples were concentrated by isopropanol precipitation.
The RNA extraction was carried out according to a modification of the mirVana miRNA Isolation kit (Ambion®, Life technologies). Samples were thawed on ice and RNAlater reagent was removed and discarded. The cell lysis was performed by adding 100 μL zirconium beads (OPS diagnostics, LLC) and 750 μL Lysis/Binding buffer. After processing the samples in a bead beater, total RNA was extracted according to the manufacturer's protocol. This briefly consists in phase separation with acid-phenol-chloroform, the RNA is then washed within a column, from which is separated from the sample and eluted with elution solution (Ambion®, Life technologies).
RNA was purified from any DNA contamination using the TURBO DNA-free kit (Ambion®, Life technologies). It consists of incubation with DNAse TURBO enzyme at 37°C for 30 min and further addition of DNA inactivation reagent. Possible remaining DNA was monitored by PCR amplification of RNA aliquots. cDNA synthesis was carried out according to the Sensiscript Reverse Transcription kit (Qiagen). Initial RNA concentration was standardized to 20 ng/μL, by dilution with RNAses-free water, to a final volume of 12 μL. After the dilutions were set, the manufacturers protocol was followed, with the preparation of two master mixes, one containing the Sensiscript enzyme, and the other without it (control). The reaction consisted of 8 μL of master mix and 12 μL of RNA template. The reverse transcription was performed with incubation at 37°C for 1 h.
DNA, RNA, and cDNA concentrations were quantified in a NanoDrop ND 1000 spectrophotometer.
Degenerate Primers, PCR Amplification, Cloning, and Phylogenetic Tree Construction
A pair of degenerate primers (cbbM-R and cbbM-F; Table 1) was designed to assess the diversity of cbbM genes of putative GSO off central Chile present during two contrasting periods. Primer design was carried out by the alignment of cbbM sequences of ESP GSO provided by previous metagenomic data: Contig14992, (GenBank accession number KJ783409, Murillo et al., 2014), Candidatus Ruthia magnifica (CP000488), Candidatus Vesicomyosocius okutanii (AP009247) and uncultured SUP05 bacterium from Saanich Inlet (ACX30513). Primers were designed with the PRIMER 3 software (v. 0.4.0) and synthesized at IDT (Integrated DNA Technologies, USA).
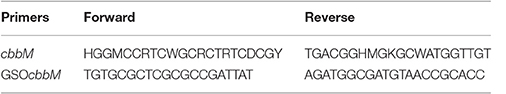
Table 1. Sequences of the designed degenerated (cbbM) and specific (GSOcbbM) primers.
PCR mixtures were prepared in a total volume of 25 μL containing 14.25 μL of nuclease free water, 5 μL of 5x green GoTaq Flexi buffer, 2 μL of 25 mM MgCL2, 0.5 μL of 10 mM dNTP, 1 μL of 10 μM forward primer, 1 μL of 10 μM reverse primer, 0.25 μL of 5 u/μL GoTaq® DNA Polymerase (Promega) and 1 μL of template. Optimal thermal conditions for PCR amplification were as follows: initial denaturation at 95°C for 3 min, followed by 11 cycles with an annealing temperature starting at 65°C and decreasing by 0.5°C per cycle, reaching 60°C. Finally, 19 cycles of annealing at 60°C was performed. Denaturation and elongation remained at 95 and 72°C, for 30 s and 1 min, respectively, in every cycle and a final elongation step was performed at 72°C for 5 min. PCR products were visualized on a 2% agarose gel, from which DNA was then purified (Nucleic Acid and Protein Purification kit, Macherey-Nagel) and cloned, according to the pGEM®-T easy Vector System kit (Promega). Two samples were selected, for contrasting environmental periods (March through July, representing the transition from austral summer to winter conditions). Cloning was confirmed by PCR amplification with pucM13F and pucM13R primers. Clones were sent for sequencing at Macrogen Inc. (Geumcheon-qu, Seoul, Rep. of South Korea).
In order to evaluate the cbbM diversity at the study site, a phylogenetic tree was built using 75 clone sequences obtained using degenerated primers and grouped by similarity at 98% generating 8 OTU groups (GenBank: KM275794-KM275837), these cbbM sequences were then, compared with the cbbM GSO from Contig1499281 and 81 sequences comprising the four forms (I, II, III, and IV-like) of RubisCO, plus 45 sequences from the GOS expedition described by Tabita et al. (2007b) and Tabita et al. (2008), together with 42 selected sequences of the form II that cover the diversity of chemolithoautotrophic representatives (Table S2). The amino acid sequences were aligned using MUSCLE 3.6. (Edgar, 2004) and the phylogenetic inference was ran in the software tool Bosque (Ramírez-Flandes and Ulloa, 2008) using maximum likelihood implemented in PhyML (Guindon and Gascuel, 2003) and the WAG substitution model (Whelan and Goldman, 2001).
PCR-Amplification with Specific Primers
A pair of specific primers (GSOcbbM-R and GSOcbbM-F; Table 1) was designed for the amplification and quantification of the RuBisCO form II (cbbM) gene of the GSO group off central Chile. The design was carried out by the alignment of the cbbM GSO sequence, encoded in Contig14992 and the sequences of the clones obtained with the degenerated primers. Primers were designed in PRIMER 3 software (v. 0.4.0) and synthesized at IDT.
PCR mixtures were prepared in a total volume of 25 μL, as described above. PCR was performed according to the following thermal cycling: initial denaturation at 94°C, for 5 min, followed by 29 cycles of denaturation at 94°C for 1 min, annealing at 61.6°C for 1 min, and final elongation at 72°C, for 1 min and 30 s. PCR products were always visualized on an agarose gel (1%) stained with GelRed™. A clone library (promega) was performed to test primer specificity; randomly selected clones of the PCR amplicon (n = 100) were sequenced to verify that the primers displayed specificity for cbbM. Seventy five clones contained the targeted sequence, the remaining 15 sequences were divide in 12 low-quality sequences pulled out of the analysis and 3 sequences with low identity to cbbM, low bit-score and high E-value, that were also excluded from the analysis.
Quantitative PCR Amplification
Quantitative PCR (qPCR) was performed to assess cbbM abundance of the putative GSO, using DNA as a target. Also, cbbM transcripts abundance was evaluated using cDNA as a target.
Standard curve preparation was carried out through standard dilution series, using a target-specific amplicon, obtained from clone libraries of the sample MLC2285m (1st March, 85 m). For this, the concentration of the PCR product was determined in a NanoDrop ND 1000 spectrophotometer and transformed to numbers of copies per μL. A dilution of the PCR product was preformed to 4 × 10⁷ copies/μL, corresponding to the stock solution, from which a serial dilution is carried out (dilution factor 1:10), with a total of seven dilutions (4 × 10⁷, 4 × 10⁶, 4 × 10⁵, 4 × 10⁴, 4 × 10³, 400, and 40 copies/μL). Negative control corresponds to nuclease free water.
Quantitative PCR was conducted in a StepOnePlus thermocycler (Applied Biosystems) and amplification was detected through the SYBR Green I method. Quantitative PCR mixtures were prepared in a total volume of 20 μL containing 1X of buffer with polymerase enzyme, 0.8 μM of GSOcbbM reverse primer, 0.8 μM of GSOcbbM forward primer, 5.8 μL of nuclease free water and 1 μL of 15 ng/μL template. Every sample were analyzed in triplicate. qPCR was performed according to the following thermal cycling: initial denaturation at 95°C, for 10 min, followed by 30 cycles of denaturation at 94°C for 1 min, annealing at 61.6°C for 1 min, and final elongation at 72°C, for 1 min and 30 s. Standard curve for DNA qPCR showed a slope of −3,5401x + 31,239 along with a R2 = 0.997. All values were estimated above a threshold of ΔRn = 0.021. Standard curve for cDNA qPCR showed a slope of −3,6059x + 35,581 with a R2 = 0.998. All values were estimated above a threshold of ΔRn = 0.400 (Figure S3).
Final data were exported from the thermocycler into the StepOne Software 2.2, as number of copies per μL. Then, the data were normalized by the volume of filtered water, and presented finally as number of copies per mL.
Statistical Analysis
To establish the relationship between the factors of seasonality and depth with cbbM abundance and transcription, two-ways analyses of variance was performed (ANOVA) with significance defined as p < 0.05. Spearman correlations were calculated to determine the relationship between biological variables (cbbM gene and cbbM transcript abundance) and environmental variables (temperature, O2, , , , total bacterial abundance and Chlorophyll a), with significance defined as p < 0.05. Analyses were performed in STATISTICA v.10 Software.
Metatranscriptomics Analysis
Metatranscriptomic datasets for Station 18 were retrieved from iMicrobe (formerly CAMERA) under accession number CAM_P_0000692. The sequences where aligned against the Kegg protein database using Diamond (Buchfink et al., 2015). The Kegg protein database was constructed from a subset of protein sequences with assigned Kegg Orthology (KO). To count enzymes given the EC number, all the corresponding KOs were considered, using the same Kegg database, which contains tables with assignation of Kegg protein sequences to KO and then EC, when it is the case. The relative expression for each gene analyzed is expressed as; 100*(Ni/Nt) = X, with {X|0.0 < X < 100}. Where Ni is the number of assigned sequences to a given gene and Nt is total number of expressed sequences for the given metatranscriptome.
Results
Environmental Conditions
The study area is characterized by seasonal coastal upwelling and the generation of seasonal O2 minimum and anoxia. This can be observed in the vertical distribution of hydrographic conditions along the study period (O2, , , bacterial abundance [BA] and ; Figure 2). Vertical distribution of O2 concentration (Figure 2A) displays a marked seasonality, and during austral winter (June 21st to September 21st), O2 dropped to <50 μM at 50 m depth, reaching a minimum value of 18 μM at 85 m. Meanwhile, during austral summer (December 21st to March 21st), the oxycline is shallower, ~15–20 m depth, and O2 concentration dropped sharply below 30 m, reaching undetectable levels at deeper depths. During these months, the microbial abundance showed their maximum values along the water column, especially in the subsurface layers and bottom waters, as measured by flow cytometry (see Section Materials and Methods, Figure 2B), with a maximum of 4.42 × 10⁶ cells*mL−1 at 5 m, 1.54 × 10⁶ cells*mL−1 at 50 m, and 1.84 × 10⁶ cells*mL−1 at 85 m.
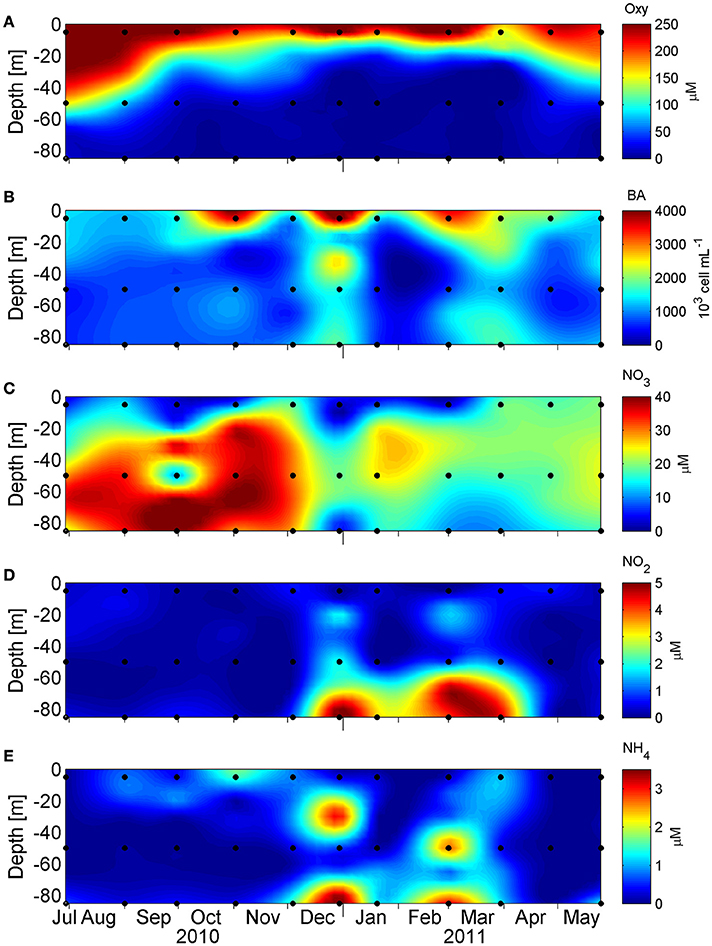
Figure 2. Vertical distribution of (A) dissolved oxygen concentration (μM), (B) microbial abundance (103 cells mL−1), (C) nitrate concentration (μM), (D) nitrite concentration (μM) and (E) ammonium concentration (μM) in 1 year long, at St. 18. The black dots denote 5, 50, and 85 m where the DNA and RNA samples were taken.
In this hydrographic context, the nitrogen species nitrate (), nitrite () and ammonium () also show a seasonal variability with a marked decline in nitrate concentration during the upwelling period, which is more pronounced at 85 m, with a concomitant accumulation of nitrite at bottom depths (Figures 2C,D). The reduction of nitrate to nitrite (the first step in denitrification) is coherent with the utilization of nitrate as alternative electron acceptor, with the accumulation of nitrite being a signature of functional anoxia (Thamdrup et al., 2012). The accumulation of nitrite co-occurred with an accumulation of ammonium at 85 m, but also at intermediate depths (Figure 2E), a relationship that was supported by a high correlation value (r = 0.735 p < 0.05, Table S3), consistent with an active nitrogen cycling in these low-oxygen ocean areas (Lam and Kuypers, 2011).
RuBisCO Form II Diversity
With the set of primers designed to analyze the cbbM diversity, we were able to recover 36 and 39 bona fide clone sequences from 50 to 85 m, respectively. These 75 sequences were grouped by similarity at 98%, and 8 OTU groups were generated and used for further analysis. A phylogenetic inference was constructed comparing our sequences along with 81 sequences for the four forms (I, II, III, and IV-like) of RuBisCO and 45 sequences from the GOS expedition described by Tabita et al. (2007b) and Tabita et al. (2008), together with 42 selected sequences of the form II that cover the diversity of chemolithoautotrophic representatives. Consistently, the 8 OTUs were associated with the RuBisCO form II sequences and 7 of them clustered together, along with the sequence cbbM GSO from Contig14992 (ESP_GSO), described in Murillo et al. (2014) (Figure 3B; bootstrap of 100%). This cluster was named ESSP GSO-St18 (Eastern Subtropical South Pacific GSO—Station. 18) and was significantly separated (bootstrap = 99%) from its closest relatives, the sulfur-oxidizing γ-proteobacteria clade known as SUP05/ARCTIC96BD-19 (Walsh et al., 2009; Canfield et al., 2010; Anantharaman et al., 2013; Glaubitz et al., 2013; Marshall and Morris, 2013), formed by the sequences of SUP05 from Saanich Inlet, symbiont species Candidatus Vesicomyosocius okutanii and Candidatus Ruthia magnifica, Candidatus Thioglobus autotrophicus, four uncultured bacteria and two members of ARCTIC96BD-19 subclade. The remaining OTU was associated to the ARCTIC96BD-19 sequences.
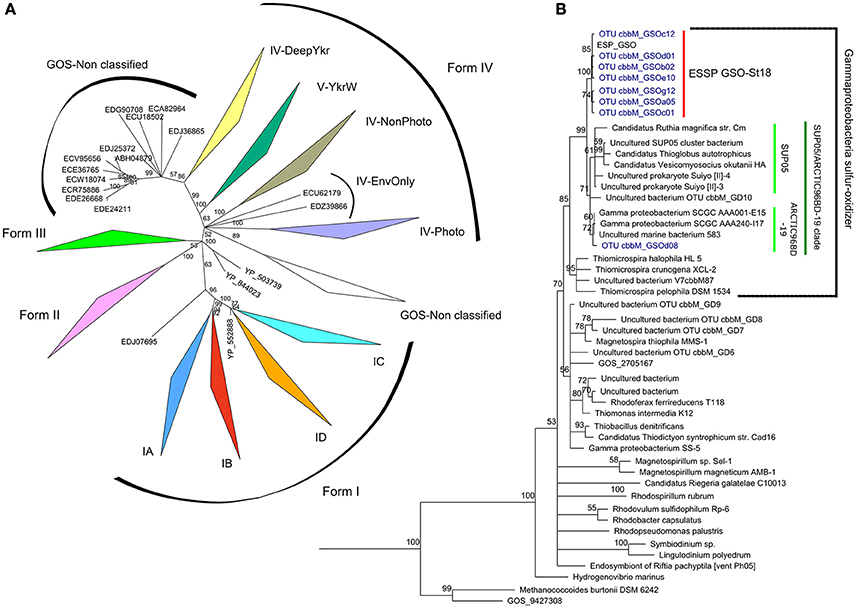
Figure 3. Maximum-likelihood phylogenetic tree of RuBisCO. Panel (A) shows a phylogenetic tree based on aminoacid sequences from the four forms of RuBisCO enzyme described until today, the OTU sequences under study in this work were analyzed against this RuBisCO “database” and they could be clearly separated and structured in the branch of form II. Panel (B) shows the subtree for the form II (CbbM) of RuBisCO and the classification of the OTU sequences obtained in this study, in blue, forming a separated group denoted ESSP GSO-St18 and associated to the sequence from a previous metagenomics analysis (cbbM, Contig14992) designed ESP_GSO, in black. One of the OTU sequence (GSOd08) is associated to the ARCTIC96BD-19 sequences. The tree was inferred using maximum likelihood implemented in PhyML. Bootstrap values higher than 50% are shown.
RuBisCO Form II Abundance
Analysis by qPCR amplification of cbbM gene of the ESSP-ST18 cluster (Figure 4), showed clear evidence of higher abundance during the austral spring-summer, especially at 85 m, with a maximum of 199 ± 19 × 103 copies mL−1 in December. Conversely, the minimum values of cbbM abundance, at 85 m, were present in July (116.7 ± 39.7 copies mL−1). On the other hand, at 5 and 50 m, there was less variation during the annual cycle. At 50 m, despite the low fluctuation, there was a clear maximum in summer, with 67 ± 28 × 103 copies per mL. Although the lower variation and the minimum values (5.6 ± 2.5 copies mL−1 in July) were observed at 5 m, the values at 5 m were at least two orders of magnitude less than at 50 and 85 m of depth in all samples.
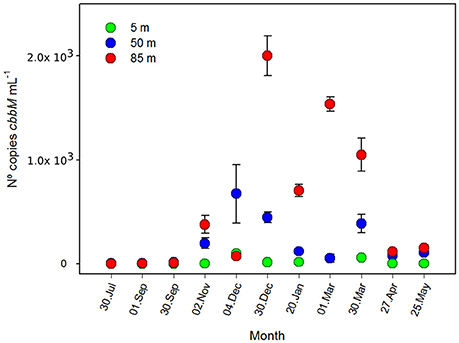
Figure 4. Number of copies of cbbM gene during an annual cycle (n° copies mL−1 ± standard deviation) at 5, 50, and 85 m of depth, St. 18.
An ANOVA test indicated that the differences between both depths and months were significant (Table S1, F = 8.432; p = 0.002; F = 2.380; p = 0.047, respectively). Spearman correlation analysis showed a significant negative relationship between cbbM abundance and O2 concentration (Table S3, r = −0.804; p < 0.05). Thus, cbbM abundance fluctuates during the annual cycle, increasing with the decrease in O2 concentrations.
The overall microbial community abundance was also maximal during the upwelling season (austral spring-summer; Figure 5). With the intention of exploring the importance of the ESSP-ST18 cluster possessing the cbbM gene in the total microbial community, we normalized cbbM abundance with the microbial community abundance measured by flow cytometry (Figure 6), assuming one copy of cbbM gene per cell of ESSP-ST18 members (Tourova and Spiridonova, 2009). Then we used this normalization as a proxy to estimate the relative contribution of this group to the microbial community, finding the highest percentages (10 to 16%) between December and March, at 85 meters of depth. By contrast, the lower percentage of contribution was in July, at 5 m.
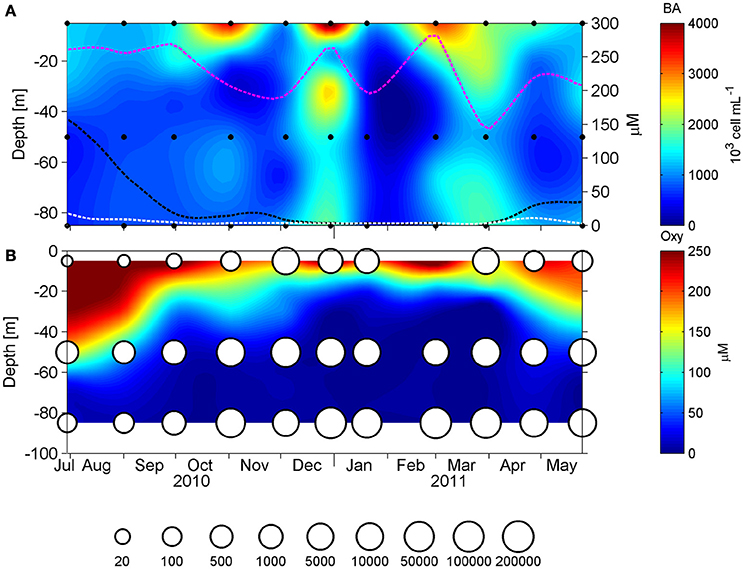
Figure 5. Panel (A) shows the vertical distribution of the microbial abundance (103 cells mL−1), measured by flow cytometry and in doted lines the fluctuation of oxygen during the annual cycle at 5 (pink), 50 (black), and 85 m (white). Panel (B) shows the dissolved oxygen concentration (μM) with cbbM abundance (N° copies mL−1) presented as bubbles in a logarithmic scale, in 1 year long at St. 18.
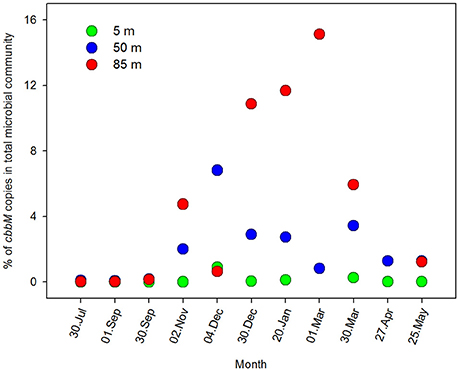
Figure 6. Percentage of N° of copies cbbM mL−1 in the total microbial community. The N° of copies for each depth were normalized with the microbial abundance, measured by flow cytometry, during an annual cycle at; 5, 50, and 85 m of depth in Station 18.
RuBisCO Form II Transcription
To determine the transcription levels of cbbM of the ESSP-ST18 cluster, qPCR was performed with cDNA as a target. Results (Figure 7) showed a considerable peak during the austral summer, and maximum values at 85 m (20.1 ± 3.1 copies mL−1 in December). However, cbbM transcript values were two to three orders of magnitude lower than cbbM gene abundance. Although the patterns were similar for both variables (Figures 4, 7), it was clear that they were not highly correlated (Table S3, r = 0.440; p < 0.05). Thus, the RuBisCO enzyme did not appear to be transcribed by every member of the ESSP-ST18 group. A maximum value at 5 m during March survey (12.9 ± 1.39 copies per mL) is highlighted and cannot be explained by environmental factors or biological variables, being probably an effect of contamination or manipulation error. As such, it was decided to keep it outside of the statistical analyses.
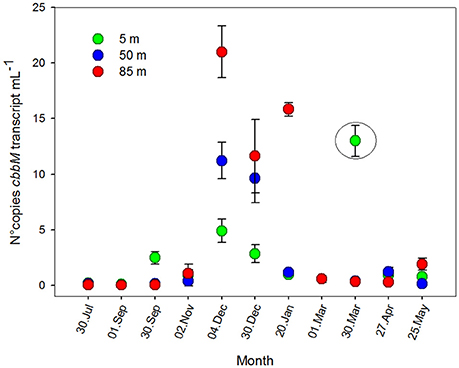
Figure 7. RuBisCO form II transcription, presented as number of copies of cbbM transcripts mL−1 ± standard deviation, during an annual cycle, at 5, 50, and 85 m of depth, St. 18.
An ANOVA test indicated that the differences between months were significant (Table S2, F = 6.133; p = 0.001), while the differences among depths were not (Table S2, F = 1.921; p = 0.183). However, cbbM transcript abundance showed significant differences between depths during austral spring-summer months (November, December and January; F = 9.609; p = 0.029). Spearman correlation analysis did not show an important relation between cbbM transcript abundance and O2 concentration (Table S3, r = −0.231; p > 0.05) or any environmental variables, suggesting a non-linear relationship between cbbM transcript and the variables analyzed in this study. However, there was a clear seasonal pattern in its distribution (Figure 7).
Metatranscriptomics: Potential Coupling of the Carbon, Nitrogen, and Sulfur Cycles
Within the annual cycle explored, we examined six metatranscriptomes for the same depths analyzed above, and for two contrasting periods: three corresponded to downwelling (August 2010; 5, 50 and 85 m) and three to upwelling (March 2011; 5, 50, 85 m). These data allowed us to assess the community expression of key genes, not only for carbon fixation, but also for the nitrogen and sulfur cycles, and to explore the coupling of these cycles by chemolithoautotrophs in this seasonal OMZ. We analyze the percentage of relative expression of the key functions described for the six pathways of inorganic carbon fixation known to date (see Hügler and Sievert, 2011, for a review) in each metatranscriptome and compared them among depths and periods (Figure 8). From all the functions evaluated, only three appeared with a relevant relative expression (>0.1), corresponding to: the enzyme Ribulose 1,5-bisphosphate carboxylase from the CBB cycle and the enzymes Pyruvate synthase and Pyruvate:water dikinase, which participate in several cellular pathways, but together with the enzyme PEP carboxylase, have been related to the dicarboxylate/4-hydroxybutyrate (DC/4-HB) cycle when they act in a concerted way to convert acetyl-CoA to oxaloacetate. Since sequence similarity based inference was through KEGG Orthology (KO), the sequences were associated to the best hit against a KO identifiers (K numbers) and cannot distinguish, in the case of RuBisCO, among the different forms of the large subunit (I, II, or III). Therefore, the results presented in Figure 8 for RuBisCO relative expression are a summation of these forms. Considering the above information, the high levels of expression for RuBisCO at 5 m for both upwelling and downwelling periods are related to the form I of the enzyme and their coding gene cbbL (or also rbcL), associated to a great diversity of photoautotrophs, while at 85 m during upwelling the 82% of the sequences are associated to the Gamma sulfur-oxidizers (GSO) group (Figure 9). The GSO group considered in this work for the assignation of sequences is formed by: SUP05, the symbiont species Candidatus Vesicomyosocius okutanii and Candidatus Ruthia magnifica, Candidatus Thioglobus autotrophicus, Candidatus Thiglobus singularis, members of ARCTIC96BD-19 and thiotrophic symbionts of diverse hydrothermal vent and deep fauna (Table S4). The above was confirmed when extracting the expressed sequences associated to the GSO group for cbbM, rpoC (RNA polymerase subunit beta) and groEL (molecular chaperone), the latter two used as internal controls of relative expression, which showed that the expression of cbbM genes related to GSO group was only relevant at the anoxic depth (Figure 8 inset).
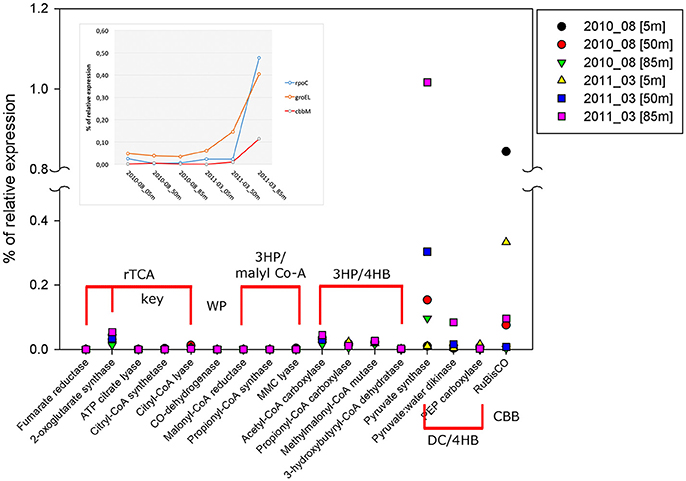
Figure 8. Percentage of relative expression, from metatranscriptomic data, for the key and related genes of the six pathways of carbon fixation known to date: The reductive tricarboxylic acid (rTCA) cycle; the reductive acetyl-CoA or Wood-Ljungdahl (WL) pathway; the 3-hydroxypropionate (3-HP) bicycle; the 3-hydroxypropionate/4- hydroxybutyrate (3-HP/4-HB); the dicarboxylate/4-hydroxybutyrate (DC/4-HB) and Calvin-Benson-Bassham (CBB) cycle. The inset shows the percentage of relative expression of groEL, rpoC, and cbbM from each metatranscriptom analyzed, only the sequences associated to the GSO group were plotted. Both groEL and rpoC are used as internal controls of relative expression for each dataset.
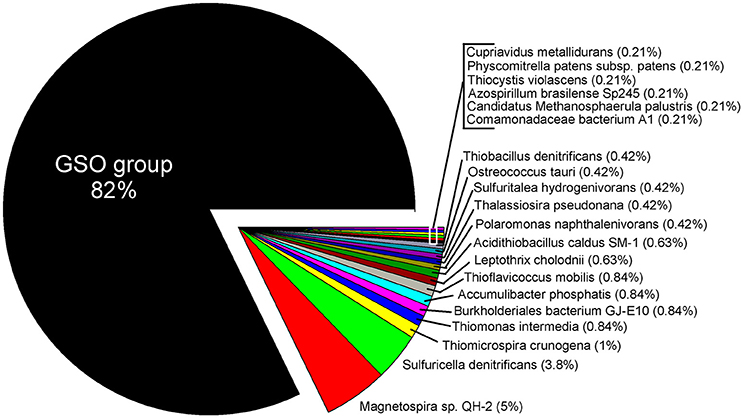
Figure 9. Taxonomic assignation of the expressed sequences for RuBisCO at 85 m during upwelling (March 2011). The taxonomy was based in the KEGG Orthology (KO) database and shows a clear dominance of transcripts associated to the GSO group.
In the case of sulfur and nitrogen cycling coupled to carbon fixation, we evaluate the in situ expression of key genes for chemolithoautotrophic metabolism proposed for the GSO group in the study area by Murillo et al. (2014). Figure 10 shows the percentage of relative expression of the different steps for the oxidation of reduced-sulfur compounds, with nitrate as electron acceptor for the generation of reducing power and ATP. All the pathways related to sulfur cycling showed the maximum expression at 85 m in the upwelling season (March 2011, Figures 10A,B), being the pathways for utilization of elemental sulfur (DsrAB) and sulfite (AprA) the most highly expressed and one order of magnitude higher than the thiosulfate oxidation (sox) genes (Figure 10A). As for RuBisCO, for each pathway we selected a key gene and analyzed the taxonomic composition of the sequences associated along with the percentage of relative expression for the three depths under study (Tables 2, 3); for the sulfur pathways the transcripts were dominated at 85 and 50 m by sequences associated to the GSO group of bacteria (Table 2).
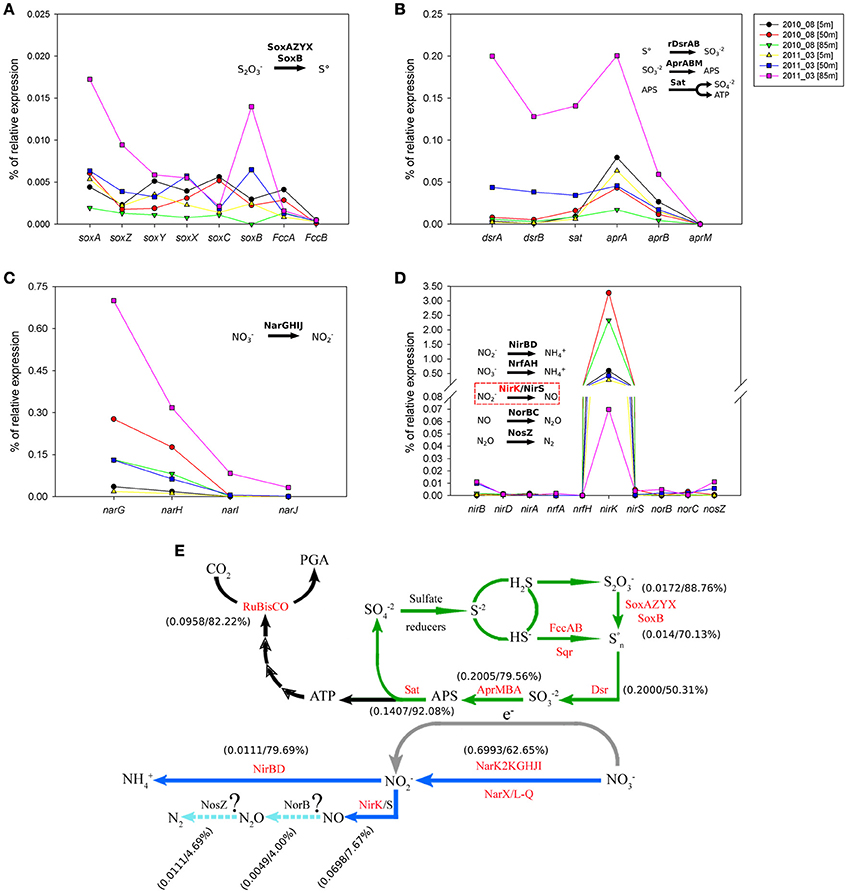
Figure 10. Percentage of relative expression for key genes of the sulfur and nitrogen cycles that could be coupled to carbon fixation via RuBisCO in the chemolithoautotrophic metabolisms of the OMZ. Panel (A) shows the expression of the sulfur oxidation system (sox) genes. Panel (B) shows the expression of the reverse dissimilatory sulfite reductase (rdsr) pathway, the adenosine-5′-phosphosulfate reductase (apr) pathway and the ATP sulfurylase (sat) cysN gene. Panel (C) shows the expression of nitrate reductase gene cluster and Panel (D) shows the expression of different pathways for the utilization of nitrite; nitrite reductase nirBD genes (ammonium formation); nitrite reductase formate-dependent nrfAH genes (ammonium formation); nitrite reductase nirK/nirS gene; nitric oxide reductase norBC genes and the nitrous oxide reductase nosZ gene. Finally, panel (E) integrates the information of the key genes presented in panels (A–D), into previously proposed coupling of the carbon, sulfur and nitrogen cycles in the OMZ by the GSO group (based in metagenomics analysis), modified from Murillo et al. (2014), in which as been included the relative expression of key genes and the percentage of sequences expressed that associate to the GSO group for each given gene. In the case of the gene operons, the data presented correspond to the relative expression of genes: soxA, rdsrA, aprA, narG, and nirB.
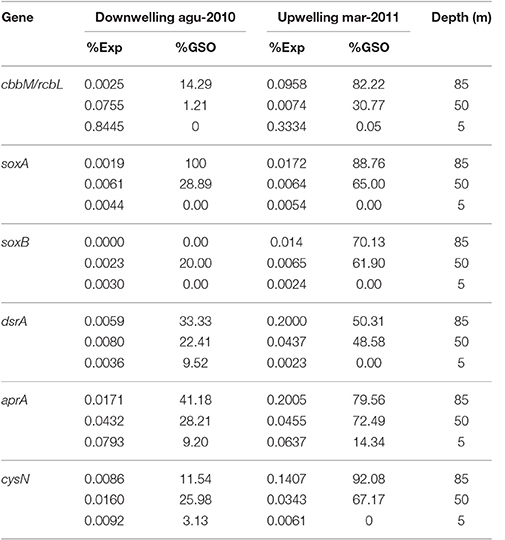
Table 2. Percentage of relative expression for key genes in carbon and sulfur cycles and their taxonomic affiliation to GSO group.
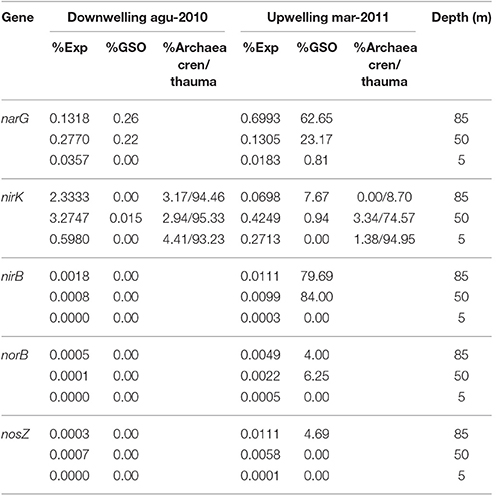
Table 3. Percentage of relative expression for key genes in nitrogen cycle and their taxonomic affiliation to GSO group.
Regarding nitrogen cycling, high transcription levels of the nitrate reductase gene cluster (narGHIJ, Figure 10C) were observed, coherent with the utilization of nitrate as alternative electron acceptor in these low-oxygen, even anoxic, areas of the ocean. Although the expression is still dominated by the GSO group at 85 m, with 62.65% of the sequences, at 50 m takes second place with 23.17% of the expressed sequences, being overtaken by Nitrospina sp. with 46% of the expressed sequences (Figure S1). This result shows that there is a great diversity of organisms carrying out this central pathway at the OMZs. Finally, the expression of functions for the utilization of nitrite shows that nirK was the only relevant gene being observed to be expressed (Figure 10D). However, it did not follow the expression pattern of the other genes, having low expression levels at 85 m during upwelling and the highest relative expression at 50 and 80 m during downwelling, even two orders of magnitude higher than the other pathways analyzed (Table 3). From the few sequences expressed for nirK at 85 m during upwelling, 7.67% were associated to GSO organisms, 9.21% to Thaumarchaea, 10.74% to Nitrospina sp. SCGC_AAA799_C22, 10.74% to an uncultured bacterium, 9.46% to the Alphaproteobacterium Phenylobacterium zucineu, and 3.32% to Nitrosospira sp. NpAV (Figure S2). The rest of the sequences were divided among a wide variety of bacterial genera (data not shown). For the case of the 50 m metatrascriptome during upwelling, and the 85 and 50 m metatranscriptomes during downwelling, archaea dominated the community expression of nirK gene, with a 79.19, 99.79, and 99.82%, respectively. The expression of the nirBD operon was quite low, with only the nirB gene being detected (Figure 10D), but the sequences expressed were dominated by the GSO group at 85 and 50 m with a 79.69 and 84%, respectively. Meanwhile, the genes encoding the enzymes for nitrous oxide (N2O) production norB and molecular nitrogen (N2) nosZ showed also a very low expression level, but for both genes the sequences expressed showed only a 4.0 and 4.69% associated to the GSO group. Figure 10E shows a summary of proposed reactions for the coupling of carbon, sulfur and nitrogen cycles at the OMZ by chemolithoautotrophs, with the percentage of relative expression and taxonomic association to the GSO group for each key gene analyzed in this work (figure modified from Murillo et al., 2014).
Discussion
The continental-shelf waters off central Chile show strong seasonal variations in O2 concentration, with the presence of essentially anoxic bottom waters during the austral spring and summer seasons (Figure 2A), evidenced by the accumulation of nitrite () at 80 m depth (Figure 2D). Studies on molecular taxonomy have indicated that sulfur-oxidizing γ-proteobacteria of the SUP05/ARCTIC96BD-19 clade dominate microbial communities present in oxygen-deficient marine pelagic systems (Stevens and Ulloa, 2008; Lavik et al., 2009; Walsh et al., 2009; Stewart et al., 2012; Wright et al., 2012; Glaubitz et al., 2013; Schunck et al., 2013). Moreover, metagenomic studies of members of this clade have revealed that they have the potential to fix inorganic carbon through the CBB cycle (Walsh et al., 2009; Swan et al., 2011; Murillo et al., 2014). Here, we have assessed the diversity, abundance and transcriptional levels of the cbbM gene and other key genes involved in the sulfur and nitrogen cycles, cycles that have been proposed to be coupled by this group of sulfur-oxidizing γ-proteobacteria. We wanted to investigate the potential relevance of these bacteria in the carbon cycling of coastal waters, considering their high abundance (Murillo et al., 2014), as well as the reported significant rates of dark carbon fixation in the study area, of 0.16 to 117 mg C m−3 d−1 in the oxycline and bottom waters, during the upwelling-favorable periods (Farías et al., 2009).
Results from the cbbM phylogenetic analysis (Figure 3) suggest the presence of a new group of chemolithoautotrophs in the Chilean coastal system (named ESSP GSO-St18), whose closest relatives appear to be members of the SUP05/ARCTIC96BD-19 cluster. The discovery of this new cbbM group relied on the use of new degenerated PCR primers, which were designed based on new metagenomic data from the same study site (Murillo et al., 2014). An in silico analysis showed that the previously published primers of Elsaied and Naganuma (2001) and Alfreider et al. (2003) were not adequate for the amplification of the cbbM gene present in this group of γ-proteobacteria that thrive off the coast of central Chile.
To explore the gene copy number and the transcription levels of this new cbbM-type (ESSP GSO-St18), we targeted it with specific qPCR primers (Table 1). Results showed a high abundance of the gene (Figure 4), with maximum values in the order of 2 × 10⁵ copies per mL at depths where the lowest O2 concentrations were observed (85 m; Figures 2A, 5A). Moreover, the highest abundances were always found during the austral spring-summer months in the upwelling favorable period. Assuming one copy of cbbM gene per cell, the maximum relative contribution of the ESSP GSO-St18 (considering the total microbial community) was ~16%, which occurred at 85 m during the austral summer period (Figure 6). This value is comparable to the abundance of GSOs found in other systems. Glaubitz et al. (2013) registered SUP05 abundances between 10 and 30% of the total cell numbers in the pelagic redoxcline of the Baltic Sea, Sunamura et al. (2004) found that SUP05 accounted for 18–58% of the total cell numbers (depending on the depth) in the Suiyo Seamount hydrothermal plume. Zaikova et al. (2010) reported SUP05 abundances of up to 37% of the total bacteria in the seasonally anoxic Saanich Inlet (British Columbia), while Lavik et al. (2009) reported maximal abundances of SUP05-related cells of up to 11% of the total bacterial community in the marine coastal upwelling system of the African shelf. Moreover, Schunck et al. (2013) found that the total GSO community dominated with a maximum of 17% of all DNA sequences in metagenomic samples from the anoxic zone off Peru. Therefore, even though the ESSP GSO-ST18 group appears to be distinct from the previously described SUP05/ARCTIC96BD-19 clade members, their abundances are comparable to those of sulfur-oxidizing γ-proteobacteria found in other systems and are coherent with the previous results in the study area, where metagenomics analysis shows the dominance of this group with 44% of the total 16S rRNA sequences and more than 25% of the total coding-protein sequences at 85 m in March 2011 (Murillo et al., 2014).
The cbbM gene also showed a clear seasonal pattern at the transcriptional level, with higher values during the upwelling season at the deepest samples (Figure 7). However, transcript abundance was significantly lower than the corresponding gene abundance, and the maximum value obtained was 20 copies per mL at 85 m depth in December. This low expression is also corroborated by the metatranscriptomic data, which showed a percentage of relative expression for cbbM of the GSO group of 0.0958 at 85 m in March 2011 (Figure 8 inset and Table 2) This graph shows that cbbM follows a pattern and level of expression similar to rpoC (RNA polymerase), while groEL presents the same pattern of expression, but with a slightly higher relative expression level, consistent with GroEL's role as chaperon for the proper folding of proteins, except at 85 m depth during the upwelling period, where rpoC is most highly express. This could indicate that the community of GSO microorganisms remains at a resting state in more oxygenated waters and thrives when oxygen is absent (anoxic bottom waters), also supported by the dominance of cbbM transcripts associated to GSO group at 85 m during upwelling (Figure 9). Another explanation for this low level of expression could be related to the fact that RuBisCO has been described as an enzyme with a high degree of conservation and low turnover rates (Giri et al., 2004; Badger and Bek, 2007; Parry et al., 2007), and therefore lacks the need for high levels of transcription to accomplish its function. Similar to our results, low abundance of RuBisCO gene transcripts has been found in other studies, even among eukaryotes. For example, Storelli et al. (2013) found a maximum of 6 ± 0.9 × 10⁻¹¹ ng of mRNA per cell, for the cbbM gene of Candidatus “Thiodictyon syntrophicum,” growing under laboratory conditions and Wawrik et al. (2002) reported values around 5.0 × 10⁻¹¹ and 4.5 × 10⁻¹⁰ ng mRNA per cell for RuBisCO form I (rbcL) in cultured diatoms. If we normalized the transcript copy number with the cbbM abundance (assuming one copy of the gene per cell), our values are in the range of 5.17 × 10⁻¹³ to 2.58 × 10⁻¹¹ ng of mRNA per cell, but without a significant correlation with the abundance of the corresponding gene (Table S3). The lack of direct correlation between gene or cell abundance and metabolic function has been observed in other studies before. For example, Storelli et al. (2013) reported that the most abundant populations of carbon-fixing bacteria in Lake Cadagno were the responsible for only a small fraction of the total CO2 fixed. While, specifically for SUP05, Carolan et al. (2015) showed at the ETNP OMZ that although SUP05 bacteria were the most abundant group at a given station, they were comparatively less active, with levels of 16S rRNA in cDNA that were 1–2 orders of magnitude lower than 16S rRNA genes in DNA.
Another possible explanation for the low levels of cbbM transcription compared to the abundance of the gene (Figures 4, 7, 8) is that these GSOs may be using organic matter as a complementary carbon source. This has been previously proposed by Marshall and Morris (2013), who failed to amplify genes associated with inorganic carbon fixation, which would indicate that either their cultivated GSOs are significantly different from the ones previously described (in anoxic, O2 deficient waters and in the deep sea) or that the carbon source for these bacteria is organic. Also, Anantharaman et al. (2013) and recently Murillo et al. (2014) reported the presence of genes in the SUP05/ARCTIC96BD-19 group that would support a mixotrophic lifestyle.
Considering the metabolic potential of the GSOs dominating the oxygen-deficient waters in the study area (Murillo et al., 2014), the energy source supporting the autotrophic carbon fixation process would come from the oxidation of reduced sulfur compounds (e.g., H2S, S2, and S°). These electron donors should become available during the austral spring-summer season, arising from sulfate reduction taking place in the anoxic sediments (Thamdrup and Canfield, 1996) or within the water column itself (Canfield et al., 2010): As shown by Galán et al. (2014) in the same study area (Station 18), the inventory (mmol m−2) of H2S during the 2009–2011 period was higher in spring-summer (upwelling) compared to fall-winter (downwelling), for the three layer analyzed; Surface (0–25 m, 3.1 mmol m−2), oxycline (26–65 m, 4.2 mmol m−2) and bottom (66–90 m, 3.8 mmol m−2). Also, they demonstrated experimentally that the amendment of water samples with H2S (under anoxic conditions) and not thiosulfate boosted the dissolved inorganic carbon assimilation and N2O production by the microbial community at bottom waters (90 m depth), stressing the importance of O2 in modulating the abundance and biogeochemical relevance of chemolithoautotrophic metabolisms in these marine ecosystems (Stevens and Ulloa, 2008; Lavik et al., 2009; Walsh et al., 2009; Canfield et al., 2010; Ulloa et al., 2012; Wright et al., 2012; Glaubitz et al., 2013; Schunck et al., 2013). Following this model, we evaluate some of the key genes from sulfur and nitrogen cycles that should be coupled to fuel the carbon fixation by RuBisCO. Figure 10 shows a clear correlation of relative expression between the sulfur oxidation pathways and the narGHIJ operon at 85 m during upwelling. The expression of reverse dissimilatory sulfite reductase (rdsr) pathway, the adenosine-5′-phosphosulfate reductase (apr) pathway and the ATP sulfurylase (sat) cysN gene are in the same order of magnitude than the nar operon (Figures 10B,C), suggesting a coupling of these pathways for the generation of redox potential (through sulfur oxidation) and the sink of electrons by the reduction of nitrate to nitrite. This is also supported by the taxonomic association of the expressed sequences, for key genes in each pathway, that are dominated by the GSO group (Tables 2, 3), and is clearly correlated with the sharp diminishing of nitrate concentration at bottom depths during upwelling and the accumulation of nitrite (Figures 2C,D). The sulfur oxidation system (sox) genes were one order of magnitude lower (Figure 10A), which can be explained by both a low concentration of hydrogen sulfide/thiosulfate in the water column (at nanomolar scale or even undetectable) and a preference for the utilization of internally stored sulfur, consistent with a truncated sox system and a practically null expression of soxC, what has been describe for other members of the SUP05/ARCTIC96BD-19 clade (Walsh et al., 2009; Anantharaman et al., 2013; Marshall and Morris, 2013). Despite the low relative expression for the sox system, the transcripts are dominated by the GSO group at 85 and 50 m, as shown by the taxonomic assignation of sequences (Table 2), suggesting that in the case of a pulse of hydrogen sulfide or its oxidized intermediary thiosulfate, this group of organisms may be prepared to respond and utilize it. The same genes discussed above have been shown to be expressed, also in a coupled manner, and associated to the GSO group at the ETSP OMZ off northern Chile (Stewart et al., 2012) and at the ETNP OMZ in the Gulf of California (Carolan et al., 2015).
The nitrite reductase nirK gene shows a different expression pattern, with maximum levels of relative expression at 85 and 50 m during downwelling (Figure 10D), and with the dominance of transcripts associated to the Thaumarchaeota phylum (Table 3). During the upwelling period at 85 m the nirK expression was low (0.0698%), and its taxonomic association to the GSO group was just of 7.67% (Figure 10E and Table 3). This is consistent with a pivotal role of nitrite (), due to his redox state, that allows both oxidation (under anaerobic conditions) and reduction (under aerobic conditions), and therefore it may be used by several coupled and/or competing microbial processes. But clearly, the group of organisms that dominate the nirK expression in this area during both periods are the ammonia-oxidizing thaumarchaeota (Table 3), which represent over the 90% of the sequences expressed, with the exception of 85 m during upwelling, where they represent only the 9.21% of sequences and the gene expression is dominated with a 10.74% by sequences associated to Nitrospina-like bacteria, in particular with relatives of an isolate from the brine-seawater interface of Red Sea brines (Figure S2; GenBank BioProject: PRJNA276499). Nitrospina is part of the nitrite-oxidizing bacteria (NOB) group, a chemolithoautotroph that appears to be the dominant nitrite oxidizers in the oceans (Lücker et al., 2013), Nitrospina-like bacteria have been detected by molecular methods in open ocean water (Fuchs et al., 2005; DeLong et al., 2006), marine sediments (Hunter et al., 2006; Jorgensen et al., 2012), and also in marine oxygen minimum zones (OMZs; Labrenz et al., 2007; Fuchsman et al., 2011), including our study site (Bristow et al., 2016; Levipan et al., 2016). The N. gracilis genome encodes two copies of copper-containing nitrite reductase nirK gene, but for NOB other than Nitrobacter no function of NirK has been proposed, and denitrification of nitrite to NO under anoxic conditions has not been observed yet (Lücker et al., 2013).
Even lower levels of expression and taxonomic association to GSO group are observed for the nitric oxide reductase norB and the nitrous oxide reductase nosZ genes (Figure 10E and Table 3), supporting the idea that this group of sulfur-oxidizing γ-proteobacteria are not involve directly in the loss of fixed nitrogen from the system, and that archaea are the major nitric-oxide producers in the system, under microoxic conditions during both periods.
In summary, our study shows that there is a bacterial community coding a cbbM-type gene, which, while distinct, is phylogenetically closely related to the SUP05/ARCTIC96BD-19 clade of sulfur-oxidizing γ-proteobacteria, a group that has been shown to be highly abundant in the seasonal OMZ off central Chile and in other oxygen-deficient marine waters. However, despite its numerical dominance and that a significant percentage of this community possesses form II of the RuBisCO enzyme, the cbbM transcriptional levels appear very low and largely controlled by fluctuations in the O2 concentrations in the water column over the annual cycle. Even though, the expression of other genes related to the nitrogen cycle and theoretically coupled to carbon fixation are above the 0.1% of expression in the community for the GSO group, the relative expression of RuBisCO gene (cbbM) in this group (with a maximum of ~ 0.1% at 85 m in anoxia) does not seem to be consistent with the high rates of dark carbon fixation reported in the study area, not at least during the snapshot view represented by the metatranscriptomic data analyzed here. Perhaps other chemolithoautotrophs, not yet evaluated, are playing a significant role in the dark carbon fixation of the system, particularly in the non-anoxic waters. To evaluate this scenario, it should be necessary to describe and analyse each of the main community functional components and experimentally depict their contribution to the system, a composition that we are barely starting to understand.
Author Contributions
Conception or design of the work: BL, AM, and OU. Data collection: BL and AM. Data analysis and interpretation: BL, AM, SR, and OU. Drafting the article: BL, AM, and OU. Critical revision of the article: BL, AM, SR, and OU. Final approval of the version to be published: BL, AM, SR, and OU.
Conflict of Interest Statement
The authors declare that the research was conducted in the absence of any commercial or financial relationships that could be construed as a potential conflict of interest.
Acknowledgments
We would like to thank the Captain and crew of the R/V Kay Kay II. We also thank Gadiel Alarcón and Lucy Belmar for the collection of the samples, and Marcela Montoya for help in the laboratory. We are also grateful to Montserrat Aldunate and J. Francisco Santibáñez for their help and cooperation during the investigation, and special thanks to Jody J. Wright for reviewing a previous version of this manuscript. This work was supported by the Gordon and Betty Moore Foundation through the Mi_Loco Project, Grant MMI1661 to Universidad de Concepción (OU), as well as by the Chilean National Commission for Scientific and Technological Research (CONICYT) through the FONDECYT #3120047 grant to AM and FONDECYT #1161483 grant to OU. Additional support was provided by the Millennium Science Initiative, grant IC120019. The authors indicate no conflict of interest.
Supplementary Material
The Supplementary Material for this article can be found online at: https://www.frontiersin.org/article/10.3389/fmars.2017.00213/full#supplementary-material
References
Alfreider, A., Vogt, C., Hoffmann, D., and Babel, W. (2003). Diversity of Ribulose-1,5-Bisphosphate Carboxylase/Oxygenase large-subunit genes from groundwater and aquifer microorganisms. Microb. Ecol. 45, 317–328. doi: 10.1007/s00248-003-2004-9
Anantharaman, K., Breier, J. A., Sheik, C. S., and Dick, G. J. (2013). Evidence for hydrogen oxidation and metabolic plasticity in widespread deep-sea sulfur-oxidizing bacteria. Proc. Natl. Acad. Sci. U.S.A. 110, 330–335. doi: 10.1073/pnas.1215340110
Arar, E. J., and Collins, G. B. (1997). In Vitro Determination of Chlorophyll A and Pheophytin A in Marine and Freshwater Algae by Fluorescence. National Exposure Research Laboratory, U.S. Environmental Protection Agency, Cincinnati.
Badger, M. R., and Bek, E. J. (2007). Multiple Rubisco forms in proteobacteria: their functional significance in relation to CO2 acquisition by the CBB cycle. J. Exp. Bot. 59, 1525–1541. doi: 10.1093/jxb/erm297
Berg, I. A. (2011). Ecological aspects of the distribution of different autotrophic CO2 fixation pathways. Appl. Environ. Microbiol. 77, 1925–1936. doi: 10.1128/AEM.02473-10
Bristow, L. A., Dalsgaard, T., Tiano, L., Mills, D. B., Bertagnolli, A. D., Wright, J. J., et al. (2016). Ammonium and nitrite oxidation at nanomolar oxygen concentrations in oxygen minimum zone waters. Proc. Natl. Acad. Sci. U.S.A. 113, 10601–10606. doi: 10.1073/pnas.1600359113
Buchfink, B., Xie, C., and Huson, D. H. (2015). Fast and sensitive protein alignment using DIAMOND. Nat. Methods 12, 59–60. doi: 10.1038/nmeth.3176
Canfield, D. E., Stewart, F. J., Thamdrup, B., De Brabandere, L., Dalsgaard, T., Delong, E. F., et al. (2010). A cryptic sulfur cycle in oxygen-minimum-zone waters off the Chilean Coast. Science 330, 1375–1378. doi: 10.1126/science.1196889
Carolan, M. T., Smith, J. M., and Beman, J. M. (2015). Transcriptomic evidence for microbial sulfur cycling in the eastern tropical North Pacific oxygen minimum zone. Front. Microbiol. 6:334. doi: 10.3389/fmicb.2015.00334
Corredor, J. E., Wawrik, B., Paul, J. H., Tran, H., Kerkhof, L., Lopez, J. M., et al. (2004). Geochemical rate-RNA integration study: ribulose-1, 5-bisphosphate carboxylase / oxygenase gene transcription and photosynthetic capacity of planktonic photoautotrophs. Appl. Environ. Microbiol. 70, 5459–5468. doi: 10.1128/AEM.70.9.5459-5468.2004
DeLong, E. F., Preston, C. M., Mincer, T., Rich, V., Hallam, S. J., Frigaard, N. U., et al. (2006). Community genomics among stratified microbial assemblages in the ocean's interior. Science 311, 496–503. doi: 10.1126/science.1120250
Edgar, R. C. (2004). MUSCLE: multiple sequence alignment with high accuracy and high throughput. Nucleic Acids Res. 32, 1792–1797. doi: 10.1093/nar/gkh340
Ellis, R. J. (1979). The most abundant protein in the world. Trends Biochem. Sci. 4, 241–244. doi: 10.1016/0968-0004(79)90212-3
Elsaied, H., and Naganuma, T. (2001). Phylogenetic diversity of ribulose-1,5-bisphosphate carboxylase/oxygenase large-subunit genes from deep-Sea microorganisms. Appl. Environ. Microbiol. 67, 1751–1765. doi: 10.1128/AEM.67.4.1751-1765.2001
Farías, L., Fernández, C., Faúndez, J., Cornejo, M., and Alcaman, M. E. (2009). Chemolithoautotrophic production mediating the cycling of the greenhouse gases N2O and CH4 in an upwelling ecosystem. Biogeosciences 6, 3053–3069. doi: 10.5194/bg-6-3053-2009
Fuchs, B. M., Woebken, D., Zubkov, M. V., Burkill, P., and Amann, R. (2005). Molecular identification of picoplankton populations in contrasting waters of the Arabian Sea. Aquat. Microb. Ecol. 39, 145–157. doi: 10.3354/ame039145
Fuchsman, C. A., Kirkpatrick, J. B., Brazelton, W. J., Murray, J. W., and Staley, J. T. (2011). Metabolic strategies of free-living and aggregate-associated bacterial communities inferred from biologic and chemical profiles in the Black Sea suboxic zone. FEMS Microbiol. Ecol. 78, 586–603. doi: 10.1111/j.1574-6941.2011.01189.x
Fuenzalida, R., Schneider, W., Garcés-Vargas, J., Bravo, L., and Lange, C. (2009). Vertical and horizontal extension of the oxygen minimum zone in the eastern South Pacific Ocean. Deep Sea Res. Part II Top. Stud. Oceanogr. 56, 992–1003. doi: 10.1016/j.dsr2.2008.11.001
Galán, A., Faúndez, J., Thamdrup, B., Santibáñez, J. F., and Farías, L. (2014). Temporal dynamics of nitrogen loss in the coastal upwelling ecosystem off central Chile: evidence of autotrophic denitrification through sulfide oxidation. Limnol. Oceanogr. 59, 1865–1878. doi: 10.4319/lo.2014.59.6.1865
Galán, A., Molina, V., Belmar, L., and Ulloa, O. (2012). Temporal variability and phylogenetic characterization of planktonic anammox bacteria in the coastal upwelling ecosystem off central Chile. Prog. Oceanogr. 92–95, 110–120. doi: 10.1016/j.pocean.2011.07.007
Galán, A., Molina, V., Thamdrup, B., Woebken, D., Lavik, G., Kuypers, M. M. M., et al. (2009). Anammox bacteria and the anaerobic oxidation of ammonium in the oxygen minimum zone off northern Chile. Deep Sea Res. Part II Top. Stud. Oceanogr. 56, 1021–1031. doi: 10.1016/j.dsr2.2008.09.016
Giri, B. J., Bano, N., and Hollibaugh, J. T. (2004). Distribution of RuBisCO genotypes along a redox gradient in Mono Lake, California. Appl. Environ. Microbiol. 70, 3443–3448. doi: 10.1128/AEM.70.6.3443-3448.2004
Glaubitz, S., Kiesslich, K., Meeske, C., Labrenz, M., and Jurgens, K. (2013). SUP05 dominates the gammaproteobacterial sulfur oxidizer assemblages in pelagic redoxclines of the Central Baltic and Black Seas. Appl. Environ. Microbiol. 79, 2767–2776. doi: 10.1128/AEM.03777-12
Grasshoff, K., Ehrhardt, M., and Kremling, K. (eds.). (1999). Methods of Seawater Analysis, 3rd Edn. Weinheim: Wiley-VCH Verlag GmbH.
Guindon, S., and Gascuel, O. (2003). A simple, fast, and accurate algorithm to estimate large phylogenies by maximum likelihood. Syst. Biol. 52, 696–704. doi: 10.1080/10635150390235520
Helly, J. J., and Levin, L. A. (2004). Global distribution of naturally occurring marine hypoxia on continental margins. Deep Sea Res. Part I Oceanogr. Res. Pap. 51, 1159–1168. doi: 10.1016/j.dsr.2004.03.009
Holmes, R. M., Aminot, A., Kérouel, R., Hooker, B. A., and Peterson, B. J. (1999). A simple and precise method for measuring ammonium in marine and freshwater ecosystems. Can. J. Fish. Aquat. Sci. 56, 1801–1808. doi: 10.1139/f99-128
Hügler, M., and Sievert, S. M. (2011). Beyond the calvin cycle: autotrophic carbon fixation in the Ocean. Ann. Rev. Mar. Sci. 3, 261–289. doi: 10.1146/annurev-marine-120709-142712
Hunter, E. M., Mills, H. J., and Kostka, J. E. (2006). Microbial community diversity associated with carbon and nitrogen cycling in permeable shelf sediments. Appl. Environ. Microbiol. 72, 5689–5701. doi: 10.1128/AEM.03007-05
Jorgensen, S. L., Hannisdal, B., Lanzen, A., Baumberger, T., Flesland, K., Fonseca, R., et al. (2012). Correlating microbial community profiles with geochemical data in highly stratified sediments from the Arctic mid-ocean ridge. Proc. Natl. Acad. Sci. U.S.A. 109, E2846–E2855. doi: 10.1073/pnas.1207574109
Kato, S., Nakawake, M., Ohkuma, M., and Yamagishi, A. (2012). Distribution and phylogenetic diversity of cbbM genes encoding RubisCO form II in a deep-sea hydrothermal field revealed by newly designed PCR primers. Extremophiles 16, 277–283. doi: 10.1007/s00792-011-0428-6
Kuwahara, H., Yoshida, T., Takaki, Y., Shimamura, S., Nishi, S., Harada, M., et al. (2007). Reduced genome of the thioautotrophic intracellular symbiont in a Deep-Sea Clam, Calyptogena okutanii. Curr. Biol. 17, 881–886. doi: 10.1016/j.cub.2007.04.039
Labrenz, M., Jost, G., and Jürgens, K. (2007). Distribution of abundant prokaryotic organisms in the water column of the central Baltic Sea with an oxic-anoxic interface. Aquat. Microb. Ecol. 46, 177–190. doi: 10.3354/ame046177
Lam, P., and Kuypers, M. M. M. (2011). Microbial nitrogen cycling processes in oxygen minimum zones. Ann. Rev. Mar. Sci. 3, 317–345. doi: 10.1146/annurev-marine-120709-142814
Lavik, G., Stührmann, T., Brüchert, V., Van der Plas, A., Mohrholz, V., Lam, P., et al. (2009). Detoxification of sulphidic African shelf waters by blooming chemolithotrophs. Nature 457, 581–584. doi: 10.1038/nature07588
Levipan, H. A., Molina, V., Anguita, C., Rain-Franco, A., Belmar, L., and Fernandez, C. (2016). Variability of nitrifying communities in surface coastal waters of the Eastern South Pacific (~36° S). Environ. Microbiol. Rep. 8, 851–864. doi: 10.1111/1758-2229.12448
Lücker, S., Nowka, B., Rattei, T., Spieck, E., and Daims, H. (2013). The Genome of Nitrospina gracilis Illuminates the Metabolism and Evolution of the Major Marine Nitrite Oxidizer. Front. Microbiol. 4:27. doi: 10.3389/fmicb.2013.00027
Madigan, M. T., and Martinko, J. M. (2006). Brock Biology of Microorganisms. 11th Edn., eds M. T. Madigan and J. M. Martinko (London: Upper Saddle River; Pearson Prentice Hall), 541–565.
Marshall, K. T., and Morris, R. M. (2013). Isolation of an aerobic sulfur oxidizer from the SUP05/Arctic96BD-19 clade. ISME J. 7, 452–455. doi: 10.1038/ismej.2012.78
Marshall, K. T., and Morris, R. M. (2015). Genome Sequence of “Candidatus Thioglobus singularis” Strain PS1, a Mixotroph from the SUP05 Clade of Marine Gammaproteobacteria. Genome Announc. 3, e01155–e01115. doi: 10.1128/genomeA.01155-15
Mattes, T. E., Nunn, B. L., Marshall, K. T., Proskurowski, G., Kelley, D. S., Kawka, O. E., et al. (2013). Sulfur oxidizers dominate carbon fixation at a biogeochemical hot spot in the dark ocean. ISME J. 7, 2349–2360. doi: 10.1038/ismej.2013.113
Muñoz, P., Salamanca, M. A., Neira, C., and Sellanes, J. (2004). Nitrogen sediment fluxes in an upwelling system off central Chile (Concepción Bay and adjacent shelf) during the 1997-1998 El Niño. Rev. Chil. Hist. Nat. 77, 305–318. doi: 10.4067/S0716-078X2004000200009
Murillo, A. A., Ramírez-Flandes, S., DeLong, E. F., and Ulloa, O. (2014). Enhanced metabolic versatility of planktonic sulfur-oxidizing g-proteobacteria in an oxygen-deficient coastal ecosystem. Front. Mar. Sci. 1:18. doi: 10.3389/fmars.2014.00018
Parry, M. A. J., Keys, A. J., Madgwick, P. J., Carmo-Silva, A. E., and Andralojc, P. J. (2007). Rubisco regulation: a role for inhibitors. J. Exp. Bot. 59, 1569–1580. doi: 10.1093/jxb/ern084
Paulmier, A., Ruiz-Pino, D., and Garçon, V. (2011). CO2 maximum in the oxygen minimum zone (OMZ). Biogeosciences 8, 239–252. doi: 10.5194/bg-8-239-2011
Pichard, S. L., Frischer, M. E., and Paul, J. H. (1993). Ribulose bisphosphate carboxylase gene expression in subtropical marine phytoplankton populations. Mar. Eol. Prog. Ser. 101, 55–65. doi: 10.3354/meps101055
Ramírez-Flandes, S., and Ulloa, O. (2008). Bosque: integrated phylogenetic analysis software. Bioinformatics 24, 2539–2541. doi: 10.1093/bioinformatics/btn466
Raven, J. (2009). Contributions of anoxygenic and oxygenic phototrophy and chemolithotrophy to carbon and oxygen fluxes in aquatic environments. Aquat. Biol. 56, 177–192. doi: 10.3354/ab01315
Roeselers, G., Newton, I. L. G., Woyke, T., Auchtung, T. A., Dilly, G. F., Dutton, R. J., et al. (2010). Complete genome sequence of Candidatus Ruthia magnifica. Stand. Genomic Sci. 3, 163–173. doi: 10.4056/sigs.1103048
Schunck, H., Lavik, G., Desai, D. K., Großkopf, T., Kalvelage, T., Löscher, C. R., et al. (2013). Giant hydrogen sulfide plume in the oxygen minimum zone off Peru supports chemolithoautotrophy. PLoS ONE 8:e68661. doi: 10.1371/journal.pone.0068661
Shah, V., and Morris, R. M. (2015). Genome Sequence of “Candidatus Thioglobus autotrophica” Strain EF1, a Chemoautotroph from the SUP05 Clade of Marine Gammaproteobacteria. Genome Announc. 3, e01156–e01115. doi: 10.1128/genomeA.01156-15
Sobarzo, M. (2004). Coastal upwelling process on a continental shelf limited by submarine canyons, Concepción, central Chile. J. Geophys. Res. 109:C12012. doi: 10.1029/2004JC002350
Sobarzo, M., Bravo, L., Donoso, D., Garcés-Vargas, J., and Schneider, W. (2007). Coastal upwelling and seasonal cycles that influence the water column over the continental shelf off central Chile. Prog. Oceanogr. 75, 363–382. doi: 10.1016/j.pocean.2007.08.022
Stevens, H., and Ulloa, O. (2008). Bacterial diversity in the oxygen minimum zone of the eastern tropical South Pacific. Environ. Microbiol. 10, 1244–1259. doi: 10.1111/j.1462-2920.2007.01539.x
Stewart, F. J., Ulloa, O., and DeLong, E. F. (2012). Microbial metatranscriptomics in a permanent marine oxygen minimum zone. Environ. Microbiol. 14, 23–40. doi: 10.1111/j.1462-2920.2010.02400.x
Storelli, N., Peduzzi, S., Saad, M. M., Frigaard, N.-U., Perret, X., and Tonolla, M. (2013). CO2 assimilation in the chemocline of Lake Cadagno is dominated by a few types of phototrophic purple sulfur bacteria. FEMS Microbiol. Ecol. 84, 421–432. doi: 10.1111/1574-6941.12074
Strickland, J., and Parson, T. (1972). A Practical Handbook of Seawater Analysis, 2nd Edn. Ottawa, ON: Fisheries Research Board of Canada.
Sunamura, M., Higashi, Y., Miyako, C., Ishibashi, J.-I., and Maruyama, A. (2004). Two bacteria phylotypes are predominant in the Suiyo Seamount hydrothermal plume. Appl. Environ. Microbiol. 70, 1190–1198. doi: 10.1128/AEM.70.2.1190-1198.2004
Swan, B. K., Martinez-Garcia, M., Preston, C. M., Sczyrba, A., Woyke, T., Lamy, D., et al. (2011). Potential for chemolithoautotrophy among ubiquitous bacteria lineages in the dark ocean. Science 333, 1296–1300. doi: 10.1126/science.1203690
Tabita, F. R., Hanson, T. E., Li, H., Satagopan, S., Singh, J., and Chan, S. (2007a). Function, structure, and evolution of the RubisCO-like proteins and their RubisCO homologs. Microbiol. Mol. Biol. Rev. 71, 576–599. doi: 10.1128/MMBR.00015-07
Tabita, F. R., Hanson, T. E., Satagopan, S., Witte, B. H., and Kreel, N. E. (2008). Phylogenetic and evolutionary relationships of RubisCO and the RubisCO-like proteins and the functional lessons provided by diverse molecular forms. Philos. Trans. R. Soc. B. Biol. Sci. 363, 2629–2640. doi: 10.1098/rstb.2008.0023
Tabita, F. R., Satagopan, S., Hanson, T. E., Kreel, N. E., and Scott, S. S. (2007b). Distinct form I, II, III, and IV Rubisco proteins from the three kingdoms of life provide clues about Rubisco evolution and structure/function relationships. J. Exp. Bot. 59, 1515–1524. doi: 10.1093/jxb/erm361
Thamdrup, B., and Canfield, D. E. (1996). Pathways of carbon oxidation in continental margin sediments off central Chile. Limnol. Oceanogr. 41, 1629–1650. doi: 10.4319/lo.1996.41.8.1629
Thamdrup, B., Dalsgaard, T., and Revsbech, N. P. (2012). Widespread functional anoxia in the oxygen minimum zone of the Eastern South Pacific. Deep Sea Res. I Oceanogr. Res. Pap. 65, 36–45. doi: 10.1016/j.dsr.2012.03.001
Tourova, T. P., and Spiridonova, E. M. (2009). Phylogeny and evolution of the ribulose 1,5-bisphosphate carboxylase/oxygenase genes in prokaryotes. Mol. Biol. 43, 713–728. doi: 10.1134/S0026893309050033
Ulloa, O., Canfield, D. E., DeLong, E. F., Letelier, R. M., and Stewart, F. J. (2012). Microbial oceanography of anoxic oxygen minimum zones. Proc. Natl. Acad. Sci. U.S.A. 109, 15996–16003. doi: 10.1073/pnas.1205009109
Ulloa, O., and Pantoja, S. (2009). The oxygen minimum zone of the eastern South Pacific. Deep Sea Res. Part II Top. Stud. Oceanogr. 56, 987–991. doi: 10.1016/j.dsr2.2008.12.004
Walsh, D. A., Zaikova, E., Howes, C. G., Song, Y. C., Wright, J. J., Tringe, S. G., et al. (2009). Metagenome of a versatile chemolithoautotroph from expanding oceanic dead zones. Science 326, 578–582. doi: 10.1126/science.1175309
Wawrik, B., Paul, J. H., and Tabita, F. R. (2002). Real-time PCR quantification of rbcL (ribulose-1,5-bisphosphate carboxylase/oxygenase) mRNA in diatoms and pelagophytes. Appl. Environ. Microbiol. 68, 3771–3779. doi: 10.1128/AEM.68.8.3771-3779.2002
Whelan, S., and Goldman, N. (2001). A general empirical model of protein evolution derived from multiple protein families using a maximum-likelihood approach. Mol. Biol. Evol. 18, 691–699. doi: 10.1093/oxfordjournals.molbev.a003851
Wright, J. J., Konwar, K. M., and Hallam, S. J. (2012). Microbial ecology of expanding oxygen minimum zones. Nat. Rev. Microbiol. 10, 381–394. doi: 10.1038/nrmicro2778
Xu, H. H., and Tabita, F. R. (1996). Ribulose-1,5-bisphosphate carboxylase/oxygenase gene expression and diversity of Lake Erie planktonic microorganisms. Appl. Environ. Microbiol. 62, 1913–1921.
Keywords: RuBisCO, cbbM, γ-proteobacteria, OMZ, coastal-upwelling
Citation: Léniz B, Murillo AA, Ramírez-Flandes S and Ulloa O (2017) Diversity and Transcriptional Levels of RuBisCO Form II of Sulfur-Oxidizing γ-Proteobacteria in Coastal-Upwelling Waters with Seasonal Anoxia. Front. Mar. Sci. 4:213. doi: 10.3389/fmars.2017.00213
Received: 31 October 2016; Accepted: 16 June 2017;
Published: 04 July 2017.
Edited by:
Hongbin Liu, Hong Kong University of Science and Technology, Hong KongReviewed by:
Douglas Andrew Campbell, Mount Allison University, CanadaThomas E. Hanson, University of Delaware, United States
Copyright © 2017 Léniz, Murillo, Ramírez-Flandes and Ulloa. This is an open-access article distributed under the terms of the Creative Commons Attribution License (CC BY). The use, distribution or reproduction in other forums is permitted, provided the original author(s) or licensor are credited and that the original publication in this journal is cited, in accordance with accepted academic practice. No use, distribution or reproduction is permitted which does not comply with these terms.
*Correspondence: Osvaldo Ulloa, oulloa@udec.cl
†These authors have contributed equally to this work.