Evaluating the Surface Response of Discharge Events in a New Zealand Gulf-ROFI
 Joanne M. Ø'Callaghan
 Craig L. Stevens
- 1Marine Physics, National Institute of Water and Atmospheric Research, Wellington, New Zealand
- 2Physics Department, University of Auckland, Auckland, New Zealand
Using moorings with a surface expression, responses of buoyant river outflows were examined in the Firth-Hauraki Gulf system, New Zealand. The Firth region of freshwater influence (ROFI) behaves as a gulf-type ROFI where the balance of key processes lies between rotation and advection. The latter process is largely regulated by the frequency and amplitude of freshwater discharges. Using 12-months of observations from two inner Firth sites, the system was found to be salinity stratified for up to 4 months of a year. During the largest event (274 m3s−1, mean daily maximum) in 2012 near-oceanic surface salinity (34 psu) freshened substantially down to 28 psu over the upper 3 m. Time lags between freshwater inflows and ROFI response were 4 and 7 days at the Waiheke and WilsonB locations, respectively. Faster seaward advection of surface layers occurred for a minimum of 3 days and up to a week after peak discharges. High frequency winds (~3-hourly) were persistent in regulating surface flows over the annual cycle. Surface salinity had peaks in energy that were coherent with surface flows at periods of 16–32 days over the Austral winter. The duration of discharge events was O(days), yet responses by buoyancy and advection were evident for weeks to a month in the Firth ROFI.
1. Introduction
Impacts of land-derived materials on coastal ecosystems are largely controlled by the physical mixing and transport of river water in and through the coastal ocean. The balance between river inflows, tidal oscillations, and wind stirring processes at the respective boundaries regulates the distribution and fate of material, nutrients and biota. River plume responses for small discharges are not well understood, despite small mountainous rivers delivering disproportionate quantities of particulate organic carbon (POC) to the global budget (Wheatcroft et al., 2010; Goni et al., 2013). Here, the focus is on understanding responses during individual discharge events and evaluating the cumulative role of material transport for a coastal system.
River plumes, or regions of freshwater influence (ROFIs), lie between the shelf seas and estuaries. These regions of the ocean have freshwater buoyancy input that is similar, or greater, in magnitude to the seasonal input of buoyancy as heat over the shelf region (Simpson, 1997). Most broadly, a ROFI is characterized by “horizontal advection of freshwater from the river mouth that defines the shape and character of the plume” (Simpson, 1997; Horner-Devine et al., 2015). There are four main topographic settings—open coast, corner, gulf and gulf with a sill—that may also constrain how freshwater buoyancy inputs are modulated in a ROFI. With a number of possible permutations between boundary forcing and geographic setting a generalized framework describing how momentum and buoyancy transition from source to shelf domain for each ROFI-type remains elusive.
ROFIs are critical interfaces where the boundary forcing processes interact in varying temporal quantities to dictate transport pathways. Initial efforts focused on longitudinal density gradients (Officer, 1976; Dyer, 1997) to transverse variability controlled by friction (Kasai et al., 2000; Li et al., 2004), and then to temporal variability along the respective axes. Comprehensive review articles span various individual processes pertinent to the complex estuarine environments such as turbulence and stratification (Stacey et al., 2011) and wind mixing (O'Callaghan and Stevens, 2011). Since the vertical thickness of many ROFIs are typically <5 m, observations of individual forcing processes and associated responses around ROFI spreading or dilution are difficult to quantify with either satellite observations or subsurface moorings.
The prevalence of ROFIs along open coastlines has meant these topographic types dominate river plume theory. Near-field ROFIs on open coasts typically generate a recirculating bulge of river water that interacts with a coastal current (Garvine, 1987). Variations of inflow properties and bottom slope assess whether a plume has bottom- or surface-advected response (Yankovsky and Chapman, 1997) while the horizontal length scale compared to Rossby radius can classify a system as dynamically small or large (Garvine, 1995). Spreading of the large-scale plume is regulated at boundaries by rotation, wind stirring, internal wave generation or upwelling as the bulges propagates and dilutes in the ambient flow structure and stratification (Garvine, 1987; Horner-Devine et al., 2008). Small-scale plume evolution is controlled by geometry at the inflow location, shear-driven turbulence and horizontal advection (Garvine, 1995; Kilcher et al., 2012). Large-scale plumes with narrow river mouths, e.g., Columbia River, exhibit similar dynamics in the near-field as small-scale plumes (Hetland, 2005).
Differences exist between open coast ROFIs and other topographic types—in this case a gulf ROFI—particularly around how barotropic and baroclinic processes interact to regulate material transport. For example, in the Ise Bay gulf-type ROFI a stagnation point exists between rotation and estuarine circulation that varies seasonally (Fujiwara et al., 1997). Higher winter discharges induce stronger horizontal divergence and density-driven flows close to the river source are more important for material transport (Kasai et al., 2002). The reverse occurs for lower discharges resulting in weaker vertical density gradients beyond the ROFI near-field, making it difficult to resolve time variable processes necessary to generalize plume structure and evolution. Hypoxia in bottom waters is linked to the physical mechanism of density-capping generated in the Ise Bay ROFI (Kasai, 2014).
The main objective of this paper is to understand the variability of near-surface advection and buoyancy at event timescales and what their cumulative effects are in the Firth ROFI. The variability in ROFI strength and scale during the Austral winter is dissected first, followed by an evaluation of ROFI response for three discharge events. The use of surface buoys allowed observations from within the very thin surface plume to be obtained. This observational approach is uncommon, but has provided the first near to mid-field observations from a New Zealand gulf-ROFI.
The structure of the paper is as follows. Section 1 presents the field setting and relevant research completed, including the typical ROFI boundary conditions. The observations and analysis techniques are presented in Section 2. Results (Section 3) start with surface salinity to understand mid-field response in a gulf ROFI when the freshwater inputs are relatively small. Associated responses in flow and energy for steady and transient flows show how dynamics are modified temporally. Observations are contextualized with similar ROFIs and implications for sediment pathways in the wider Firth are discussed in Section 4.
2. Field Setting: Firth of Thames-Hauraki Gulf
The primary observational focus for Hauraki Gulf (HG, Figure 1), New Zealand has been from the shelf seas perspective. Cross-shelf water intrusions were found to be a balance of onshore Ekman transport and shallow stratification early in the Austral Summer. Sharples et al. (2001) made the supposition that supply of dissolved nitrate must be oceanic since the largest river was relatively small with annual discharges of 40 m3s−1. Observations in the intervening 20 years since Sharples (1997), have focused on the inner HG and Firth of Thames (herein called the “Firth”). Riverine inputs of dissolved and particulate organic matter are considered to be greater than oceanic sources (pers comm. Zeldis, 2016).
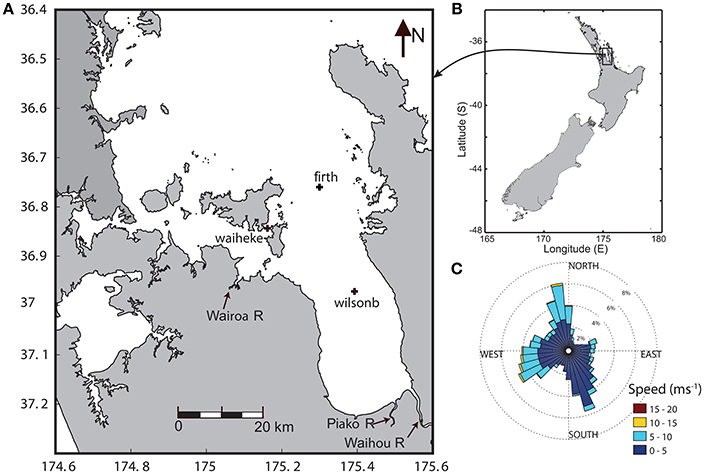
Figure 1. Map of (A) Firth of Thames-Hauraki Gulf system and the location in (B) New Zealand (NZ). Shown in (A) are three mooring sites: WilsonB, Waiheke, and Firth. The three arrows in (A) indicate the Waihou and Piako rivers into the Southern Firth, and Wairoa river into Waiheke Channel. The wind rose in (C) represents an annual cycle from a weather station positioned in the SE Firth close to the Waihou river discharge location.
Semi-diurnal tides dominate in HG (Chiswell et al., 2015) and replication of tidal flows in 2D and 3D simulations can be achieved using only the M2 constituent (Sharples and Greig, 1998; Black et al., 2000). Upwelling on the NE shelf has been correlated to seasonal wind forcing in November and December (Zeldis et al., 2004). However, by the Austral Autumn (i.e., Feburary), shelf dynamics have switched to downwelling with strong stratification separating the shelf from shallower coastal waters. Black et al. (2000) showed from model output that upwelling was sensitive to winds from the south-east (SE) direction over the wider-HG region. Persistent SE winds above a threshold of 10–12 ms−1 were found to initiate breakdown of seasonal temperature stratification in the Gulf, with complete breakdown after 3 days during strong cyclone winds.
The Firth is a large, shallow semi-enclosed sea that drains into HG and the North-East (NE) shelf of New Zealand (Figure 1). The Firth is 20 km wide, around 36 km long with depths ranging from 5 to 40 m. Tides in the Firth are also dominated by the M2 constituent, however, unlike the HG the higher harmonics are also needed to capture residual flows adequately since tidal oscillations behave as progressive wave (Black et al., 2000).
Wind forcing in the Firth tends to be from either the North-West (NW) or SE directions and are aligned with the orientation of it's the main axis (Figure 1C). During the Austral winter, wind speeds are variable and can be up to 8 ms−1 predominantly from the SW through to the SE. Frontal systems in winter move across the region from the south-west (SW) direction and account for the band of high winds from this direction (Figure 1C). Spring winds are more consistent, with uniform mean speeds of 4 ms−1 from the NNW direction.
Freshwater discharges into the Firth-Hauraki system come primarily from two rivers: the Waihou (at Tirohia) and Piako (at Maukoro Landing) rivers, with annual rates of 67 and 22 m3s−1, respectively. Peak discharges are an order of magnitude larger. These two rivers are located in the SE corner of the Firth (see arrows in Figure 1B). The majority of sediment inputs to the system are derived from ten rivers around the inner Gulf with the largest contributions from the Waihou River, contributing 151.8 (kilo tons) kt per year. The Wairoa river (arrow inshore of Waiheke Channel, Figure 1) contributes the second largest inputs of sediment to the Firth-Hauraki system at nearly 40 kt of sediment per year. Mean annual flows from the Wairoa river (at Touri) are 4.8 m3s−1.
Typical classification for the Firth ROFI is based on bulk parameters that are defined in Table 1. Using these values, the ROFI was classified as having a bulk Kelvin number (K) of 0.7. But at times the width of the ROFI, Lc, can span the horizontal width of the Firth (20 km) which increases K to 1.3. Further demarcations of K for upwelling and downwelling scenarios (i.e., Geyer et al., 2004) are possible, but the semi-enclosed topography and orientation of the Firth would limit upwelling or downwelling responses to the far-field environment. Thus, based on a Kelvin number around 1 indicates that the Firth ROFI processes are in a transition regime and can be regulated by either advection or rotation. A bulk classification, of course, does not provide detailed understanding of ROFI mechanics and variability, which will be the focus of the remainder of the paper.
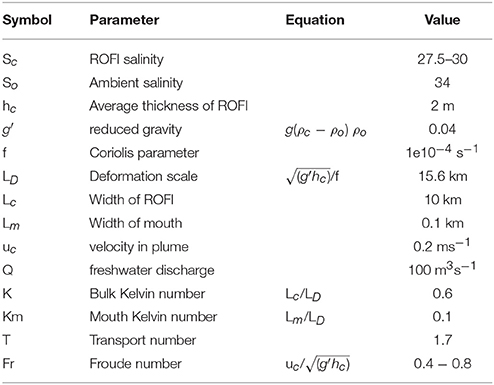
Table 1. Key ROFI parameters at the WilsonB mooring, 26 km seaward of the Waihou river.
3. Data Sampling and Analysis
3.1. Instrumentation
An instrumented mooring array was deployed at two locations in the Firth starting in June 2012. The inner Firth mooring (WilsonB) was located 26 km from the discharge point of the Waihou river in a water depth of 18 m. The location was deliberately downstream of a highly turbid and shallow (5 m) region off from the Waihou river source. Annual variability in stratification and flow were observed in the the Firth “mid-field” to capture the extent of relevant processes from the largest freshwater source into the system. Two gaps exist over the time period from June 2012 to December 2013: 2 weeks in January 2013 and July to October 2013 due to mooring maintenance.
The second mooring was located in Waiheke Channel mooring (Waiheke), around 14 km downstream of the Wairoa river in 16 m water depth. While the freshwater discharges were an order of magnitude smaller than from the Waihou, sediment concentrations can, at times, be larger (Snelder, 2004). The mooring at Waiheke evaluated mid-field responses from a diffuse but sediment-laden river source as well as Firth-wide connectivity.
Both moorings observed temperature, salinity and currents with a bottom-mounted Acoustic Doppler current profiler (ADCP) in what would be considered a somewhat routine oceanographic mooring. Instrument and sampling details are given in Table 2. Difficulties due to maritime traffic or instrument damage are valid reasons to avoid surface-focused moorings. Here, with the use of a surface buoy the variability of the surface processes of river plume (typically less than 3 m thick) was possible. This approach highlights the necessity to pursue these types of observations, where appropriate, to avoid underestimating near-field dynamics and ultimately mid- to far-field ROFI responses.
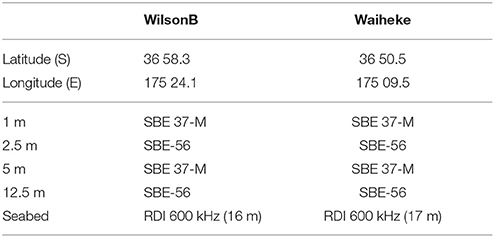
Table 2. Summary of mooring observations collected at WilsonB and Waiheke from June 2012 to July 2013. Seabird microcats (SBE-37M) sampled salinity, temperature and pressure every 60 s, continuously. Temperature was sampled at 1 Hz using a Seabird 56 thermistor (SBE56). The RDI ADCPs burst-sampled, with 1-min averages recorded every 10 min in 0.5 m bins.
Immediately after the moorings were deployed, drifter experiments were completed in the inner Firth during June 2012. Each drifter were equipped with a Garmin GPS 72, and sampling interval was 1 min. For the shallow inner Firth experiments, the drifter drogues were set to be “4 hoop” (i.e., tied up) configuration to allow for the possibility of drifting into shallow water. Three repeat vertical profiles of finescale density structure were completed at the drifter deployment and recovery locations using SCAMP, a loose-tether temperature and salinity profiler (Ruddick et al., 2000). Estimates of turbulent parameters from SCAMP aided our understanding of buoyancy frequency in the near-field of the ROFI while providing a near-field hydrography.
3.2. Analysis Techniques
ADCP observations were rotated into along- and cross-shore components. Residual vertical profiles were obtained for the mooring deployment period. Initial low-pass filtering removed tidal variability and a windowing-average (n = 30 cycles) for the length of observations generated 24.8 h cycle-averaged profiles for the along-shore component.
Cross-correlation analysis was used to quantify the extent of similarity between two normalized time series using where xn and yn are two random time series with the complex conjugate y* used to determine the extent to which two time series are correlated and an associated time lag. Spectral analysis was completed for the ADCP observations at each mooring using fast Fourier transform procedures with 32° of freedom and a cosine taper window (Emery and Thompson, 2001).
Wavelet analysis was applied to river discharges, near-surface currents and wind forcing to link casual mechanisms. To start, higher power spectral density (PSD) was determined for an individual time series, and then coherence of high spectral power is quantified between two waveforms. A continuous wavelet transform (CWT) determines spectral power for time-frequency space. The cross wavelet transform (XWT) determines the common power of two CWT decompositions. The XWT is used to identify when two series oscillate in a common frequency, be it in-phase (e.g., simultaneous maxima and minima) or anti-phase (e.g., maxima of one signal aligned with the minima of the other). The wavelet transform provides a localized instantaneous estimate for amplitude and phase of each spectral component of a time-series (Torrence, 1998; Grinsted et al., 2004). The Morlet wavelet, used here, is commonly applied to geophysical data due to its similarity to a Gaussian profile. Wavelet transforms are not completely isolated in time and edge effects of the wavelet are distinguished by a cone of influence (COI, Emery and Thompson, 2001).
4. Results
4.1. The Annual Cycle
Wind forcing and river flows are the two main boundary forcing processes in the inner Firth coastal system (Figures 2A–C). An expansion of wind conditions at hourly and daily intervals (to correspond with the sampling frequency of discharge data) are shown in Figure 1C. Over the 18-months from July 2012 to December 2013 there was high variability of wind forcing in the system. Stronger persistent winds from N-NE through to SE occur during the Austral spring. Weather fronts during winter were predominantly from the SW direction.
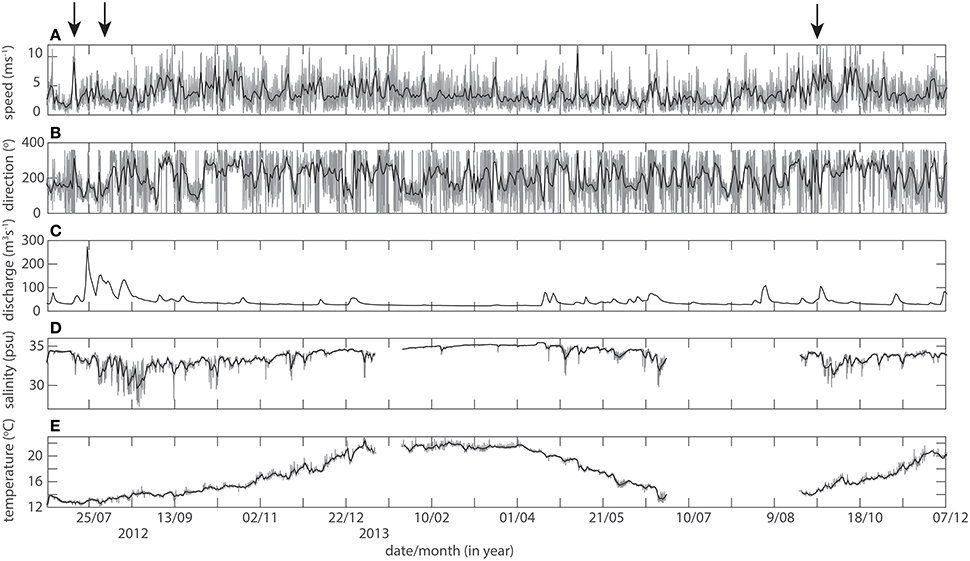
Figure 2. Boundary forcing processes of (A) wind speed, (B) wind direction, and (C) river discharges from the Waihou river (at Tirohia) for July 2012 to December 2013. Observations from the equivalent time periods of near-surface (D) salinity and (E) temperature at WilsonB. The black line overlying all data is the daily mean and corresponds to the sampling interval (daily) of river discharges. Arrows indicate timing of the three discharge events.
River discharges from the Waihou river (Figure 2C) peaked at 274 m3s−1 on 24 July for the Austral winter in 2012. Subsequent smaller peaks of 154 and 133 m3s−1 occurred on 1 and 14 August, respectively. Several smaller events were evident in discharges during late summer and autumn 2013. Maximum discharges during winter 2013 peaked at 103 m3s−1 on 26 August. Near-identical variability in timing and duration of discharges was replicated at the three rivers identified in Figure 1A. The Piako and Wairoa rivers, however, had discharge that were an order of magnitude smaller than the Waihou river.
Surface salinity and temperatures from WilsonB at 10-minute intervals and daily averages are shown in Figures 2D,E. The daily average corresponded to the sampling frequency of discharge data. For 2012-13, the annual gradient in surface salinity was 5.9 psu. Lowest salinity was 29.5 psu in July 2012 and highest salinity occurred during April 2013. A closer examination of salinity variations showed several smaller salinity changes of around 1 psu that were present in the system for several weeks. For example, a decrease from 34.5 to 33.4 psu occurred in late December 2012.
Temperatures ranged from 12 to 22°C for the austral winter to summer, respectively, at the two sites (Figure 2E). Temperatures during spring and the late autumn months tended to steadily increase or decrease over the respective season. Whereas warmer temperatures increased more slowly after the onset of 20°C in mid-December 2012 until ~22.4°C seen in early April 2013.
Full water column density gradients cannot be presented. Partly, due to poor data recovery from the near-surface microcat at Waiheke, and partly compounded by salinity only observed at two depths (1 and 5 m). Simultaneous comparisons of near-field responses from a low and high river discharge site (Wairoa and Waihou rivers) were limited to several months where data was available at both sites: Austral winter and autumn (Figure 3). The largest salinity gradients in the upper water column occurred during mid- to late-August at WilsonB with a maximum ΔS of 4.8 psu. Early in July (i.e., 17 July, Figure 3A) ΔS increased from 0 to 1.3 psu, and by end of July ΔS was greater than 3 psu. Overall, ΔS was smaller at Waiheke during winter 2012. Maximum ΔS was ~ 1.8 psu on 14 August and slightly weaker gradients of 0.5 and 0.8 psu were seen on 19 and 28 July, respectively. For the latter two events, salinity changes at Waiheke lagged behind WilsonB by ~2 days.
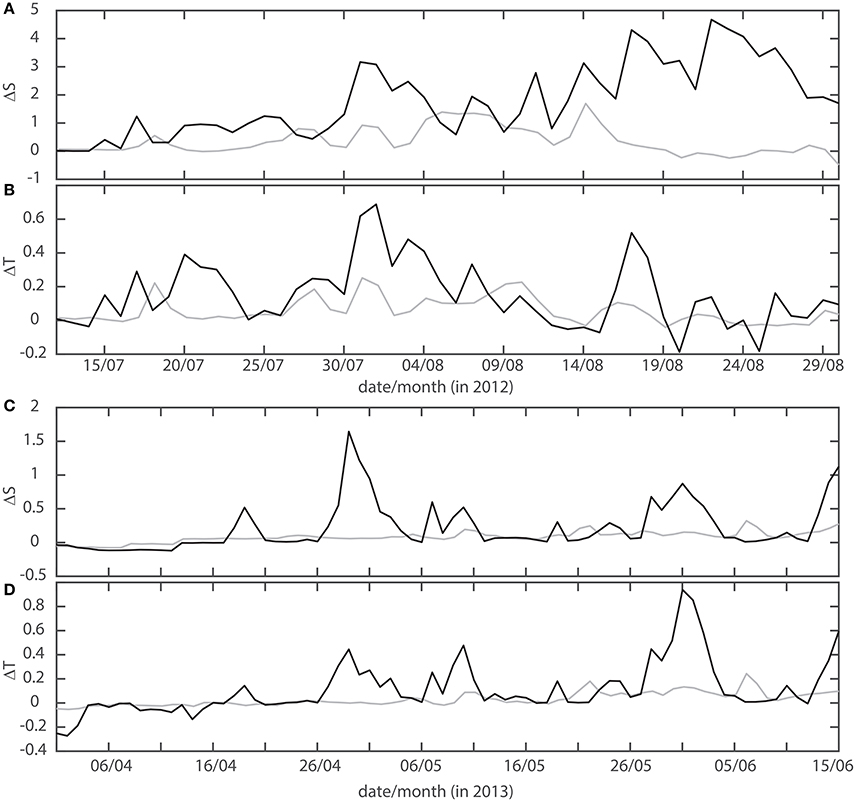
Figure 3. Time series of salinity and temperature gradients over the upper 5 m for July to August 2012 (A,B) and April to June 2013 (C,D). WilsonB and Waiheke are black and gray lines, respectively.
There were three events during winter 2012 when temperature gradients were 0.4 and 0.7°C in the upper water column at WilsonB (Figure 3B). Temperature responses were more distinct than surface salinity for the same events (i.e., 14 August, Figure 3B). Water column gradients were weaker at Waiheke and were always less than 0.2°C. Observable peaks seen in ΔT from both sites mostly occurred at the same date and month, albeit with stronger gradients at WilsonB.
Weaker surface gradients were evident during autumn 2013 at WilsonB. Five occurrences of ΔS larger than 0.5 psu occurred over the autumn period of 1 April to 15 June (Figure 3C). These tended to be short-lived events of 1–2 days. Maximum differences in salinity were 1.7 psu on 30 April, with corresponding ΔT of 0.4°C at WilsonB (Figures 3C,D). Signals in salinity and temperature were very weak at Waiheke for the same time period.
As thermistors were deployed at 12.5 m and near-bed, vertical gradients of the entire water column, to 17 m, were observed (data not shown). During winter (at least in 2012) temperature gradients over the top 5 m (Figure 3B) dominated the temperature variability at Waiheke and WilsonB. The same was observed during autumn 2013 with weak vertical gradients over the water column. Vertical temperature gradients were largest, unsurprisingly, during mid-summer when surface heating enhances vertical stratification in the Firth-HG system (Zeldis et al., 2004).
Dominant timescales over the year were determined in the frequency domain for surface and near-bed ADCP observations (Figure 4). Semidiurnal and diurnal peaks were present in all PSD. As were the spring-neap (14.6 h) and lunar (27 d) cycles. Of note, were the relative quantities of energy in the water column between the 12 h and 14.6 d spectral peaks. There was close to an order of magnitude less energy in near-bed PSD compared to surface currents at WilsonB. Broadly, WilsonB had slightly more energy than Waiheke for the same time period. The other key difference at WilsonB was the separation of higher frequency energy between the near-bed and surface flows consistently over the 12 months (Figure 4A).
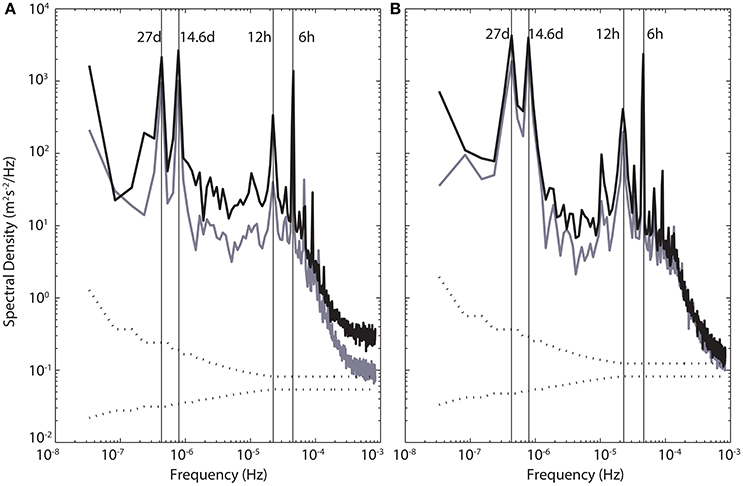
Figure 4. Power spectral density from (A) WilsonB and (B) Waiheke from 1 m above bed (gray line) and near surface ADCP bins (black line).
4.2. Salinity Responses after Discharge Events
Three discharge events during 2012-13 were identified to evaluate buoyancy and momentum responses within the inner Firth ROFI (arrows, Figure 2). An obvious starting place was the largest discharge event during August 2012. Two other events were considered relevant. The first freshwater buoyancy input for the winter during July 2012. The third discharge event was from October 2013 when discharges coincided with the timing of biophysical responses in the system (i.e., Zeldis et al., 2004) and persistent spring winds (Figures 2A,B).
Available salinity observations from the three events are shown in Figure 5. An examination of surface salinity during what was essentially the “first” discharge event for the Austral winter showed large changes in salinity. Salinity decreased from 34.2 to 31.3 psu in 4 h on July 16. An absence of tidal oscillations (microcat at 1 m) was observed for several tidal cycles after low salinity water was first noted at WilsonB (Figure 5A). Smaller changes were seen at Waiheke ~0.5 day later with salinity freshening from 34 to 33.2 psu.
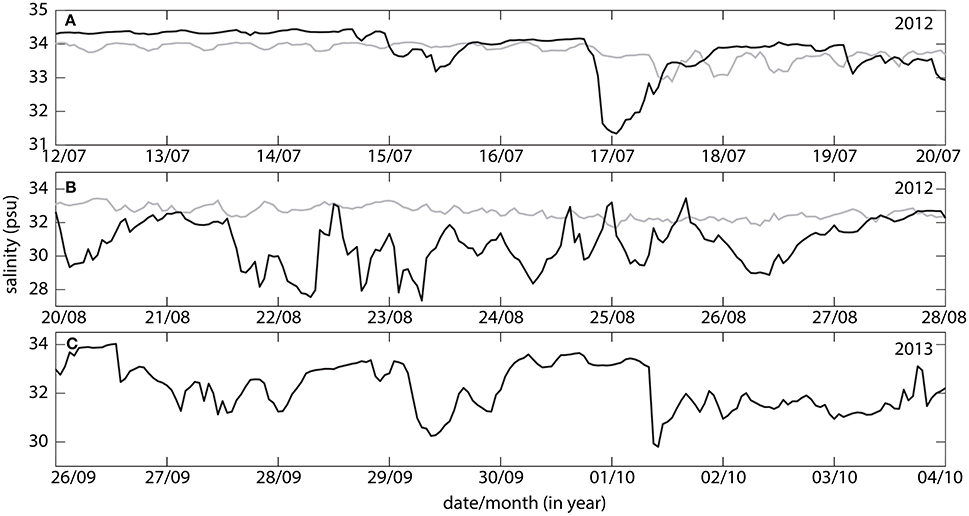
Figure 5. Surface salinity for 8 days during (A) July 2012, (B) August 2012, and (C) October 2013 at WilsonB (black line) and Waiheke (gray line). Arrows in Figure 2 show the timing of the three events. Note that a mooring was not redeployed at Waiheke during October 2013.
The freshest surface salinity of 28 psu occurred on 22 August at WilsonB (Figure 5B). The presence of low salinity water was short-lived and 4 h later salinity had increased to 33.1 psu. Tidal modulation of the fresh surface water meant low salinities were seen again on 23 August, and to a lesser extent on 24 August, at the WilsonB mooring. The vertical scale in Figure 5B masks the extent of low salinity observed at Waiheke. A pulse of lower salinity water was observed as a decrease from 32.8 to 30.9 psu over several hours on 22 August (Figure 5B). Rather than large salinity oscillations at tidal frequencies, salinity at Waiheke gradually became more saline on each subsequent tidal cycle.
Surface salinity in early October 2013 remained responsive to river inflows. For example, on 1 October salinity decreased rapidly from 33.3 to 29.5 psu at WilsonB (Figure 5C). Although the duration of the response was short-lived at less than a day, the subsequent surface salinity until 4 October remained 1 psu fresher than before the discharge event.
Cross-correlation of surface salinity between WilsonB and Waiheke over the 12 months was 0.62. The subsurface (5 m) correlation of salinity between the two sites was significantly lower at 0.26. The reverse pattern occurred for temperatures at WilsonB and Waiheke; higher correlation at 5 m (0.84) than for near-surface temperatures (0.70) over same time frame.
4.3. Flows in the ROFI Mid-field
Current observations from the ADCP at WilsonB were rotated into longitudinal and transverse components of flow for the period 20 July to 28 August, 2012 (Figures 6A,B). Currents were rotated toward 345°. Being longer than a month, the role of the lunar month on current speeds was observed as higher currents in the transverse flows around 22 July, and again near 21 August. The majority of variations in currents were, however, in the longitudinal direction at frequencies greater than either the lunar, or spring-neap cycles. Faster currents associated with spring tidal ranges occurred on 22 July, 7 and 21 August 2012.
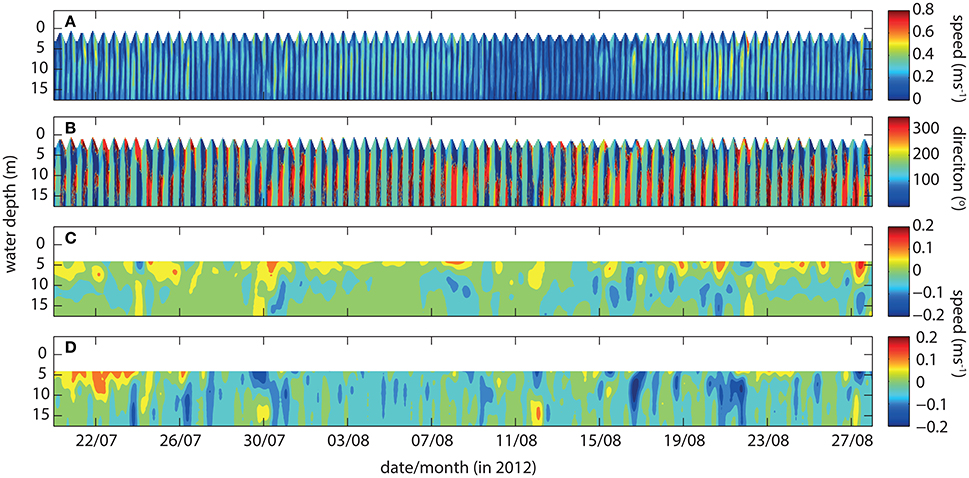
Figure 6. ADCP observations from WilsonB showing (A) current speed, (B) current direction and low-pass filtered currents in (C) for u-direction, and (D) v-direction.
Stronger currents were observed flowing out of the Firth (longitudinal currents > 0, Figure 6A) near to 30 July, 8 and 20 August. Near-surface longitudinal currents were between 0.2 and 0.26 ms−1 for each of these three time periods. Faster flows were evident down to 12 m on 30 July, while only a thinner layer (5 m) of faster flows occurred on 8 August.
Residual flows for the equivalent time period broadly followed the estuarine paradigm of landward flows near the seabed and seaward directed flows in the surface (Figure 6C). The magnitude of the residual flows were up to 50% of the mean currents after discharge events in the Firth. Large variability in both speed and direction of residuals was also evident. For example, on 21 August faster residuals of 0.24 ms−1 occupied the top 10 m and were directed out of the Firth. Immediately after this event residual flows were directed into the Firth at speeds of 0.13 ms−1 for 2 days.
Year-long mean residual speeds were ~0.01 ms−1, but vertical differences in current direction was distinct for two sites (Figures 7A,B). Over the top 5 m, mean flow was seawards and landwards at Waiheke and WilsonB, respectively. Residuals over the lower 12 m were in opposite direction to surface flows. A 38-day average for the winter and summer seasons dissected residual flows further. The averaging duration was used to match available density observations at the mooring sites. Winter profiles were similar for WilsonB and Waiheke, but the former had relatively strong outflows (0.04 ms−1) over the top 10 m and the latter had landward directed weak residuals. At Waiheke, the mean summer profile closely resembled the annual residual profile. Surface flows at WilsonB were directed landwards over the top 12 to 14 m during summer. Over the year and both seasons, near-bed residuals were seaward at 0.016 to 0.024 ms−1.
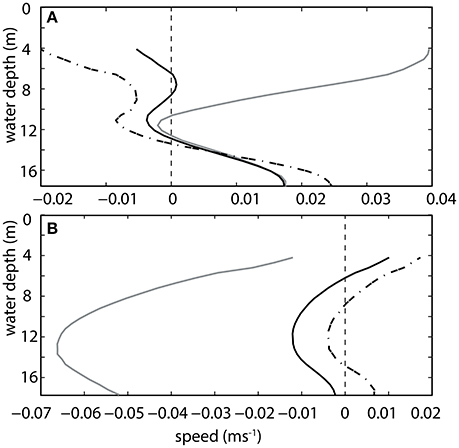
Figure 7. Residual currents in the longitudinal direction at (A) WilsonB and (B) Waiheke for 12-months of ADCP observations (thick black line) and for a 38-day period in summer (dot-dashed line) and winter (thick gray line).
4.4. Near-Field Heterogeneity
Five drifters were deployed along the 5 m isobath at the SE end of the Firth. Resultant drifter tracks after 20 h are shown in Figure 8. Net horizontal displacement was 9.2 km seawards for three of the drifters. Drifter tracks were aligned with the axis of the Firth (i.e., NW-SE direction) and the westernmost deployment location of a drifter the greater the likelihood that the drifter continued west. The exception to these trajectories was at the eastern and western margins of the Firth when each drifter (numbers 1 and 5, Figure 8) made no horizontal progress over the deployment period.
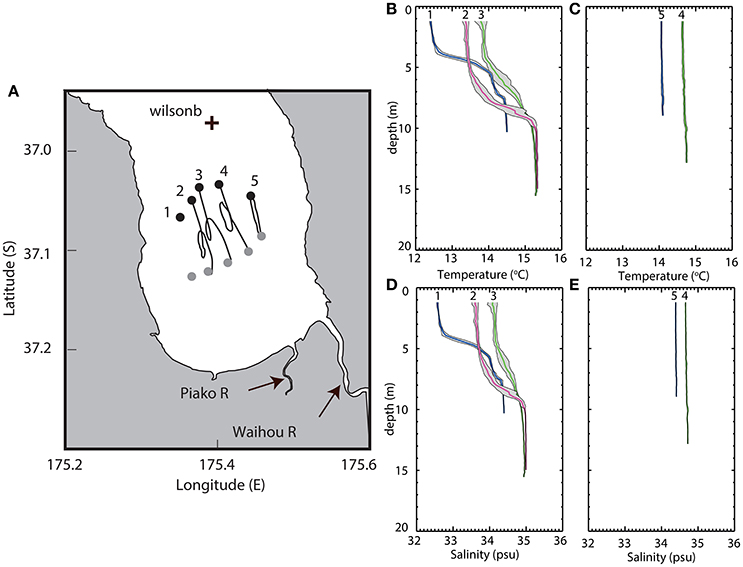
Figure 8. Drifter tracks and scamp profiles in the Firth from June 14 to 15, 2012. Drifter tracks are shown in (A) along with deployment (gray) and recovery (black) locations. Numbering 1–5 corresponds to scamp profiles of temperature and salinity shown in (B–E) from drifter recovery locations. Note that GPS data was not recovered from the western-most drifter.
Three repeat profiles from the scamp profiler were obtained at each of the drifter recovery locations and (annotated by 1–5 in Figure 8A). Vertical salinity and temperature stratification was observed at the three western site (sites 1 to 3, Figures 8B,C). Top-to-bottom salinity gradients were between 0.2 and 1.8 psu, with the largest vertical gradient observed at site 1. The surface salinity, 32.6 psu, occupied the top 4 m with a pycnocline spanning 4–6 m. Salinity was between 34 and 34.4 psu over the remaining lower 4 m of the water column. Partitioning of temperature stratification was observed at the same depths with a top-to-bottom range of 12.4–14.5°C.
Profiles from sites 2 and 3 were also stratified, albeit with weaker vertical gradients than site 1. There was an absence of a distinct surface layer with the lowest salinity of 33.6 and 34.2 psu at sites 2 and 3, respectively (Figure 8C). Surface temperatures were 1 and 1.5°C warmer. Sites 1 and 2 had a 2°C vertical temperature gradient. Vertical density gradients were essentially negligible at sites 4 and 5 (Figures 8D,E). Salinity was 34.5 and 35 psu through the water column, respectively for the two western sites. Corresponding homogeneous temperature profiles were 14.2 and 14.8°C.
4.5. Energy Coherence of Dominating Processes
The spectral cross-wavelet power (XWT) between near-surface rotated currents and wind speed at WilsonB are shown in Figure 10A. The largest common power between wind speed and surface currents was observed at periods of 0.125 day (3-hourly) or less (Figure 10A). The strong coherence persisted for the duration of the year-long ADCP deployment. Coherence was often, but not always, observed at 1-day intervals during the Austral spring and summer. Coherence at longer periods of 2–8 days were evident during the Austral spring. During this window of XWT wind forcing preceded near-surface currents by 90°. Later in the annual cycle (i.e., during November 2012) coherent oscillations were observed at the 8–16 day time period with the two signals in-phase.
Equivalent XWT for near-surface currents and salinity are shown in Figure 10B. Coherence was evident at the 0.25 and 0.5 day periods. Curiously, these occurrences were not co-located temporally over the annual cycle indicating the coherence was not solely related to tidal oscillations and associated harmonics. The longest occurrences when salinity and currents were coherent occurred during the Austral winter and then again in May 2013 (Figure 10B). Coherence persisted for nearly 2 months and spanned the 16–32 day period.
5. Discussion
Using moorings with a surface expression, responses of buoyant river outflows were examined in a gulf-ROFI. Over the period from 1966 to 2008 there were only 4 years when river discharges exceeded 200 m3s−1 in the Waihou river (Franklin and Booker, 2009). Thus, observations during 2012-13 when maximum discharge was 274 m3s−1 are representative of the Firth ROFI response during high discharge years. The most similar system, in scale and mechanics, is Ise and nearby Bays on the SE side of Japan (Fujiwara et al., 1997). An important distinction being the smaller magnitudes of freshwater discharges into the Firth ROFI, which has meant that vertical and horizontal density gradients have, until now, been assumed to be negligible.
5.1. Annual Cycle
Inputs of buoyant river flows freshen surface waters by up to 18% in the inner Firth. The coherence between the two signals is poor (i.e., 0.12 at WilsonB) but expected given the relatively few peaks and absence of periodicity in the forcing signal in a single year. Nonetheless, qualitative estimates of lags between riverine forcing are ROFI response were estimated to evaluate how long riverine material may be present in the system. Lags of ~4 and 7 days were consistent for Waiheke and WilsonB, respectively for the three events in 2012–13. Lag estimates from the river source to mid-field region closely match advection timescales when using a mean residual flow speed of 0.05 ms−1. Upstream discharges are only sampled daily so limit sub-daily lag estimates. Stronger residual flows at WilsonB during winter would potentially reduce the time from river source to mid-field ROFI by about 1 day. Conversely, during summer with faster landward residuals, buoyant river flows and associated suspended material would have a longer residence time in the Firth ROFI.
Landward propagating boundary layer intrusions are evident at the shallow Firth in the Austral summer and autumn. During these months, temperature stratification dominates in the system and is regulated by surface heating. Tidal modulation of density is mostly linear and relates to tidal stage, i.e., the stratified water column oscillates uniformly with each tidal cycle. There are a number of occurrence during autumn when density between the upper and lower water column are disconnected. For example, increased temperatures over the ebb tide are observed at the surface while the lower water column shows a decrease in temperature over multiple tidal cycles. This behavior is most clearly captured by larger near-bed residual flows (Figure 6). Fluctuations between upwelling and downwelling conditions during the summer months occur in outer Hauraki Gulf (Zeldis et al., 2004), which has elsewhere been associated with up-slope propagation of bottom boundary layers (i.e., Perlin et al., 2005). The presence of near-bed landward intrusions of homogeneous density oceanic water are important when evaluating exchange processes controlling material transport. Frequency estimates of boundary layer intrusions could come from wind stress that is partly responsible for upwelling/downwelling.
Buoyancy forcing is certainly not the only process regulating higher surface energy in the Firth (Figure 4). Wind mixing is the other key process responsible for material transport. Surface forcing by wind stress is difficult to disentangle in PSD since barotropic wind lies in both the low frequency weather band and sub-daily variability at higher frequencies. Evidence from residual flows (Figure 7) show distinct seasonal responses of the upper water column. Momentum fluctuates from strongly seaward buoyancy-modulated flows in winter to landwards flows by along-axis wind forcing in summer. Similarities between the summer and annual mean residual profiles highlight the dominance of wind forcing in surface momentum during all months except winter.
5.2. Discharge Events and their Cumulative Impact
Near-field plume behavior is constrained to within several km of discharges in the SE Firth. Once water depths exceed 5 m, numerical modeling indicates that buoyant outflows meander primarily along the western margin of the Firth (Hadfield and Rickard, 2014). Drifter deployments to evaluate the lagrangian model output were inconclusive due the short duration of the experiment. Associated profiling does, however, confirm aspects of ROFI behavior observed by Hadfield and Rickard (2014). Lateral heterogeneity is observed in the near-field; from strongly stratified in the western and central profiles that transition to well-mixed in the eastern inner Firth (Figures 8B–E). Notably, lateral density gradients are evident prior to any substantial buoyant winter inflows. Near-field plume thickness is 2 m for negligible river inflows. No equivalent profiles in the near-field exist during higher discharges, but CTD profiles from the mid-field mooring recoveries in winter suggest that plume thickness is typically 3 m or shallower.
Equivalent sized discharge events into the Firth cause different responses in the ROFI mid-field region (at WilsonB). A key difference is the strength of ambient stratification. Early in winter when ∂ρ/∂z is weak tidal oscillations in the near-surface are damped by the strong seaward advection (0.1 ms−1) of buoyant river water. Without antecedent density gradients to modulate surface buoyancy residual flows are stronger and modify flows further down in the water column (i.e., residual flows down to 10 m that persist locally for 5 days, Figure 6). Large discharges do not necessarily generate the strongest momentum response. Despite the discharges from the August event being the largest observed, the temporal extent of stronger currents was reduced, largely to stronger ∂ρ/∂z over the upper water column. Responses to discharge events at Waiheke are weaker and shorter than at WilsonB, and buoyancy and momentum tend to return to well-mixed, oscillatory conditions within several tidal cycles after an event.
Categorizing water properties using a T-S diagram is not common in coastal systems due to their dynamic nature (Figure 9). It is used here to evaluate connectivity of the inner Firth. The transition away from time-series observations allowed profiles to collapse to three categories: ROFI water (S <33 psu, T <13.5°C), ambient coastal waters and “Sandspit Channel water.” The latter waters in the vicinity of Sandspit Channel have a distinct T-S signature (S ~ 34.6 psu, T ~ 13.8°C, group c, Figure 9). The shallow region is either a blocking feature between the Firth and Waiheke region, or the response time to stirring is longer than at either Wilson B given its relatively cold yet saline signature. Correlations of subsurface temperature (0.62) suggest the inner Firth sites are better connected in summer when heating and subsurface processes are relatively uniform.
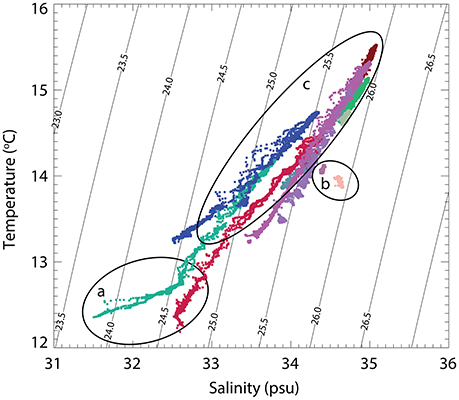
Figure 9. Temperature-salinity diagram of all scamp profiles from the Firth during June 2012. T-S properties were grouped into (a) ROFI water, (b) ambient coastal water, and (c) Sandspit channel watere.
Stratification is regulated by surface salinity from discharge events for around 2–4 months of the year. Advection is also modified at the event timescale in the form of stronger seaward residuals. Do these events matter when evaluating how the ROFI system behaves at seasonal, annual and longer timescales? Using time-frequency correlations between forcing processes and in situ dynamics shows that discharge events modify momentum for periods of 0.5–1 month, several orders of magnitude larger than the event timescale of several days (Figure 10). Wavelet analysis reiterates that high-frequency wind forcing is a quasi-permanent processes regulating surface flows at frequencies of several hours.
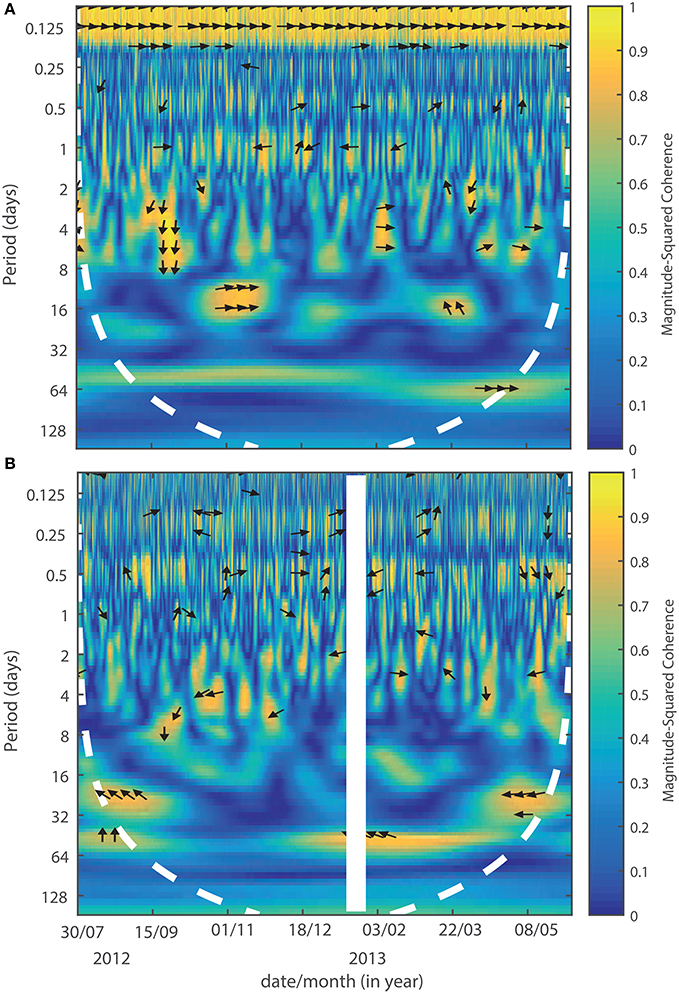
Figure 10. Spectral cross-wavelet power (A) between surface current speed (U, ms−1) and wind speed ms−1 and (B) between surface current speed (U, ms−1) and river discharges (m3s−1). The white dashed lines indicate coherent oscillations at significance level of P < 0.05, and the arrows indicate the relative phase relationship between series in a portion of the time domain (right = in-phase, left = anti-phase, down = first series leads the second by 90°).
5.3. Event Influences on Material Transport?
The motivation here was to better understand river responses since (relatively) small discharges events can transport disproportionate quantities of land-derived POC to the ocean. The response of events has found that vertical density gradients vary in the ROFI mid-field after transient discharge events with non-linear responses between density gradients and discharge rates. Advection is modified at depths greater than plume thickness (<3 km) and for a longer duration than discharge event timescales. But what does this mean for evaluating land-sea sediment or POC transport. Using the concept of effective discharge, Qe, introduced by Wheatcroft et al. (2010) along with equation 3 and relevant empirical values Qe estimates for sediment and POC from the Waihou river were 51 m3s−1 and 49 m3s−1, respectively. Absolute values are smaller than nearby Waipaoa River (Wheatcroft et al., 2010) but the ratio is high suggesting that the effective discharge of POC comprises the majority of sediment delivery to the Firth. Estimates are only for the 2012–13 discharges and requires a longer time series to compare to other systems forced by small mountainous rivers.
Conceptually, buoyant rivers transport suspended land-derived material seaward in surface waters. Material mixes and settles at various points along the plume trajectory. Time-varying events can account for a two-fold increase in residual flows, and are far larger than the 10% typically attributed to residual flows in stratified estuaries (Dyer, 1997). Faster residuals, combined with dynamics being modified for significantly longer (months) than the event itself (days) highlights the need to incorporate transient discharges into conceptual and numerical models to accurately represent physical dynamics and associated material transport in ROFI and coastal systems.
5.4. Data Sharing
Mooring observations used in this manuscript are available from the NIWA data archive.
Author Contributions
JØ contributed to the observational design, field work, data analysis, and was primarily responsible for writing the paper. CS contributed to field work, data analysis, and contributed to writing the paper.
Conflict of Interest Statement
The authors declare that the research was conducted in the absence of any commercial or financial relationships that could be construed as a potential conflict of interest.
Acknowledgments
This research was funded by NIWA under Coasts and Oceans Research Programme 1 (2013/14 SCI). The authors wish to thank Dave Bremner, Rod Budd, and Brett Grant for their technical expertise in the collection of these observations.
References
Chiswell, S., Bostock, H. C., Sutton, P. J. H., and Williams, M. J. M. (2015). Physical oceanography of the deep seas around New Zealand: a review. NZ J. Mar. Fresh. Res. 49, 286–317. doi: 10.1080/00288330.2014.992918
Black, K. P., Bell, R. G., Oldman, J. W., Carter, G. S., and Hume, T. M. (2000). Features of 3-dimensional barotropic and baroclinic circulation in the Hauraki Gulf, New Zealand. NZ J. Mar. Fresh. Res. 34, 1–28. doi: 10.1080/00288330.2000.9516912
Emery, W. J., and Thomson, R. E. (2001). Data Analysis Methods in Physical Oceanography, 2nd Edn. Amsterdam. Elsevier Science.
Franklin, P. A., and Booker, D. J. (2009). Flow Regime Requirements for Instream Ecology in the Waihou River catchment. NIWA Client Report No. HAM 2009-089, 176.
Fujiwara, T., Sanford, L. P., Nakatsuji, K., and Sugiyama, Y. (1997). Anti-cyclonic circulation driven by the estuarine circulation in a gulf type ROFI. J. Mar. Syst. 12, 83–99. doi: 10.1016/S0924-7963(96)00090-5
Garvine, R. W. (1987). Estuary plumes and fronts in shelf waters: a Layer model. J. Phys. Ocean 17, 1877–1896. doi: 10.1175/1520-0485(1987)017<1877:EPAFIS>2.0.CO;2
Garvine, R. W. (1995). A dynamical system for classifying buoyant coastal discharges. Cont. Shelf Res. 15, 1585–1596. doi: 10.1016/0278-4343(94)00065-U
Geyer, W. R., Signell, R. P., Fong, D. A., Wang, J., Anderson, D. M., and Keafer, B. A. (2004). The freshwater transport and dynamics of the western Maine coastal current. Cont. Shelf Res. 24, 1339–1357. doi: 10.1016/j.csr.2004.04.001
Goni, M. A., Hatten, J. A., Wheatcroft, R. A., and Borgeld, J. C. (2013). Particulate organic matter export by two contrasting small mountainous rivers from the Pacific Northwest, USA. J. Geophys. Res. Biogeosci. 118, 112–134. doi: 10.1002/jgrg.20024
Grinsted, A., Moore, J. C., and Jevrejeva, S. (2004). Application of the cross wavelet transform and wavelet coherence to geophysical time series. Non linear Proc. Geophys. 11, 561–566. doi: 10.5194/npg-11-561-2004
Hadfied, M., and Rickard, G. (2014). Recent ROMS Applications at Ocean, Shelf and Coastal Scales Around New Zealand. Poster Presentation at Australian Coastal and Oceans Modelling and Observations Workshop, October 2014. Available online at: http://imos.org.au/fileadmin/user_upload/shared/IMOS/General/ACOMO/ACOMO_2014/presentations/posters/ACOMO_2014_Hadfield_poster.pdf (Accessed January 9, 2017).
Hetland, R. D. (2005). Relating river plume structure to vertical mixing. J. Phys. Oceanogr. 35, 1667–1688. doi: 10.1175/JPO2774.1
Horner-Devine, A. R., Fong, D. A., and Monismith, S. G. (2008). Evidence for the inherent unsteadiness of a river plume: satellite observations of the Niagara River discharge. Limnol. Oceanogr. 53, 2731–2737. doi: 10.4319/lo.2008.53.6.2731
Horner-Devine, A. R., Hetland, R. D., and MacDonald, D. G. (2015). Transport and mixing in coastal river plumes. Annu. Rev. Fluid Mech. 47, 569–594. doi: 10.1146/annurev-fluid-010313-141408
Kasai, A. (2014). Hypoxia controlled by hydrodynamics. Aqua-BioScience Monogr. 7, 117–145. doi: 10.5047/absm.2014.00704.0117
Kasai, A., Fujiwara, T., Simpson, J. H., and Kakehi, S. (2002). Circulation and cold dome in a gulf-type ROFI. it Cont. Shelf Res. 22, 1579–1590. doi: 10.1016/S0278-4343(02)00022-5
Kasai, A., Hill, E., Fujiwara, T., and Simpson, J. H. (2000). Effect of the Earths rotation on the circulation in regions of freshwater influence. J. Geophys. Res. 105, 16961–16969. doi: 10.1029/2000JC900058
Kilcher, L. F., Nash, J. D., and Moum, J. N. (2012). The role of turbulence stress divergence in decelerating a river plume. J. Geophys. Res. 117:C05032. doi: 10.1029/2011JC007398
Li, C., Valle-Levinson, A., Atkinson, L., Wong, K. C., and Lwiza, K. (2004). Estimation of drag coefficient in James River Estuary using tidal velocity data from a vessel-towed ADCP. J. Geophys. Res. 109:C03034. doi: 10.1029/2003JC001991
O'Callaghan, J., and Stevens, C. (2011). “Wind stresses on estuaries,” in Treatise on Estuarine and Coastal Science, Vol. 2, eds E. Wolanski and D. S. McLusky (Waltham: Academic Press), 151–169.
Officer, C. B. (1976). Physical Oceanography of Estuaries (and Associated Coastal Waters). New York, NY: John Wiley and Sons, Inc.
Perlin, A., Moum, J. N., and Klymak, J. M. (2005). Response of the bottom boundary layer over a sloping shelf to variations in alongshore wind. J. Geophys. Res. 110:C10S09. doi: 10.1029/2004JC002500
Ruddick, A., Anis, A., and Thompson, K. (2000). Maximum likelihood spectral fitting: the Batchelor spectrum. J. Atmos. Ocean. Tech. 17, 1541–1555. doi: 10.1175/1520-0426(2000)017<1541:MLSFTB>2.0.CO;2
Sharples, J. (1997). Cross-shelf intrusion of subtropical water into the coastal zone of northeast New Zealand. Cont. Shelf Res. 17, 835–857. doi: 10.1016/S0278-4343(96)00060-X
Sharples, J., and Greig, M. J. N. (1998). Tidal currents, mean flows, and upwelling on the north-east coast of New Zealand. NZ J. Mar. Fresh. Res. 32, 215–231. doi: 10.1080/00288330.1998.9516821
Sharples, J., Moore, C. M., and Abraham, E. R. (2001). Internal tide dissipation, mixing, and vertical nitrate flux at the shelf edge of NE New Zealand. J. Geophys. Res. 106, 14069–14081. doi: 10.1029/2000JC000604
Simpson, J. H. (1997). Physical processes in the ROFI regime. J. Mar. Syst. 12, 3–15. doi: 10.1016/S0924-7963(96)00085-1
Snelder, T., Biggs, B., and Weatherhead, M. (2004). New Zealand River Environment Classification User Guide. Auckland: Ministry for the Environment.
Stacey, M. T., Rippeth, T. P., and Nash, J. D. (2011). “Turbulence and stratification in estuaries and coastal seas,” in Treatise on Estuarine and Coastal Science, vol. 2, eds E. Wolanski and D. S. McLusky (Waltham, MA: Academic Press), 9–36. doi: 10.1016/B978-0-12-374711-2.00204-7
Torrence, C., and Compo, G. P. (1998). A practical guide to wavelet analysis. Bull. Am. Meteorol. Soc. 79, 61–78. doi: 10.1175/1520-0477(1998)079<0061:APGTWA>2.0.CO;2
Wheatcroft, R. A., Goni, M. A., Hatten, J. A., Pasternack, G. B., and Warrick, J. A. (2010). The role of effective discharge in the ocean delivery of particulate organic carbon by small, mountainous river systems. Limnol. Oceanogr. 55, 161–171. doi: 10.4319/lo.2010.55.1.0161
Yankovsky, A. E., and Chapman, D. C. (1997). A simple theory for the fate of buoyant coastal discharges. J. Phys. Oceanogr. 27, 1386–1401. doi: 10.1175/1520-0485(1997)027<1386:ASTFTF>2.0.CO;2
Keywords: stratification, river plumes, ROFI, residual circulation, transport, hypoxia
Citation: Ø'Callaghan JM and Stevens CL (2017) Evaluating the Surface Response of Discharge Events in a New Zealand Gulf-ROFI. Front. Mar. Sci. 4:232. doi: 10.3389/fmars.2017.00232
Received: 13 March 2017; Accepted: 10 July 2017;
Published: 26 July 2017.
Edited by:
Sandro Carniel, Consiglio Nazionale Delle Ricerche (CNR), ItalyReviewed by:
Francesco Marcello Falcieri, Istituto di Scienze Marine (CNR), ItalyJosé Pinho, University of Minho, Portugal
Copyright © 2017 Ø'Callaghan and Stevens. This is an open-access article distributed under the terms of the Creative Commons Attribution License (CC BY). The use, distribution or reproduction in other forums is permitted, provided the original author(s) or licensor are credited and that the original publication in this journal is cited, in accordance with accepted academic practice. No use, distribution or reproduction is permitted which does not comply with these terms.
*Correspondence: Joanne M. Ø'Callaghan, joanne.ocallaghan@niwa.co.nz