Metabarcoding Reveals Seasonal and Temperature-Dependent Succession of Zooplankton Communities in the Red Sea
 Laura Casas
 John K. Pearman
 Xabier Irigoien
- Division of Biological and Environmental Science & Engineering, Red Sea Research Center, King Abdullah University of Science and Technology, Thuwal, Saudi Arabia
Very little is known about the composition and the annual cycle of zooplankton assemblages in the Red Sea, a confined water body characterized by a high biodiversity and endemism but at the same time one of the most understudied areas in the world in terms of marine biodiversity. This high diversity together with the lack of references for several of the groups poses a problem in obtaining basic information on zooplankton seasonal patterns. In the present work, we used high throughput sequencing to examine the temporal and spatial distribution of the zooplankton communities inhabiting the epipelagic zone in the central Red Sea. The analysis of zooplankton assemblages collected at two sites—coastal and offshore—twice a month at several depth strata by using MANTA, Bongo and WP2 nets provides baseline information of the seasonal patterns of the zooplankton community over 1 year. We show that the seasonal fluctuation of zooplankton communities living in the upper 100 m of the water column is driven mainly by the annual changes in seawater temperature. The 18S rRNA gene was used for metabarcoding of zooplankton assemblages revealing 630 metazoan OTUs (97% similarity) in five phyla, highlighting the richness of the Red Sea community. During colder months, communities were characterized by lower richness and higher biomass than communities found during the hot season. Throughout the year the zooplankton communities were dominated by the class Maxillopoda, mainly represented by copepods and class Hydrozoa. The rise in the water temperature favors the appearance of classes Malacostraca, Cephalopoda, Gastropoda, and Saggitoidea. The present study provides essential baseline information for future monitoring and improves our knowledge of the marine ecosystem in the Red Sea while reporting the main environmental variable structuring zooplankton assemblages in this region.
Introduction
The zooplankton community acts as a link for the transfer of energy and material from protists to the higher trophic levels and has a pivotal role in the recycling and export of nutrients (Valiela, 1995; Mitra et al., 2014). Hence, zooplankton plays a key role in marine food webs and biochemical cycles.
While zooplankton communities inhabiting temperate regions have been widely studied (e.g., Beaugrand, 2002; Siokou-Frangou et al., 2010), some regions in the tropics, such as the Red Sea remain under studied. This is despite the fact that this regions exhibit an unparalleled diverse array of species. The Red Sea is considered unique in terms of its distinctive physico-chemical conditions that include year-round high levels of irradiance, high temperature and salinity levels, and low nutrient concentrations (Acosta et al., 2013; Raitsos et al., 2013). Moreover, it harbors a unique fauna characterized by one of the highest levels of endemism for marine organisms in the world (DiBattista et al., 2016). Historically access to the main body of the Red Sea has been limited and as a consequence whole community studies of zooplankton are scarce and very little is known about the composition and the annual cycle of zooplankton communities in this marine environment.
The few studies that have addressed the analysis of zooplankton communities in the Red Sea were mostly conducted in the Northern region, particularly in the Gulf of Aqaba (e.g., Echelman and Fishelson, 1990; El-Sherbiny et al., 2007; Dorgham et al., 2012). Moreover, the majority have been focused on isolated taxonomic groups (e.g., foraminiferans; Almogi-Labin, 1984, microcopepods; Bottger-Schnack et al., 2001, holoturoids; Yuval et al., 2014, or tunicates; Godeaux, 1978). Although, a handful of studies have been recently undertaken in the central Red Sea (e.g., Pearman and Irigoien, 2015), up to date basic information such as the annual succession on the community composition remains unknown.
However, studies of zooplankton assemblages in the Red Sea are especially relevant now, since this harsh tropical environment mimics conditions of future climate change scenarios which are likely to occur in the euphotic zone of the world's oceans (Behrenfeld et al., 2006). Predicted future ocean environmental conditions are already naturally present in the Red Sea basin and thus this environment represents a unique opportunity to shed light on how zooplankton communities might change in the following decades in other marine environments around the globe.
In addition, species living in warm tropical climates, traditionally considered aseasonal environments, might be particularly vulnerable to increases in temperature due to their limited acclimation capacity (Hoegh-Guldberg et al., 2007; Tewksbury et al., 2008). Ectothermal organisms in the tropics are expected to be adapted to a relatively narrow range of temperatures and live constantly close to their upper thermal limits and may therefore be more vulnerable to warming seas (Ghalambor, 2006). The proximity of animals to their thermal limits, coupled with their potential to acclimatize to future environmental conditions, will greatly influence how zooplankton community structures are reshaped as the climate changes (Stillman, 2003; Somero, 2012).
For all these reasons, it is important to obtain baseline information of the relatively unexplored Red Sea ecosystem (Cantin et al., 2010).
Molecular techniques offer the possibility to simplify the analysis of marine zooplankton communities by allowing simultaneous assessment of the whole community without the need for specific experts in morphological taxonomy of each taxon. Additionally, the molecular identification is more objective and reliable for the identification of larval and juvenile stages, which are difficult to differentiate morphologically, even by experts. Although metagenetic approaches have been developed primarily for microbial community analysis (Margulies et al., 2005), some recent studies demonstrated their suitability for the study of species richness in metazoans (Porazinska et al., 2009; Hajibabaei et al., 2011) including macroinvertebrates (Carew et al., 2013) and zooplankton communities (Lindeque et al., 2013; Pearman and Irigoien, 2015). This emerging metagenetic approach using deep sequencing is becoming an effective tool for rapid and comprehensive assessment of zooplankton community structure (reviewed in Bucklin et al., 2016).
In the present work, we examined the temporal and spatial distribution of the zooplankton community inhabiting the epipelagic zone in the central Red Sea for 1 year. The species composition and biomass of zooplankton assemblages was investigated in relation to hydrological conditions at two study areas off the coast of Thuwal (Saudi Arabia), an inshore (50 m depth) and an offshore station (~500 m depth). The nuclear-small subunit (18S) rRNA was characterized using amplicon pyrosequencing of 154 samples collected throughout the year 2013. The aim of this study was to shed light on the seasonal cycle of zooplankton communities inhabiting one of the most understudied areas in the world in terms of marine biodiversity. The Red Sea is a harsh tropical environment that mimics conditions of future climate change scenarios, thus obtaining baseline information on zooplankton community structures is essential not only to monitor the reshaping of the communities as the temperatures increase but also provides a unique opportunity to predict how zooplankton communities might change in the following decades in other marine environments around the globe.
Methods
Biological Sample Collection
Zooplankton sampling was carried out from January 2013 to December 2013 on a twice per month schedule, over two stations situated on the continental shelf off the Saudi Arabian coast in the central Red Sea (offshore station: N22°31′21.08″, E38°99′48.54″; inshore station: N22°18′46.08″, E38°55′41.70″; Figure 1). The offshore station was located in an open deep water area with a depth of over 500 m, while the inshore station was located in a coastal reef-habitat with a depth of 60 m. Samples from several depth strata were collected along two transects parallel to the coast by using MANTA, Bongo and WP2 nets. The MANTA trawl with an inlet aperture of 50 × 15 cm, was fitted with a net of mesh size 150 μm. The Bongo and WP2 nets, with a 60 and 50 cm diameter aperture respectively, were fitted with nets of mesh size 150 μm with 50 μm cod end and 200 μm with a 50 μm collector respectively. The MANTA net was trawled for 10 min at 2 knots only at the offshore station to collect surface samples. The Bongo net was towed obliquely from 50 m depth to the surface and horizontally at 20 m depth for 10 min both offshore and inshore. The WP2 was hauled vertically to the surface from 100 and 50 m depth respectively at the offshore and inshore stations. Flow rate was monitored using a digital flow meter (model 23.090, KC Denmark, Silkeborg, Denmark) mounted on the mouth aperture of the samplers, while the hydrological parameters were simultaneously recorded using a CTD profiler (Idronaut Ocean Seven 320Plus) mounted 1 m above the net. The mean volume of water filtered was calculated following manufacturer's instructions. All samples were preserved in 98% ethanol (Sigma-Aldrich, St. Louis, MO) and stored at 4°C.
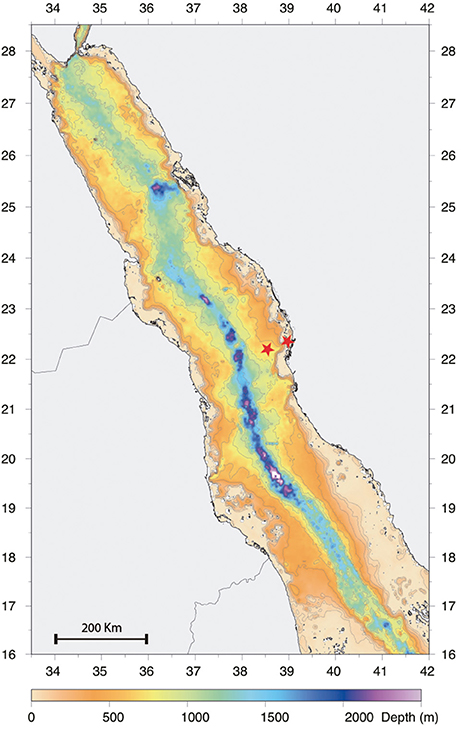
Figure 1. Bathymetry Red Sea map showing the positions of the offshore and inshore sampling stations (highlighted using a red star) and their corresponding depths.
Biomass Estimation
Samples collected using the MANTA and bongo nets were filtered through Whatman Folded filter paper (grade 113v, diam. 24 cm) to eliminate the ethanol. The weight was recorded using a digital weighing scale and the total biomass, defined as the animal density of total zooplankton, was calculated by subtracting the wet filter weight. Biomass of the samples collected using the vertical WP2 net was not estimated.
DNA Isolation, Amplification, and Sequencing
Aliquots of 5–10% of the total volume were used for the genomic analysis. Samples were digested in ATL lysis buffer (Qiagen, Valencia, CA) with 0.5 mg/ml proteinase K at 56°C overnight. Genomic DNA was isolated using the standard phenol-chloroform method (Sambrook and Russell, 2001).
Amplification was performed using the general eukaryotic primer set targeting the hypervariable region of the 18S rRNA gene designed by Amaral-Zettler et al. (2009). The forward primer 1389F was used in combination with the reverse primer 1510R. This set of primers was developed as a standard marker of marine microbial eukaryotic diversity and has also shown reliable amplification of marine zooplankton assemblages (Pearman et al., 2014; de Vargas et al., 2015; Pearman and Irigoien, 2015; Albaina et al., 2016). All primers had a Roche 454 tag and a 10 bp barcode. PCR reactions were undertaken in 50 μl reaction volumes containing 2.5 U Taq polymerase (Invitrogen, Carlsbad, CA), 1X Taq reaction Buffer, 200 μM dNTPs (Invitrogen), 1.5 mM MgSO4, 0.05 mg Bovine Serum Albumin (BSA) and 0.2 μM of each primer. PCR conditions were as follows: an initial denaturation step of 3 min at 94°C, followed by 30 cycles of 94°C for 30 s, 57°C for 45 s and 72°C for 45 s and a final extension at 72°C for 10 min. All the samples were run in duplicate alongside a negative no template control. PCR products were combined and checked on a 1% agarose gel; the band was then excised and purified with Qiagen's gel extraction kit (Qiagen, Valencia, CA). Using a Qubit 2.0 Fluorometer (Life Technologies, Carlsbad, CA) samples were equalized to 50 ng and pooled according to barcode. A maximum of 14 barcodes were pooled together and purity of multiplexed samples was analyzed using an Agilent 2100 bioanalyzer machine (Agilent, Santa Clara, CA).
Library construction was performed using the Roche XLR70 kit and each pooled sample was sequenced on a ¼ run either on a Roche GS FLX system at the KAUST core facility or a Roche GS FLX+ system at IMGM Laboratories (Martinsried, Germany). The sff files generated during sequencing were deposited in the National Center for Biotechnological Information (NCBI) Short Read Archive (SRA) under the study accession number SRP076465.
Sequence Analysis, Bioinformatics and Statistical Analysis
Sequences were firstly demultiplexed based on the barcode and raw reads were filtered based on quality (q = 25 over a window of 25) and length (minlenth = 100, maxlength = 200) within the QIIME (Caporaso et al., 2010) framework. No ambiguities in bases were allowed and only a single mismatch in the forward primer, whilst a homopolymer length up to 6 was permitted. Sequences were subsequently trimmed to the reverse primer. Clustering into operational taxonomic units (OTUs) was undertaken using a two-step clustering process as described in Pearman and Irigoien (2015). Briefly, the trie function within QIIME was used with CD-HIT (Li and Godzik, 2006) as a primarily clustering step before de novo clustering using USEARCH (Edgar, 2010) at a 97% similarity threshold. Representative sequences were obtained and chimera checked against the SILVA 119 database (Pruesse et al., 2007) using UCHIIME (Edgar et al., 2011).
The resulting chimera cleaned reference sequences were taxonomically assigned using the naïve Bayesian classifier rdp (Wang et al., 2007) within QIIME with the SILVA 119 database as reference. To compare the composition between both stations, reads were rarefied multiple times (n = 100) at an even depth (3,000 reads) and the average used (any samples which did not meet this criteria were removed from further analysis).
Taxonomic compositions were constructed using the R package phyloseq (McMurdie and Holmes, 2013) and plotted using ggplot (Wickham, 2009). Non-metric multidimensional scaling (NMDS) was used to graphically summarize and analyze seasonal changes in the structure of zooplankton communities in the Central Red Sea. Graphs were plotted in R using phyloseq and statistical analysis of the distance matrices was undertaken using Analysis of Similarity (ANOSIM) in vegan (Oksanen et al., 2013). Contour and density plots were produced in R using the lattice package.
Canonical Correspondence Analysis (CCA) was used to elucidate the role played by different environmental variables in modulating the structure and seasonal succession of zooplankton assemblages.
The data sets used consisted of bimonthly species abundance represented by number of reads and nine environmental parameters: Sea Surface Temperature and Salinity (SST and SSS), Mean Temperature and Salinity of the water column for the whole CTD cast (T.mean and S.mean), Mean Temperature and Salinity of the water column from 0 to 50 m (T.50 and S.50) (for inshore stations is the same as T.mean and S.mean), Temperature and Salinity at 20 m (T.20 and S20) and UV index (UVI). The significance of these variables was assessed using Monte Carlo permutation tests (with 999 unrestricted permutations). The species data were log (x+1) transformed and rarely occurring taxa (less than 0.5% of the total abundance) were down-weighted in order to prevent them from greatly influencing the analyses (Ter Braak and Šmilauer, 2002).
Results
Biological Sample Collection and Environmental Parameters
The mean volume of water filtered by the MANTA, Bongo horizontal tow, Bongo oblique tow and vertical WP2 nets was 70.4 m3, 236/210 m3 (offshore/inshore), 252/200 m3 (offshore/inshore) and 28/15 m3 (offshore/inshore), respectively (Table S1).
The temperatures ranged between 22.83–31.78°C at the offshore station and 25.31–31.36°C inshore. Salinities oscillated between 39.4–40.5 and 39.3–39.8 psu offshore and inshore respectively (Figure 2).
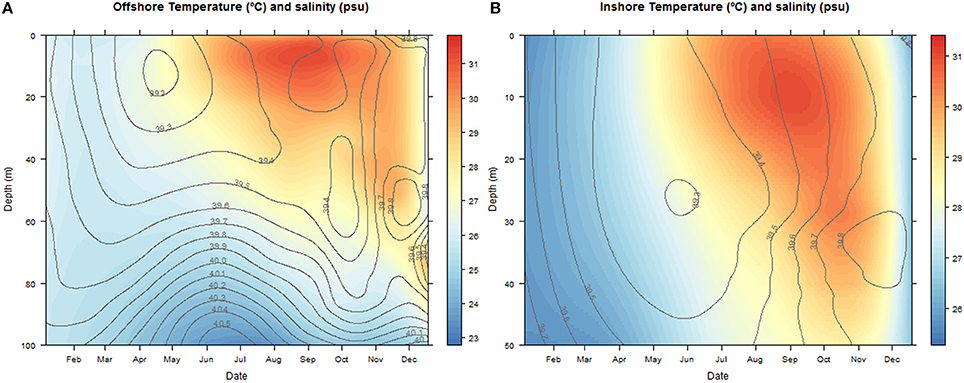
Figure 2. Contour and density plots of changes in salinity (psu) and temperature (°C) with depth (m) over the annual cycle at the offshore (A) and inshore sampling stations (B). The color key legend indicates temperature.
Sequence Analysis and Overall Taxonomic Composition
A total of 3,407,473 sequenced reads were obtained from all 154 samples. Of these, 2,033,939 reads passed quality checks, including the removal of chimeras (for further details, see Table S1). The quality-filtered sequenced data was clustered at a 97% similarity level and after rarefaction a total of 630 metazoan OTUs were obtained. Overall the most diverse and dominant phylogenetic group in terms of OTUs was the Arthropoda accounting for 417 OTUs (66%) followed by Cnidaria (67 OTUs), which also contributed more than 10% of the overall number of OTUs. The Arthropoda were comprised of 174 OTUs attributed to Malacostraca and 145 OTUs belonging to the class Maxillopoda, while the majority of the remaining OTUs could not be assigned at class level.
Similar numbers of OTUs were observed in the offshore station (558 OTUs) (when the MANTA net samples were removed) compared with the inshore station (572 OTUs). There was a significant level of overlap in OTU composition between both sites with a total of 507 OTUs observed at both stations. Comparison of sampling methods showed that the MANTA net revealed the lowest number of OTUs (288 OTUs) in the offshore station followed by the Bongo horizontal net (371 OTUs) which accounted for the lowest number of OTUs (389 OTUs) in the inshore station (where the MANTA net was not used). Inshore, 41% of the OTUs (239) were shared between all sampling methods whilst only 28% (162) were shared between the 4 sampling methods in the offshore station. Removing the MANTA net samples revealed that 45% of the OTUs (251) were shared between the three sampling methods utilized in the inshore station. In the inshore station the vertical net had the most unique OTUs (77 OTUs) while the oblique net revealed the most unique OTUs in the offshore station (45 OTUs).
Taxonomic Composition and Biomass of Zooplankton Inhabiting the Offshore Station vs. the Inshore Station in Relation to Season
MANTA Trawl
The surface zooplankton community diversity was assessed using a MANTA net, which was trawled only at the offshore station. The taxonomic analysis revealed the lowest number of OTUs (288 OTUs) of all the samples surveyed in this study, with the majority of the biodiversity represented by only 4–5 classes in any given sampling date (Figure 3).
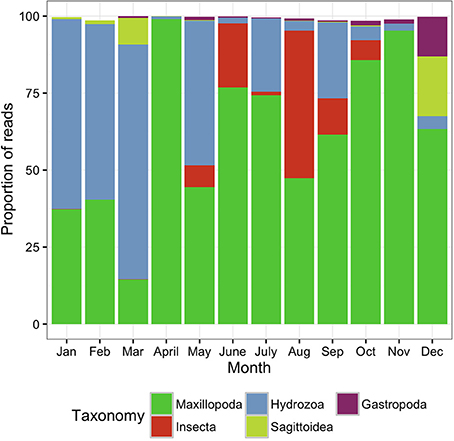
Figure 3. Metazoan composition of the samples collected using the MANTA net, trawled only at the offshore station. Proportion of reads produced by the MANTA samples assigned to metazoan taxa at the class level showing the monthly trends for 1 year.
During the colder months, December to May, hereafter referred to as cold season, when the average sea surface temperature ranged between 25.41 and 27.10°C (Figure 2), the community was clearly dominated by the phylum Cnidaria, specifically the class Hydrozoa and the phylum Arthropoda, particularly the class Maxillopoda. From June until November, hereafter referred to as the hot season, when the sea surface temperature rose averaging temperatures between 29.12 and 31.14°C, our study revealed a different zooplankton assemblage. The Hydrozoans declined being replaced by another class of Arthropoda (Insecta) until the end of the season, while class Maxillopoda represented up to 80% of the community composition. During early December a high proportion of the reads corresponded to phylums Chaetognatha (Sagittoidea) and Mollusca (Gastropoda), 19.39 and 12.89% respectively, both present throughout the year but in very small proportions (Figure 3).
The two main peaks of zooplankton biomass were recorded at the beginning and the end of the cold season (December and April), while the lowest biomass densities were detected in May and June, when the temperatures started rising (Figures 2, 4).
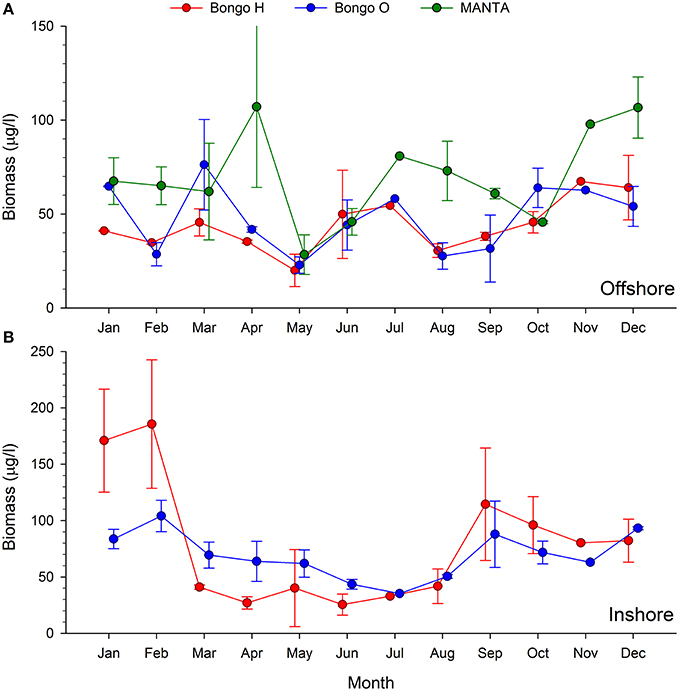
Figure 4. Monthly trends of bulk zooplankton biomass (μg/l) collected using the MANTA and bongo nets offshore (A) and bongo nets inshore (B).
Horizontal Bongo Nets
The analysis of the samples collected with the bongos towed horizontally at 20 m depth showed remarkably different zooplankton assemblages between the two sampling stations. During the cold season, the average temperature at 20 m depth ranged between 25.73–28.56°C offshore and 25.79–27.28°C inshore (Figure 2). The communities were mainly represented by classes Maxillopoda and Hydrozoa, with the former dominating the inshore community and the second prevailing at the offshore station. Class Malacostraca accounted for a high number of OTUs as well at the inshore station, while Sagittoidea represented close to ~35% of the reads during March and April in the offshore station. Rising sea surface temperatures were accompanied by the appearance of the phylum Mollusca, dominated mainly by Gastropoda inshore and Cephalopoda at the offshore station, while class Malacostraca increased, both inshore and offshore. During this hot season, characterized by average temperatures at 20 m depth between 29.15–30.90 and 28.63–31.26 offshore and inshore respectively (Figure 2), the community assemblage was defined by a greater diversity in terms of number of species. The presence of fish larvae, specifically class Actinopterygii, was distributed throughout the year, reaching the highest proportion of reads during the cold season (40% of the reads inshore in March and 30% offshore in late December) (Figure 5). The epipelagic zooplankton community inhabiting the top 20 m of the water column showed two main peaks of zooplankton biomass, slightly shifted inshore compared with the offshore station. While inshore the highest densities were recorded in February and September, the two main peaks offshore occurred in March and November. A third biomass peak was observed in July at the inshore station (Figure 4).
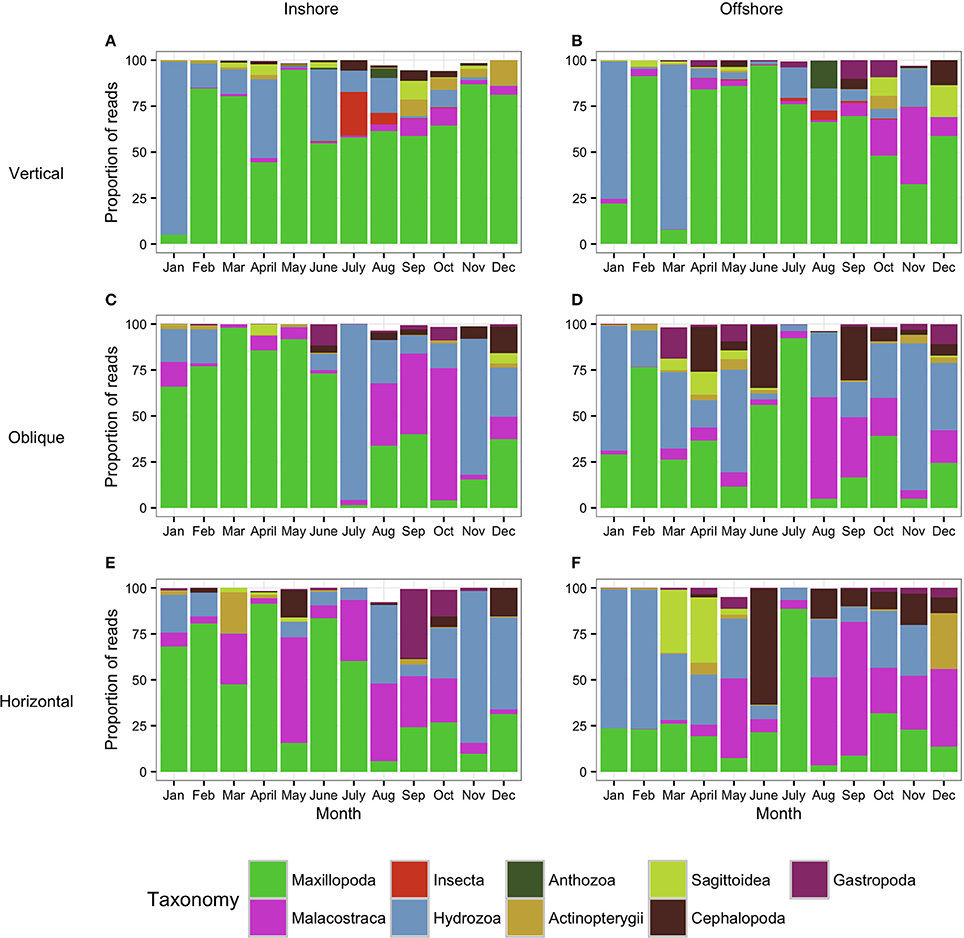
Figure 5. Metazoan composition of the samples collected using the WP2 tows (Vertical: A,B) and the bongo tows (Oblique: C,D; Horizontal: E,F). Proportion of reads produced by the WP2 and the bongo tows assigned to metazoan taxa showing the monthly trends for 1 year. (A,C,E) correspond to the inshore station while (B,D,F) correspond to the offshore station. Taxa which contributed to less than 0.5% of the community are not shown (thus proportion values do not always reach 100%).
Oblique Bongo Nets
The analysis of the samples collected with the bongo nets obliquely towed from 50 m depth to the surface, revealed consistent and similar biodiversity patterns to the horizontal tows (Figure 5). Similarly, there was a clear differentiation between the cold and the hot season, the latter characterized by a greater diversity in terms of number of species. Communities during the cold season, when the average temperature at 50 m depth ranged between 25.55–26.47°C offshore and 25.47–26.99°C inshore (Figure 2) were mainly dominated by classes Maxillopoda and Hydrozoa, with the latter representing a higher proportion of reads offshore. During the hot season, the average temperature at 50 m depth ranged between 26.84–29.71°C offshore and 27.21–29.69°C inshore. The presence of Malacostraca increased especially in the reef area, while classes Cephalopoda and Gastropoda appeared in higher proportions at the offshore station. Sagittoidea represented an important percentage of the reads both offshore and inshore in late March-April (5–10%), while class Actinopterygii was present throughout the year only at the offshore station. The epipelagic zooplankton community inhabiting the top 50 m of the water column showed the same annual trend of biomass detected in the assemblages collected at 20 m depth.
Vertical WP2 Net
As expected, the samples collected using the WP2 vertical net showed the highest OTU richness of all samples, since the strata sampled was the widest in this study. However, the filtered volume and the biomass collected were the lowest (see Table S1 for details). Biodiversity during the cold season, when average temperatures ranged between 23.74–25.77 at 100 m depth and 25.47–26.99 at 50 m depth offshore and inshore respectively (Figure 2), was dominated by classes Maxillopoda and Hydrozoa, similar to the composition of the communities collected using the bongo nets. Sagittoidea and Malacostraca also represented a significant number of reads (Figure 5). During the hot season, characterized by average temperatures between 23.42–25.68 at 100 m depth offshore and 27.21–29.69 at 50 m depth inshore, the communities diversified displaying a significant increase in the number of OTUs. Classes Cephalopoda, Gastropoda, and Malacostraca became more prevalent, while the class Anthozoa, which had not been detected with the previous sampling methods, was observed.
Spatial and Environmental Variability of the Zooplankton Taxonomic Composition
In order to assess statistical differences in the zooplankton communities under study, an Adonis analysis was performed to investigate the effects of the net and the location. Significant interactions were observed between the factors (Net and Location), indicating that there were variations in the trends for both the weighted (F = 1.67; p = 0.03) and unweighted (F = 1.41; p = 0.018) UniFrac analyses (Figure 6).
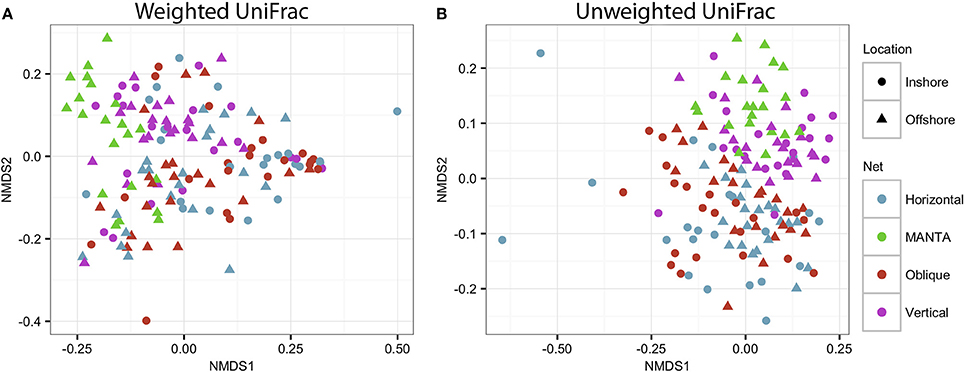
Figure 6. NMDS plot based on (A) weighted and unweighted (B) UniFrac distance matrices showing clustering of the four different sampling methodologies for both the inshore and offshore stations in the central Red Sea.
To investigate the effects of environmental variables (temperature, salinity, UV index) on zooplankton seasonal composition in the central Red Sea, we measured changes in community assemblages for each of the sampling methods separately (MANTA, Bongo horizontal, Bongo oblique, and WP2 vertical) using Canonical Correspondence Analysis (CCA) in R. The CCA analysis revealed clear differences between the cold and hot season communities, reinforcing the results described above. Temperature was found to be the main factor shaping the seasonal structure of the zooplankton communities.
The first CCA axis clearly separated the cold and hot season communities for all sampling methods, showing the highest correlation with temperature followed by salinity (Figure 7). Thus it appears that temperature was the most important factor in determining the structure of the zooplankton communities over the seasonal 1 year-period of the present study. Both the cold and hot season communities were rather scattered along the second axis, which only separated inshore from offshore community composition for the horizontal samples.
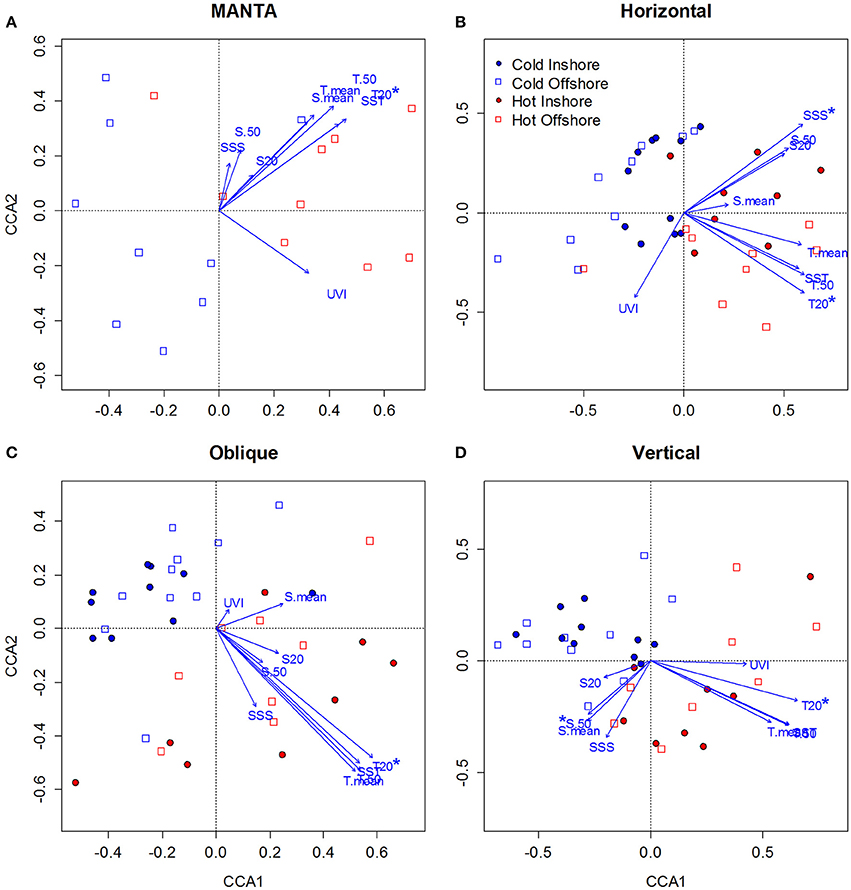
Figure 7. Canonical Correspondence Analysis (CCA) ordination diagrams of samples in relation to environmental variables [Sea Surface Temperature (SST), Mean Temperature of the water column (T.mean), Mean Temperature of the water column from 0 to 50 m (T.50), Mean Temperature at 20 m (T.20), Sea Surface Salinity (SSS), Mean Salinity of the water column (S. mean), Mean Salinity of the water column from 0 to 50 m (S.50), Mean Temperature at 20 m (S.20), and UV index (UVI] for zooplankton taxonomic composition data sampled over the central Red Sea. (A–D) correspond to the MANTA, Bongo horizontal, Bongo oblique and vertical hauls respectively. Blue represents the cold season and red the hot season, while empty squares correspond to offshore and full circles to inshore samples. The direction of the arrow indicates the direction of the correlation with respect to the community assemblage composition, while the length of the arrow indicates the strength of that correlation. Environmental variables showing significant correlation (Monte-Carlo permutation test, p < 0.05) with the zooplankton seasonal distribution are indicated with an asterisk.
For the MANTA samples (Figure 7A), the Monte Carlo permutation test showed that only temperature at 20 m (T20) was significant (p < 0.05) in explaining zooplankton seasonal distribution, being correlated with axis 1 (0.73). Only the first canonical axis was significant (p < 0.01), explaining 56.2% of the variance of the species—environment relationship. The species—environment correlation coefficient for the first CCA axis was 0.76.
For the samples collected with the bongos towed horizontally (Figure 7B), the Monte Carlo permutation test showed that temperature at 20 m (T20) and sea surface salinity (SSS) were the only significant (p < 0.05) environmental variables in explaining zooplankton spatio-temporal distribution. Both were positively correlated with axis 1 (0.63), but T20 was negatively correlated with axis 2 (−0.37) and SSS positively (0.37). Only the first 2 canonical axis were significant (p < 0.01), explaining 33.5% of the variance of the species—environment relationship. The species—environment correlation coefficients for the first CCA axes were 0.82 and 0.66 respectively.
The Monte Carlo permutation test of the samples collected with the bongo nets obliquely towed from 50 m depth to the surface (Figure 7C), revealed that only T20 was significant (p < 0.01) in explaining zooplankton seasonal distribution. T20 was positively correlated with axis 1 (0.79). Only the first canonical axis was significant (p < 0.01), explaining 40% of the variance, and the species—environment correlation coefficient for this axis was 0.82.
Finally, for the samples collected using the WP2 vertical net (Figure 7D), the Monte Carlo permutation test showed that only 2 environmental variables (T20 and S50) were significant (p < 0.05) in explaining zooplankton seasonal distribution. T20 was positively correlated with axis 1 (0.65), whereas S50 was negatively correlated with axis 2 (−0.41). Only the first 2 canonical axes (axis 1 and axis 2) were significant (p < 0.01), explaining 33.3% of the variance, and the species—environment correlation coefficients for these axes were 0.80 and 0.56 respectively.
To summarize, our study reveals two marked seasonal phases in terms of species composition of the zooplankton communities living in the upper water column (top 100 m) in the central Rea Sea, driven mainly by temperature. The cold season was characterized by a lower biodiversity being mainly dominated by classes Maxillopoda and Hydrozoa. Biodiversity increased during the hot season and was defined by the appearance of classes Malacostraca, Cephalopoda and Gastropoda, among the most abundant in terms of number of reads. Table 1 displays the taxonomic designations (at genus level where possible) of the most dominant OTUs for the epipelagic zooplankton community inhabiting the top 100/50 m of the water column (vertical hauls offshore and inshore respectively). Copepods were the dominant component of the Arthropoda accounting for on average 99.7% of the maxillopodan reads at all depth strata, with the majority of the reads corresponding to calanoid copepods, while poecilostomatoids and harpacticoids occurred only rarely (Table 2). In total, 15 families and 32 species of copepods were identified, with 11 families and 17 genera within the order Calanoida. Five calanoid genera dominated, contributing 58.8% of the total number of reads for the total copepod community: Acartia, Canthocalanus, Undinula, Candacia, and Paracalanus. Undinula were found to be present in high abundances all year around at all depth strata studied, while the rest occurred regularly throughout the year, however, dominance differed. All three species recorded within the genus Acartia revealed a remarkably higher abundance in terms of number of reads during the hot season, while three and four different species within the genus Candacia and Paracalanus respectively alternate their prevalence during both seasons. Finally Canthocalanus was more prevalent during the hot season.
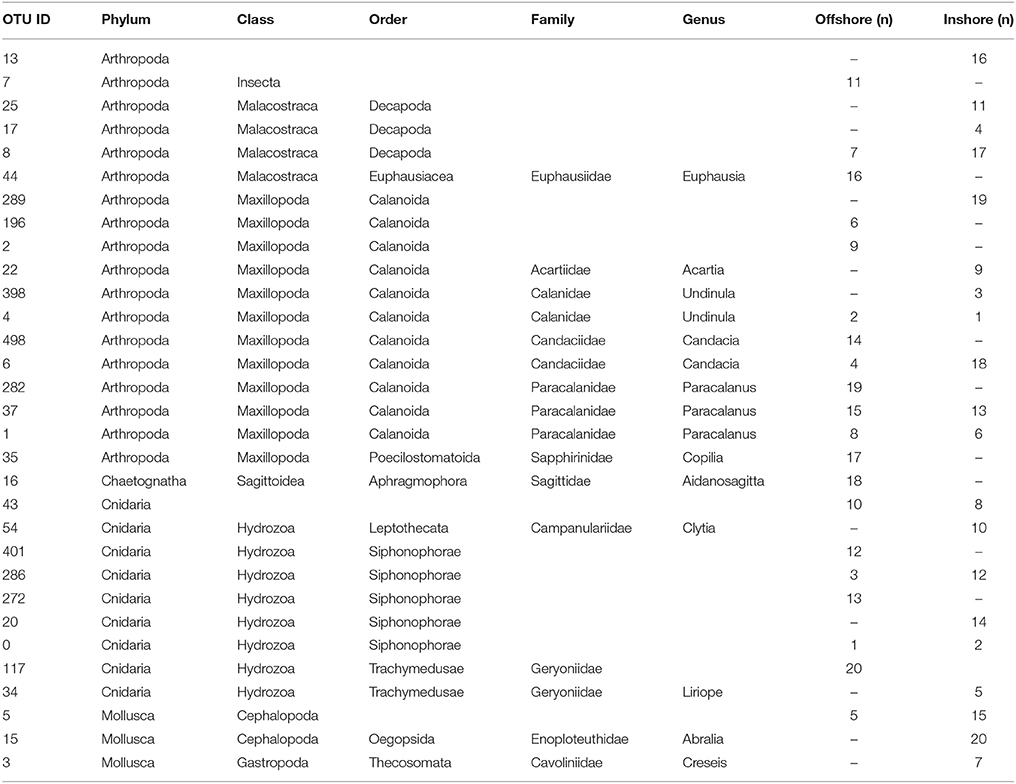
Table 1. Compilation of the top 20 OTUs in terms of abundance for the epipelagic zooplankton community inhabiting the top 100 m of the water column identified in the inshore and offshore stations (n, where n indicates percentage of reads).
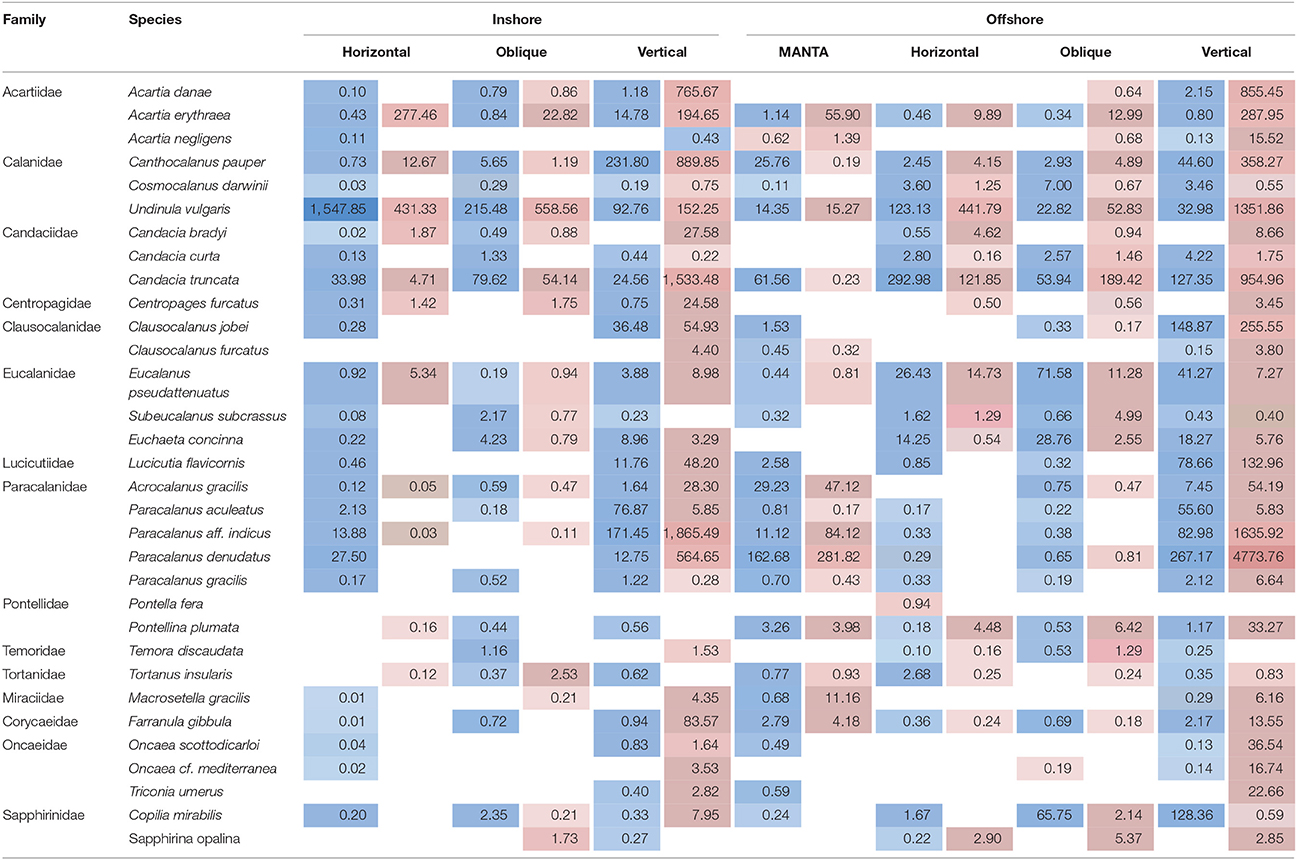
Table 2. Average number of reads detected during the hot (highlighted in red) and cold season (highlighted in blue) for the overall dominant taxonomic group, subclass Copepods, at the species level, at the inshore and offshore stations for each of the nets (MANTA (only offshore); horizontal and oblique bongos; vertical WP2).
Discussion
Characterization of Zooplankton Biodiversity Using Pyrosequencing
A significant body of research has been undertaken for reef fishes and other common sessile organisms like corals or sponges in the Red Sea (e.g., Berumen et al., 2013; Loya et al., 2014; Erpenbeck et al., 2016; Roberts et al., 2016), identifying it as a region of high biodiversity and endemism. However, zooplankton biodiversity remains largely uncharacterized.
This study takes advantage of high throughput sequencing technology, which allows a rapid characterization of whole communities, to assess the seasonal profiles of zooplankton assemblages in two locations of the central Red Sea through an annual cycle. Our results constitute the first baseline data on the richness and seasonality of the central Red Sea zooplankton. However, it is important to note that the results presented here are based on the molecular data available in public reference databases and are therefore limited by them (Carugati et al., 2015). Reference databases are known to be incomplete in terms of the global inventory of species having a representative barcode sequence (Carugati et al., 2015) limiting the ability to classify species at low taxonomic levels and the marker gene may not have the resolution of species level identifications (Dell'Anno et al., 2015). Understudied areas like the central Red Sea, which is known for housing a highly specialized and partly endemic fauna (Sonnewald and El-Sherbiny, 2017) are expected to harbor a number of undescribed species, which are unrepresented in reference databases and thus, will be classified as unknown. This is likely to have an impact on the success of fine level taxonomic assignments and results in higher level classifications as used in the current study. Our study reports ~15% of a total of 630 metazoan OTUs could only be assigned at the phylum level. This highlights the scarcity of genetic data in public databases for Red Sea zooplankton, and even includes highly abundant taxa. Nevertheless, the 18S region used here, due to its relatively conserved nature is considered to allow accurate classification of novel sequences (Bucklin et al., 2016). In addition, the sensitivity of molecular studies is revolutionizing analysis of marine biodiversity since it allows the correct discrimination and classification of cryptic and sibling species, as well as of early individual life stages (eggs and larvae) which constitute important impediments in classical taxonomic studies. Thus, this emerging technique has revealed previously hidden taxonomic richness (Lindeque et al., 2013) as well as the discrimination of rare and cryptic species of zooplankton communities (Zhan et al., 2013; Zhan and MacIsaac, 2015).
Nonetheless it is important to highlight that high throughput amplicon sequencing analysis applied to diversity studies is still in its infancy and presents several limitations in its current stage. So far, it has not shown good agreement with species abundance data from morphological taxonomic analysis (Lindeque et al., 2013) and there is an urgent need for the development of standardized practices that would allow comparisons between different studies (reviewed in Bucklin et al., 2016). However, it has already shown great value in providing baseline data for marine metazoan plankton diversity (e.g., Fonseca et al., 2010; Pearman et al., 2014).
Environmental Factors Driving Zooplankton Biomass and Biodiversity in the Central Red Sea
Our study reports changes in total biomass and in species composition during the annual cycle of the zooplankton communities inhabiting the upper 100 m of the water column in the central Rea Sea. The main abiotic factor driving the biodiversity of the zooplankton communities was found to be temperature, based on the CCA analysis of the seasonal structure of the zooplankton communities, which define two distinct seasonal phases (Figures 2, 7). Despite the recurrent paradigm of the aseasonal nature of the tropical environments (Morales-Nin and Panfili, 2005), we show here that the sea surface temperatures in the Red Sea display high seasonal variations and zooplankton assemblages shape their biomass and biodiversity accordingly. Thus, acclimation capacity of the zooplankton assemblages living here might be higher than expected and closer to that of non-tropical species.
The two seasonal phases correspond well with the two seasonal periods of stratification and vertical mixing described in the Red Sea (Calbet et al., 2015). During the hot season, the water column is stratified and the surface layers are depleted of nutrients (Reiss and Hottinger, 1985). In colder months, the thermocline deteriorates, facilitating the enrichment of surface waters with nutrients brought up from the depths due to deep convective mixing (Wolf-Vecht et al., 1992; Lindell and Post, 1995). It is well established that environmental conditions, particularly temperature and food availability, have a crucial effect on zooplankton abundance and biomass (Webber and Roff, 1995; Christou, 1998). Accordingly, the maximum biomass peak was observed in February (Figure 4), with values that tripled (oblique tows) or even quintupled (horizontal tows) those observed when temperatures and stratification reached their maximum (Figure 2). When temperatures started decreasing in September, zooplankton biomass increased again, doubling the values observed during the summer. This annual trend corresponds to the offshore station, an open deep water area with a standard depth over 500 m. Biomass densities at the inshore station exhibited a more heterogeneous pattern throughout the year, displaying a third biomass peak when seawater temperatures reached their maximum. This pattern might be explained by the fact that this coastal reef zone is a shallow area (60 m) where stratification is not observed (Figure 2) or it could be due to advective variability in the sampling area.
Similar annual trends of biomass densities were described for the zooplankton communities living in coastal areas in the Gulf of Aqaba (Khalil and El-Rakman, 1997), although our results contrast sharply with a study carried out in the Northern Rea Sea (El-Sherbiny et al., 2007). These authors reported consistently high densities of the epipelagic zooplankton community during late spring and early summer, attaining maximum values in August. However, another multiyear study in the Gulf of Aqaba revealed that highest and lowest densities of zooplankton were highly dependent on the year (Cornils et al., 2007). Moreover, as shown in this study, even close geographic areas might show differences in zooplankton biomass densities.
Differences in species composition of the zooplankton assemblages between the communities inhabiting the offshore and the inshore station were detected by Adonis analysis being significant for both the weighted and unweighted UniFrac distance matrices. This observation may reflect fine-scale geographic structuring in terms of biodiversity for the samples collected with the bongo nets; however due to the limited geographic scope of the present study, more stations are needed to confirm this pattern.
Annual Zooplankton Succession and Assemblage Structure in the Central Red Sea
The neuston community analyzed in this study revealed the lowest number of OTUs of all the sampling methods. The MANTA net samples the plankton inhabiting the upper 0.15 m of the sea, which is a restricted ecological niche occupied by a unique community (reviewed in Marshall and Burchardt, 2005). Accordingly, the lower biodiversity compared to the samples collected using the two other net systems is expected. On the other hand, the samples collected with the vertical hauls showed the highest OTU richness of all samples as expected, since the strata sampled is the widest in this study.
Throughout the year the dominant phyla found in our study were Arthropoda and Cnidaria, at all depth strata studied. The majority of reads consisted of classes Maxillopoda and Hydrozoa, the latter being especially abundant during the cold season, accounting for on average 48.1 and 25.6% of the reads respectively. In the surface (MANTA samples, offshore) these two classes together contributed on average 85.8% to the total number of metazoan reads, while their contribution was on average 56.0, 66.4, 81.6% offshore and 67.2, 73.3, 85.9% inshore for the samples collected using the horizontal (20 m), oblique (50 to surface) and WP2 (100/50 to surface) nets respectively. The rise in the water temperature was accompanied by an increase in biodiversity with the appearance of classes Malacostraca, Cephalopoda, Gastropoda and Saggitoidea, among the most abundant, accounting for on average 17.1, 9.3, 1.6 and 0.7% offshore and 20.1, 2.5, 6.2 and 1.1% inshore during the hot season. Similar groups were found to be the most abundant in previous studies in the Red Sea using both metagenetics (Pearman et al., 2014; Pearman and Irigoien, 2015) and classical morpho-taxonomy approaches (Cornils, 2005; Cornils et al., 2007; El-Sherbiny et al., 2007; Dorgham et al., 2012). Studies in other tropical marine regions have reported similar compositions of zooplankton assemblages (e.g., Spermonde archipelago: Cornils et al., 2010; Pohnpei island: Machida et al., 2009). Metagenetic studies in temperate regions have reported significantly lower numbers of OTUs (the Western Channel: Lindeque et al., 2013; the North Sea: Mohrbeck et al., 2015; the Northwest Pacific: Hirai et al., 2015), however, differences in the sampling methodology (e.g., the plankton net), the barcode, primer and protocol choice and/or the bioinformatics analysis pipeline make direct comparisons extremely difficult (Hirai et al., 2015; Bucklin et al., 2016).
As expected, copepods were the dominant component of the Arthropoda inhabiting the upper 100 m of the epipelagic zone. This is consistent with previous studies across the northern and central Red Sea that have reported similar findings in terms of copepod abundance (Khalil and El-Rakman, 1997; El-Sherbiny et al., 2007; Dorgham et al., 2012; Pearman et al., 2014) as well as with studies in other marine basins (e.g., Caribbean: Moore and Sander, 1976; Mediterranean: Pancucci-Papadopoulou et al., 1992; the Western Channel: Eloire et al., 2010). In our study, the majority of the reads corresponded to calanoid copepods, while poecilostomatoids and harpacticoids occurred only rarely (Table 2). Remarkably, harpacticoids, specifically the genus Oncaea, have been commonly reported in the northern Red Sea as important contributors to the total diversity of adult copepods across the year (Aamer et al., 2006; El-Sherbiny et al., 2007; Dorgham et al., 2012), while in our study their contribution appears to be low. The exception is at deeper depths during the hot season with a higher presence offshore than inshore. These differences might be due to regional zooplankton patterns but could also be due to a high abundance of adult stages relative to the biomass of juveniles. This would result in a higher proportion of morphologically identified samples compared with molecular techniques (Lindeque et al., 2013). Five calanoid genera dominated the copepod community: Acartia, Canthocalanus, Undinula, Candacia, Paracalanus, showing differing abundances throughout the year. Similar records were reported by morphological and molecular studies in the Red Sea (Aamer et al., 2006; Cornils et al., 2007; Pearman et al., 2014).
In summary, this study has shown that the seasonal fluctuation of the zooplankton communities living in the upper water column (top 100 m) in the central Rea Sea is driven mainly by temperature and the annual change between vertical mixing and stratification. During the cold season, communities are characterized by a lower biodiversity in terms of number of species and a higher biomass than communities found during the hot season. All throughout the year the zooplankton communities are dominated by class Maxillopoda, mainly represented by copepods and class Hydrozoa. The rise in the water temperature favors the appearance of classes Malacostraca, Cephalopoda, Gastropoda, and Saggitoidea, among the most abundant.
We found evidence for fine-scale geographic differences in terms of biodiversity for the two close proximity areas under study, providing an essential foundation for future comparative studies.
Author Contributions
Conceived and designed the study: LC and XI. Performed the field, laboratory work and biomass analysis, interpreted the data and wrote the paper: LC. Performed the analysis of the sequence data and bioinformatics tasks: JP. Critically reviewed and edited the manuscript: JP and XI. All authors approved the final version of the manuscript.
Funding
This research was supported by baseline funding provided by King Abdullah University of Science and Technology to XI. The funders had no role in study design, data collection and analysis, decision to publish, or preparation of the manuscript.
Conflict of Interest Statement
The authors declare that the research was conducted in the absence of any commercial or financial relationships that could be construed as a potential conflict of interest.
Acknowledgments
The authors would like to thank the Coastal and Marine Resources Core Lab, particularly Ioannis Georgakakis, for their invaluable support during fieldwork. We would like to express our gratitude to Craig T. Michell and Sylvain P. Guillot for technical assistance and the three reviewers for their constructive comments on the manuscript.
Supplementary Material
The Supplementary Material for this article can be found online at: https://www.frontiersin.org/article/10.3389/fmars.2017.00241/full#supplementary-material
References
Aamer, M. A., El-Sherbiny, M. M., Gab-Alla, A. A., and Kotb, M. M. (2006). Ecological studies on zooplankton standing crop of Sharm El-Maiya Bay, Sharm El-Sheikh, northern Red Sea. Catrina 1, 73–80.
Acosta, F., Ngugi, D., and Stingl, U. (2013). Diversity of picoeukaryotes at an oligotrophic site off the Northeastern Red Sea Coast. Aquat. Biosyst. 9:16. doi: 10.1186/2046-9063-9-16
Albaina, A., Aguirre, M., Abad, D., Santos, M., and Estonba, A. (2016). 18S rRNA V9 metabarcoding for diet characterization: a critical evaluation with two sympatric zooplanktivorous fish species. Ecol. Evol. 6, 1809–1824. doi: 10.1002/ece3.1986
Almogi-Labin, A. (1984). Population dynamics of planktonic foraminifera and pteropoda, Gulf of Aqaba, Red Sea. Proc. K. Ned. Akad. Wet. B Palaeontol. 87, 481–511.
Amaral-Zettler, L. A., McCliment, E. A., Ducklow, H. W., and Huse, S. M. (2009). A method for studying protistan diversity using massively parallel sequencing of V9 hypervariable regions of small-subunit ribosomal RNA genes. PLoS ONE 4:e6372. doi: 10.1371/journal.pone.0006372
Beaugrand, G. (2002). Reorganization of North Atlantic Marine Copepod Biodiversity and Climate. Science 296, 1692–1694. doi: 10.1126/science.1071329
Behrenfeld, M. J., O'Malley, R. T., Siegel, D. A., McClain, C. R., Sarmiento, J. L., Feldman, G. C., et al. (2006). Climate-driven trends in contemporary ocean productivity. Nature 444, 752–755. doi: 10.1038/nature05317
Berumen, M. L., Hoey, A. S., Bass, W. H., Bouwmeester, J., Catania, D., Cochran, J. E. M., et al. (2013). The status of coral reef ecology research in the Red Sea. Coral Reefs 32, 737–748. doi: 10.1007/s00338-013-1055-8
Bottger-Schnack, R., Hagen, W., and Schnack-Schiel, S. B. (2001). The microcopepod fauna in the Gulf of Aqaba, northern Red Sea: species diversity and distribution of Oncaeidae (Poecilostomatoida). J. Plankton Res. 23, 1029–1035. doi: 10.1093/plankt/23.9.1029
Bucklin, A., Lindeque, P. K., Rodriguez-Ezpeleta, N., Albaina, A., and Lehtiniemi, M. (2016). Metabarcoding of marine zooplankton: prospects, progress and pitfalls. J. Plankton Res. 38, 393–400. doi: 10.1093/plankt/fbw023
Calbet, A., Agersted, M. D., Kaartvedt, S., Møhl, M., Møller, E. F., Enghoff-Poulsen, S., et al. (2015). Heterogeneous distribution of plankton within the mixed layer and its implications for bloom formation in tropical seas. Sci. Rep. 5:11240. doi: 10.1038/srep11240
Cantin, N. E., Cohen, A. L., Karnauskas, K. B., Tarrant, A. M., and McCorkle, D. C. (2010). Ocean warming slows coral growth in the central Red Sea. Science 329, 322–325. doi: 10.1126/science.1190182
Caporaso, J. G., Kuczynski, J., Stombaugh, J., Bittinger, K., Bushman, F. D., Costello, E. K., et al. (2010). QIIME allows analysis of high-throughput community sequencing data. Nat. Methods 7, 335–336. doi: 10.1038/nmeth.f.303
Carew, M. E., Pettigrove, V. J., Metzeling, L., and Hoffmann, A. A. (2013). Environmental monitoring using next generation sequencing: rapid identification of macroinvertebrate bioindicator species. Front. Zool. 10:45. doi: 10.1186/1742-9994-10-45
Carugati, L., Corinaldesi, C., Dell'Anno, A., and Danovaro, R. (2015). Metagenetic tools for the census of marine meiofaunal biodiversity: an overview. Mar. Genomics 24, 11–20. doi: 10.1016/j.margen.2015.04.010
Christou, E. (1998). Interannual variability of copepods in a Mediterranean coastal area (Saronikos Gulf Aegean Sea). J. Mar. Syst. 15, 523–532. doi: 10.1016/S0924-7963(97)00080-8
Cornils, A. (2005). Spatial and temporal distribution of mesozooplankton in the Gulf of Aqaba and the northern Red Sea in February/March 1999. J. Plankton Res. 27, 505–518. doi: 10.1093/plankt/fbi023
Cornils, A., Schnack-Schiel, S. B., Al-Najjar, T., Badran, M. I., Rasheed, M., Manasreh, R., et al. (2007). The seasonal cycle of the epipelagic mesozooplankton in the northern Gulf of Aqaba (Red Sea). J. Mar. Syst. 68, 278–292. doi: 10.1016/j.jmarsys.2007.01.001
Cornils, A., Schulz, J., Schmitt, P., Lanuru, M., Richter, C., and Schnack-Schiel, S. B. (2010). Mesozooplankton distribution in the Spermonde Archipelago (Indonesia, Sulawesi) with special reference to the Calanoida (Copepoda). Deep Sea Res. II Top. Stud. Oceanogr. 57, 2076–2088. doi: 10.1016/j.dsr2.2010.09.011
Dell'Anno, A., Carugati, L., Corinaldesi, C., Riccioni, G., and Danovaro, R. (2015). Unveiling the biodiversity of deep-sea nematodes through metabarcoding: are we ready to bypass the classical taxonomy? PLoS ONE 10:e0144928. doi: 10.1371/journal.pone.0144928
de Vargas, C., Audic, S., Henry, N., Decelle, J., Mahe, F., Logares, R., et al. (2015). Eukaryotic plankton diversity in the sunlit ocean. Science 348:1261605. doi: 10.1126/science.1261605
DiBattista, J. D., Roberts, M. B., Bouwmeester, J., Bowen, B. W., Coker, D. J., Lozano-Cortés, D. F., et al. (2016). A review of contemporary patterns of endemism for shallow water reef fauna in the Red Sea. J. Biogeogr. 43, 423–439. doi: 10.1111/jbi.12649
Dorgham, M. M., Elsherbiny, M. M., and Hanafi, M. H. (2012). Vertical distribution of zooplankton in the epipelagic zone off Sharm El-Sheikh, Red Sea, Egypt. Oceanologia 54, 473–489. doi: 10.5697/oc.54-3.473
Echelman, T., and Fishelson, L. (1990). Surface zooplankton dynamics and community structure in the Gulf of Aqaba (Eilat), Red Sea. Mar. Biol. 107, 179–190. doi: 10.1007/BF01313255
Edgar, R. C. (2010). Search and clustering orders of magnitude faster than BLAST. Bioinformatics 26, 2460–2461. doi: 10.1093/bioinformatics/btq461
Edgar, R. C., Haas, B. J., Clemente, J. C., Quince, C., and Knight, R. (2011). UCHIME improves sensitivity and speed of chimera detection. Bioinformatics 27, 2194–2200. doi: 10.1093/bioinformatics/btr381
Eloire, D., Somerfield, P. J., Conway, D. V. P., Halsband-Lenk, C., Harris, R., and Bonnet, D. (2010). Temporal variability and community composition of zooplankton at station L4 in the Western Channel: 20 years of sampling. J. Plankton Res. 32, 657–679. doi: 10.1093/plankt/fbq009
El-Sherbiny, M. M., Hanafy, M. H., and Aamer, M. A. (2007). Monthly variations in abundance and species composition of the epipelagic zooplankton off Sharm El-Sheikh, Northern Red Sea. Res. J. Environ. Sci. 1, 200–210. doi: 10.3923/rjes.2007.200.210
Erpenbeck, D., Voigt, O., Al-Aidaroos, A. M., Berumen, M. L., Büttner, G., Catania, D., et al. (2016). Molecular biodiversity of Red Sea demosponges. Mar. Pollut. Bull. 105, 507–514. doi: 10.1016/j.marpolbul.2015.12.004
Fonseca, V. G., Carvalho, G. R., Sung, W., Johnson, H. F., Power, D. M., Neill, S. P., et al. (2010). Second-generation environmental sequencing unmasks marine metazoan biodiversity. Nat. Commun. 1:98. doi: 10.1038/ncomms1095
Ghalambor, C. K. (2006). Are mountain passes higher in the tropics? janzen's hypothesis revisited. Integr. Comp. Biol. 46, 5–17. doi: 10.1093/icb/icj003
Godeaux, J. (1978). The population of Thaliacea in the Gulf of Eilat. Bull. Soc. R. Sci. Liege 47, 376–389.
Hajibabaei, M., Shokralla, S., Zhou, X., Singer, G. A. C., and Baird, D. J. (2011). Environmental barcoding: a next-generation sequencing approach for biomonitoring applications using river benthos. PLoS ONE 6:e17497. doi: 10.1371/journal.pone.0017497
Hirai, J., Yasuike, M., Fujiwara, A., Nakamura, Y., Hamaoka, S., Katakura, S., et al. (2015). Effects of plankton net characteristics on metagenetic community analysis of metazoan zooplankton in a coastal marine ecosystem. J. Exp. Mar. Biol. Ecol. 469, 36–43. doi: 10.1016/j.jembe.2015.04.011
Hoegh-Guldberg, O., Mumby, P. J., Hooten, A. J., Steneck, R. S., Greenfield, P., Gomez, E., et al. (2007). Coral reefs under rapid climate change and ocean acidification. Science 318, 1737–1742. doi: 10.1126/science.1152509
Khalil, M. T., and El-Rakman, N. S. A. (1997). Abundance and diversity of surface zooplankton in the Gulf of Aqaba, Red Sea, Egypt. J. Plankton Res. 19, 927–936. doi: 10.1093/plankt/19.7.927
Li, W., and Godzik, A. (2006). Cd-hit: a fast program for clustering and comparing large sets of protein or nucleotide sequences. Bioinformatics 22, 1658–1659. doi: 10.1093/bioinformatics/btl158
Lindell, D., and Post, A. F. (1995). Ultraphytoplankton succession is triggered by deep winter mixing in the Gulf of Aqaba (Eilat), Red Sea. Limnol. Oceanogr. 40, 1130–1141. doi: 10.4319/lo.1995.40.6.1130
Lindeque, P. K., Parry, H. E., Harmer, R. A., Somerfield, P. J., and Atkinson, A. (2013). Next Generation Sequencing Reveals the hidden diversity of zooplankton assemblages. PLoS ONE 8:e81327. doi: 10.1371/journal.pone.0081327
Loya, Y., Genin, A., El-Zibdeh, M., Naumann, M. S., and Wild, C. (2014). Reviewing the status of coral reef ecology of the Red Sea: key topics and relevant research. Coral Reefs 33, 1179–1180. doi: 10.1007/s00338-014-1170-1
Machida, R. J., Hashiguchi, Y., Nishida, M., and Nishida, S. (2009). Zooplankton diversity analysis through single-gene sequencing of a community sample. BMC Genomics 10:438. doi: 10.1186/1471-2164-10-438
Margulies, M., Egholm, M., Altman, W. E., Attiya, S., Bader, J. S., Bemben, L. A., et al. (2005). Genome sequencing in microfabricated high-density picolitre reactors. Nature 437, 376–380. doi: 10.1038/nature03959
Marshall, H. G., and Burchardt, L. (2005). Neuston: its definition with a historical review regarding its concept and community structure. Arch. für Hydrobiol. 164, 429–448. doi: 10.1127/0003-9136/2005/0164-0429
McMurdie, P. J., and Holmes, S. (2013). phyloseq: an R Package for reproducible interactive analysis and graphics of microbiome census data. PLoS ONE 8:e61217. doi: 10.1371/journal.pone.0061217
Mitra, A., Castellani, C., Gentleman, W. C., Jónasdóttir, S. H., Flynn, K. J., Bode, A., et al. (2014). Bridging the gap between marine biogeochemical and fisheries sciences; configuring the zooplankton link. Prog. Oceanogr. 129, 176–199. doi: 10.1016/j.pocean.2014.04.025
Mohrbeck, I., Raupach, M. J., Arbizu, P. M., Knebelsberger, T., and Laakmann, S. (2015). High-throughput sequencing-the key to rapid biodiversity assessment of marine metazoa? PLoS ONE 10:e140342. doi: 10.1371/journal.pone.0140342
Moore, E., and Sander, F. (1976). Quantitative and qualitative aspects of the zooplankton and breeding patterns of copepods at two Caribbean coral reef stations. Estuar. Coast. Mar. Sci. 4, 589–607. doi: 10.1016/0302-3524(76)90068-2
Morales-Nin, B., and Panfili, J. (2005). Seasonality in the deep sea and tropics revisited: what can otoliths tell us? Mar. Freshw. Res. 56:585. doi: 10.1071/MF04150
Oksanen, J., Blanchet, F. G., Kindt, R., Legendre, P., Minchin, P. R., O'Hara, R. B., et al. (2013). Vegan: Community Ecology Package. R Package Version 2.0.10. Available online at: http://CRAN-R-project.org/package==vegan
Pancucci-Papadopoulou, M. A., Siokoufrangou, I., Theocharis, A., and Georgopoulos, D. (1992). Zooplankton vertical distribution in relation to the hydrology in the NW Levantine and the SE Aegean Seas. Oceanol. Acta 15, 365–381.
Pearman, J. K., El-Sherbiny, M. M., Lanzén, A., Al-Aidaroos, A. M., and Irigoien, X. (2014). Zooplankton diversity across three Red Sea reefs using pyrosequencing. Front. Mar. Sci. 1:27. doi: 10.3389/fmars.2014.00027
Pearman, J. K., and Irigoien, X. (2015). Assessment of zooplankton community composition along a depth profile in the central Red Sea. PLoS ONE 10:e0133487. doi: 10.1371/journal.pone.0133487
Porazinska, D. L., Giblin-Davis, R. M., Faller, L., Farmerie, W., Kanzaki, N., Morris, K., et al. (2009). Evaluating high-throughput sequencing as a method for metagenomic analysis of nematode diversity. Mol. Ecol. Resour. 9, 1439–1450. doi: 10.1111/j.1755-0998.2009.02611.x
Pruesse, E., Quast, C., Knittel, K., Fuchs, B. M., Ludwig, W., Peplies, J., et al. (2007). SILVA: a comprehensive online resource for quality checked and aligned ribosomal RNA sequence data compatible with ARB. Nucleic Acids Res. 35, 7188–7196. doi: 10.1093/nar/gkm864
Raitsos, D. E., Pradhan, Y., Brewin, R. J. W., Stenchikov, G., and Hoteit, I. (2013). Remote sensing the phytoplankton seasonal succession of the Red Sea. PLoS ONE 8:e64909. doi: 10.1371/journal.pone.0064909
Reiss, L., and Hottinger, Z. (1985). The Gulf of Aqaba: ecological micropaleontology. Eos. Trans. Am. Geophys. Union 66:661. doi: 10.1029/EO066i038p00661-05
Roberts, M. B., Jones, G. P., McCormick, M. I., Munday, P. L., Neale, S., Thorrold, S., et al. (2016). Homogeneity of coral reef communities across 8 degrees of latitude in the Saudi Arabian Red Sea. Mar. Pollut. Bull. 105, 558–565. doi: 10.1016/j.marpolbul.2015.11.024
Sambrook, J., and Russell, D. (2001). Molecular Cloning: A Laboratory Manua, 3rd Edn. Cold Spring Harbor, NY: Cold Spring Harbor Laboratory Press.
Siokou-Frangou, I., Christaki, U., Mazzocchi, M. G., Montresor, M., Ribera d'Alcalá, M., Vaqué, D., et al. (2010). Plankton in the open Mediterranean Sea: a review. Biogeosciences 7, 1543–1586. doi: 10.5194/bg-7-1543-2010
Somero, G. N. (2012). The physiology of global change: linking patterns to mechanisms. Ann. Rev. Mar. Sci. 4, 39–61. doi: 10.1146/annurev-marine-120710-100935
Sonnewald, M., and El-Sherbiny, M. M. (2017). Editorial: red sea biodiversity. Mar. Biodivers. 1–3. doi: 10.1007/s12526-017-0648-9
Stillman, J. H. (2003). Acclimation capacity underlies susceptibility to climate change. Science 301, 65–65. doi: 10.1126/science.1083073
Ter Braak, C. J. F., and Šmilauer, P. (2002). CANOCO Reference Manual and CanoDraw for Windows User's Guide: Software for Canonical Community Ordination (Version 4.5). Ithaca, NY: Microcomputer Power.
Tewksbury, J. J., Huey, R. B., and Deutsch, C. A. (2008). ECOLOGY: putting the heat on tropical animals. Science 320, 1296–1297. doi: 10.1126/science.1159328
Wang, Q., Garrity, G. M., Tiedje, J. M., and Cole, J. R. (2007). Naive Bayesian classifier for rapid assignment of rRNA sequences into the new bacterial taxonomy. Appl. Environ. Microbiol. 73, 5261–5267. doi: 10.1128/AEM.00062-07
Webber, M. K., and Roff, J. C. (1995). Annual structure of the copepod community and its associated pelagic environment off discovery Bay, Jamaica. Mar. Biol. 123, 467–479. doi: 10.1007/BF00349226
Wickham, H. (2009). ggplot2: Elegant Graphics for Data Analysis. Available online at: http://ggplot2.org
Wolf-Vecht, A., Paldor, N., and Brenner, S. (1992). Hydrographic indications of advection/convection effects in the Gulf of Elat. Deep Sea Res. A. Oceanogr. Res. Pap. 39, 1393–1401. doi: 10.1016/0198-0149(92)90075-5
Yuval, B., Sudai, L., and Ziv, Y. (2014). Abundance and diversity of Holothuroids in Shallow Habitats of the Northern Red Sea. J. Mar. Biol. 2014, 1–7. doi: 10.1155/2014/631309
Zhan, A., Hulák, M., Sylvester, F., Huang, X., Adebayo, A. A., Abbott, C. L., et al. (2013). High sensitivity of 454 pyrosequencing for detection of rare species in aquatic communities. Methods Ecol. Evol. 4, 558–565. doi: 10.1111/2041-210X.12037
Keywords: metabarcoding, zooplankton, Red Sea, molecular diversity, biomass seasonal patterns
Citation: Casas L, Pearman JK and Irigoien X (2017) Metabarcoding Reveals Seasonal and Temperature-Dependent Succession of Zooplankton Communities in the Red Sea. Front. Mar. Sci. 4:241. doi: 10.3389/fmars.2017.00241
Received: 19 May 2017; Accepted: 18 July 2017;
Published: 02 August 2017.
Edited by:
Sandie M. Degnan, University of Queensland, AustraliaReviewed by:
Emre Keskin, Ankara University, TurkeyLuke Thompson, Southwest Fisheries Science Center (NOAA), United States
Shane Lavery, University of Auckland, New Zealand
Copyright © 2017 Casas, Pearman and Irigoien. This is an open-access article distributed under the terms of the Creative Commons Attribution License (CC BY). The use, distribution or reproduction in other forums is permitted, provided the original author(s) or licensor are credited and that the original publication in this journal is cited, in accordance with accepted academic practice. No use, distribution or reproduction is permitted which does not comply with these terms.
*Correspondence: Xabier Irigoien, xirigoyen@azti.es
Laura Casas, lalaucas@gmail.com
†Present Address: Xabier Irigoien, AZTI-Marine Research, Herrera Kaia, Portualdea z/g–20110 Pasaia (Gipuzkoa), Spain; IKERBASQUE, Basque Foundation for Science, Bilbao, Spain