Long-Term Acclimation to Iron Limitation Reveals New Insights in Metabolism Regulation of Synechococcus sp. PCC7002
 Sonia Blanco-Ameijeiras
 Claudia Cosio
 Christel S. Hassler
- Department F.-A. Forel for Environmental and Aquatic Sciences, University of Geneva, Geneva, Switzerland
In large areas of the ocean phytoplankton growth is limited by the scarcity of iron (Fe), an essential co-factor for multiple enzymes. Phytoplankton has hence developed strategies to survive under Fe limitation. Here, we characterize the response to Fe limitation of the cyanobacterium Synechococcus sp. PCC7002 acclimated to different Fe concentrations in chemically characterized synthetic seawater. The inorganic Fe concentrations used represent levels of Fe limitation relevant for different domains of the contemporary ocean. Combining physiological and transcriptomic approaches, we provide evidence of the progression of the physiological responses to increasing levels of Fe limitation. Our results showed a rising number of significantly regulated genes and the complexity of the response to increasing Fe limitation. Mild Fe limitation induced up-regulation of genes involved in Fe uptake, while genes involved in photosynthesis and respiration were down-regulated. Strong Fe limitation induced up-regulation of genes involved in energy metabolism and concomitant down-regulation of macronutrients uptake. Severe Fe limitation affected fine metabolic regulation of co-factors expression and activation of anti-oxidative stress responses. Our results suggest that homeostasis under long-term Fe limitation put at play dramatically different mechanisms for oxidative stress mitigation and carbon metabolism than those previously reported under Fe stress. Hence, evidence the importance of acclimation processes on the performance of cyanobacteria under Fe limitation conditions.
Introduction
Cyanobacteria appeared in the ocean about 3.4 billion years ago. Evolution under the reductive conditions of ancient ocean favored the “luxurious” use of iron (Fe) in chlorophyll a (Chla) and many redox catalysts involved in different metabolic pathways such as respiration, macronutrients assimilation and detoxification of reactive oxygen species (Sunda, 1989; Sunda and Huntsman, 1995; Raven et al., 1999). However, under the oxygenated conditions of the contemporary ocean the solubility of the thermodynamically stable Fe3+ oxidation state is very low (Martin et al., 1991). Thus, concentration of dissolved Fe (dFe) is typically below 2.5 nM (Saito et al., 2013; Rijkenberg et al., 2014; Hatta et al., 2015).
In cyanobacteria, photosynthetic and respiratory electron flow take place in the thylakoid membranes sharing numerous intermediate transporters that account for about 80% of the cellular Fe biological demand (Scherer et al., 1982; Raven, 1990; Campbell et al., 1998). Typically, the phycobilisomes absorb excitation energy that can be transferred either to photosystem II (PSII) inducing linear flow of electrons from water to NADPH, or to photosystem I (PSI) inducing cyclic electron flow via ferredoxin and NADPH (Allen and Mullineaux, 2004). Subsequently, the resulting proton gradient generated between the lumen and the cytosol will be used to produce ATP, which will be readily available to sustain other metabolic pathways (Campbell et al., 1998). In order to satisfy their Fe biological demand for growth under conditions of Fe limitation, cyanobacteria have developed specialized physiological adaptations that enable them to survive in Fe limiting environments. For instance, they undergo major architectural changes in photosynthetic membranes involving the over-expression of photosynthetic pigments (Ryan-Keogh et al., 2012), the use Fe-economic pathways for ATP synthesis (Bailey et al., 2008), and the reduction of their Fe requirements (Behrenfeld and Milligan, 2013). In addition, some cyanobacteria have also developed specific high-affinity Fe uptake strategies (Morrissey and Bowler, 2012; Kranzler et al., 2014) such as production of siderophores that enhance Fe bioavailability in their immediate environment (Sunda, 2012). Thus, these complex biological interactions with Fe chemistry challenge the quantification of Fe bioavailability in marine environments. In this context, whole-cell Fe-dependent cyanobacterial bioreporter represent a promising tool to determine Fe bioavailability and map the extent and severity of Fe limitation in marine systems These genetically modified organisms produce a bioluminescent signal proportional to the concentration of bioavailable Fe in the cell environment (Bullerjahn et al., 2010). Up to date, the sole cyanobacterial Fe bioreporter available for marine systems was constructed by transformation of the cyanobacterium Synechococcus sp. PCC7002 (Boyanapalli et al., 2007). In order to interpret its output signal and ensure the suitability of the regulatory protein chosen to activate the reporter gene used, its response to Fe limitation and the tolerance mechanisms to different levels of Fe limitation need to be carefully studied.
Here, we examine the physiological and transcriptomic responses of the marine cyanobacterium Synechococcus sp. PCC7002 long-term acclimated to three levels of Fe limitation and Fe replete conditions. Acclimation processes to nutrient limitation involve shifts in metabolic pathways associated to (1) the variation of carbon flux between the major biogeochemical pools (carbohydrates, proteins and lipids) and (2) the variation in the lifetimes of these pools (Halsey et al., 2011). Therefore, while cyanobacteria cells subjected to abrupt-changes in nutrient availability regulate their homeostasis toward a short-term equilibrium, cells acclimated to Fe limitation are expected to operate though different metabolic pathways that are still poorly understood. A large body of research has characterized the physical, biochemical and molecular changes associated with cyanobacteria short-term responses to Fe stress (Wilhelm, 1995; Sandström et al., 2002). In addition, the recent application of genomic tools, have contributed to the understanding of homeostatic responses of these organisms to short-term Fe stress (Singh et al., 2003; Nodop et al., 2008; Thompson et al., 2011; Ludwig and Bryant, 2012). However, in the contemporary ocean, the dominant phytoplankton condition in low Fe regions is Fe limitation rather than Fe stress (Boyle et al., 2005). Therefore, studies focused on long-term acclimation responses to Fe limitation are important to better understand phytoplankton homeostasis under Fe limitation (Halsey et al., 2011; Nunn et al., 2013).
Here Fe homeostasis of Synechococcus sp. PCC7002 was investigated using chemically defined growth medium. The concentrations of Fe' tested here were 36.7, 3.83, 0.47, and 0.047 pM Fe', representing coastal domains (Mahmood et al., 2015), open ocean Fe rich/upwelling domains (Bruland et al., 2001; Buck et al., 2015), and oligotrophic and high-nutrient low-chlorophyll (Tian et al., 2006; Thuróczy et al., 2010; Fitzsimmons et al., 2013; Buck et al., 2015; HNLC) domains, respectively. This characterization of Fe homeostasis at transcriptomic level in Synechococcus sp. PCC7002 provided new insights in the complexity of Fe homeostasis at play in cyanobacteria acclimated to Fe limitation. In addition, comparison of transcriptomic responses between Synechococcus sp. PCC7002 short- and long-term acclimated to Fe dearth suggested dramatically different acclimation mechanisms.
Materials and Methods
Culture Conditions
All solutions were prepared using analytical grade chemicals (Sigma-Aldrich, Buchs, Switzerland) and Milli-Q water 18.2 mΩ (Merk Millipore, Darmstadt, Germany). Manipulations were conducted in a trace metal-clean laminar-flow hood (HEPA, class 100). All the lab-ware and material were trace metal cleaned by 1 week soak in 0.01% citranox, Milli-Q rinsed, and 1 week soak in 1.2M HCl followed by Milli-Q rinsing. Synechococcus sp. PCC7002 was grown in chemically defined modified Aquil medium filter-sterilized (0.2 μm polycarbonate membrane). Culture medium was amended with different concentrations of Fe' (36.7, 3.83, 0.47, and 0.047 pM). Metals were buffered by excess of EDTA (Sunda et al., 2005; Hassler and Schoemann, 2009) and speciation (Supplemental Table S1) calculated from thermodynamic equilibrium using MINEQL + 4.6 (Schecher and McAvoy, 1994) showed <0.6% variation for other metals than Fe.
Synechococcus sp. PCC7002 is an euryhaline strain isolated from a fish hatchery in Puerto rico (Van Baleen, 1962). Axenic cultures of Synechococcus sp. PCC7002 were acclimated to grow under the selected Fe' concentrations for at least 22 generations using semi-continuous batch cultures (Wood et al., 2005) to determine μmax and physiological and genomic analysis in three biological replicates. During incubation the environmental conditions were maintained at 22°C, with 50 μmol quanta m−2 s−1 (cool white fluorescent tubes) under a 12:12 h light:dark cycle. Cells were harvested in mid-exponential growth phase.
Cell Quantification, Size Characterization, and Growth
Cell size and concentration was determined using a cell counter and analyzer system CASY Model TTC (Roche Innovartis, Reutlingen, Germany) with a capillary of 45 μm. Based on the cell density, growth rate (μ) was calculated according to Equation (1).
Where c0 and c1 are the cell concentrations at the beginning and at the end of the experiment, respectively; and Δt is the period of incubation in days.
Photosynthetic Activity Measurements
Photophysiological parameters were obtained from the average of six consecutive acquisitions at 150 ms intervals measured after dark acclimation (1 h) using the Fast Repetition Rate fluorometer (FRRf) FastOcean PTX coupled to a FastAct base unit (Chelsea Technologies Group, Surrey, UK) at 22°C. FRRf was used in single turnover mode, with a saturation phase comprising 100 flashlets on a 2 μs pitch and a relaxation phase comprising 40 flashlets on a 50 μs pitch. Excitation light was produced by a block of 450, 530, and 624 nm light-emitting diodes; with intensities of 0.66 × 10²², 0.40 × 10²², and 1.49 × 10²² photons m−2 s−1, respectively. Acquisitions were corrected for the baseline fluorescence determined on filtered culture medium and fitted to the KPF model (Kolber et al., 1998) using the FastPro8 GUI (Chelsea Technologies Group) to estimate the minimum (F0 = Chla concentration), maximum (Fm) PSII fluorescence yields, σPSII and concentration of PSII reaction centers ([RCII]). Values for Fv/Fm were derived from F0 and Fm according to Equation (2).
The nPSII was estimated as the ratio between the concentration of RCII in mol m−3 and Chla concentration expressed in mol m−3 (Suggett et al., 2004). Even though, the contribution of phycobilisomes and PSI chlorophyll to the cellular fluorescence yield prevent these parameters from representing empirically verifiable indices of photosynthetic performance in cyanobacteria (Campbell et al., 1998), they still can provide valuable information of photosynthesis and overall acclimation status (Ryan-Keogh et al., 2012).
RNA Extraction
Cells for RNA extraction were filtered (0.4 μm polycarbonate membrane) and centrifuged at 6000 × g and 4°C for 8 min, and snap frozen in liquid nitrogen. RNA was isolated using TRI-Reagent (Sigma-Aldrich) following provider's instructions. Ribosomal RNA was depleted using Ribo-Zero™ ribosomal RNA Removal Kit using gram-negative bacteria-specific capture oligonucleotides (Epicentre, Madison, WI, USA). RNA purity and integrity were determined using the Bioanalyzer RNA 6000 Nano Kit (Agilent Technologies, Santa Clara, CA, USA).
cDNA Library Preparation, Sequencing, and Mapping
Libraries were prepared using 200 ng of RNA with the Illumina TruSeq Stranded mRNA kit and sequenced generating 100 bp single reads on an Illumina HiSeq 2500 System (Illumina, San Diego, CA, USA). An average of 17.1 ± 1.3 × 10⁶ single-end reads were generated per sample (Supplemental Table S2). Quality control was performed using FastQC tool (Babraham Bioinformatics, Cambridge, UK). Reads were aligned to the genome of Synechococcus sp. PCC7002 build from the Cyanobase (Fujisawa et al., 2013) and further analyzed using TopHat 2.0 mapper software (Trapnell et al., 2009). Alignment metrics were obtained using Picard Tools (http://broadinstitute.github.io/picard) and table of counts using the HTSeq0.5.3.p9 (Anders et al., 2015). Reads mapped to the reference genome at 88.7 ± 6.9% (Supplemental Table S2). The RNA-Seq data are deposited in the Gene Expression Omnibus database (accession GSE77354).
RNA-Seq Analysis
Read counts were normalized to library size. The genes having counts above 1 count per million (cpm) reads in at least 3 samples were further analyzed. Differential expression analysis was performed with the statistical analysis R/Bioconductor package edgeR 3.4.2. (Robinson et al., 2010). P-value of differentially expressed genes (DEG) was corrected for multiple testing error with a 5% false discovery rate (FDR) based on the Benjamini-Hochberg procedure (Storey and Tibshirani, 2003). Expression levels (indicated as fold change; log2 FC) of genes for each Fe limiting treatment (0.047, 0.47, and 3.83 pM Fe') were normalized to control treatment (36.7 pM Fe') and considered when the FDR of the adjusted P-value was < 0.05 and the log2 FC was >|2|. Supplemental Table S3 contains the list of all genes differentially expressed under the three Fe levels of Fe limitation tested, with their log2 FC, log2 CPM, P-value and FDR, as well as their putative function and functional category defined in Cyanobase (Fujisawa et al., 2013).
Comparative analyses of DEG were performed using Venn Diagrams tool (Bioinformatics & Evolutionary Genomics, University of Gent, Belgium). Categories “hypothetical proteins,” “unknown,” and “other categories” constituted 54.5% of the DEG (1,764 genes) were not considered to ease the visualization of known functions.
Reverse Transcriptase Quantitative Polymerase Chain Reaction (RT-qPCR)
RNA-Seq results were independently validated by RT-qPCR by regression analysis between RT-qPCR and RNA-Seq for a subset of 11 genes selected because of their contrasted fold change in RNA-Seq analyses (Supplemental Figure S1; Supplemental Table S4).
Statistical Analyses
All data are given as the means of the three biological replicates and its standard deviation. Significant differences between the treatments were tested using one-way ANOVA. When significant differences were encountered Holm-Sidak tests with P ≤ 0.05 were performed using SigmaPlot (SysStat Software, CA, USA).
Results
Physiological Responses to Fe Limitation
Fe concentrations used here were determined using Michaelis-Menten fit for growth rate (μ) at exponential growth phase under different dissolved inorganic iron (Fe') concentrations (Supplemental Figure S2). Maximum growth rate (μmax) of 0.87 ± 0.04 d−1 was observed at high Fe' concentrations (36.7 pM). At lowered Fe', growth rate was sub-optimal with a half requirement for growth of 0.29 nM Fe' calculated according to Michaelis-Menten (Figure 1A). Based on this, the experimental growth media were selected to represent optimal growth rate (36.7 pM Fe'), mild Fe limitation (0.47 pM Fe') and severe limitation (0.047 nM Fe'). These Fe' concentrations represent Fe replete, mild Fe limitation (mild-Felim), strong Fe limitation (strong-Felim) and severe Fe limitation (severe-Felim), respectively. In this context, cell diameter also decreased from 2.61 ± 0.02 μm to 2.21 ± 0.01 μm as concentration of Fe' decreased (Figure 1B). In addition, cellular content of in vivo Chla significantly decreased from 12.2 ± 0.2 fg (replete Fe) to 5.0 ± 0.4 fg (mild-Felim), whereas in all Fe limited treatments cellular content of in vivo Chla remained similar (Figure 2A). Contrary, the maximum PSII photochemical yield (Fv/Fm) did not show significant differences between replete Fe and mild-Felim treatments (0.38 ± 0.01 and 0.36 ± 0.02, respectively), although, it significantly decreased to 0.31 ± 0.01 and 0.24 ± 0.02 under strong-Felim and severe-Felim conditions (Figure 2B). Meanwhile, the PSII functional absorption cross-section (σPSII) was 2.16 ± 0.02 nm2 under Fe replete conditions and decreased down to 1.91 ± 0.06 and 1.95 ± 0.01 under mild-Felim and strong-Felim, respectively (Figure 2C). Contrary, under severe-Felim, σPSII significantly increased up to 2.08 ± 0.06. Interestingly, photosynthetic unit size of PSII (nPSII) showed the inverse trend (Figure 2D).
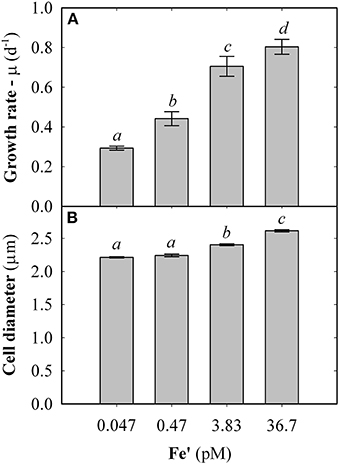
Figure 1. Physiological changes in response to bioavailable iron (Fe) in the culture medium. (A) Growth rate. (B) Cell diameter. Error bars represent standard deviation. Letters indicate no statistical significant difference amongst treatments (P > 0.05). Holm-Sidak method used for pairwise multiple comparisons.
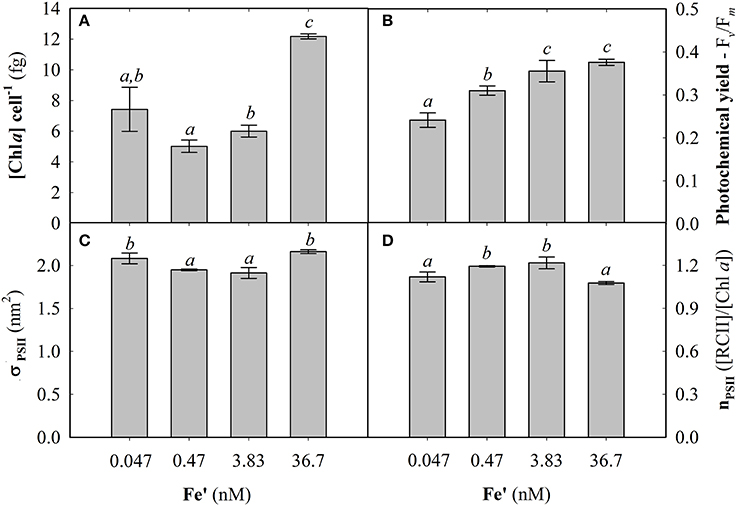
Figure 2. Photophysiological changes in response to bioavailable iron (Fe) in the culture medium. (A) Cellular concentration of chlorophyll a (Chla). (B) Maximum photochemical yield. (C) Functional absorption cross-section of photosystem II (PSII). (D) Photosynthetic unit size of PSII. Letters indicate no statistical significant difference amongst treatments (P > 0.05).
Global Features of the Transcriptional Response to Fe Limitation
Amongst the 3,235 genes that constitute the genome of Synechococcus sp. PCC7002, 37% of them were significantly regulated under mild-Felim. Under increasing severity of Fe limitation, the amount of genes significantly regulated increased up to 48% under strong Fe-lim and 63%, under severe-Felim, suggesting an enhanced differential regulation of cellular metabolism (Figure 3). The transcriptomic response was dominated by genes up-regulation (2.2 up-regulated (UR)/down-regulated (DR) ratio) under mild-Felim. However, with higher severity of Fe limitation, the UR/DR ratio decreased to 1.4 under strong-Felim and 1.1 under severe-Felim.
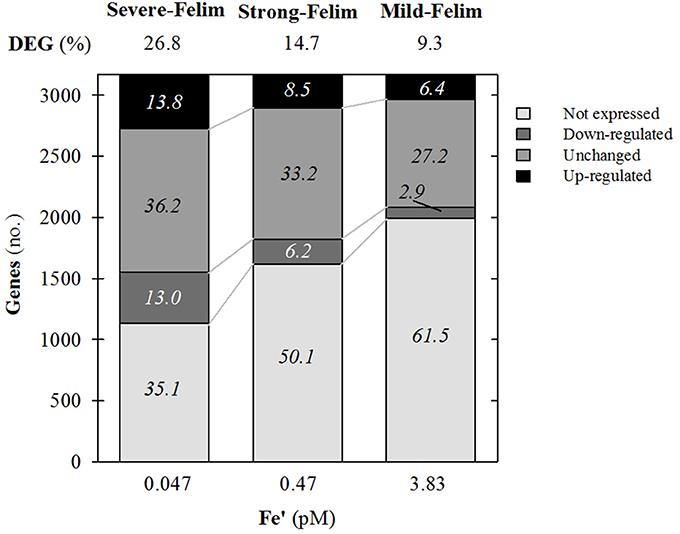
Figure 3. General features of the whole genome transcription response of Synechococcus sp. PCC7002 in response to iron (Fe) limitation. Relative change in expression compared to Fe replete condition. Values on top indicate the percentage of differentially expressed genes (DEG). Values on stacks indicate the relative contribution to the whole genome in percentage.
From the 997 DEG under the three conditions of Fe limitation, based on the results of the Venn diagram (Figure 4), three major groups were differentiated and associated to three response levels to Fe limitation: (i) general response to Fe limitation, which included 205 genes that were differentially expressed in the three Fe limitation conditions; (ii) specific response to strong-Felim, which included 188 that were differentially expressed under strong-Felim and severe-Felim; and (iii) specific response to severe-Felim, which included 459 genes that where differentially expressed only under severe-Felim. Then, these three groups were further investigated based on the classification of genes in functional categories defined in Cyanobase (Fujisawa et al., 2013). The DEG included in the four other groups (Figure 4) represented 5% of the total of DEG and were not included in further analysis. The list of genes included in each group of (Figure 4) is available in Supplemental Table S5.
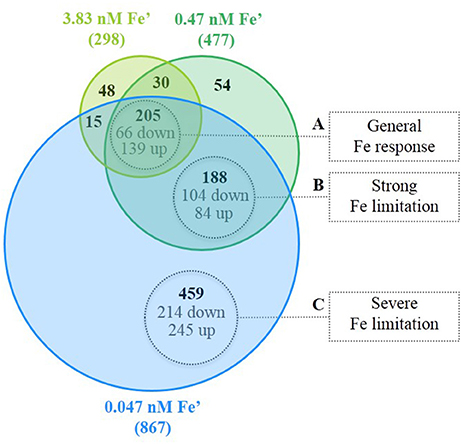
Figure 4. Differentially expressed genes (DEG) in response to iron (Fe) limitation. Venn diagram represents the amount of DEG for the different treatments with Fe limitation in relation to the Fe replete condition (bold values). Values in gray indicate the amount of genes significantly up- and down-regulated.
General Response to Fe Limitation
For the three levels of Fe limitation tested, about 50% of the transcriptomic general response to Fe limitation was represented by up-regulation of 27 transcripts encoding transport and binding proteins, including specific Fe transporters (fecB, fecC, sufA, SYNPCC7002_G0080, SYNPCC7002_G0083, SYNPCC7002_G0086, SYNPCC7002_G0079, SYNPCC7002_G139), specific sulfate transporters (cysA, cysT, cysW, and sbpA), ATP-binding cassette (ABC) transporters, TonB-dependent siderophore receptors (SYNPCC7002_G0081, SYNPCC7002_G0006, SYNPCC7002_G0098), ferric aerobactin receptor (SYNPCC7002_G0095), and FeS assembly proteins (sufB and sufC) (Figure 5A; complete list of genes provided in Supplemental Table S6). Besides, other genes encoding for transport and binding proteins non Fe-specific (pstS, bicA, and napA) were down-regulated, contributing to 19% of the down-regulatory response (Figure 5B). Photosynthesis related genes such as isiA encoding for a chlorophyll-binding protein involved in light-harvesting (Bibby et al., 2001) and isiB, encoding for flavodoxin (a non Fe-containing electron carrier), represented only 5.6% of the up-regulatory response. Meanwhile, 33% of the significantly down-regulated genes were involved in photosynthesis and respiration, including genes encoding for different subunits of ATP synthase (atp1), NADH dehydrogenase (ndhF-III), PSI (psaA and psaB) and soluble electron carriers (nifJ, petF and SYNPCC7002_A0251). In addition, significant up-regulation of genes involved in regulatory functions represented 13% of DEG, including four transcriptional regulators from the araC family (positive transcriptional regulators with a DNA-binding domain; Gallegos et al., 1997) and a two-component transcription regulator (SYNPCC7002_A1110). Of relevant importance for the cellular metabolism is the down-regulation of the gene encoding for the transcription regulator of Ribulose-1,5-bisphosphate carboxylase/oxygenase (RuBisCO, rbcR; Badger and Bek, 2008), and the phosphoenolpyruvate synthase (ppsA), which are involved in carbon fixation and energy metabolism, respectively. Finally, genes involved in amino acid biosynthesis; biosynthesis of co-factors, prosthetic groups and carriers; and in translation functional categories represented a 7, 6, and 6% of the general up-regulatory response, respectively. Interestingly, the latter group contained the gene SYNPCC7002_A0302 encoding for a ferritin-like domain DpsA family, involved in Fe storage and control of oxidative stress. Simultaneously, the gene encoding the antioxidant enzyme SodB, a Mn-superoxide dismutase involved in minimization of cellular oxidative stress that requires Fe as a co-factor (Latifi et al., 2009), was significantly down-regulated. Thus, the genes significantly regulated under the three levels of Fe limitation, showed that global nutrition and energy metabolism were already affected under mild-Felim.
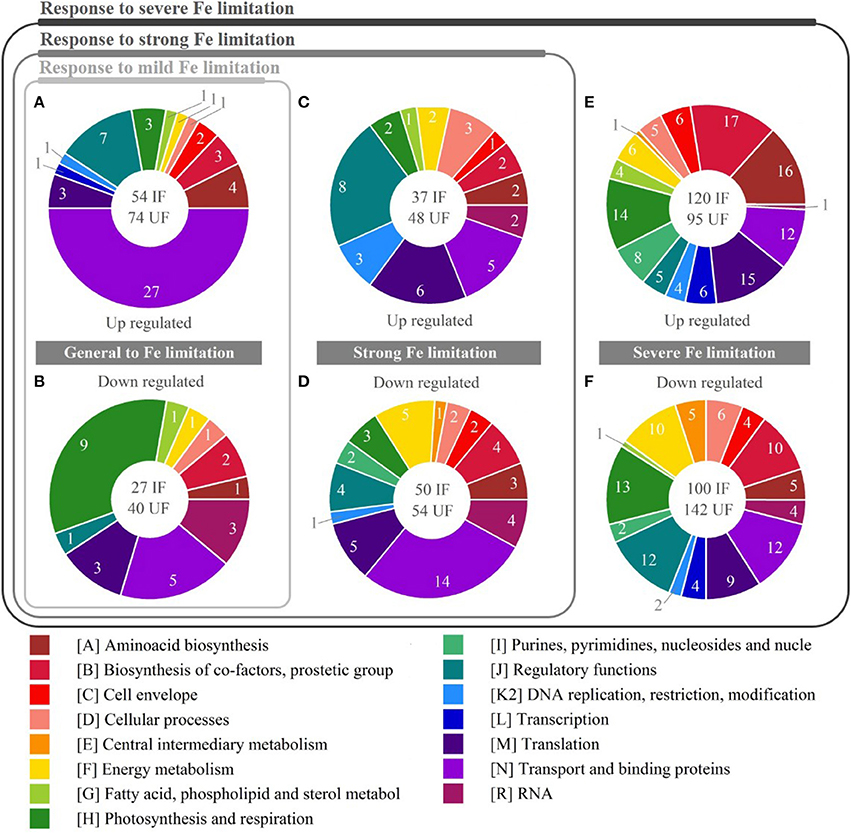
Figure 5. Functional categories regulated in response to iron (Fe) limitation. Pie charts show relative amount of DEG for three levels of response to Fe limitation. In the white circle: IF indicates the amount of differentially expressed genes (DEG) with identified function; UF (not considered in the chart) the amount of DEG with unidentified function. Pies (A,B) represent the up-regulated and down-regulated genes, respectively, in response to mild Fe limitation. Pies (C,D) represent the up-regulated and down-regulated genes, respectively, in response to strong Fe limitation. Pies (E,F) represent the up-regulated and down-regulated genes, respectively, in response to severe Fe limitation.
Specific Response to Strong-Felim
The down-regulatory response to strong-Felim, included the genes differentially expressed under strong and severe Fe limitation simultaneously. The largest contribution to this specific response, overlapping the above discussed general response to Fe limitation, was represented by significant down-regulation of genes encoding for transport binding proteins (28%). In this group were observed phosphate transporters (pstA and pstB]), different ammonium transporters (atm, SYNPCC7002_A2208, SYNPCC7002_A2208), a sodium-coupled permease (SYNPCC7002_A1142), and a putative sodium/sugar symporter (SYNPCC7002_A0460). Interestingly, the gene SYNPCC7002_A1475 encoding for a nitrogen assimilation regulatory protein was also down-regulated, suggesting its role linking regulation of nitrogen assimilation and amino-acids biosynthesis. In the up-regulatory response to strong-Felim genes with regulatory functions, including the ferric uptake regulator (fur) and several uncharacterized two-component regulators, represented a 21% (Figure 5C; complete list of genes provided in Supplemental Table S6). Down-regulated transcript encoding genes with regulatory functions contributed to 9% of the response (Figure 5D; complete list of genes provided in Supplemental Table S6). The specific response to strong Fe-lim, at the level of photosynthesis and respiration represented only 6 and 7% of the down-regulated and up-regulated genes, respectively. The genes significantly down-regulated included the cytochrome c553 precursor (petJ) and a putative phycobilisome degradation protein (nblA). Meanwhile the up-regulated genes encoded for a carbon concentration mechanism (ccmK) and the PSI reaction center subunit X (psaK), indicating the fine tuning of the photosynthetic activity occurring under strong-Felim. Moreover, genes involved on different catabolic and anabolic pathways related to energy metabolism contributed to 10% of the down-regulating response (sucC: involved in TCA clycle, putA: involved in arginase degradation pathway, tal: involved in the oxidative pentose phosphate (OPP) pathway and pgk: involved in different pathways including glycolysis, glucogneogenesis, Calvin-Bensons-Bassham cycle, and glycerol degradation), suggesting an increasing importance of the metabolic regulation at this level of Fe limitation. In addition, the genes encoding proteins involved in translation processes such as RypA, PrfA, Aat, (involved in protein modification and translation factors), RbpA (RNA-binding protein) and Gcp (metalloendopeptidase), contributed to 16% of the up-regulatory response, suggesting an important adjustment in gene expression processes. Finally, up-regulation of genes involved in processes of DNA restriction (radA), methylation (SYNPCC7002_C0006) and reparation (SYNPCC7002_E0012) (processes associated to cellular stress) represented 8% of DEG, indicative of a higher stress level suggesting some oxidative stress and DNA damage.
Specific Response to Severe-Felim
In their specific response to severe-Felim cells underwent further adjustments of their gene expression levels (Figure 5E; complete list of genes provided in Supplemental Table S6). Up-regulation of photosynthesis and respiration contributed to 12% of DEG, including genes encoding for carbon concentrating mechanism (ccmL, ccmK2, ccmK) and carbonic anhydrase (icfA), that catalyzes the formation of carbon dioxide (CO2) from bicarbonate () at rates high enough to saturate the carboxylation reaction of RuBisCO (Price et al., 2008). In addition, psbA-II (encoding the photosystem II reaction center D1 subunit) and different components involved in oxidative phosphorylation processes (ctaEII, cytM, SYNPCC7002_A1097) were also up-regulated. Similarly, the down-regulatory response of photosynthesis and respiration contributed with 13.5% of DEG, including genes encoding for different components of PSII (psbB, psbO, psbT, psbY), cytochrome b6/f complex (petM), cytochrome oxidase (ctaEI), and the precursor of cytochrome c550 (psbV) (Figure 5F; complete list of genes provided in Supplemental Table S6). This suggests a trade-off between a down-regulation of the linear electron transfer chain and the cyclic electron transference, as well as an efficiency increase capturing inorganic carbon in the carboxysomes. Genes involved in biosynthesis of co-factors, prostetic groups and carriers accounted for 14% of the up-regulatory response. Amongst them were observed several genes encoding proteins that participate in the porphyrin (HemB, HemC, HemF, HemH, CobA, and CobU) and chlorophyll (ChlM and ChlI) metabolism, as well as in vitamins biosynthesis (BioB, PdxH, MenA, and MenC). Interestingly, the down-regulatory response (10%) included the gene chlN, which encodes a protein involved in chlorophyll biosynthesis (light-independent pathway).
The up-regulatory response of genes involved in energy metabolism accounted for 5% DEG, including rpe and rpiA, encoding for proteins involved on the OPP pathway that oxidizes glucose to generate NADPH, pentoses (5-carbon sugars) and ribose-5-phosphate (precursor for synthesis of nucleotides). Interestingly, SYNPCC7002_A1583, encoding for a putative glycolate oxygenase subunit, involved in the photorespiration (typically occurring when RuBisCO reacts with oxygen rather than CO2) was up-regulated, suggesting that despite the up-regulation of carbon concentrating mechanism, there was a decrease in carbon fixation efficiency. The down-regulatory response of genes involved in energy metabolism accounted for 10% DEG. The gene encoding for FrdA (succinate dehydrogenase flavoprotein subunit) that participates in both the tricarboxylic acid (TCA) cycle and the electron transport chain was down-regulated. Similarly, gap, which product is involved in the glycolysis, and genes involved in the OPP pathway (zwf, gnd, and opcA), were down-regulated, suggesting a readjustment of the energy production pathways while cell respiration was down-regulated. Genes involved in regulatory functions contributed to 13% of the down-regulatory response including several two-component regulators, transcription regulators (TetR family, Crp/Fnr family) and genes encoding proteins with sensorial properties (cheY, pknA, and SYNPCC7002_A2167), suggesting that severe-Felim diminishes cellular capacity to respond to environmental stimuli and highlighting the cost of the tolerance/adaptation/stress response to the cells. Amongst the significantly up-regulated genes encoding proteins involved in translation processes were included ribosomal proteins (RpsK, RpsM, RpsH), aminoacyl tRNA synthases (TyrS, SerS, AsnS, MetG) and other enzymes essential for translation of RNA into peptides (MiaA, RimM). Thus, there is increasing production of peptides, which indicates metabolic acclimation. Finally, regulation of genes encoding for transport and binding proteins contributed to 10 and 13% of the up-regulatory and down-regulatory response, respectively, under severe-Felim. At this level no additional genes encoding metal specific transporters were differentially expressed. Only different components of ABC transporters and ion channels were differentially expressed.
Discussion
Experimental Considerations and Environmental Relevance
Phylogenic comparison of 54 cyanobacteria genomes recently sequenced revealed that Synechococcus sp. is a polyphyletic group with large genetic variability (Shih et al., 2013). The coastal strain Synechococcus sp. PCC7002 grouped in a subclade separated from the most abundant oceanic Synechococcus and Prochlorochoccus strains (Flombaum et al., 2013; Shih et al., 2013). In this regard, metabolic comparison of 16 marine cyanobacteria genomes based on likely ortholog genes have shown that oceanic Synechococcus sp. and Prochlorococcus marinus strains presented exclusive genes (absent in other cyanobacteria including Synechococcus sp. PCC7002) encoding for enzymes related to defense response, DNA integration and regulatory processes (Beck et al., 2012). Similarly, oceanic strains lack genes common to all the other strains (including Synechococcus sp. PCC7002), such as certain metalloenzymes, high affinity siderophore uptake mechanisms (Palenik et al., 2006; Hopkinson and Morel, 2009). These differences highlight specific adaptations to different environments (Sohm et al., 2016). However, pathways related to gene expression and central metabolism such as the Calvin-Benson-Bassham cycle, and nucleotide and amino acid biosynthesis and photosynthesis were highly conserved amongst cyanobacteria (Dufresne et al., 2008; Beck et al., 2012). Thus, despite the arguably suitability of Synechococcus sp. PCC7002 as a model marine cyanobacteria, the understanding of its Fe homeostasis under Fe limiting conditions is crucial for the application of the only cyanobacterial Fe bioreporter available (builded by transformation of this strain) to quantify Fe availability in marine environments. Here we documented for the first time the transcriptomic responses of cyanobacterium Synechococcus sp. PCC7002 acclimated to three levels of Fe limitation in a chemically characterized media. Acclimation to different Fe' concentrations is essential to directly investigate the physiological and transcriptomic responses resulting from Fe homeostasis (Mock and Hoch, 2005). Typically, transcriptomic studies, report short-term responses to Fe stress induced by starvation through omission of Fe in the culture medium (Nodop et al., 2008; Jiang et al., 2015) or addition of a strong Fe binding ligand such as desferrioxamine B (Shcolnick et al., 2009; Ludwig and Bryant, 2012). However, with exception of final phases of a phytoplankton bloom, abrupt increase in Fe limitation is not common in marine environment. Therefore, long-term acclimation provides a more realistic interpretation of the Fe homeostasis in the ocean. In order to ensure acclimation, here we used cultures growing in steady state in presence of a metal buffer (EDTA) to keep Fe' constant during cellular growth (Sunda et al., 2005) for at least 22 generations. The concentrations of available Fe tested here represent levels of Fe limitation found in coastal domains (36.7 pM Fe'; Mahmood et al., 2015), that we used as a control here, open ocean Fe rich/upwelling domains (3.83 pM Fe'; Bruland et al., 2001; Buck et al., 2015), and oligotrophic (0.47 pM Fe'; Fitzsimmons et al., 2013; Buck et al., 2015) and HNLC (0.047 pM Fe'; Tian et al., 2006; Thuróczy et al., 2010) domains. To our knowledge, this is the first study that compares acclimated Fe homeostasis of cyanobacteria at transcriptomic level in three relevant domains of the contemporary ocean were Fe availability has enormous impacts on primary productivity.
Fe Homeostasis Regulation under Increasing Fe Limitation
The Fe-sensing regulator fur has been suggested as a global regulator of Fe homeostasis (Braun, 2003). Here, significant up-regulation of fur occurred only under strong-Felim and severe-Felim. Amongst the four genes from the araC family up-regulated under mild-Felim, SYNPCC7002_G0096, SYNPCC7002_G0099, and SYNPCC7002_G0104 were found to be also up-regulated in mutants of Synechococcus sp. PCC7002 with disrupted fur expression (Ludwig et al., 2015). This suggests that these genes are regulated by fur which can act as repressor but also as positive regulator of Fe homeostasis under Fe replete conditions (Lee and Helmann, 2007). However, the role of the araC family on the Fe homoeostasis under Fe limitation is still unresolved. At each level of the three Fe limitation investigated several transcriptional regulators were differentially expressed, but their function is still unknown. Hence, unveiling the specific role of these genes on cellular homeostasis is fundamental to understand specific acclimation process at each level of Fe limitation.
Modulation of Fe Uptake Systems
One of the most documented responses to Fe limitation, is the up-regulation of high affinity Fe uptake systems (Morrissey and Bowler, 2012). Our results showed a strong regulation of Fe specific transporters under mild-Felim. Interestingly, up-regulation of genes involved in biosynthesis of siderophores (high-affinity ligands that strongly bind Fe; Hopkinson and Morel, 2009) were already observed under mild-Felim indicating an activation of high-affinity Fe uptake systems at an early stage of limitation. Trick and Wilhelm (1995) suggested that Synechococcus sp. PCC7002 only express siderophore receptors under severe limitation. However, we observed that also genes encoding for siderophore receptors were expressed already under mild-Felim. Thus, together with the decrease of cell size (Figure 1B), that increases the cellular specific surface, the up-regulation of high-affinity uptake systems (Kranzler et al., 2014; Jiang et al., 2015) enhances Fe bioavailability to the cell already at Fe' concentration typical of oceanic Fe rich systems.
Mechanisms to Cope with Oxidative Stress
Because of the high biological Fe demand associated with photosynthesis and respiration, reduction of Fe rich molecules and replacement for homologous that do not require Fe is also a common strategy observed under Fe limitation (Behrenfeld and Milligan, 2013). In this context, we observed that expression of isiB (encoding for flavodoxin, a Fe free electron transfer flavoprotein) reached maximum levels under mild-Felim, whereas petF and SYNPCC7002_A0251 (ferredoxin-like proteins containing a 2Fe-2S assembly complex) decreased gradually as the severity of Fe limitation increased. Under mild-Felim psaA and psaB, encoding PSI subunits containing two 4Fe-4S shared complexes, were already down-regulated. Thus, the amount of complete PSI was initially reduced under mild-Felim. However, the expression of psaK, putatively involved in the process called state transition (Fujimori et al., 2005), increased under strong-Felim. The state transition is the process of re-distribution of light energy absorbed by the antenna from PSII to PSI under high light which has been associated to photo-damage prevention under high light conditions (Campbell et al., 1998). Under severe-Felim, the architecture of the photosynthetic electron chain was drastically modified by down-regulation of the PSII subunits, cytochromes and ATPase. While the decrease of photosynthetic yield illustrated the impact of strong- and severe-Felim, the apparent increase in σPSII and Chla cellular content (Figure 2A) could be related to the up-regulation of genes involved in porphyrin and chlorophyll metabolism under severe-Felim. However, these tetrapyrroles do not seem to serve photosynthetic unit size (Figure 2D). Instead, they could play a key role in detoxification of reactive oxygen species (Busch and Montgomery, 2015), that are produced as a result of the low capacity for electron transfer under Fe limitation. Indeed, protoporphyrin and other tetrapyrroles have been reported to have antioxidant properties (Mölzer et al., 2012). This lead us to hypothesize that the up-regulation of genes involved in porphyrin and chlorophyll metabolism under severe-Felim is reflected in the increase of the energetically detached light harvesting complexes that accumulate in the cells under severe-Felim reported by Schrader et al. (2011). Therefore, the accumulation of energetically detached light harvesting complexes, when the progressive reduction of Fe rich structures in the photosynthetic apparatus leads to a concomitant increase of photooxidative stress, seems to play a role in the mitigation of oxidative stress associated to Fe limitation. Additionally, under severe-Felim cells actively minimize reactive oxygen species damage by up-regulating ctaEII (encoding for a respiratory terminal oxidase) and cytM (encoding for cytochrome cM, a soluble electron carrier), which help to remove the electron excess (Latifi et al., 2009). Under mild-Felim the genes involved on photoprotection strategies two hli genes (SYNPCC7002_A0186 and SYNPCC7002_A2256, and isiA) were significantly up-regulated preventing production of reactive oxygen species.
Carbon Metabolism
Other metabolic pathways were also affected by increasing Fe limitation. The rbcR was down-regulated under mild-Felim. Concomitantly, bicA (a trans-membrane protein involved in transport of ; Price et al., 2008) and other trans-membrane proteins involved on maintenance of intracellular pH homeostasis required during carbon acquisition and storage (NapA, NdhL, NdhD-III, NdhF-III, and MnhD1/D2) were also down-regulated, suggesting a decrease in the carbon uptake rate under mild-Felim. Under severe-Felim, the up-regulation of the gene SYNPCC7002_A1583 suggested an increase in RuBisCO oxidase activity that enhance photorespiration, resulting in carbon and energy losses (Bauwe et al., 2010; Hackenberg et al., 2011). As a compensatory mechanism to increase CO2 concentration in the RuBisCO carboxylation reaction center under severe-Felim (Price et al., 2008), we observed an up-regulation of genes encoding high-affinity carbon concentrating mechanism (ccmL, ccmK2, ccmK) and the carboxysome carbonic anhydrase (icfA). However, decrease in growth rate and cell size suggested less efficient carbon assimilation under severe-FeLim. In that case, it would be expected that the macronutrient requirements also decrease, which was in line with the observed down-regulation of transmembrane proteins involved in uptake of nitrogen and phosphorus (pstA, pstB, amt). Thus, under severe-Felim, cells try to maintain the cellular stoichiometry while minimizing photorespiration that induces the formation of reactive oxygen species.
The modifications to survive under Fe limitation entail an energetic cost (Arendt, 1997). Synechococcus sp. PCC7002 gradually modulates its metabolism according to the severity of Fe limitation. The ppsA encodes phosphoenolpyruvate synthase, a central enzyme of the gluconeogenesis pathway that synthetizes glucose from non-sugar compounds or the intermediates of the TCA cycle (Sauer and Eikmanns, 2005; Marrero et al., 2010). PpsA competes with pyruvate dehydrogenase, which mediates the formation of acetyl coenzyme A, the starting metabolite of the TCA cycle (Chao et al., 1993). Thus, up-regulation of ppsA under mild-Felim suggested a lessening in the TCA cycle, which produces ATP and precursors for molecular building blocks (e.g., carbohydrates, lipids, amino-acids and nucleotides). The down-regulation of pgk (encoding for a phosphoglycerate quinase involved in glycolysis) under strong-Felim, and zwf (involved in OPP pathway, which represents a major source of reducing equivalents for biosynthesis reactions) under severe-Felim indicated a progressive decrease on the sugar catabolism reactions (Osanai et al., 2005). In addition, under severe-Felim, the up-regulation of rpe (encoding for Ribulose-phosphate 3-epimerase) and rpiA (encoding for Ribose 5-phosphate isomerase), involved both on the Calvin-Benson-Bassham cycle, suggest a further enhancement of anabolic metabolism providing cellular building blocks and the reductants required to maintain cellular metabolism.
Fe Starvation vs. Fe Limitation Transcriptomic Responses
A recent study have demonstrated that diatoms long-term acclimated to Fe limitation show differential responses than those under abrupt Fe starvation (Nunn et al., 2013). In order to better understand the adaptive strategies of Synechococcus sp. PCC7002 to Fe limitation we compared our results under severe-Felim with those reported by Ludwig and Bryant (2012) for the same strain, where the response to short-term Fe starvation was induced by addition of deferoxamine mesylate B (DFB), a high-affinity Fe-binding ligand, in the culture media and investigated at transcriptomic level using SOLID sequencing. The amount of genes DEG under Fe starvation (966) compared well with our severe-Felim (861) experimental treatment. However, only 30% of the significantly regulated transcriptome under Fe starvation (224 DEG) was also significantly regulated under severe-Felim (Supplemental Figure S3). Amongst the genes expressed under both types of Fe stress (sensu; Halsey and Jones, 2015), 38% of up-regulated genes with known function were encoding for multiple ABC uptake transporters and binding proteins (including SufA, SufB, SufC, FecC, FecD, FhuA, and CysT), and regulatory functions (AraC family; complete list of genes is provided in Supplemental Table S7). Whereas, 23% of down-regulation affected genes related with photosynthesis and respiration that encoded soluble electron carriers (PetF, NifJ) and subunits of electron transport chain (PsbT, PsbV, Atp1, and PetJ), as previously observed.
The main differences between Fe starved and Fe limited cells were observed at the level of photosynthesis and respiration, energy metabolism and translation processes (Supplemental Figure S4; complete list of genes is provided in Supplemental Table S7). Fe starved cells shown a down-regulation of multiple PSII and PSI subunits, as well as phycobilisome components (Apc, subunits B, C, D, E, and F, as well as Cpc, subunits A, B, D, F, and G), suggesting a decrease on the photochemical energy acquisition and linear electron transport (Ludwig and Bryant, 2012). Simultaneously, these cells have up-regulated genes encoding for the NADH dehydrogenase complex (Ndh, notably the subunits A, B, C, D2, G, and K), ATPase (Atp, subunits A, C, and G) and the respiratory terminal oxidase (CtaC, CtaE), suggesting an increase respiratory processes. Contrary, in Fe limited cells only genes encoding for PSII (Psa, subunits D, E, F, J, L, O, and U), soluble electron carriers and NADH dehydrogenase were down-regulated, while PSI reaction center (psaK) and ATPase subunits (AtpH, AtpF) were up-regulated. Therefore, suggesting a prevalence of alternative electron flow pathways, which provide ATP to maintain other cellular functions. Differential response to Fe starvation and limitation can also be seen on energy metabolism. Indeed, Fe starved cells showed a mild up-regulative response of their energy metabolism intensifying only the gluconeogenesis and the Calvin-Benson-Hassham cycle, while only six genes involved in glycolysis were down-regulated. However, in Fe limited cells additional up-regulation of gluconeogenesis and the Calvin-Benson-Hassham cycle was also accompanied of increasing sugar biosynthesis and glycolate pathway, as well as carbon hydroxide concentration mechanism (CcmKL) and carbonic anhydrase (IcfA). Furthermore, Fe limited cells underwent a much larger down-regulation of catabolic pathways, including OPP, glycolysis and pyruvate acetyl-CoA (16 genes). These results suggest a more complex and elaborated response of the energy metabolism under Fe limitation. Similar results were observed using proteomic analysis for the diatom Thalassiosira pseudonana, where OPP proteins were significantly more abundant under Fe limitation (Nunn et al., 2013). Additionally, protein metabolism also showed contrasting differences between Fe starvation and limitation conditions. Fe starved cells down-regulated 42 genes mainly encoding ribosomal proteins, typically involved in protein synthesis and modification processes, while Fe limited cells up-regulated 16 genes encoding proteins involved in protein degradation, which might represent a significant source of energy to sustain other physiological processes under these Fe restrictive conditions. These results are also in good agreement with those reported for Fe limited T. pseudonana, where processes involved in intracellular protein recycling were up-regulated (Nunn et al., 2013). Finally, the comparison between Fe stressed and Fe limited cells highlighted the adoption of different strategies to mitigate oxidative stress. Fe starved cells responded to oxidative stress inducing up-regulation of flavoproteins (flv1 and flv2; Ludwig and Bryant, 2012), while in Fe limited cells, these genes were constitutively expressed and others such as Mn-superoxide dismutase (sodB), cyanoglobin (ctb), methionine sulfoxide reductase (msrB), glotaredoxin (grxC), and thioredoxin (trxB) were significantly down-regulated. Therefore, these results show differences in energetic cost of short-term and long-term homeostasis under Fe limitation as well as specific adjustments in different metabolic pathways. These differential responses highlight a prominent role of acclimation processes under Fe limitation, especially on the mechanisms to cope with oxidative stress and the adaptation of energy metabolism.
Conclusion
Decreasing Fe availability has great impact on the metabolism of Synechococcus sp. PCC7002. Overall, the data presented here provide evidence of the transcriptomic and physiological response of cells acclimated to different levels of Fe limitation relevant to the contemporary ocean. This work clearly illustrated the complexity of the long-term Fe homeostasis under limited conditions with trade-off strategies and numerous metabolic pathways being affected from nutrient uptake to energy metabolism and oxidative stress. In addition, we have demonstrated that the responses of Synechococcus sp. PCC7002 acclimated to Fe limitation are dramatically different than under Fe starvation conditions, which evidences contrasting metabolic shifts associated to acclimation processes under Fe dearth. In this context, the DEG with regulatory functions detected under Fe limitation open new opportunities for investigation of acclimation processes to different levels of Fe limitation as well as its metabolic and biogeochemical implications.
Author Contributions
SB and CH conceived the original screening and research plans, designed the experiments and analyzed the data. CH supervised the experiments; SB conceived the Project, wrote the article with contributions of all the authors and performed most of the experiments. CC provided technical assistance to SB, supervised and completed the writing.
Conflict of Interest Statement
The authors declare that the research was conducted in the absence of any commercial or financial relationships that could be construed as a potential conflict of interest.
Acknowledgments
This work was supported by the Swiss National Science Foundation (FNS PP00P2-138955) and the Ernst and Lucie Schmidheiny Foundation. We thank Rebecca Beauvais-Flück, Damien Cabanes, Sophie Moisset, Dr. Fabrice Carnal, Dr. Mark Rozmarynowycz as well as Profs. Robert McKay and George Bullerjahn for their advice and support, ancillary measurements and providing the strain used here. We are also grateful to the staff from iGE3 genomics platform (Geneva, Switzerland).
Supplementary Material
The Supplementary Material for this article can be found online at: https://www.frontiersin.org/article/10.3389/fmars.2017.00247/full#supplementary-material
References
Allen, J. F., and Mullineaux, C. W. (2004). “Probing the mechanism of state transitions in oxygenic photosynthesis by chlorophyll fluorescence spectroscopy, kinetics and imaging,” in Chlorophyll a Fluorescence Advances in Photosynthesis and Respiration, eds G. C. Papageorgiou and Govindjee (Dordrecht: Springer), 447–461.
Anders, S., Pyl, P. T., and Huber, W. (2015). HTSeq—a Python framework to work with high-throughput sequencing data. Bioinformatics 31, 166–169. doi: 10.1093/bioinformatics/btu638
Arendt, J. D. (1997). Adaptive intrinsic growth rates: an integration across taxa. Q. Rev. Biol. 72, 149–177. doi: 10.1086/419764
Badger, M. R., and Bek, E. J. (2008). Multiple rubisco forms in proteobacteria: their functional significance in relation to CO2 acquisition by the CBB cycle. J. Exp. Bot. 59, 1525–1541. doi: 10.1093/jxb/erm297
Bailey, S., Melis, A., Mackey, K. R. M., Cardol, P., Finazzi, G., van Dijken, G., et al. (2008). Alternative photosynthetic electron flow to oxygen in marine Synechococcus. Biochim. Biophys. Acta 1777, 269–276. doi: 10.1016/j.bbabio.2008.01.002
Bauwe, H., Hagemann, M., and Fernie, A. R. (2010). Photorespiration: players, partners and origin. Trends Plant Sci. 15, 330–336. doi: 10.1016/j.tplants.2010.03.006
Beck, C., Knoop, H., Axmann, I. M., and Steuer, R. (2012). The diversity of cyanobacterial metabolism: genome analysis of multiple phototrophic microorganisms. BMC Genomics 13:56. doi: 10.1186/1471-2164-13-56
Behrenfeld, M. J., and Milligan, A. J. (2013). Photophysiological expressions of iron stress in phytoplankton. Annu. Rev. Mar. Sci. 5, 217–246. doi: 10.1146/annurev-marine-121211-172356
Bibby, T. S., Nield, J., and Barber, J. (2001). Iron deficiency induces the formation of an antenna ring around trimeric photosystem I in cyanobacteria. Nature 412, 743–745. doi: 10.1038/35089098
Boyanapalli, R., Bullerjahn, G. S., Pohl, C., Croot, P. L., Boyd, P. W., and McKay, R. M. L. (2007). Luminescent whole-cell cyanobacterial bioreporter for measuring Fe availability in diverse marine environments. Appl. Environ. Microbiol. 73, 1019–1024. doi: 10.1128/AEM.01670-06
Boyle, E. A., Bergquist, B. A., Kayser, R. A., and Mahowald, N. M. (2005). Iron, manganese, and lead at Hawaii Ocean time-series station ALOHA: temporal variability and an intermediate water hydrothermal plume. Geochim. Cosmochim. Acta 69, 933–952. doi: 10.1016/j.gca.2004.07.034
Braun, V. (2003). Iron uptake by Escherichia coli. Front. Biosci. J. Virtual Libr. 8, s1409–s1421. doi: 10.2741/1232
Bruland, K. W., Rue, E. L., and Smith, G. J. (2001). Iron and macronutrients in California coastal upwelling regimes: implications for diatom blooms. Limnol. Oceanogr. 46, 1661–1674. doi: 10.4319/lo.2001.46.7.1661
Buck, K. N., Sohst, B., and Sedwick, P. N. (2015). The organic complexation of dissolved iron along the U.S. GEOTRACES (GA03) North Atlantic section. Deep Sea Res. Part II Top. Stud. Oceanogr. 116, 152–165. doi: 10.1016/j.dsr2.2014.11.016
Bullerjahn, G. S., Boyanapalli, R., Rozmarynowycz, M. J., and McKay, R. M. L. (2010). “Cyanobacterial bioreporters as sensors of nutrient availability,” in Whole Cell Sensing System II Advances in Biochemical Engineering/Biotechnology, eds S. Belkin and M. B. Gu (Berlin; Heidelberg: Springer), 165–188.
Busch, A. W. U., and Montgomery, B. L. (2015). Interdependence of tetrapyrrole metabolism, the generation of oxidative stress and the mitigative oxidative stress response. Redox Biol. 4, 260–271. doi: 10.1016/j.redox.2015.01.010
Campbell, D., Hurry, V., Clarke, A. K., Gustafsson, P., and Oquist, G. (1998). Chlorophyll fluorescence analysis of cyanobacterial photosynthesis and acclimation. Microbiol. Mol. Biol. Rev. 62, 667–683.
Chao, Y. P., Patnaik, R., Roof, W. D., Young, R. F., and Liao, J. C. (1993). Control of gluconeogenic growth by pps and pck in Escherichia coli. J. Bacteriol. 175, 6939–6944. doi: 10.1128/jb.175.21.6939-6944.1993
Dufresne, A., Ostrowski, M., Scanlan, D. J., Garczarek, L., Mazard, S., Palenik, B. P., et al. (2008). Unraveling the genomic mosaic of a ubiquitous genus of marine cyanobacteria. Genome Biol. 9:R90. doi: 10.1186/gb-2008-9-5-r90
Fitzsimmons, J. N., Zhang, R., and Boyle, E. A. (2013). Dissolved iron in the tropical North Atlantic Ocean. Mar. Chem. 154, 87–99. doi: 10.1016/j.marchem.2013.05.009
Flombaum, P., Gallegos, J. L., Gordillo, R. A., Rincón, J., Zabala, L. L., Jiao, N., et al. (2013). Present and future global distributions of the marine Cyanobacteria Prochlorococcus and Synechococcus. Proc. Natl. Acad. Sci. U.S.A. 110, 9824–9829. doi: 10.1073/pnas.1307701110
Fujimori, T., Hihara, Y., and Sonoike, K. (2005). PsaK2 subunit in photosystem I is involved in state transition under high light condition in the cyanobacterium Synechocystis sp. PCC 6803. J. Biol. Chem. 280, 22191–22197. doi: 10.1074/jbc.M500369200
Fujisawa, T., Okamoto, S., Katayama, T., Nakao, M., Yoshimura, H., Kajiya-Kanegae, H., et al. (2013). CyanoBase and RhizoBase: databases of manually curated annotations for cyanobacterial and rhizobial genomes. Nucleic Acids Res. 42, D666–D670. doi: 10.1093/nar/gkt1145
Gallegos, M. T., Schleif, R., Bairoch, A., Hofmann, K., and Ramos, J. L. (1997). Arac/XylS family of transcriptional regulators. Microbiol. Mol. Biol. Rev. 61, 393–410.
Hackenberg, C., Kern, R., Hüge, J., Stal, L. J., Tsuji, Y., Kopka, J., et al. (2011). Cyanobacterial lactate oxidases serve as essential partners in N2 fixation and evolved into photorespiratory glycolate oxidases in plants. Plant Cell 23, 2978–2990. doi: 10.1105/tpc.111.088070
Halsey, K. H., and Jones, B. M. (2015). Phytoplankton strategies for photosynthetic energy allocation. Annu. Rev. Mar. Sci. 7, 265–297. doi: 10.1146/annurev-marine-010814-015813
Halsey, K. H., Milligan, A. J., and Behrenfeld, M. J. (2011). Linking time-dependent carbon-fixation efficiencies in Dunaliella tertiolecta (chlorophyceae) to underlying metabolic pathways. J. Phycol. 47, 66–76. doi: 10.1111/j.1529-8817.2010.00945.x
Hassler, C. S., and Schoemann, V. (2009). Discriminating between intra- and extracellular metals using chemical extractions: an update on the case of iron: intracellular iron in aquatic systems. Limnol. Oceanogr. Methods 7, 479–489. doi: 10.4319/lom.2009.7.479
Hatta, M., Measures, C. I., Wu, J., Roshan, S., Fitzsimmons, J. N., Sedwick, P., et al. (2015). An overview of dissolved Fe and Mn distributions during the 2010–2011 U.S. GEOTRACES north Atlantic cruises: GEOTRACES GA03. Deep Sea Res. Part II Top. Stud. Oceanogr. 116, 117–129. doi: 10.1016/j.dsr2.2014.07.005
Hopkinson, B. M., and Morel, F. M. M. (2009). The role of siderophores in iron acquisition by photosynthetic marine microorganisms. Biometals 22, 659–669. doi: 10.1007/s10534-009-9235-2
Jiang, H.-B., Lou, W.-J., Ke, W.-T., Song, W.-Y., Price, N. M., and Qiu, B.-S. (2015). New insights into iron acquisition by cyanobacteria: an essential role for ExbB-ExbD complex in inorganic iron uptake. ISME J. 9, 297–309. doi: 10.1038/ismej.2014.123
Kolber, Z. S., Prášil, O., and Falkowski, P. G. (1998). Measurements of variable chlorophyll fluorescence using fast repetition rate techniques: defining methodology and experimental protocols. Biochim. Biophys. Acta 1367, 88–106. doi: 10.1016/S0005-2728(98)00135-2
Kranzler, C., Lis, H., Finkel, O. M., Schmetterer, G., Shaked, Y., and Keren, N. (2014). Coordinated transporter activity shapes high-affinity iron acquisition in cyanobacteria. ISME J. 8, 409–417. doi: 10.1038/ismej.2013.161
Latifi, A., Ruiz, M., and Zhang, C.-C. (2009). Oxidative stress in cyanobacteria. FEMS Microbiol. Rev. 33, 258–278. doi: 10.1111/j.1574-6976.2008.00134.x
Lee, J.-W., and Helmann, J. D. (2007). Functional specialization within the Fur family of metalloregulators. Biometals 20, 485–499. doi: 10.1007/s10534-006-9070-7
Ludwig, M., and Bryant, D. A. (2012). Acclimation of the global transcriptome of the cyanobacterium Synechococcus sp. strain PCC 7002 to nutrient limitations and different nitrogen sources. Front. Microbiol. 3:145. doi: 10.3389/fmicb.2012.00145
Ludwig, M., Chua, T. T., Chew, C. Y., and Bryant, D. A. (2015). Fur-type transcriptional repressors and metal homeostasis in the cyanobacterium Synechococcus sp. PCC 7002. Front. Microbiol. 6:1217. doi: 10.3389/fmicb.2015.01217
Mahmood, A., Abualhaija, M. M., van den Berg, C. M. G., and Sander, S. G. (2015). Organic speciation of dissolved iron in estuarine and coastal waters at multiple analytical windows. Mar. Chem. 177(Pt. 5), 706–719. doi: 10.1016/j.marchem.2015.11.001
Marrero, J., Rhee, K. Y., Schnappinger, D., Pethe, K., and Ehrt, S. (2010). Gluconeogenic carbon flow of tricarboxylic acid cycle intermediates is critical for Mycobacterium tuberculosis to establish and maintain infection. Proc. Natl. Acad. Sci. U.S.A. 107, 9819–9824. doi: 10.1073/pnas.1000715107
Martin, J. H., Gordon, M., and Fitzwater, S. E. (1991). The case for iron. Limnol. Oceanogr. 36, 1793–1802. doi: 10.4319/lo.1991.36.8.1793
Mock, T., and Hoch, N. (2005). Long-term temperature acclimation of photosynthesis in steady-state cultures of the polar diatom Fragilariopsis cylindrus. Photosyn. Res. 85, 307–317. doi: 10.1007/s11120-005-5668-9
Mölzer, C., Huber, H., Steyrer, A., Ziesel, G., Ertl, A., Plavotic, A., et al. (2012). In vitro antioxidant capacity and antigenotoxic properties of protoporphyrin and structurally related tetrapyrroles. Free Radic. Res. 46, 1369–1377. doi: 10.3109/10715762.2012.715371
Morrissey, J., and Bowler, C. (2012). Iron utilization in marine Cyanobacteria and Eukaryotic algae. Front. Microbiol. 3:43. doi: 10.3389/fmicb.2012.00043
Nodop, A., Pietsch, D., Höcker, R., Becker, A., Pistorius, E. K., Forchhammer, K., et al. (2008). Transcript profiling reveals new insights into the acclimation of the mesophilic fresh-water cyanobacterium Synechococcus elongatus PCC 7942 to iron starvation. Plant Physiol. 147, 747–763. doi: 10.1104/pp.107.114058
Nunn, B. L., Faux, J. F., Hippmann, A. A., Maldonado, M. T., Harvey, H. R., Goodlett, D. R., et al. (2013). Diatom proteomics reveals unique acclimation strategies to mitigate Fe limitation. PLoS ONE 8:e75653. doi: 10.1371/journal.pone.0075653
Osanai, T., Kanesaki, Y., Nakano, T., Takahashi, H., Asayama, M., Shirai, M., et al. (2005). Positive regulation of sugar catabolic pathways in the cyanobacterium Synechocystis sp. PCC 6803 by the group 2 σ factor SigE. J. Biol. Chem. 280, 30653–30659. doi: 10.1074/jbc.M505043200
Palenik, B., Ren, Q., Dupont, C. L., Myers, G. S., Heidelberg, J. F., Badger, J. H., et al. (2006). Genome sequence of Synechococcus CC9311: insights into adaptation to a coastal environment. Proc. Natl. Acad. Sci. U.S.A. 103, 13555–13559. doi: 10.1073/pnas.0602963103
Price, G. D., Badger, M. R., Woodger, F. J., and Long, B. M. (2008). Advances in understanding the cyanobacterial CO2-concentrating-mechanism (CCM): functional components, Ci transporters, diversity, genetic regulation and prospects for engineering into plants. J. Exp. Bot. 59, 1441–1461. doi: 10.1093/jxb/erm112
Raven, J. A. (1990). Predictions of Mn and Fe use efficiencies of phototrophic growth as a function of light availability for growth and of C assimilation pathway. New Phytol. 116, 1–18. doi: 10.1111/j.1469-8137.1990.tb00505.x
Raven, J. A., Evans, M. C. W., and Korb, R. E. (1999). The role of trace metals in photosynthetic electron transport in O2-evolving organisms. Photosyn. Res. 60, 111–150. doi: 10.1023/A:1006282714942
Rijkenberg, M. J. A., Middag, R., Laan, P., Gerringa, L. J. A., van Aken, H. M., Schoemann, V., et al. (2014). The Distribution of dissolved iron in the West Atlantic Ocean. PLoS ONE 9:e101323. doi: 10.1371/journal.pone.0101323
Robinson, M. D., McCarthy, D. J., and Smyth, G. K. (2010). edgeR: a bioconductor package for differential expression analysis of digital gene expression data. Bioinformatics 26, 139–140. doi: 10.1093/bioinformatics/btp616
Ryan-Keogh, T. J., Macey, A. I., Cockshutt, A. M., Moore, C. M., and Bibby, T. S. (2012). The cyanobacterial chlorophyll-binding-protein Isia acts to increase the in vivo effective absorption cross-section of PSI under iron limitation. J. Phycol. 48, 145–154. doi: 10.1111/j.1529-8817.2011.01092.x
Saito, M. A., Noble, A. E., Tagliabue, A., Goepfert, T. J., Lamborg, C. H., and Jenkins, W. J. (2013). Slow-spreading submarine ridges in the South Atlantic as a significant oceanic iron source. Nat. Geosci. 6, 775–779. doi: 10.1038/ngeo1893
Sandström, S., Ivanov, A. G., Park, Y.-I., Öquist, G., and Gustafsson, P. (2002). Iron stress responses in the cyanobacterium Synechococcus sp. PCC7942. Physiol. Plant. 116, 255–263. doi: 10.1034/j.1399-3054.2002.1160216.x
Sauer, U., and Eikmanns, B. J. (2005). The PEP—pyruvate—oxaloacetate node as the switch point for carbon flux distribution in bacteria. FEMS Microbiol. Rev. 29, 765–794. doi: 10.1016/j.femsre.2004.11.002
Schecher, W. D., and McAvoy, C. D. (1994). MINEQL+: A Chemical Equilibrium Program for Personal Computers Environmental Research Software. Hallowell, ME: Environmental Research Software.
Scherer, S., Stürzl, E., and Böger, P. (1982). Interaction of respiratory and photosynthetic electron transport in Anabaena variabilis Kütz. Arch. Microbiol. 132, 333–337. doi: 10.1007/BF00413385
Schrader, P. S., Milligan, A. J., and Behrenfeld, M. J. (2011). Surplus photosynthetic antennae complexes underlie diagnostics of iron limitation in a cyanobacterium. PLoS ONE 6:e18753. doi: 10.1371/journal.pone.0018753
Shcolnick, S., Summerfield, T. C., Reytman, L., Sherman, L. A., and Keren, N. (2009). The mechanism of iron homeostasis in the unicellular cyanobacterium Synechocystis sp. PCC 6803 and its relationship to oxidative stress. Plant Physiol. 150, 2045–2056. doi: 10.1104/pp.109.141853
Shih, P. M., Wu, D., Latifi, A., Axen, S. D., Fewer, D. P., Talla, E., et al. (2013). Improving the coverage of the cyanobacterial phylum using diversity-driven genome sequencing. Proc. Natl. Acad. Sci. U.S.A. 110, 1053–1058. doi: 10.1073/pnas.1217107110
Singh, A. K., McIntyre, L. M., and Sherman, L. A. (2003). Microarray analysis of the genome-wide response to iron deficiency and iron reconstitution in the cyanobacterium Synechocystis sp. PCC 6803. Plant Physiol. 132, 1825–1839. doi: 10.1104/pp.103.024018
Sohm, J. A., Ahlgren, N. A., Thomson, Z. J., Williams, C., Moffett, J. W., Saito, M. A., et al. (2016). Co-occurring Synechococcus ecotypes occupy four major oceanic regimes defined by temperature, macronutrients and iron. ISME J. 10, 333–345. doi: 10.1038/ismej.2015.115
Storey, J. D., and Tibshirani, R. (2003). Statistical significance for genomewide studies. Proc. Natl. Acad. Sci. U.S.A. 100, 9440–9445. doi: 10.1073/pnas.1530509100
Suggett, D. J., MacIntyre, H. L., and Geider, R. J. (2004). Evaluation of biophysical and optical determinations of light absorption by photosystem II in phytoplankton. Limnol. Oceanogr. Methods 2, 316–332. doi: 10.4319/lom.2004.2.316
Sunda, W. G. (1989). Trace metal interactions with marine phytoplankton. Biol. Oceanogr. 6, 411–442.
Sunda, W. G. (2012). Feedback interactions between trace metal nutrients and phytoplankton in the ocean. Front. Microbiol. 3:204. doi: 10.3389/fmicb.2012.00204
Sunda, W. G., and Huntsman, S. A. (1995). Iron uptake and growth limitation in oceanic and coastal phytoplankton. Mar. Chem. 50, 189–206. doi: 10.1016/0304-4203(95)00035-P
Sunda, W. G., Price, N. M., and Morel, F. M. M. (2005). “Trace metal ion buffers and their use in culture studies,” in Algal culturing techniques, ed R. A. Andersen (Burlington, MA: Academic Press), 35–63.
Thompson, A. W., Huang, K., Saito, M. A., and Chisholm, S. W. (2011). Transcriptome response of high- and low-light-adapted Prochlorococcus strains to changing iron availability. ISME J. 5, 1580–1594. doi: 10.1038/ismej.2011.49
Thuróczy, C.-E., Gerringa, L. J. A., Klunder, M. B., Middag, R., Laan, P., Timmermans, K. R., et al. (2010). Speciation of Fe in the Eastern North Atlantic Ocean. Deep Sea Res. Part Oceanogr. Res. Pap. 57, 1444–1453. doi: 10.1016/j.dsr.2010.08.004
Tian, F., Frew, R. D., Sander, S., Hunter, K. A., and Ellwood, M. J. (2006). Organic iron (III) speciation in surface transects across a frontal zone: the Chatham Rise, New Zealand. Mar. Freshw. Res. 57, 533–544. doi: 10.1071/MF05209
Trapnell, C., Pachter, L., and Salzberg, S. L. (2009). TopHat: discovering splice junctions with RNA-Seq. Bioinformatics 25, 1105–1111. doi: 10.1093/bioinformatics/btp120
Trick, C. G., and Wilhelm, S. W. (1995). Physiological changes in the coastal marine cyanobacterium Synechococcus sp. PCC 7002 exposed to low ferric ion levels. Mar. Chem. 50, 207–217. doi: 10.1016/0304-4203(95)00036-Q
Van Baleen, C. (1962). Studies on marine blue-green algae. Bot. Mar. 4, 129–139. doi: 10.1515/botm.1962.4.1-2.129
Keywords: cyanobacteria, iron limitation, acclimation, metabolism regulation, RNA-Seq
Citation: Blanco-Ameijeiras S, Cosio C and Hassler CS (2017) Long-Term Acclimation to Iron Limitation Reveals New Insights in Metabolism Regulation of Synechococcus sp. PCC7002. Front. Mar. Sci. 4:247. doi: 10.3389/fmars.2017.00247
Received: 07 November 2016; Accepted: 19 July 2017;
Published: 02 August 2017.
Edited by:
Hongyue Dang, Xiamen University, ChinaReviewed by:
Eric A. Webb, University of Southern California, United StatesKaarina Sivonen, University of Helsinki, Finland
Hongbin Liu, Hong Kong University of Science and Technology, Hong Kong
Copyright © 2017 Blanco-Ameijeiras, Cosio and Hassler. This is an open-access article distributed under the terms of the Creative Commons Attribution License (CC BY). The use, distribution or reproduction in other forums is permitted, provided the original author(s) or licensor are credited and that the original publication in this journal is cited, in accordance with accepted academic practice. No use, distribution or reproduction is permitted which does not comply with these terms.
*Correspondence: Sonia Blanco-Ameijeiras, sonia@blancoameijeiras.com