Temperature-Modulated Expression of Allometric Respiration Strategies Supports a Metabolic Scaling Rule
 Chet F. Rakocinski
 Kelsey Burns Gillam
- Division of Coastal Sciences, Gulf Coast Research Laboratory, School of Ocean Science and Technology, The University of Southern Mississippi, Ocean Springs, MS, United States
A model based on the mass-specific oxygen consumption rate of the tolerant polychaete, Capitella telata, related meaningfully to a novel metabolic scaling rule as applied to the infaunal size spectrum. Depending on temperature, C. telata expressed divergent oxyregulating or oxyconforming strategies relative to oxygen availability. A non-linear response surface fitted to the allometric exponents of a family of VO2 curves for 12 treatment combinations of DO saturation and temperature was used to project oxygen consumption rates across the infaunal size spectrum. Plasticity in respiration strategies was evident, based on four simulated dynamic 32 d oxygen-temperature exposure scenarios and on simulated static oxygen-temperature exposures. The oxyconforming strategy of C. telata expressed under hypoxia near the upper thermal limit agreed with a hypothesized allometric scaling rule based on metabolic ecology. Conversely, an oxyregulating respiration strategy was expressed at cooler temperatures under low oxygen concentration, except organisms hyper-regulated relative to normoxic conditions. At warm temperatures, small organisms exhibited relatively greater metabolic depression than large organisms; whereas at cool temperatures, small organisms hyper-regulated relatively more than large organisms. Dichotomous shifts in respiration strategies likely reflect a breakdown in the functioning of special adaptations, and reliance on alternative coping mechanisms. Divergent temperature-dependent respiration strategies illustrate how responses to multiple stressors can be synergistic. Moreover, results imply that population responses to hypoxia may differ, depending on prevailing temperature regimes.
1. Introduction
Hypoxia and ocean warming exemplify two imposing stressors of global proportion (Pörtner et al., 2005). These stressors may interact both environmentally (Riedel et al., 2016) and physiologically (McBryan et al., 2013). Environmentally, the availability of dissolved oxygen and therefore, the formation of hypoxia, are mediated by the coupled inverse physical relationship between temperature and the solubility of dissolved oxygen (Meire et al., 2013; Levin and Le Bris, 2015). Consequently, ocean warming threatens to exacerbate hypoxia exposure to marine organisms worldwide (Deutsch et al., 2015), and on benthic macrofauna within coastal ecosystems in particular (Vaquer-Sunyer and Duarte, 2011). Physiologically, an antagonistic relationship exists between temperature and dissolved oxygen (Pörtner et al., 2005), because elevated reaction kinetics in response to temperature drive metabolic rates in concert with aerobic demands (Morgan Ernest et al., 2003; Packard and Gómez, 2008). Through effects on cellular metabolism, temperature also modulates physiological responses (Morgan Ernest et al., 2003; Clarke and Fraser, 2004) affecting the aerobic metabolic capacity (Claireaux and Chabot, 2016). As specified by the ecophysiological paradigm for aquatic ectotherms, temperature primarily controls metabolic demands for oxygen, while the supply of oxygen primarily limits metabolic capacity (Fry, 1971; Farrell and Richards, 2009). Accordingly, temperature-induced hypoxia (Pörtner et al., 2005) occurs when internal metabolic demands increase to the point where they cannot be met by aerobic respiration (Vaquer-Sunyer and Duarte, 2011; Altieri and Gedan, 2015), even under normoxia (Herreid, 1980). Because metabolic rate is coupled with temperature, the interaction of temperature in connection with hypoxia is vital (Field et al., 2014).
Critical ambient levels of dissolved oxygen (e.g., Pcrit) reflect physiological thresholds where the aerobic demands of resting metabolism cannot be maintained (McBryan et al., 2013). At such critical thresholds, aquatic ectotherms shift from oxyregulating to oxyconforming respiration strategies (Herreid, 1980). As DO concentration drops below Pcrit, aerobic respiration falls off (Bridges and Brand, 1980), and anaerobic respiration may be initiated. This threshold also signals an oxyconforming strategy and the onset of a physiological response termed metabolic depression (Wu, 2002). Metabolic depression is expressed as conserved energy expenditure leading to reductions in activity and ingestion (Pörtner, 2010; Sokolova et al., 2012). Even though oxyconforming is adaptive in the short term, it represents an unsustainable long-term response (Deutsch et al., 2015) due to an associated reduction in aerobic scope (Sokolova et al., 2012). Oxyregulation exemplifies an alternative response to declining DO concentration (Kersey Sturdivant et al., 2015). A type of oxyregulation termed hyper-regulation is herein operationally defined as heightened oxygen consumption to a level above that needed to support normal resting metabolism under normoxia at a comparable temperature. Elevated metabolic costs associated with hyper-regulating in-turn imply a reduced aerobic scope in response to stress (sensu Sokolova, 2013). Hyper-regulation also requires proper adaptations for supporting elevated aerobic respiration under limiting DO supply. Such bioenergetic trade-offs help explain geographic distribution limits of marine animals, as well as expected shifts in geographic boundaries due to climate change (Deutsch et al., 2015).
Body size is an overarching biological trait that reflects multiple adaptive constraints (Makarieva et al., 2008) and ecological limitations of organisms (Sokolova et al., 2012). The shift from oxyregulating to oxyconforming as ambient oxygen declines also hinges on body size, as size reflects the scaling of physiological processes relative to body design (Bridges and Brand, 1980), including size-related changes in fractal-like branching networks (Brown et al., 2004) and surface area:volume scaling (Kooijman et al., 2008). Accordingly, metabolic rate scales allometrically with body-size (Gillooly et al., 2001; Giometto et al., 2013). Because metabolic rate also co-varies with temperature (Marquet et al., 2005), it scales jointly with temperature and body size (Brose et al., 2012). Thus, effects of multiple stressors become more complex when the additional dimension of body size is considered. Indeed, the allometric respiration response likely hinges on body size in a nonlinear manner relative to joint variation in DO and temperature (Shumway, 1979). Here we address how allometric respiration strategies of a model tolerant polychaete (Capitella teleta) vary relative to DO as modulated by temperature, in addition to how strategies accord with a novel metabolic scaling rule as applied to the infaunal size spectrum.
1.1. Metabolic Scaling Hypothesis
An allometric scaling rule as applied to the infaunal size spectrum was previously hypothesized for aerobic respiration vs. DO concentration (Rakocinski, 2009). Analogous to light limitation in plants (Causton, 1983), the proposed scaling rule assumes a hyperbolic relationship between oxygen supply and mass-specific respiration (VO2). In fact, a hyperbolic aerobic respiration relationship relative to oxygen availability has been applied to various marine metazoans (Bayne, 1971; Bridges and Brand, 1980; Chen et al., 2001). The traditional hyperbolic model for oxygen consumption rate (OCR), OCR = DO/(K1 + K2 × DO) (Bayne, 1971), specifies how the mass-specific OCR should increase with ambient DO concentration (Chen et al., 2001). Moreover, this model can be rearranged to obtain the hypothesized hyperbolic DO limitation relation: OCR = (K2 + K1/DO)−1, from which the horizontal OCR asymptote can be estimated as OCRmax = 1/K2 (Rakocinski, 2009). The OCR parameter, K2, presumably reflects various paths of diffusion and biochemical resistance affecting the conductance of O2 within the organism (Herreid, 1980). Under an oxyconforming strategy, K2 should reflect metabolic limitations and design constraints in accordance with non-mutually exclusive principles of the Metabolic Theory of Ecology (MTE, 3/4 power law; fractal branching networks) (Brown et al., 2004; Finlay and Esteban, 2007) and Dynamic Energy Budget Theory (DEB, 2/3 power law; surface area: volume scaling) (Kooijman et al., 2008). Specifically, small organisms should show less capacity to regulate oxygen uptake than large organisms as DO availability declines, due to the need to maintain higher mass-specific OCR (Bridges and Brand, 1980). This trade-off is also conveyed by the ratio of the hyperbolic curve parameters, first noted as the oxygen-dependence index by Bayne (1971). The index, K1/K2, is obtained from the linear relationship between ambient PO2/VO2 vs. PO2 (Livingstone and Bayne, 1977; Bridges and Brand, 1980), and reflects the metabolic capacity for regulating aerobic respiration (Chen et al., 2001). Thus, a lower OCR capacity (OCR/OCRmax; where OCRmax = 1/K2) reflects relative oxyconforming as ambient DO declines; and a greater capacity to sustain OCR (i.e., oxyregulation) is signified by a lower K1/K2 ratio. Moreover, a value of 1 for K1/K2 indicates a transitional capacity for regulating OCR (Chen et al., 2001). Indeed, the ratio K1/K2 clearly decreases with body size for marine metazoans (Chen et al., 2001), which implies that larger organisms possess relatively greater oxygen regulation capacity (Bayne, 1971; Taylor and Brand, 1975; Bridges and Brand, 1980).
An allometric metabolic scaling rule proposed by Rakocinski (2009), hypothesized that the slope of the log-log body mass vs. K1/K2 relationship for oxyconforming was −0.285 (i.e., intermediate between 3/4 and 2/3 scaling rules). Furthermore, the proposed relationship was symmetrically centered on 1 (i.e., the transitional capacity for regulating OCR; Chen et al., 2001) across eight common geometric scaled (octaves base 2) size-classes spanning the estuarine infaunal size spectrum for the northern Gulf of Mexico (Qu et al., 2015). However, this metabolic scaling rule has not been tested using any robust data sets. Moreover, the joint effect of temperature and oxygen concentration on the bearing of the proposed hypothesis has not been fully considered.
Higher temperatures intensify metabolic demands (Robinson et al., 1983; Clarke and Fraser, 2004), and hyperbolic mass-specific OCR curves accordingly reach elevated asymptotic levels (i.e., 1/K2). Observed increases in K1/K2 with temperature (Bridges and Brand, 1980) further imply a reduction of oxyregulating capacity at warmer temperatures under declining DO concentrations (Chen et al., 2001). As seen for body size, a concomitant rise in K1/K2 with temperature also reflects higher maintenance costs in the form of an elevated physiological work load (Clarke and Fraser, 2004). Conversely, organisms show a greater capacity to oxyregulate at cooler temperatures (Herreid, 1980). As noted by Chen et al. (2001), aerobic respiration rates appear relatively independent of environmental DO concentration at cooler temperatures. Consequently, large organisms should be especially capable of oxyregulating at cool temperatures; whereas small organisms should be more disposed to oxyconforming at warm temperatures. Here we consider whether the aerobic respiration pattern of a model tolerant polychaete, Capitella teleta (formerly Capitella sp. I), conforms to these expectations in ways that accord with the allometric scaling hypothesis.
1.2. Model Organism
The tolerant opportunistic polychaete, Capitella teleta, is often associated with organically enriched sediments, and is widely distributed from temperate to subtropical waters in the northeastern United States, Japan, and the Mediterranean (Grassle and Grassle, 1974, 1976; Blake et al., 2009). This subsurface deposit feeder is well adapted to disturbance and environmental stress (Linke-Gamenick et al., 2000). Consequently, it regularly dominates during hypoxic conditions in the northeastern US (Mangum, 1973; Forbes et al., 1994; Sagasti et al., 2001; Wu, 2002; Levin et al., 2009). Various adaptations to hypoxia and other stressors distinguish C. teleta, including a small body size (i.e., high surface area/mass), short-life span (i.e., r-selected), respiratory pigments, ventilation behavior, and the capacity for anaerobic respiration. As C. teleta is also currently experiencing warming within its geographic range, (Laffoley and Baxter, 2016) http://www.nefsc.noaa.gov/press release/2013/SciSpot/SS1304/, this species is ideal for considering interactive effects of hypoxia and temperature. Stock cultures of C. telata were obtained from the laboratory of Dr. J. Grassle, and maintained at 15°C and 27 psu in order to provide subjects for measuring aerobic respiration (Burns Gillam, 2016). In this paper, we examine mass-specific respiration by C. telata with regard to the metabolic scaling hypothesis.
2. Materials and Methods
2.1. Aerobic Respiration
Aerobic respiration (VO2; mg O2/mg/h) was measured in 3 mL of salt water and complete darkness for subjects of various sizes (0.14–14.1 mg WW) exposed to 12 treatment combinations of DO (20, 50, 70 and 100% saturation) and temperature (15, 20, and 25°C) (salinity = 27 psu) (Burns Gillam, 2016). Sizes of subjects spanned across five of the eight geometrically-scaled size classes within the designated infaunal size spectrum (Rakocinski, 2009). Prior to measuring respiration, C. telata were acclimated to treatment conditions for 24 h in the presence of 6 g (ca 5 mm depth) of enriched sediment within a sealed air chamber (BioSpherix) into which nitrogen gas was pumped (Proox Model 360) to reach the target DO saturation level by diffusion. Worms had also been preacclimated to the treatment temperature for an additional 24 h at ambient PO2 before being introduced into the air chamber. Oxygen consumption was measured for individuals under treatment conditions using either an Oxygen Cuvette (Qubit Systems, Canada) respirometer, accompanied with a polarographic Clark-type O2 electrode connected to a C410 LoggerPro Interface (Vernier Software and Technology, USA) (i.e., 20 and 25°C), or with an optical FireStingO2 oxygen meter (PyroScience, Germany) within 10 mL syringes sealed with stopcocks (i.e., 15°C) (Burns Gillam, 2016). Readings using both instruments (i.e., at 20°C and 100% DO) showed similar spreads in sample residuals relative to the overall allometric relationship, indicating consistent results between instruments. Each of the 12 treatment combinations was represented by respiration measurements from 14 to 21 individuals of various sizes (total n = 208).
Because our primary interest was in relating body-size responses to DO and temperature, a common proportionality constant (a = 0.0096; where VO2 = aWb) was estimated as the mean of the twelve coefficients from individually fit VO2 curves [R package - nonlinear least squares routine (nls)]. The same constant was then used to fit a family of new VO2 curves for which only the size-related exponent (b) varied. Next, the size-related exponents from the family of VO2 curves were collectively fit by a non-linear response surface, for which significant terms for a constant, DO saturation, temperature and the DO × temperature interaction were included. The non-significant term for temperature was subsequently excluded from the final response-surface model in order to derive the best predictive tool from the data (Allison, 1999). The fitted model surface describing the response by the size-related exponent: b = −0.7100 + 0.0038 × DO − 0.0002 DO × Temp (R2 = 0.725; F = 11.863; P = 0.003; Regression df = 3; Residual df = 8; n = 12; Table 1).
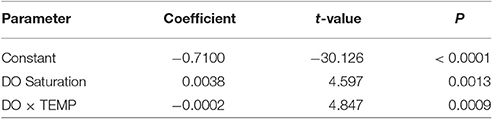
Table 1. Non–linear regression model parameters.
2.2. Hypoxia-Temperature Scenarios
To compare projected (i.e., observed) oxygen consumption rates (OCR) to expected OCR based on the metabolic scaling hypothesis, four dynamic (i.e., fluctuating) 32 d exposure scenarios characterizing relatively severe vs. moderate hypoxia at warmer vs. cooler temperatures were created (Rakocinski, 2009). For each dynamic scenario, 768 h OCR values were generated for each of the eight geometric body-size classes within the size spectrum. The fitted response surface for b was used to generate maximum respiration (OCRmax) values (from OCR b' = VO2(1+b)), by holding DO saturation at 100% and salinity at 27 psu (i.e., the experimental salinity) for each hourly temperature value within the series. Accordingly, OCRmax was estimated at 1/K2 (i.e., asymptote) from the predicted OCR curve for 100 percent DO saturation at the specified temperature.
The OCRmax values were used for obtaining expected OCR proportions (OCRprop = OCRexp/OCRmax), and projected OCR proportions (i.e., OCRproj = OCRobs/OCRmax). Observed (OCRobs) oxygen consumption values were obtained for each hourly observation in the simulated exposure series using the fitted nonlinear response surface for b (DO as saturation using O2.saturation function for R; Miller, 2014). Expected proportions were also calculated for each hourly observation as OCRprop = OCRexp/OCRmax; where OCRexp = (K2 + K1/DO)−1 (Rakocinski, 2009), and K1 = the hypothetical scaling factor (i.e., hypothetical K1/K2) multiplied by K2 [i.e., K1 = (K1/K2 × K2)]. Scaling factors were obtained for each size-class by applying the point-slope rule, assuming a slope of −0.285 and a value of 0 (i.e., K1/K2 value of 1) corresponding with the mid-size spectrum point for the log-log form of the relationship between K1/K2 with body size. The parameter K2 was obtained from OCRmax = 1/K2, as 1/ OCRmax, and DO concentration was in mg L−1, following Chen et al. (2001). For the cooler temperature series, warmer series values were decremented by 10°C (i.e., Q10).
To compare expected and observed oxygen consumption for the four dynamic exposure scenarios in light of the proposed metabolic scaling hypothesis, mean expected vs. mean observed OCR proportions were plotted for the eight size classes. The extent to which expected vs. observed OCR proportions followed a 1:1 linear relationship within the plot indicated agreement with the scaling hypothesis, and the extent to which values followed a horizontal line at 1.0 on the y-axis indicated agreement with an oxyregulating strategy. To consider how abruptly or gradually aerobic respiration strategies transitioned with respect to temperature and DO saturation, OCR proportions for the eight size classes were also examined for 12 static combinations of DO saturation (20, 50, and 75%) and temperature (15, 20, 25, and 30°C).
3. Results
3.1. Aerobic Respiration
The family of allometric VO2 curves for which the size exponent (b) varied (i.e., while a was constrained) accurately fit the data; curves were significant relative to body size for every combination of temperature and DO saturation (t = 43.86–102.30; P < 0.0001; Figure 1). Fitted size exponents (b) varied from −0.80 to −0.58. Conversely, inferred exponents (b') for allometric oxygen consumption (OCR) curves (i.e., b' = 1 + b) varied from 0.20 to 0.42 (i.e., considerably lower than metabolic scaling exponents of 0.67 or 0.75). Clearly, VO2 curves were higher and steeper at warm temperatures (i.e., 25°C) than at cooler temperatures, reflecting higher mass-specific respiration, in particular by small organisms (Figure 1). Individuals exhibited the highest VO2 values under high levels of temperature and DO.
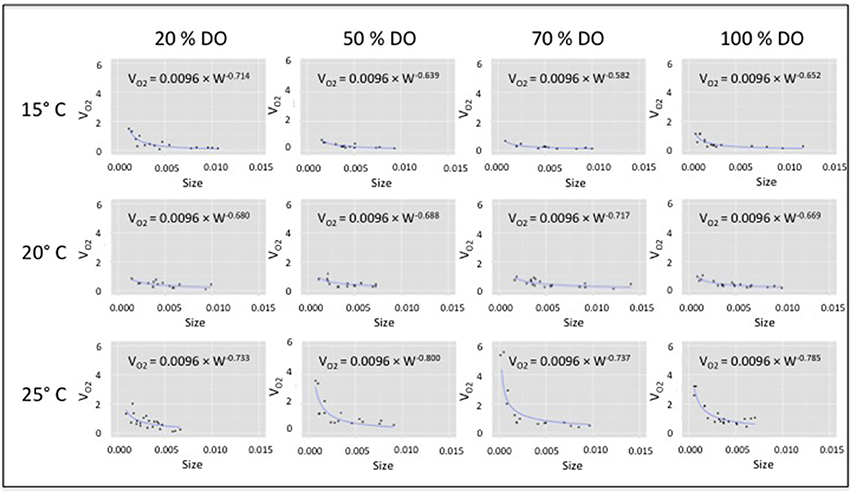
Figure 1. VO2 vs. body-size of Capitella telata for twelve DO × temperature combinations. VO2 curves fit (VO2 = aWb) by allowing the size-related exponent (b) to vary, while assuming a common proportionality constant (a = 0.0096).
The response surface describing how the VO2 size exponent (b) changes relative to joint variation in DO saturation and temperature was expressed in a complex nonlinear form (Figure 2; Table 1). The fitted response surface reflected the influence of a significant constant, as well strong effects of DO, and a synergistic interaction between DO and temperature (Table 1).
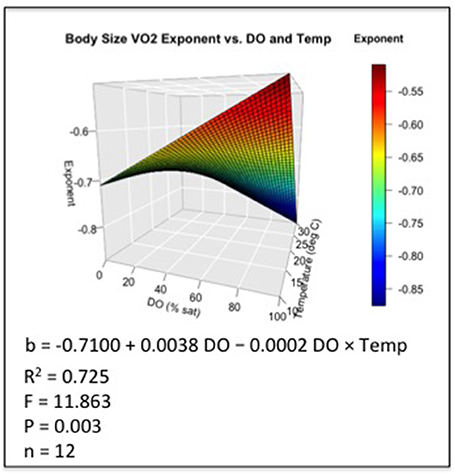
Figure 2. Non-linear response surface fit to VO2 size-related exponent (b) relative to DO and temperature, including significant terms for a constant, DO saturation, and the DO × temperature interaction (see Table 1).
3.2. Hypoxia-Temperature Scenarios
The two dynamic scenarios comprising 32 d fluctuating DO series in combination with alternate temperature series illustrate how hourly DO-temperature exposure regimes might vary latitudinally (Figure 3). The warmer series portrays temperatures near the thermal limit and outside the normal regime to which the test species is adapted. When paired with the severe hypoxia series, hourly temperature series (n = 768) averaged 30.2°C ± 0.7 and 20.2°C ± 0.7 (mean ± SD) for warm and cool series, respectively. Likewise, DO saturation averaged 22.1% ± 8.7 (mean ± SD) (mean DO = 1.4 mgL−1 warm and 1.7 mgL−1 cool) for the severe hypoxia series, for which all 768 DO values were <4 mgL−1, 762 were less than 3 mgL−1, and 658 were less than 2 mgL−1. When paired with moderate hypoxia series, hourly temperatures (n = 768) averaged 30.5° C ± 1.1 and 20.5° C ± 1.1 for warm and cool series, respectively. Likewise, DO saturation averaged 69.8% ± 18.9 (mean DO = 4.4 and 5.4) for the moderate hypoxia scenarios, for which 305 DO values were <4 mgL−1, 67 were <3 mgL−1, and 8 were <2 mgL−1.
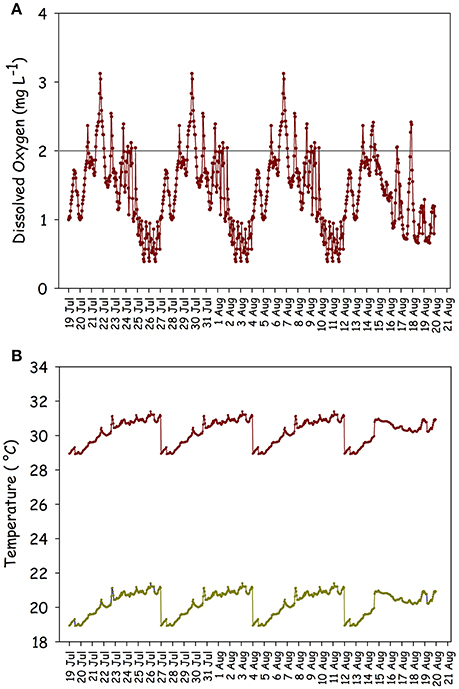
Figure 3. (A) DO series comprising 768 hourly values over 32 d; (B) corresponding alternate warm and cool temperature series which when combined with the DO series, create the two dynamic severe hypoxia exposure scenarios.
Depending on the corresponding temperature series, scenario projections based on the C. telata model exemplified divergent aerobic respiration strategies, as delineated by reference lines within proportional OCR space (Figure 4). Moreover, the oxyconforming patterns for the scenarios closely agreed with the proposed scaling hypothesis (Figure 4A). Specifically, under the higher temperature scenarios, observed OCRproj values for the size classes closely tracked expected OCRprop values based on the hypothetical scaling rule (Figure 4A). As expected, smaller organisms oxyconformed to a greater extent than larger organisms, which also infers relatively greater metabolic depression for smaller organisms. Notably, size-classes were displaced to positions indicating less stringent oxyconforming along the metabolic scaling line under the moderate hypoxia-high temperature scenario compared to the severe hypoxia-high temperature scenario.Coordinates for size-classes were less spread out under moderate hypoxia than severe hypoxia for both warm and cool scenarios.
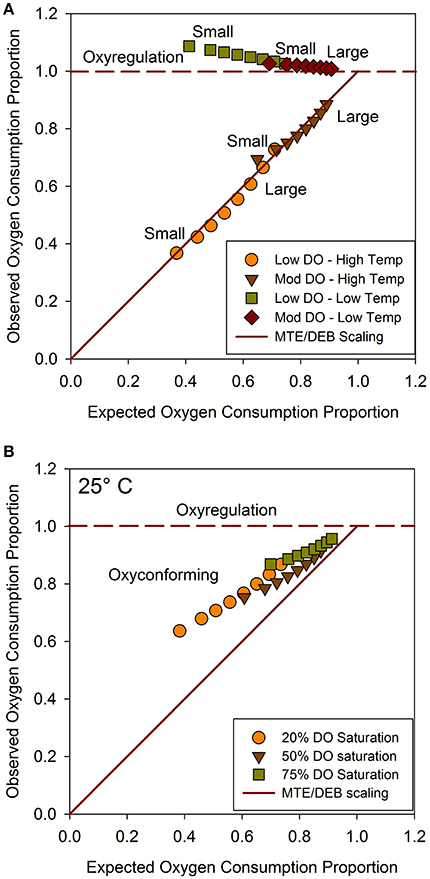
Figure 4. (A) Mean observed (OCRproj) vs. mean expected (OCRprop) values for eight size classes, generated from dynamic exposure scenarios; (B) Observed vs. expected OCR values from static combinations of DO saturation at 25°C. Horizontal reference line depicts oxyregulation and diagonal reference line depicts metabolic scaling hypothesis. Series arrayed from small (left) to large (right) size classes.
For scenarios at cooler temperatures, size series tended to follow the oxyregulation reference line (Figure 4A). However, OCRproj values were positioned noticeably above the oxyregulation line for the severe hypoxia scenario at cool temperatures, indicating hyper-regulation relative to normoxia at the same temperature for all size classes. Relatively greater hyper-regulation reflected higher metabolic costs for small organisms. Size series converged closer to the oxyregulation reference line and shifted toward the intersection of the oxyregulation and metabolic scaling reference lines under the moderate hypoxia regime. Hyper-regulation was accordingly relaxed for small organisms, and all sizes regulated better under moderate than severe hypoxia at cooler temperatures. Consequently, size series were less separated within proportional OCR space between the two temperature regimes under moderate than severe hypoxia. In general, all size classes oxyconformed at higher temperatures, and oxyregulated at lower temperatures. Moreover, all size classes oxyregulated better under moderate hypoxia than under severe hypoxia.
To consider how abruptly organisms transitioned between respiration strategies, observed OCRproj vs. expected OCRprop values were compared for the eight size classes under static combinations of three DO saturation levels (20, 50, and 75%) crossed with four temperature levels (15, 20, 25, and 30°C). Coordinates for the size classes within proportional OCR space at 20 and 30°C agreed closely with the dynamic scenarios, which were at similar temperatures. However, observed OCRproj vs. expected OCRprop values at 15°C under hypoxia indicated even greater hyper-regulation by all sizes compared to the cool dynamic scenarios. Again, smaller organisms showed greater hyper-regulation than larger organisms at 15°C. Indeed, the smallest size class exhibited a 2-fold higher respiration rate at 15°C and 20 % DO than at 15°C and 100 % DO.
Size spectra tracked close to the metabolic scaling reference line at 25°C; however, they were visibly displaced from the reference line within the oxyconforming portion of proportional OCR space (Figure 4B). Size spectra shifted progressively and converged toward the metabolic scaling reference line with increasing DO saturation at 25°C. Again, small sizes exhibited lower observed OCRproj values than large organisms. Thus, 25°C approaches the pivotal temperature for showing how size spectra transition from oxyregulating to oxyconforming respiration strategies, as projected by the C. telata model.
4. Discussion
The allometric respiratory response of C. teleta varied non-linearly under multiple levels of the two most important physical variables regulating aerobic metabolism, DO and temperature (Claireaux and Chabot, 2016). Divergent oxyregulating vs. oxyconforming strategies were expressed, depending on temperature. Moreover, a novel metabolic scaling rule applied to the infaunal size spectrum was supported by allometric oxygen consumption responses at higher temperatures. Few studies examine complex biological responses within the context of multiple levels of more than one interacting environmental variable. Non-linear biological responses are expected where stressors elicit counteracting physiological trade-offs, such that either: (1) the effect of one stressor is strengthened or weakened by interaction with another stressor, or (2) the combined effect of two stressors pushes an individual or population beyond a critical threshold that would not have been reached from one stressor alone (Harley et al., 2006). Though it is well-known that aquatic species vary in their ability to oxyregulate and will ultimately oxyconform as DO declines or as temperature increases (Herreid, 1980), fewer studies examine how both temperature and DO interact to elicit shifts in respiration strategies. Moreover, none have related the emergent respiration pattern to the metabolic scaling rule applied in this study.
Although oxygen consumption power curves often show fairly good agreement with 0.75 or 0.67 allometric scaling rules, for a number of aquatic species, including C. telata and various other polychaetes (Shumway, 1979), scaling exponents do not conform to these expectations (Glazier, 2006). Non-agreement might reflect variable experimental or ecological conditions (Shumway, 1979), but could also result from obscuring effects of physiological traits that do not scale according to the same design principles underpinning the scaling rules. Indeed, as Glazier (2006) asserts, “the scaling of metabolism is not the simple result of a physical law, but rather appears to be the more complex result of diverse adaptations evolved in the context of both physico-chemical and ecological constraints.” The intermediate scaling rule of 0.715 used for this study presumes that design principles justifying the two scaling rules both apply and are not mutually exclusive. Indeed, polychaetes possess both surface-area and branching-network based anatomical systems. Despite non-agreement between observed allometric oxygen consumption and metabolic scaling in this study, the oxygen dependence index (K1/K2) followed the proposed −0.285 allometric scaling rule at the upper thermal limit of the model species.
The metabolic scaling exponent of −0.285 as applied to the infaunal size spectrum conceivably reflects self-similarity in the form of design constraints associated with branching networks and the scaling of diffusion processes involving surfaces (Schmid and Schmid-Araya, 2007). Resting aerobic respiration approximates basal metabolic rate (BMR), which in turn represents the scaling of maintenance costs according to the same size-related design constraints. The metabolic scaling of BMR emerges from allometric scaling of cellular and biochemical processes (Hulbert and Else, 2000). Since K2 is inversely related to ambient oxygen concentration, it likely represents various diffusion and biochemical resistances to the paths of molecules within the organism (Herreid, 1980; Causton, 1983). By comparison, K1 expresses respiration efficiency at low ambient DO levels. Allometric scaling of the index hinges on suppositions about two parameters relative to the size-spectrum: (1) designation of a body size representing the turning point in oxyregulation capability (i.e., K1/K2 = 1 at spectrum mid-point); (2) the scale invariant rule relative to body size (i.e., −0.285 scaling exponent). The spectrum size range approximated the functional group defined by infaunal organisms that are dependent on the same source of energy (Kelly-Gerreyn et al., 2014), centered at 8.44 mg WW. Defining size spectra based on functional traits offers a promising approach to understanding marine ecosystems (Jennings et al., 2002; Blanchard et al., 2017).
Organisms that follow the C. telata aerobic respiration pattern would presumably incur different energy-balance outcomes relative to joint variation in oxygen and temperature. Hyper-regulation under hypoxia at cooler temperatures implies elevated metabolic costs relative to the same temperatures under normoxia; whereas, oxyconforming at warmer temperatures implies relatively lower metabolic costs. But in either case, these contrasting patterns translate into lower aerobic scope, as defined by a diminished energetic capacity for fitness-related functions like growth and activity (Pörtner, 2010; Sokolova et al., 2012; Sokolova, 2013). Accordingly, hyper-regulation implies elevated maintenance costs; whereas oxyconforming implies depressed basal metabolic activity. Furthermore, higher energetic costs and potentially more time needed for ventilation behavior associated with hyper-regulation vs. commensurate deficits in ingestion or assimilation associated with metabolic depression would all contribute to a lower aerobic scope. Former seminal studies of C. telata have shown reduced ingestion or food conversion efficiency under hypoxia (Mangum, 1973; Forbes and Lopez, 1990), as opposed to elevated ingestion rates in response to metabolic demands associated with high temperatures (Forbes and Lopez, 1987; Forbes, 1989). Reduced egestion was also observed for C. telata at 20 % DO saturation within a four-day exposure experiment (Burns Gillam, 2016). Moreover, because the maximum ingestion rate is asymptotically limited by design constraints, aerobic scope must also inevitably be reduced in connection with hyper-regulation.
Dichotomous shifts in respiration strategies by the model species likely reflect a breakdown in the functioning of special adaptations, and reliance on alternative coping mechanisms. Polychaetes possess diverse adaptations for maintaining aerobic respiration, including ventilation behavior and respiratory pigments for oxygen storage and transport (Kristensen, 1983; Grieshaber et al., 1994; Burnett and Stickle, 2001; Wu, 2002; Riedel et al., 2016). Conversely, an oxyconforming strategy entails metabolic depression comprising various gene regulation and molecular mechanisms (Wu, 2002), reduced feeding, and the onset of anaerobic metabolism (Gonzalez and Quionones, 2000; Burnett and Stickle, 2001; Wu, 2002). Critical oxygen concentrations specify physiological thresholds (Pcrit), below which the aerobic demands of resting metabolism cannot be maintained (Kersey Sturdivant et al., 2015), and thus where respiration strategies shift from oxyregulating to oxyconforming (Herreid, 1980). Critical thresholds (Pcrit) vary notably with temperature, and dip lower at cool temperatures (Pörtner, 2010). Although oxyregulating capacities are well-known to vary among taxa, fewer studies elucidate temperature-modulated plasticity in respiration strategies (but see Salvato et al., 2001; Sokolova and Pörtner, 2003). Theoretical underpinnings of such synergistic interactions are explained by the thermal envelope and related aerobic limit concepts (Pörtner, 2010), which offer a mechanistic basis for understanding how temperature modulates respiration. For the C. telata model, successful oxyregulation (or hyper-regulation) by all size classes indicated that under cooler temperatures, experimental DO levels did not reach Pcrit. Conversely, the expression of an oxyconforming strategy indicated that the aerobic limit (Pcrit) was reached under warm temperatures at all DO levels. Effective oxyregulators are expected to show relatively abrupt transitions between respiration strategies (Herreid, 1980). In this study, a fairly abrupt transition between strategies was evidenced by relatively close tracking of size classes relative to the metabolic scaling line for the static 25°C scenario. A shift of only 5°C (between 20 and 25°C) changed the aerobic respiration response of C. telata from an oxyregulating to a virtual oxyconforming strategy. Moreover, close agreement with the hypothesized scaling rule for the warm dynamic scenarios implied that the transition to an oxyconforming strategy was complete at the thermal limit of the model species.
Divergent temperature-dependent respiration strategies illustrate how responses to multiple stressors can be synergistic. Stressors interact in complex non-linear ways to affect physiological mechanisms at the individual level. For example, Salvato et al. (2001) demonstrated synergistic effects of temperature, salinity, and oxygen on respiration for two decapod crustaceans and two prosobranch mollusks. The manifestation of temperature-modulated synergistic effects on metabolism relative to oxygen supply within the C. telata model underscores the importance of considering how multiple stressors can affect populations via allometric responses at the individual level (Marquet et al., 2005; Van Der Meer, 2006; Bruno et al., 2015). Accordingly, Sokolova (2013) recently called for, “an integrative physiological platform from which to assess and predict the effects of multiple stressors on populations.” This study contributes to and can extend such a platform by incorporating other: (1) species with characteristic responses (i.e., different adaptations and thresholds), (2) segments of the infaunal size spectrum; (3) potentially interacting stressors (e.g., salinity, pH, etc.); (4) dimensions, in terms of stressors; and (5) size-spectra within the marine ecosystem. Results of this study will also be extended via a mass-balance modeling framework for integrating energetic costs and benefits (Peters, 1983; Rakocinski, 2009). Other metabolic scaling relationships are expected to apply within that framework. For example, ingestion varies allometrically according to metabolic scaling constraints and exponentially with temperature for C. telata (Forbes and Lopez, 1987). Integrated approaches predicated on metabolic scaling offer a vehicle for extending effects of stressors at the individual level to population responses (Jager and Selck, 2011). Indeed, this study illustrates how individual-level ecophysiological responses to multiple stressors can be complex. Moreover, it underscores how temperature can modulate the effects of low oxygen on the macrobenthic fauna (Vaquer-Sunyer and Duarte, 2011).
Author Contributions
CR formulated the hypothesis, analyzed and interpreted the data, and wrote the paper; KG conducted the experiments, obtained the data, and extensively discussed the implications of the study. CR and KG designed the study together.
Funding
This publication (number MASGP-17-066) of the Mississippi-Alabama Sea Grant Consortium was supported by the U.S. Department of Commerce's National Oceanic and Atmospheric Administration under NOAA Award NA14OAR4170098 and the Mississippi-Alabama Sea Grant Consortium. The views expressed herein do not necessarily reflect the views of any of these organizations.
Conflict of Interest Statement
The authors declare that the research was conducted in the absence of any commercial or financial relationships that could be construed as a potential conflict of interest.
Acknowledgments
We are very grateful to Dr. Judy Grassle of Rutgers University for generously providing source Capitella telata for cultures used in this research. The authors also thank Dr. Joe Griffitt for the use of the hypoxia chamber.
References
Allison, P. D. (1999). Multiple Regression: A Primer. Thousand Oaks, CA; London: Pine Forge Press; SAGE Publications.
Altieri, A. H., and Gedan, K. B. (2015). Climate change and dead zones. Glob. Chang. Biol. 21, 1395–1406. doi: 10.1111/gcb.12754
Bayne, B. L. L. (1971). Oxygen consumption by three species of lamellibranch mollusc in declining ambient oxygen tension. Comp. Biochem. Physiol. A Physiol. 40, 955–970. doi: 10.1016/0300-9629(71)90284-2
Blake, J. A., Grassle, J. P., and Eckelbarger, K. J. (2009). Capitella teleta, a new species designation for the opportunistic and experimental Capitella sp. I, with a review of the literature for confirmed records. Zoosymposia 2, 25–53. doi: 10.11646/zoosymposia.2.1.6
Blanchard, J. L., Heneghan, R. F., Everett, J. D., Trebilco, R., and Richardson, A. J. (2017). From bacteria to whales: using functional size spectra to model marine ecosystems. Trends Ecol. Evol. 32, 174–186. doi: 10.1016/j.tree.2016.12.003
Bridges, C., and Brand, A. (1980). Oxygen consumption and oxygen-independence in marine crustaceans. Mar. Ecol. Prog. Ser. 2, 133–141. doi: 10.3354/meps002133
Brose, U., Dunne, J. A., Montoya, J. M., Petchey, O. L., Schneider, F. D., and Jacob, U. (2012). Climate change in size-structured ecosystems. Philos. Trans. R. Soc. Lond. B Biol. Sci. 367, 2903–2912. doi: 10.1098/rstb.2012.0232
Brown, J. H., Gillooly, J. F., Allen, A. P., Savage, V. M., and West, G. B. (2004). Toward a metabolic theory of ecology. Ecology 85, 1771–1789. doi: 10.1890/03-9000
Bruno, J. F., Carr, L. A., and O'Connor, M. I. (2015). Exploring the role of temperature in the ocean through metabolic scaling. Ecology 96, 3126–3140. doi: 10.1890/14-1954.1
Burnett, L. E., and Stickle, W. B. (2001). “Physiological responses to hypoxia,” in Coastal Hypoxia Consequences for Living Resources Ecosystem, eds N. Rabalais and R. E. Turner (Washington, DC: American Geophysical Union), 101–114. doi: 10.1029/CE058p0101
Burns Gillam, K. (2016). Combined ecophysiological effects of dissolved oxygen, temperature, and body size on the model Polychaete, Capitella telata. PhD dissertation, University of Southern Mississippi, (Hattiesburg, MS).
Chen, L.-Y., Heath, A. G., and Neves, R. J. (2001). Comparision of oxygen consumption in freshwater mussels (Unionidae) from different habitats during declining dissolved oxygen concentration. Hydrobiologia 450, 209–214. doi: 10.1023/A:1017501128572
Claireaux, G., and Chabot, D. (2016). Responses by fishes to environmental hypoxia: Integration through Fry's concept of aerobic metabolic scope. J. Fish Biol. 88, 232–251. doi: 10.1111/jfb.12833
Clarke, A., and Fraser, K. P. P. (2004). Why does metabolism scale with temperature? Funct. Ecol. 18, 243–251. doi: 10.1111/j.0269-8463.2004.00841.x
Deutsch, C., Ferrel, A., Seibel, B., Pörtner, H.-O., and Huey, R. B. (2015). Climate change tightens a metabolic constraint on marine habitats. Science 348, 1132–1136. doi: 10.1126/science.aaa1605
Farrell, A. P., and Richards, J. G. (2009). “Defining hypoxia: an integrative synthesis of the responses of fish to hypoxia,” in Fish Physiology, Vol. 27, eds J. G. Richards, A. P. Farrell and C. J. Brauner (Amsterdam: Elsevier), 487–503.
Field, C. B., Barros, V. R., Dokken, D. J., Mach, K. J., Mastrandrea, M. D., Bilir, T. E., et al. (eds.). (2014). “Part A: Global and Sectoral Aspects,” in Climate Change 2014: Impacts, Adaptation, and Vulnerability. Contribution of Working Group II to the Fifth Assessment Report of the Intergovernmental Panel on Climate Change (Cambridge, UK; New York, NY: Cambridge University Press), 1–32.
Finlay, B. J., and Esteban, G. F. (2007). “Body size and biogeography,” in Body Size: The Structure and Function of Aquatic Ecosystems, eds A. Hildrew, D. Raffaelli and R. Edmonds-Brown (Cambridge: Cambridge University Press), 167–185.
Forbes, T. L. (1989). “The importance of size-dependent processes in the ecology of deposit-feeding benthos,” in Lect. Notes Coastal estuarine Stud., Vol. 31, Ecology of Marine Deposit Feeders (New York, NY: Springer), 171–200.
Forbes, T. L., and Lopez, G. R. (1987). The allometry of deposit feeding in Capitella species i (Polychaeta: Capitellidae): the role of temperature and pellet weight in the control of egestion. Biol. Bull. 172, 187–201. doi: 10.2307/1541792
Forbes, T. L., and Lopez, G. R. (1990). The effect of food concentration, body size, and environmental oxygen tension on the growth of the deposit-feeding polycheate, Capitella species 1. Limnol. Oceanogr. 35, 1535–1544. doi: 10.4319/lo.1990.35.7.1535
Forbes, T. L., Forbes, V. E., and Depledge, M. H. (1994). Individual physiological responses to environmental hypoxia and organic enrichment: implications for early soft-bottom community succession. J. Mar. Res. 52, 1081–1100. doi: 10.1357/0022240943076849
Fry, F. E. J. (1971). “The effect of environmental factors on the physiology of fish,” in Fish Physiology, Vol. 6, eds W. S., Hoar and D. J. Randall (New York, NY: Academic Press), 1–98. doi: 10.1016/S1546-5098(08)60146-6
Gillooly, J. F., Brown, J. H., West, G. B., Savage, V. M., and Charnov, E. L. (2001). Effects of size and temperature on metabolic rate. Science 293, 2248–2251. doi: 10.1126/science.1061967
Giometto, A., Altermatt, F., Carrara, F., Maritan, A., and Rinaldo, A. (2013). Scaling body size fluctuations. Proc. Natl. Acad. Sci. U.S.A. 110, 4646–4650. doi: 10.1073/pnas.1301552110
Glazier, D. S. (2006). Beyond the ‘3/4-power law’: variation in the intra- and interspecific scaling of metabolic rate in animals. Biol. Rev. 80, 611–662. doi: 10.1017/S1464793105006834
Gonzalez, R., and Quionones, R. A. (2000). Pyruvate oxidoreductases involved in glycolytic anaerobic metabolism of polychaetes from the continental shelf off central-south Chile. Estuar. Coast. Shelf Sci. 51, 507–519. doi: 10.1006/ecss.2000.0693
Grassle, J. F., and Grassle, J. P. (1974). Opportunistic life histories and genetic systems in marine benthic polychaetes. J. Mar. Res. 32, 253–284.
Grassle, J. P., and Grassle, J. F. (1976). Sibling species in the marine population indicator Capitella (Polychaeta). Science 192, 567–569. doi: 10.1126/science.1257794
Grieshaber, M. K., Grieshaber, M. K., Hardewig, I., Kreutzer, U., and Pörtner, H. O. (1994). Physiological and metabolic responses to hypoxia in invertebrates. Rev. Physiol. Biochem. Pharmacol. 125, 43–147. doi: 10.1007/BFb0030909
Harley, C. D., Hughes, R. A., Hultgren, K. M., Miner, B. G., Sorte, C. J., Thornber, C. S., et al. (2006). The impacts of climate change in coastal marine systems. Ecol. Lett. 9, 228–241. doi: 10.1111/j.1461-0248.2005.00871.x
Herreid, C. F. II. (1980). Hypoxia in invertebrates. Comp. Biochem. Physiol. 67A, 311–320. doi: 10.1016/S0300-9629(80)80002-8
Hulbert, A. J., and Else, P. L. (2000). Mechanisms underlying the cost of living in animals. Annu. Rev. Physiol. 62, 207–235. doi: 10.1146/annurev.physiol.62.1.207
Jager, T., and Selck, H. (2011). Interpreting toxicity data in a DEB framework: a case study for nonylphenol in the marine polychaete Capitella teleta. J. Sea Res. 66, 456–462. doi: 10.1016/j.seares.2011.04.003
Jennings, S., Pinnegar, J., Polunin, N., and Warr, K. (2002). Linking size-based and trophic analyses of benthic community structure. Mar. Ecol. Prog. Ser. 226, 77–85. doi: 10.3354/meps226077
Kelly-Gerreyn, B. A., Martin, A. P., Bett, B. J., Anderson, T. R., Kaariainen, J. I., Main, C. E., et al. (2014). Benthic biomass size spectra in shelf and deep-sea sediments. Biogeosciences 11, 6401–6416. doi: 10.5194/bg-11-6401-2014
Kersey Sturdivant, S., Perchik, M., Brill, R. W., and Bushnell, P. G. (2015). Metabolic responses of the nereid polychaete, Alitta succinea, to hypoxia at two different temperatures. J. Exp. Mar. Bio. Ecol. 473, 161–168. doi: 10.1016/j.jembe.2015.09.001
Kooijman, S. A. L. M., Sousa, T., Pecquerie, L., Van Der Meer, J., and Jager, T. (2008). From food-dependent statistics to metabolic parameters, a practical guide to the use of dynamic energy budget theory. Biol. Rev. 83, 533–552. doi: 10.1111/j.1469-185X.2008.00053.x
Kristensen, E. (1983). Ventilation and oxygen uptake by three species of Nereis (Annelida: Polychaeta). I. Effects of hypoxia. Mar. Ecol. Prog. Ser. 12, 289–297. doi: 10.3354/meps012289
Laffoley, D., and Baxter, J. M. (2016). Explaining Ocean Warming: Causes, scale, Effects and Consequences. Full Report (Gland: IUCN), 456.
Levin, L. A., and Le Bris, N. (2015). The deep ocean under climate change. Science 350, 766–768. doi: 10.1126/science.aad0126
Levin, L. A., Mendoza, G. F., Konotchick, T., and Lee, R. (2009). Macrobenthos community structure and trophic relationships within active and inactive Pacific hydrothermal sediments. Deep. Res. II Top. Stud. Oceanogr. 56, 1632–1648. doi: 10.1016/j.dsr2.2009.05.010
Linke-Gamenick, I., Vismann, B., and Forbes, V. E. (2000). Effects of fluoranthene and ambient oxygen levels on survival and metabolism in three sibling species of Capitella (Polychaeta). Mar. Ecol. Prog. Ser. 194, 169–177. doi: 10.3354/meps194169
Livingstone, D. R., and Bayne, B. L. (1977). Responses of Mytilus edulis L. to low oxygen tension: anaerobic metabolism of the posterior adductor muscle and mantle tissues. J. Comp. Physiol. 114, 143–155. doi: 10.1007/BF00688965
Makarieva, A. M., Gorshkov, V. G., Li, B.-L., Chown, S. L., Reich, P. B., and Gavrilov, V. M. (2008). Mean mass-specific metabolic rates are strikingly similar across lifes major domains: evidence for lifes metabolic optimum. Proc. Natl. Acad. Sci. U.S.A. 105, 16994–16999. doi: 10.1073/pnas.0802148105
Mangum, C. P. (1973). Responses of aquatic invertebrates to declining oxygen conditions. Amer. Zool. 13, 529–541. doi: 10.1093/icb/13.2.529
Marquet, P., Quiñones, R., Abades, S., Labra, F., Tognelli, M., Arim, M., and Rivadeneira, M. (2005). Scaling and power-laws in ecological systems. J. Exp. Biol. 208, 1749–1769. doi: 10.1242/jeb.01588
McBryan, T. L., Anttila, K., Healy, T. M., and Schulte, P. M. (2013). Responses to temperature and hypoxia as interacting stressors in fish: implications for adaptation to environmental change. Integr. Comp. Biol. 53, 648–659. doi: 10.1093/icb/ict066
Meire, L., Soetaert, K. E. R., and Meysman, F. J. R. (2013). Impact of global change on coastal oxygen dynamics and risk of hypoxia. Biogeosciences 10, 2633–2653. doi: 10.5194/bg-10-2633-2013
Miller, N. (2014). Calculating Oxygen Saturation: An R Function. Available online at http://www.nate-miller.org/blog/calculating-oxygen-saturation-an-r-function.
Morgan Ernest, S. K., Enquist, B. J., Brown, J. H., Charnov, E. L., Gillooly, J. F., Savage, V. M., et al. (2003). Thermodynamic and metabolic effects on the scaling of production and population energy use. Ecol. Lett. 6, 990–995. doi: 10.1046/j.1461-0248.2003.00526.x
Packard, T. T., and Gómez, M. (2008). Exploring a first-principles-based model for zooplankton respiration. ICES J. Mar. Sci. 65, 371–378. doi: 10.1093/icesjms/fsn003
Peters, R. H. (1983). The Ecological Implications of Body Size. New York, NY: Cambridge University Press.
Pörtner, H. O. (2010). Oxygen- and capacity-limitation of thermal tolerance: a matrix for integrating climate-related stressor effects in marine ecosystems. J. Exp. Biol. 213, 881–893. doi: 10.1242/jeb.037523
Pörtner, H. O., Langenbuch, M., and Michaelidis, B. (2005). Synergistic effects of temperature extremes, hypoxia, and increases in CO2 on marine animals: From Earth history to global change. J. Geophys. Res. Ocean. 110:15.
Qu, F., Nunnally, C., and Rowe, G. T. (2015). Polychaete annelid biomass size spectra: The effects of hypoxia stress. J. Mar. Biol. 2015, 1–9. doi: 10.1155/2015/983521
Rakocinski, C. F. (2009). Linking allometric macrobenthic processes to hypoxia using the Peters mass balance model. J. Exp. Mar. Bio. Ecol. 381, S13–S20. doi: 10.1016/j.jembe.2009.07.005
Riedel, B., Diaz, R., Rosenberg, R., and Stachowitsch, M. (2016). “Ecological Consequences of Marine Hypoxia: From Behavioural to Ecosystem Responses,” in Stressors in the Marine Environment eds M. Solan and N. M. Whitley (Oxford, UK: Oxford University Press), 175–194.
Robinson, W. R., Peters, R. H., and Zimmermann, J. (1983). The effects of body size and temperature on metabolic rate of organisms. Can. J. Zool. 61, 281–288. doi: 10.1139/z83-037
Sagasti, A., Schaffner, L. C., and Duffy, J. E. (2001). Effects of periodic hypoxia on mortality, feeding and predation in an estuarine epifaunal community. J. Exp. Mar. Bio. Ecol. 258, 257–283. doi: 10.1016/S0022-0981(01)00220-9
Salvato, B., Cuomo, V., Di Muro, P., and Beltramini, M. (2001). Effects of environmental parameters on the oxygen consumption of four marine invertebrates: a comparative factorial study. Mar. Biol. 138, 659–668. doi: 10.1007/s002270000501
Schmid, P. E., and Schmid-Araya, J. M. (2007). “Body size and scale invariance: multifractals in invertebrate communities,” in Body Size: The Structure and Function of Aquatic Ecosystems, eds A. Hildrew, D. Raffaelli, and R. Edmonds-Brown (New York, NY: Cambridge University Press), 140–166.
Shumway, S. E. (1979). The effects of body size, oxygen tension and mode of life on the oxygen uptake rates of polychaetes. Comp. Biochem. Physiol. A Physiol. 64, 273–278. doi: 10.1016/0300-9629(79)90660-1
Sokolova, I. M. (2013). Energy-limited tolerance to stress as a conceptual framework to integrate the effects of multiple stressors. Integr. Comp. Biol. 53, 597–608. doi: 10.1093/icb/ict028
Sokolova, I. M., and Pörtner, H. O. (2003). Metabolic plasticity and critical temperatures for aerobic scope in a eurythermal marine invertebrate (Littorina saxatilis, Gastropoda: Littorinidae) from different latitudes. J. Exp. Biol. 206, 195–207. doi: 10.1242/jeb.00054
Sokolova, I. M., Frederich, M., Bagwe, R., Lannig, G., and Sukhotin, A. A. (2012). Energy homeostasis as an integrative tool for assessing limits of environmental stress tolerance in aquatic invertebrates. Mar. Environ. Res. 79, 1–15. doi: 10.1016/j.marenvres.2012.04.003
Taylor, A. C. C., and Brand, A. R. R. (1975). Effects of hypoxia and body size on the oxygen consumption of the bivalve Arctica islandica (L.). J. Exp. Mar. Bio. Ecol. 19, 187–196. doi: 10.1016/0022-0981(75)90046-5
Van Der Meer, J. (2006). Metabolic theories in ecology. Trends Ecol. Evol. 21, 136–140. doi: 10.1016/j.tree.2005.11.004
Vaquer-Sunyer, R., and Duarte, C. M. (2011). Temperature effects on oxygen thresholds for hypoxia in marine benthic organisms. Glob. Chang. Biol. 17, 1788–1797. doi: 10.1111/j.1365-2486.2010.02343.x
Keywords: multiple stressors, aerobic respiration, bioenergetics, hypoxia, warming, polychaetes
Citation: Rakocinski CF and Gillam KB (2017) Temperature-Modulated Expression of Allometric Respiration Strategies Supports a Metabolic Scaling Rule. Front. Mar. Sci. 4:261. doi: 10.3389/fmars.2017.00261
Received: 24 May 2017; Accepted: 31 July 2017;
Published: 15 August 2017.
Edited by:
Alberto Basset, University of Salento, ItalyReviewed by:
Paolo Magni, Consiglio Nazionale Delle Ricerche (CNR), ItalyRafael Perez-Dominguez, Office for National Statistics, United Kingdom
Copyright © 2017 Rakocinski and Gillam. This is an open-access article distributed under the terms of the Creative Commons Attribution License (CC BY). The use, distribution or reproduction in other forums is permitted, provided the original author(s) or licensor are credited and that the original publication in this journal is cited, in accordance with accepted academic practice. No use, distribution or reproduction is permitted which does not comply with these terms.
*Correspondence: Chet F. Rakocinski, chet.rakocinski@usm.edu