A New Remotely Operated Sensor Platform for Interdisciplinary Observations under Sea Ice
 Christian Katlein1*
  Martin Schiller1 Hans J. Belter1 Veronica Coppolaro1 David Wenslandt2
  Marcel Nicolaus1
- 1Sea-Ice-Physics, Alfred-Wegener-Institut Helmholtz-Zentrum für Polar- und Meeresforschung, Bremerhaven, Germany
- 2Ocean Modules Sweden AB, Åtvidaberg, Sweden
Observation of the climate and ecosystem of ice covered polar seas is a timely task for the scientific community. The goal is to assess the drastic and imminent changes of the polar sea ice cover induced by climate change. Retreating and thinning sea ice affects the planets energy budget, atmospheric, and oceanic circulation patterns as well as the ecosystem associated with this unique habitat. To increase the observational capabilities of sea ice scientists, we equipped a remotely operated vehicle (ROV) as sensor platform for interdisciplinary research at the ice water interface. Here, we present the technical details and operation scheme of the new vehicle and provide data examples from a first campaign in the Arctic in autumn 2016 to demonstrate the vehicle's capabilities. The vehicle is designed for efficient operations in the harsh polar conditions. Redundant modular design allows operation by three scientists simultaneously operating a wide variety of sensors. Sensors from physical, chemical, and biological oceanography are combined with optical and acoustic sea ice sensors to provide a comprehensive picture of the underside of sea ice. The sensor suite provides comprehensive capabilities and can be further extended as additional ports for power and communication are available. The vehicle provides full six degrees of freedom in navigation, enabling intervention, and manipulation skills despite its simple one function manipulator arm.
Introduction
Marine robotic technologies have found increased use in the marine science community during the recent years. Scientists employ a suite of vehicles in various size ranges from small simple measurement systems to huge highly sophisticated and automated devices. However, the majority of these operations are currently limited to open ocean applications. While the harsh environmental conditions for routine offshore operations are already challenging, the operation of sophisticated robotic technologies in the polar regions is constrained by many limiting factors. In addition to cold temperatures and poorly predictable weather, the sea ice cover is a serious inhibitor to robotic operations hindering asset deployment, retrieval, communication, and navigation.
The Arctic and Antarctic sea ice region are understudied mainly due to the logistical difficulty for access. Accessing the underside of polar sea ice is particularly challenging, as human SCUBA diving underneath the ice cover poses a great logistical challenge, and comparably high risks. Cold water temperatures significantly limit diving times and safety precautions limit the spatial range of diving operations from the access hole.
Robotic vehicles are an excellent tool to overcome these problems. The use of remotely operated vehicles (ROV) and autonomous underwater vehicles (AUV) under polar sea ice has been explored already more than a decade ago (Gutt, 1995; Ambrose et al., 2005; Wadhams et al., 2006; Kaminski et al., 2010) with vehicles targeted at a specific task using a limited set of sensors. Today they are operated on a more regular basis (Nicolaus and Katlein, 2013; Norgren and Skjetne, 2014; Katlein et al., 2015a; Williams et al., 2015; Forrest et al., 2016). Vehicles now target a larger variety of tasks with a more complex combination of sensors. They developed away from single tasks to comprehensive sensor platforms for various research applications. The currently most complex under-ice vehicle, capable of conducting complex piloted and autonomous under-ice surveys with a comprehensive sensor suite is the light-fiber tethered hybrid ROV Nereid Under Ice (NUI) vehicle (Bowen et al., 2014; Katlein et al., 2015a; McFarland et al., 2015). However, such huge and complex systems have a large logistical footprint, both in terms of vehicle handling as well as the need for rather large highly trained engineering teams.
Following this development, we developed a new research platform for interdisciplinary under-ice research. Despite its comprehensive sensor suite—competitive to the one on NUI (Katlein et al., 2015a)—the ROV is lightweight enough to be operated on polar sea ice by three people. The high payload to weight ratio of 0.4 and the limited logistical footprint allow effective operation during standard research routines on ice-going ship expeditions. The fully redundant architecture and the commercial “V8 M500” ROV basis will make the vehicle operable by trained scientists without the support of a dedicated engineering team.
Interdisciplinary investigation of the sea ice system is crucial to extend the limited data available from the polar pack ice regions. Sea ice plays a major role in the earth's climate system by controlling fluxes of energy and momentum between the atmosphere and the polar oceans (Solomon, 2007). Despite the harsh climatic conditions sea ice also harbors a complex ecosystem which is tightly coupled to the response of polar sea ice to global climate change (Melnikov, 1997; Quillfeldt et al., 2009). Sea ice extent has been decreasing dramatically throughout the last decades, particularly in the Arctic (Stroeve et al., 2012). Global sea ice change has been documented well using satellite observations and numerical models (Cavalieri et al., 1997; Stammerjohn and Smith, 1997; Katlein et al., 2017). However, sea ice properties exhibit a tremendous spatial variability on the scale of individual ice floes (Perovich, 1990; Nicolaus et al., 2012; Katlein et al., 2015a), which is hardly represented in large scale observations, and modeling at the moment. Investigating the processes causing the spatial variability of physical sea ice properties, as well as its interaction with the associated ecosystem on small scales is highly important due to strongly non-linear processes and feedback mechanisms (Curry et al., 1995; Eisenman, 2012). Classical sea ice observations are often carried out by point measurements such as ice coring, or along transect lines but hardly cover the complex spatial variability over an entire ice floe (Nicolaus et al., 2013).
ROV observations are thus particularly suitable to address the following scientific challenges: They provide a means to extend typical point measurements of sea ice properties toward spatially distributed measurements. This allows covering various types of sea ice, such as newly formed ice, ponded as well as snow covered sea ice, and pressure ridges within the same survey. Providing data on the scale of single ice floes, ROVs can thus also provide a great tool to bridge the scale gap in observations between point measurements and large scale airborne, ship or satellite surveys and for comparison to numerical models (Lange et al., 2016). As ROV operations do not require a researcher to walk on the investigated ice, they allow unbiased detailed studies of thin ice regions. If sufficient surface infrastructure like heated control stands is present, they can be operated throughout the entire year, including the winter season. A main feature of ROVs can be a very comprehensive sensor suite allowing interdisciplinary interpretation of a variety of measured parameters on the same platform.
Here, we present the new vehicle and its potential applications in under-ice research. The novelty compared to other similar systems is its exceptionally high payload to weight ratio and the comprehensive interdisciplinary sensor suite. The vehicle builds on 5 years of experience operating the Ocean Modules “V8 Sii” ROV (Nicolaus and Katlein, 2013) as a polar research platform investigating the spatial variability of the physical (Katlein et al., 2014, 2015a) and biological properties (Katlein et al., 2015b; Lange et al., 2016) of the polar pack ice on the scale of individual ice floes.
The ROV-System
Vehicle Concept
In contrast to open water applications, in under-ice ROV operations the object of interest is always above the vehicle. This affects all components of the system, such as sensor positions, but also deployment, navigation, and bailout strategies. All sensors, measuring sea ice properties, have to be located on the vehicle top, looking upward toward the ice. As most regular ROVs (“inherently stable” ROV) have all their buoyancy blocks in the top (Christ and Wernli, 2014), space is limited if the vehicle size is not to be extended by multiple attachments. A compact and rugged vehicle frame protecting sensing equipment allows easy handling on the ice and during dives close to the ice-water interface. The Ocean Modules M500 is by design an “artificially stabilized” ROV with the center of buoyancy in and not above the center of gravity, where vehicle attitude is automatically stabilized by a system of closed-loop control routines. Thus, the vehicle control systems allow easy piloting and full six degrees of freedom by automatic compensation of vehicle attitude using its eight vectored thrusters. While providing great stability for horizontal transects, this supplies the vehicle with a high maneuverability when conducting special observation tasks and even intervention capabilities. The special buoyancy configuration allows for a large variety of upward looking sensors, as not all buoyancy needs to be located in the vehicle top. To avoid getting stuck under the ice in case of electronic failure, the vehicle is trimmed slightly negatively buoyant. In the case of any failure, it will sink down and can be retrieved manually by pulling the umbilical tether cable.
Another main feature of the system is its comparably low logistical footprint, as it can be operated by trained scientists without dedicated engineers and pilots. To increase reliability and ease troubleshooting, the system is completely redundant in all central components. This is achieved by a redundant second dive-ready ROV system, which can be used to rescue the main vehicle if it is stuck under the ice, as well as to swap out components by simply changing the electronics housings or damaged parts.
The vehicle has a height of 0.73 m, length of 0.97 m, and a width of 0.75 m (Figure 1A). Including all scientific payload it weighs 130 kg. It is connected to the surface unit by a 300 m fiber optic tether (umbilical tether cable) with a breaking strength of 5 kN. The M500 base system provides a depth rating of 500 m, while the 300 m tether limits diving depth to a maximum of 300 m. Thus, all major ROV components and main sensors were selected for a minimum depth rating of 300 m, with one exception for scientific payload which is just used in the upper 100 m of the water column. Several sensors not requiring upward looking configuration are placed in a rugged sensor skid below the ROV which is equipped with glide rails to ease vehicle transport on the sea ice surface. Sufficient water exchange is enabled by slits in the bottom plate of the sensor skid. Generally the vehicle is designed for work in the upper 50 m of the water column to investigate the polar ice cover and its interaction with the underlying ocean.
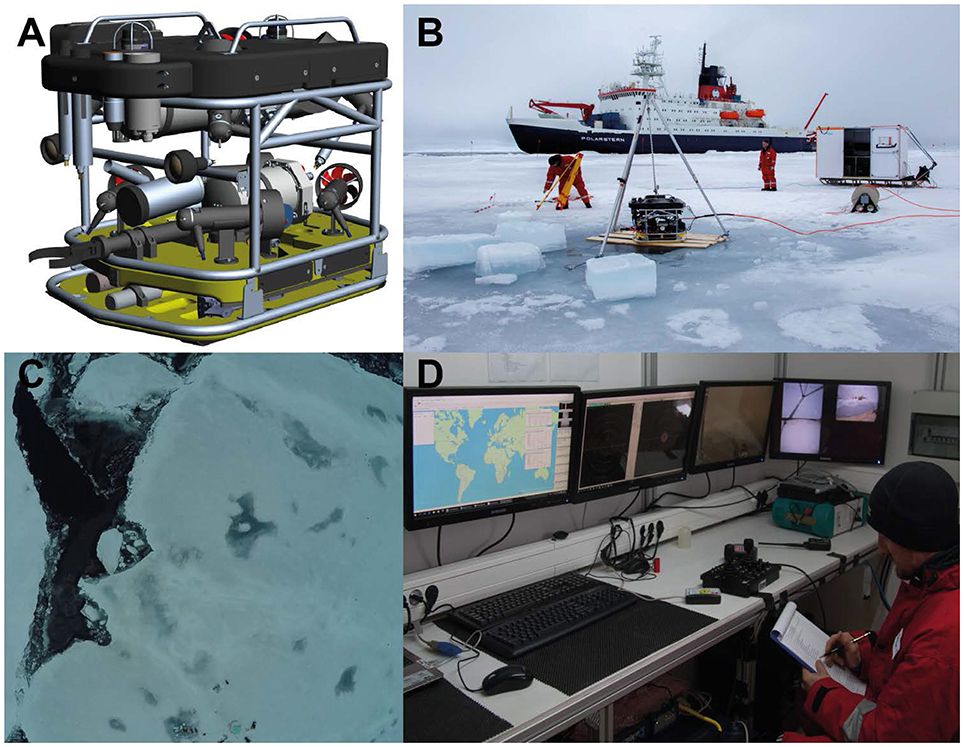
Figure 1. (A) Schematic drawing of the vehicle concept; (B) Deployment of the ROV system on an ice station. The ROV is hanging on its deployment tripod with the control cabin standing on sleds visible behind. Host icebreaker RV Polarstern is visible in the background. (C) Aerial image depicting the variability of sea ice surface properties within the survey area during the deployment on ice station PS101/057 sampled on 15 September 2016. The ROV deployment area visible in (B) can be seen in the bottom of the image. (D) Overview of the inside of the control cabin. Monitors for Spot.On data recording, sonar display, main and secondary cameras (from left to right) are mounted on the wall, while the control electronics are set up in the middle console under the table.
Deployment Procedure
The ROV system is almost always operated directly from the ice, allowing both for unperturbed sampling of small scale features at the ice ocean interface, as well as simultaneous scientific station work on the host icebreaker. The entire system is mounted within a light-weight control stand, which can be lifted by crane onto the ice, and pulled to the designated access hole using Nansen-sledges and a snow mobile. Due to its weight of 750 kg, the entire system can also be airlifted by helicopter onto an ice floe. The control stand provides sufficient shelter against winds and precipitation and can be heated if necessary. A picture of a typical deployment is shown in Figures 1B–D.
Auxiliary equipment, such as generators, ice drills etc. is transported to the location on additional sledges. The access hole of approximately one by one meter is cut manually into the ice at the desired location either using hand ice saws or overlapping holes of a 30 cm ice drill. Preparation of the hole takes 0.5–3 h for ice thicknesses between 0.3 and 1.5 m in summer sea ice. An access hole cut through the ice is mostly preferred over deployment on the floe edge. This decreases the risk of tether damage (and thus losing the vehicle) by compressing ice floes, allows for easy vehicle deployment by a simple lifting tripod and provides good access to the vehicle during deployment. For better orientation underneath the ice, colored marker sticks are placed through drill holes along 50–100 m transects. These preparation tasks are usually conducted within 2–3 h, so that sufficient diving times can be expected on stations with durations of at least 6–8 h. In between dives, the vehicle is usually left in the water to avoid contact with much colder air temperatures.
Vehicle Navigation and Piloting
The vehicle is piloted by two persons, while a third one manages the tether, as well as other tasks, such as a potentially necessary bear guard. The main pilot is operating and navigating the vehicle under the ice. The vehicle is navigated using video streams from the forward looking HD-video camera, as well as three other cameras for pilot awareness (Figure 2). Navigation is further aided by an acoustic positioning system (see below), as well as the marker sticks positioned along diving transects. A second pilot is operating the scientific sensor suite, oversees data recordings and logs observations and events in the SPOT.ON recording software (Ocean Modules, Åtvidaberg, Sweden).
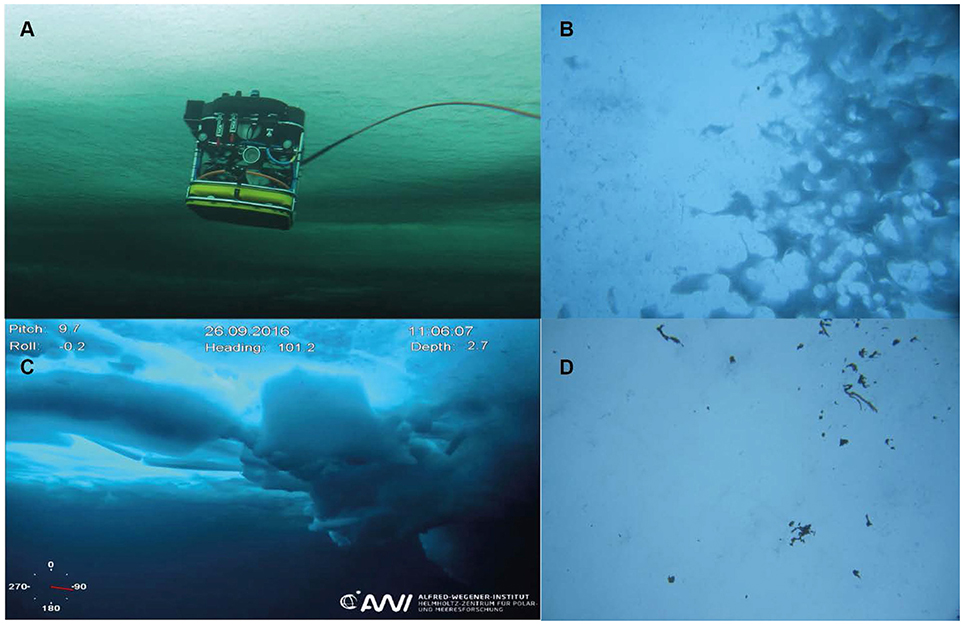
Figure 2. (A) Vehicle diving under the ice. (B) Structures of strongly melted ice as visible from the upward looking camera. (C) Image of a sea ice pressure ridge from below as visible in the main high definition video camera. Vehicle telemetry is displayed as overlay for the pilot. (D) Aggregates of ice associated algae Melosira arctica hanging underneath sea ice.
In a general surveying scheme, transects along marked lines are surveyed at constant depth with minimum distance to the sea ice around 1–2 m. This ensures a smooth inspection of the spatial variability of sea ice properties. The vehicle allows a maximum speed of 4 m/s, but is usually traveling slower to allow for good spatial resolution of the acquired data. Lateral transects are complemented with further transect lines in parallel to the first diving paths covering the area in a lawnmower pattern. Depending on mission goals, lateral transects may be repeated at greater depth or after a certain time period. Additional features of interest, such as nearby pressure ridges or thin ice areas can be visited during extra dives.
To investigate the vertical variability of water properties and the light field underneath the ice-cover vertical profiles are conducted along a weighted rope lowered through the ice.
Payload Sensors
The payload of the vehicle is divided into navigational and scientific payload. The main difference is, that redundant parts are only available for the vital navigational sensors, while no spares are available for scientific sensors to decrease total system costs, and allow easy exchange of sensors with other working groups. This basic sensor suite can be augmented depending on the scientific question by a variety of mission specific sensors which can be easily integrated into the system. Mounting locations of all sensors can be found in Figure 3 and a detailed overview of all sensors is given in Table 1. While most relevant details of the integrated sensors are described in the following paragraphs, full detailed specifications can be found at https://sensor.awi.de/?site=path&device=vehicle:beast.
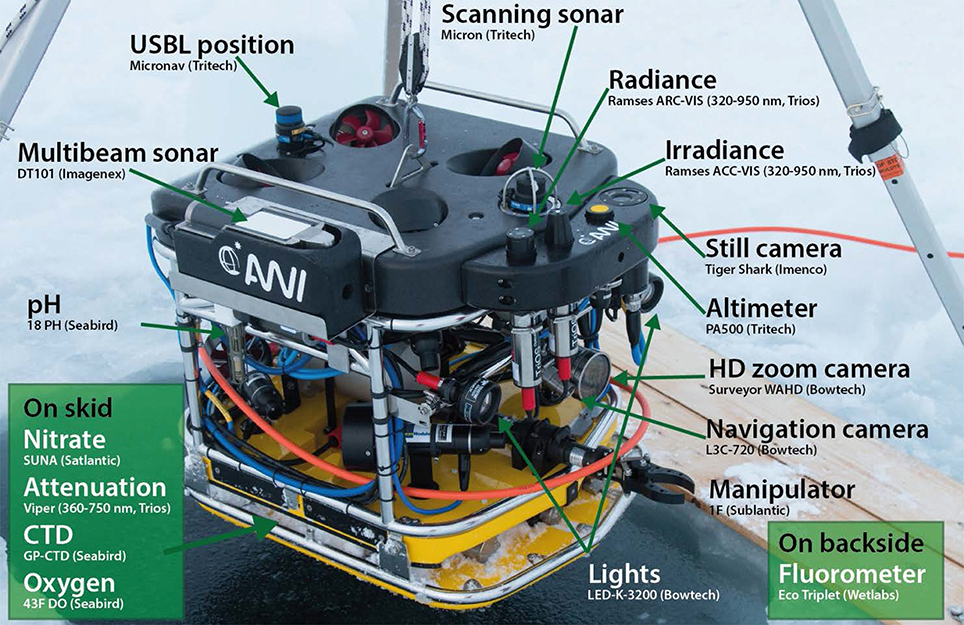
Figure 3. Sensor positions indicated on an image of the vehicle shortly before deployment.
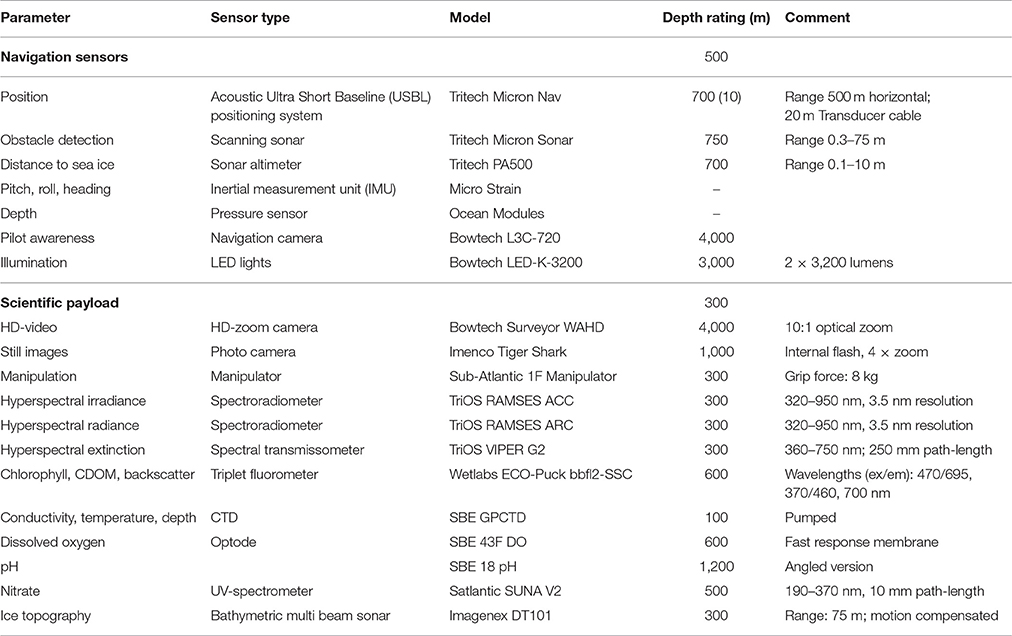
Table 1. Overview of Sensors for science and navigation onboard the ROV system.
Navigational Sensors
Vehicle attitude is measured with an onboard inertial measuring unit (Microstrain IMU) with three axis accelerometer, magnetometer and gyroscope. Depth is measured by a pressure sensor (Keller A-21Y, Keller AG, Jestetten, Germany) included in the main electronics housing. Roll, pitch, heading, and depth values are used internally for vehicle stabilization, shown in the video overlay and logged automatically.
To avoid collision with the ice, as well as for determination of ice draft and data correction the vehicle is equipped with an altimeter (PA-500 High Precision Altimeter, Tritech, UK). A scanning sonar (Micron DST Scanning Sonar, Tritech, UK) provides navigational awareness for the pilot in turbid waters to detect obstacles such as ridges, and marker sticks outside of the visibility range.
Position is recorded with an ultra-short baseline (USBL) acoustic positioning system (MicronNav, Tritech, UK). The acoustic environment underneath sea ice is complex due to the highly reflective ice bottom, shadowing by pressure ridges, and the variety of acoustic sounding equipment operated on the host icebreaker. A list of all acoustic frequencies used on the ROV system is given in Table 2. To account for sea ice drift during the observation, the acoustic transducer is given a fixed geographic position yielding pseudo-geographic vehicle locations to allow for proper function of both, the recording survey software as well as Multibeam processing tools. A local floe-fixed x,y-coordinate system is established on the floe using handheld GPS receivers to allow for colocation of the ROV survey with data acquired at the surface.
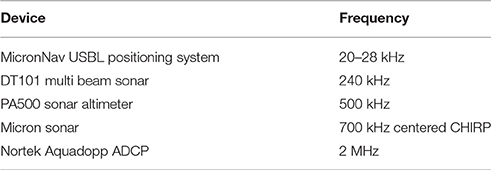
Table 2. List of acoustic frequencies used on devices onboard the ROV system.
Additional pilot awareness is provided by two SD-video cameras (Bowtech L3C-720, Bowtech, UK). One is mounted as rear looking camera to ease complex maneuvers and observe tether position and movement, while the other one is oriented forward and tilted upwards to ease observation of the ice-water interface. Both cameras can be relocated to any other position on the vehicle. Two LED-lights are available (LED-K-3200, Bowtech), but natural lighting through the ice is often sufficient and preferred for many research tasks.
Scientific Sensors
The vehicle provides a comprehensive sensor suite for studying the under-ice environment. Its particular strength is the combination of different sensor sets from various disciplines such as physical, chemical, and biological oceanography as well as sea ice physics and biology. Coincident acquisition of consistent interdisciplinary data provides researchers with a wide variety of environmental data to ease data interpretation.
A high definition zoom camera (Surveyor WAHD, Bowtech) provides high quality video images. Zoom and focus of the camera can be adjusted by the co-pilot during the dive. Upward looking still images can be captured automatically every 5 s with a resolution of 14.1 megapixel (Tiger Shark, Imenco, Norway). This camera also provides an upward looking video stream for additional pilot awareness. The camera also includes a flash module, which can be applied if needed.
The amount and spectral quality of light transmitted through the sea ice is measured with two upward looking hyperspectral radiometers. One of them is equipped with a cosine collector plate to measure downwelling irradiance (RAMSES-ACC), while the other one is equipped with a fore optic with a field of view of ~9° to measure radiance (RAMSES-ARC, TriOS, Rastede, Germany). These radiometers measure hyperspectral irradiance and radiance in a wavelength band from 320 to 950 nm at a resolution of 3.3 nm (Nicolaus et al., 2010). To complement and correct these measurements for the water layer between ice and sensors, the vehicle carries a hyperspectral extinction sensor (VIPER-G2, TriOS, Rastede, Germany).
Basic oceanographic data is acquired by a pumped CTD package (SBE GPCTD, Seabird Scientific, USA) providing measurements of seawater conductivity/salinity, temperature, pressure as well as dissolved oxygen (SBE 43FDO). These basic measurements are complemented with a pH sensor (SBE 18 pH) and a UV-spectrometer for nitrate measurements (SUNA V2, Satlantic). The bio-optical properties of the water column are measured using a triplet fluorometer (ECO-Puck BBFL2-SSC, Wetlabs) providing measurements of optical backscatter, fluorescent dissolved organic matter (FDOM), and chlorophyll fluorescence.
Another key instrument is an upward looking bathymetric Multibeam sonar (DT-101, Imagenex, USA) to scan the geometry of the topography of the ice underside. Operating a Multibeam sonar on such a small and agile platform becomes possible due to the internal motion compensation of the DT101 sonar head and its ability to operate in an upward looking orientation.
Additional Interfaces
To keep the vehicle open to further developments and mission specific sensors, the vehicle is equipped with additional interfaces. Three programmable DC ports provide between 5 and 18 V to auxiliary sensors. They can be reprogrammed and switched on and off while the vehicle is submerged to enable e.g., the commanded operation of pumps or other sampling tools. In addition 24 V are available at three auxiliary ports on the vehicle. Data connection can be provided subsea by two RS232 and two RS485 serial ports, which can be routed either to physical or virtual COM ports on the surface interface unit. For applications with high data rates the ROV is equipped with one standard Ethernet (including power over Ethernet) and 1 GB Ethernet port. For the upcoming missions, we integrated an acoustic Doppler current profiler (ADCP, Aquadopp Profiler, Nortek AS, Norway) via the serial port, as well as a zooplankton macro-camera (LOKI, Isitec, Bremerhaven, Germany; Schulz et al., 2010) via gigabit Ethernet.
In addition, various data streams can be recorded, also from surface sensors, such as GPS, microphone or a reference radiometer. Direct inclusion into the Spot.On survey software ensures accurate time stamping and smooth processing.
Inspection and Intervention Capabilities
The vehicle is also equipped with a simple one function manipulator arm (1F Manipulator, Sub-Atlantic, Westhill, United Kingdom) which allows basic manipulation tasks. The open/close-functionality in combination with the full six degrees of freedom in the M500 navigation provides more possibilities than compared to standard stable ROVs where multifunction manipulator arms are necessary to perform the same tasks. Sensor packages can be placed or retrieved from under the ice, sensor positions of deployed systems can be documented or even corrected. Furthermore, the manipulator arm can be used to hold additional sampling devices such as simple nets or to mechanically trigger a water sampling bottle as integrated for the upcoming campaign. A main capability of the manipulator arm is to be able to untangle the ROV tether in case it gets stuck in between ice features, which sometimes happens due to under-ice currents, and ice-ocean shear also in spite of negatively buoyant tether trim.
Data Recording, Processing, and Archival
For such a complex and comprehensive measurement platform, simultaneous recording of all data in one point is crucial. All recording is managed by the SPOT.ON survey recording software (Ocean Modules AB, Atvidaberg, Sweden), which records and replays serial data, audio, and video streams. All data receive a common timestamp and are recorded in open plain text or open XML files. To limit processor load and guarantee smooth operation, the Multibeam sonar is controlled, and recorded by a second control computer. Accurate automatic time synchronization between the different components is realized by NTP time server and client software (ntp.org, package by Meinberg, https://www.meinberg.de/german/sw/ntp.htm) running on the involved computers synchronizing either to GPS if available, a local timeserver or to the main processing computer.
The SPOT.ON software provides an easy way of filtering USBL fixes into a smooth renavigated vehicle track. Filtering is achieved through automatic outlier detection and removal, after which a Kalman filter is applied. Data storage follows strict structure and nomenclature defined in the data description document (Katlein, http://epic.awi.de/44415/) to assure both, automated processing as well as automated data archiving: ROV survey data are processed using the AWI-ROV-Processor toolbox—a set of MATLAB functions reading the data files and providing quicklook overview plots of all sensor data. The code is available in a git repository at https://swrepo1.awi.de/scm/admin/?group_id=84. Multibeam data are cleaned and processed using CARIS HIPS 10.0 (Teledyne Caris, Falmouth, USA).
After return from the expedition, all data are fed into the raw data ingest framework (RDIF) at the computing center of the Alfred Wegener Institute to ensure longterm data archiving. Basic data, such as vehicle tracklines and videos are then also shown on the institute's open access data portal at data.awi.de for the international science community. Full datasets are available on in-house servers for scientists from different departments using the viewer version of the SPOT.ON survey software. After processing and quality control all data are uploaded to the open data publishing and archive platform PANGAEA (www.pangaea.de).
Results: Data Examples
We provide first snapshots of scientific data acquired during the expedition of RV Polarstern PS101 to the central Arctic between September 9 and October 23 2016. Presented data is exemplary to demonstrate data quality and existing processing workflows. Detailed discussion of acquired scientific data will be published separately in the future. Here, we want to demonstrate the vehicle's capabilities for polar research campaigns.
Under-Ice Light Field
The spatial variability of the under-ice light field was investigated using the hyperspectral irradiance sensor (TriOS RAMSES-ACC). Data was acquired on station PS101-171 on 1 October 2016 above the Gakkel Ridge at 86°51.5′N and 61°43.5′E. Hyperspectral values were integrated to broadband values (Nicolaus et al., 2010) and are plotted along with vehicle position on a map (Figure 4).
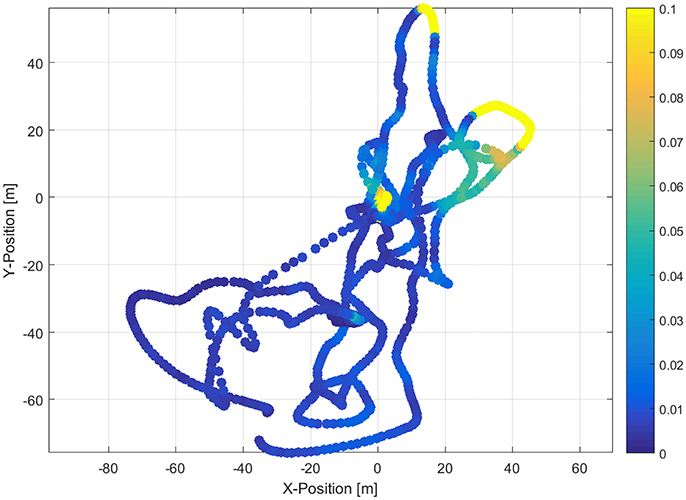
Figure 4. Map of broadband light transmittance as measured during ice station PS101–171. Areas of open water (yellow) and thin newly formed ice with higher (green) and snow covered second year ice with lower light transmission (blue) are clearly distinguishable. The curvy vehicle track is caused by the navigational challenges under the ice. More regular tracklines can be attained when acoustic positioning is more reliable than during the deployments on the first campaign.
We identified three compartments with different light transmittances. Level second year ice covered by a thin layer of snow with a transmittance of 1% as well as level newly formed ice with thin snow cover and a significantly higher light transmittance of 6%. High light transmittance was measured in the open water directly adjacent to the ice floe. These data demonstrate the capability of the vehicle to produce maps not only of light transmittance, but all other measured parameters, covering the large horizontal variability of physical sea ice properties. Spatial resolution depends on ROV speed and the geometric footprint of the used sensors (Katlein et al., 2015a).
Water Properties
Figure 5 shows an overview plot of vertical profiles of selected water properties acquired during the cruise in 2016. A time series of Chlorophyll fluorescence in the water column throughout the entire cruise period is shown in Figure 5A. A clear decrease in chlorophyll concentration is visible from the first to the last station. This autumn bloom of phytoplankton biomass was likely consumed during the period of the cruise by a stunning abundance of zooplankton in the entire under-ice water layer visible on the ROV cameras.
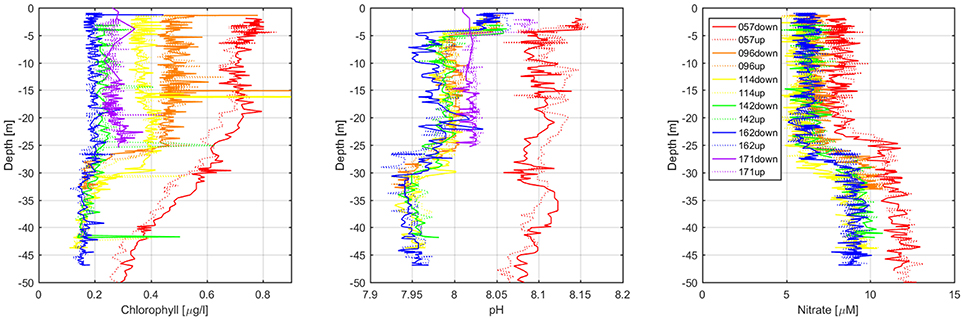
Figure 5. Vertical profiles of Chlorophyll fluorescence, pH and Nitrate as measured with the ROV along a vertical rope during the ice stations on 15 Sep (PS101-057), 19 Sep (PS101-096), 21 Sep (PS101-114), 26 Sep (PS101-142), 29 Sep (PS101-162), and October 1 2016 (PS101-171) in the survey area above the Karasik seamount on the Gakkel ridge. Displayed values are manufacturer calibrated engineering units.
The ROV can conduct vertical profiles even under undisturbed sea ice to investigate small scale gradients and ocean stratigraphy. The depth rating allows profiles down to a depth of 300 m, a depth that cannot be covered by human divers.
Under-Ice Geometry
Multiple methods for measuring ice thickness are available on the new ROV system. The most basic is to use the altimeter and the vehicle's depth sensor. Subtracting the altimeter reading from the measured vehicle depth after accounting for mounting offsets, results in measurements of sea ice draft when the vehicle attitude is sufficiently level. These can in turn be converted into ice thickness using the local hydrostatic equilibrium. Single beam sonar measurements provide a detailed high resolution ice thickness measurement along the vehicle track.
To map the three dimensional geometry of the sea ice underside the ROV system carries a Multibeam sonar. The swath of 420 beams provided an average resolution of about 0.05 m along track (dependent on survey speed) and 0.03 m across track (dependent on distance to the ice) and can be processed to a gridded three dimensional model (Figure 6).
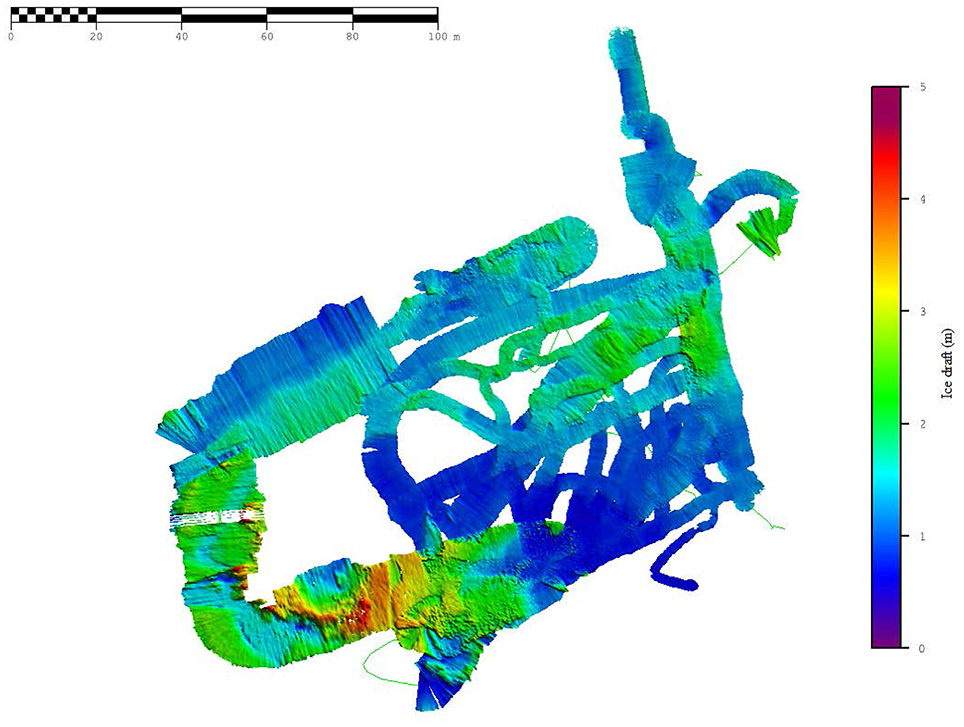
Figure 6. Under ice topography as obtained on station PS101-142 by Multibeam sonar.
Both methods were compared to standard ground based electromagnetic ice thickness sounding with a GEM-2 (Geophex Ltd., Canada) on station PS101-171. Ice thickness distributions acquired with all three methods are shown in Figure 7. While all methods agree well on the modal (most frequent) ice thickness around 0.9 m, some differences are clearly visible. Due to the higher spatial resolution and thus an increased number of measurements, the histogram derived from Multibeam sonar measurements is much smoother than the one derived from single beam sonar. GEM-2 measurements provide a smooth histogram, but significantly differ for the tails of the ice thickness distribution. The thin categories are not covered at all, as the device cannot be pulled over sea ice with a thickness below a critical safety threshold of about 0.3 m. For comparison, draft values were converted into ice thickness using a ratio of 1.12 determined from drill holes on the surveyed floe. Total thicknesses measured by the GEM-2 were corrected by subtracting snow thickness as measured with a MagnaProbe (Snow Hydro, Faibanks, Alaska, USA) snow thickness sonde.
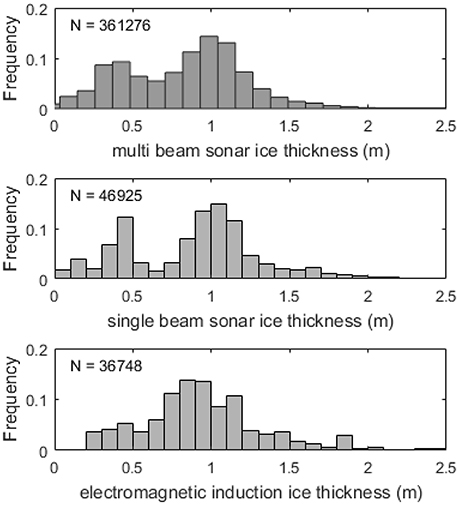
Figure 7. Ice thickness distributions derived from Multibeam sonar (top), single beam sonar (middle), and electromagnetic induction sounding (bottom).
In future deployments, Multibeam surveys could be accompanied with high resolution sea ice topography as derived using a structure from motion algorithm from the upward looking still image camera. This method could not be tested on the present dataset due to insufficient natural lighting during arctic autumn and the resulting poor image quality. A further extension to full three dimensional sea ice thickness fields could be achieved by combination with airborne or terrestrial surface laser scanning.
Discussion
Advantages of the System
The scientific sensor payload was selected after consultation of representatives from all disciplines in sea ice research. This resulted in a selection of key parameters that are measured on board the ROV system. A key aspect during system design was to record all parameters at the same time on the same platform, to maximize the scientific benefit for interdisciplinary data interpretation. The ROV provides a very flexible sensor platform, where sensors can easily be exchanged and adapted to different mission scenarios. In addition, more complex sensor modules can be affixed to the ROV as alternative sensor skid. This would allow fast and easy swapping of different sensor suites, in the scenario of e.g., two very different survey goals. While ROV measurements cover larger spatial scales, very similar sensor configurations are also employed on autonomous drifting buoys covering the temporal and seasonal variability.
Deployment directly from the ice, allows for almost undisturbed sampling of the ice ocean interface. Ice types and features, that are hard to access by traditional methods such as thin ice and pressure ridges can be surveyed from an access hole in the vicinity. This will allow new insights into ice-ocean interactions, as well as the interconnection of biological and physical sea ice processes. Its independency from specific support infrastructure allows the vehicle to be deployed at both poles during shore based surveys on landfast sea ice, as well as during icebreaker expeditions. The non-destructive nature of ROV measurements makes it particularly useful for undisturbed repeat surveys during longer term deployments on drifting camps. Thus, such a full-year deployment is planned during the international MOSAiC drift campaign of the German icebreaker Polarstern starting October 2019.
Safety precautions make measurements on ice with a thickness of < 0.3 m generally challenging. ROV observations allow for detailed measurements even under thin ice, which is usually underrepresented in manual surveys during the freeze-up period. Thus, ROV based ice thickness measurements are not biased toward thicker ice types allowing important insights into the thermodynamic growth of sea ice during freeze-up. Furthermore, Multibeam surveying allows to cover large areas in comparably short times.
Due to its compact size, the vehicle is portable by two people. This allows easy handling on the ice and limited efforts during deployment. The entire system weight is within the limits, both as external load for typical research helicopters as well as for transport by smaller fixed-wing aircraft. This allows the system to be operated within a wide range of mission scenarios with varying support infrastructure.
As the vehicle is based on a commercial ROV platform, it can be operated by scientists after a short period of introduction. The reliable system components, as well as a redundant modular setup cause only short down-time in the case of system failures. Faulty electronics modules are quickly exchangeable, as all central components are available on site. This does not require a specially trained engineering team. In addition, spare parts can be assembled into a complete dive-ready ROV system. This second identical vehicle can be used as rescue system to allow retrieval of a damaged ROV from underneath the ice. It can even be configured with alternate payload modules allowing the simultaneous operation of two vehicles at the same time. However, full redundancy of system components can only be guaranteed when the spare ROV system is not scheduled for other tasks. If weight and volume of the complete system need to be reduced e.g., for air transport, vital parts of the spare ROV system can be selected and packed independently. Due to the easy operation by trained scientists, the entire system can be used even on ice stations with durations as short as 6–8 h. Longer operations enable extensive surveying of the investigated ice floe and sufficient time for specialized sensor deployments and manipulation tasks.
Limitations
Even though the vehicle provides plenty of space for scientific sensors, its payload capacity is limited without compromising the compact shape and robustness. The deployment method puts a limit to externally fixed sensors and tools, which increase the size of the vehicle, and generate a need for bigger deployment holes. Thus, only the base configuration presented here can be used on standard dives, while significant payload additions such as large under-ice zooplankton nets, stay limited to dedicated “special purpose” dives.
While a tether length of 300 m provides a maximum transect length of 600 m, large sea ice floes are substantially larger. Also many satellite sensor footprints and model grid cell sizes are still larger by a factor of 2–10. Thus, the ROV cannot cover the entire spatial variability within these scales. The observation on these scales still remains a task for either lightly tethered hybrid ROVs or AUV, however also the deployment of a Surface and Under-Ice Trawl (SUIT) if feasible can help to extend the results from ROV surveys to a larger scale of several kilometers (Lange et al., 2016).
The accuracy of water column sensors, such as nitrate, pH or chlorophyll fluorescence heavily depends on post-mission calibration using water samples analyzed in the laboratory. This affects all bio-optical and chemical sensors that are prone to sensor drift and change their response depending on environmental conditions.
Operation Issues
Operating the pumped system of the Glider Payload CTD (SBE GPCTD) proved challenging in the harsh polar conditions. With the system mounted horizontally in the sensor skid, air bubbles get easily trapped in the system. The weak pump of the GPCTD is not able to suck these bubbles out of the system hindering a proper flow of water. This problem could be addressed to some extent by priming the CTD with warm water from a thermos bottle shortly before deployment. However, it is complicated to reach the CTD tubing within the sensor skid and increases the risk of freezing inside the conductivity cell.
During operations, we had multiple issues with acoustic interferences. Not as one would expect with such an extensive sensing suite between the different acoustic onboard sensors, but with acoustic equipment used on the host icebreaker. Serious interference of the USBL positioning system were identified with transponders of the POSIDONIA positioning system (IXBlue GmbH, Hamburg, Germany), deteriorating position fix quality beyond 30 m range from the MicronNav Transducer. When POSIDONIA operation times were coordinated with our ROV surveys, USBL position quality increased. However, acoustic noise from the M500 thrusters seemed to interfere with the MicronNav as well, so that positioning accuracy was not as good as hoped for. To solve these problems in the future, we will test the MicronNav system in responder mode, as opposed to transponder mode, and investigate the addition of an independent long baseline (LBL) positioning system.
Currently the only field experience with the system is under autumn and late summer conditions in the Arctic. While Air Temperatures of −10°C did not cause any trouble with the system, stability in full winter conditions still awaits confirmation.
Summary and Conclusions
The new vehicle provides polar researchers with an exceptionally comprehensive sensor platform with a comparably low logistical footprint of operations. Its interdisciplinary sensing capabilities can be adapted to the individual mission by additional scientific sensors as well as sampling and intervention tools. Particular strengths of the vehicle are its compact size despite the various sensors, as well as its completely redundant system architecture enabling a team of three scientists to run under-ice surveys without the support of an extensive engineering team. This and the deployment directly from the ice make the system resource efficient both in terms of available ship time as well as available cruise berths. The vehicle will be able to play an important role in future investigations of spatial variability in various sea ice associated processes on the scale of individual ice floes (1–500 m). A great opportunity will be a year-round deployment from the drifting icebreaker during the MOSAiC experiment starting in autumn 2019.
Author Contributions
CK and MN: developed the general vehicle concept. CK, MN, and MS: finalized the vehicle design together with Ocean Modules and operated the vehicle during its first campaign. HB and CK: developed the processing code. VC and CK: processed the multi beam data. CK: wrote the draft. All authors contributed to the writing of the manuscript.
Funding
The position of CK and the procurement of the ROV system were funded by the Helmholtz infrastructure initiative “Frontiers in Arctic marine monitoring” (FRAM) and the sea-ice-physics section of the Alfred-Wegener-Institut Helmholtz-Zentrum für Polar- und Meeresforschung, who also funded the other authors except DW, an employee of Ocean Modules. VC received support from a Erasmus+ traineeship grant (Grant. No. 2016-1-IT02-KA103-023799).
Conflict of Interest Statement
The authors declare that the research was conducted in the absence of any commercial or financial relationships that could be construed as a potential conflict of interest.
Acknowledgments
We thank chief scientist Antje Boetius and captain Stefan Schwarze and the crew of RV Polarstern expedition PS101 (Grant. No. PS101AWI10). We would also like to thank all involved colleagues at AWI, within the FRAM project and at Ocean Modules Sweden for realizing this challenging project.
References
Ambrose, W. G., von Quillfeldt, C., Clough, L. M., Tilney, P. V. R., and Tucker, T. (2005). The sub-ice algal community in the Chukchi sea: large- and small-scale patterns of abundance based on images from a remotely operated vehicle. Polar Biol. 28, 784–795. doi: 10.1007/s00300-005-0002-8
Bowen, A. D., Yoerger, D. R., German, C. C., Kinsey, J. C., Jakuba, M. V., Gomez-Ibanez, D., et al. (2014). “Design of Nereid-UI: a remotely operated underwater vehicle for oceanographic access under ice,” in Oceans (St. John's), 1–6.
Cavalieri, D. J., Gloersen, P., Parkinson, C. L., Comiso, J. C., and Zwally, H. J. (1997). Observed hemispheric asymmetry in global sea ice changes. Science 278, 1104–1106. doi: 10.1126/science.278.5340.1104
Christ, R. D., and Wernli, R. L. Sr. (eds.). (2014). “Vehicle design and stability, Chapter 5,” in The ROV Manual, 2nd Edn. (Oxford: Butterworth-Heinemann), 107–120.
Curry, J. A., Schramm, J. L., and Ebert, E. E. (1995). Sea ice-albedo climate feedback mechanism. J. Clim. 8, 240–247. doi: 10.1175/1520-0442(1995)008<0240:SIACFM>2.0.CO;2
Eisenman, I. (2012). Factors controlling the bifurcation structure of sea ice retreat. J. Geophys. Res. 117:D01111. doi: 10.1029/2011JD016164
Forrest, A. L., Lund-Hansen, L. C., Sorrell, B. K., Bowden-Floyd, I., Lucieer, V., Cossu, R., et al. (2016). Brief Communication: capturing scales of spatial heterogeneity of Antarctic sea ice algae communities. Cryosphere Discuss. 2016, 1–13. doi: 10.5194/tc-2016-186
Gutt, J. (1995). The occurrence of sub-ice algal aggregations off Northeast Greenland. Polar Biol. 15, 247–252. doi: 10.1007/BF00239844
Kaminski, C., Crees, T., Ferguson, J., Forrest, A., Williams, J., Hopkin, D., et al. (2010). “12 days under ice – an historic AUV deployment in the Canadian High Arctic,” in 2010 IEEE/OES Autonomous Underwater Vehicles (Monterey, CA), 1–11.
Katlein, C., Arndt, S., Nicolaus, M., Perovich, D. K., Jakuba, M. V., Suman, S., et al. (2015a). Influence of ice thickness and surface properties on light transmission through Arctic sea ice. J. Geophys. Res. 120, 5932–5944. doi: 10.1002/2015JC010914
Katlein, C., Fernández-Méndez, M., Wenzhöfer, F., and Nicolaus, M. (2015b). Distribution of algal aggregates under summer sea ice in the Central Arctic. Polar Biol. 38, 719–731. doi: 10.1007/s00300-014-1634-3
Katlein, C., Hendricks, S., and Key, J. (2017). Brief communication: antarctic sea ice gain does not compensate for increased solar absorption from Arctic ice loss. Cryosphere Discuss. 2017, 1–8. doi: 10.5194/tc-2016-279
Katlein, C., Nicolaus, M., and Petrich, C. (2014). The anisotropic scattering coefficient of sea ice. J. Geophys. Res. 119, 842–855. doi: 10.1002/2013JC009502
Lange, B. A., Katlein, C., Nicolaus, M., Peeken, I., and Flores, H. (2016). Sea ice algae chlorophyll a concentrations derived from under-ice spectral radiation profiling platforms. J. Geophys. Res. 121, 8511–8534. doi: 10.1002/2016JC011991
McFarland, C., Jakuba, M., Suman, S., Kinsey, J., and Whitcomb, L. L. (2015). “Toward ice-relative navigation of underwater robotic vehicles under moving sea-ice: experimental evaluation in the Arctic sea,” in IEEE ICRA 2015 (Seattle WA).
Nicolaus, M., Hudson, S. R., Gerland, S., and Munderloh, K. (2010). A modern concept for autonomous and continuous measurements of spectral albedo and transmittance of sea ice. Cold Reg. Sci. Technol. 62, 14–28. doi: 10.1016/j.coldregions.2010.03.001
Nicolaus, M., and Katlein, C. (2013). Mapping radiation transfer through sea ice using a remotely operated vehicle (ROV). Cryosphere 7, 763–777. doi: 10.5194/tc-7-763-2013
Nicolaus, M., Katlein, C., Maslanik, J., and Hendricks, S. (2012). Changes in Arctic sea ice result in increasing light transmittance and absorption. Geophys. Res. Lett. 39:L24501. doi: 10.1029/2012GL053738
Nicolaus, M., Petrich, C., Hudson, S. R., and Granskog, M. A. (2013). Variability of light transmission through Arctic land-fast sea ice during spring. Cryosphere 6, 4363–4385. doi: 10.5194/tcd-6-4363-2012
Norgren, P., and Skjetne, R. (2014). Using autonomous underwater vehicles as sensor platforms for ice-monitoring. Model. Ident. Control 35, 263–277. doi: 10.4173/mic.2014.4.4
Perovich, D. K. (1990). Theoretical estimates of light reflection and transmission by spatially complex and temporally varying sea ice covers. J. Geophys. Res. 95, 9557–9567. doi: 10.1029/JC095iC06p09557
Quillfeldt, C. V., Hegseth, E. N., Sakshaug, E., Johnsen, G., and Syvertsen, E. E. (2009). “Ice algae,” in Ecosystem Barents Sea, eds G. J. E. Sakshaug and K. M. Kovacs (Trondheim: Tapir Aacademic Press), 285–302.
Schulz, J., Barz, K., Ayon, P., Lüdtke, A., Zielinski, O., Mengedoht, D., et al. (2010). Imaging of plankton specimens with the lightframe on-sight keyspecies investigation (LOKI) system. J. Eur. Opt. Soc. 5:10017. doi: 10.2971/jeos.2010.10017s
Solomon, S. (2007). Climate Change 2007: The Physical Science Basis: Contribution of Working Group I to the Fourth Assessment Report of the Intergovernmental Panel on Climate Change. Cambridge University Press.
Stammerjohn, S. E., and Smith, R. C. (1997). Opposing southern ocean climate patterns as revealed by trends in regional sea ice coverage. Clim. Change 37, 617–639. doi: 10.1023/A:1005331731034
Stroeve, J. C., Serreze, M. C., Holland, M. M., Kay, J. E., Malanik, J., and Barrett, A. P. (2012). The Arctic's rapidly shrinking sea ice cover: a research synthesis. Clim. Change 110, 1005–1027. doi: 10.1007/s10584-011-0101-1
Wadhams, P., Wilkinson, J. P., and McPhail, S. D. (2006). A new view of the underside of Arctic sea ice. Geophys. Res. Lett. 33:L04501. doi: 10.1029/2005GL025131
Keywords: remotely operated vehicle, polar operations, multi-sensor, pack ice, multi beam sonar, radiometer, ROV
Citation: Katlein C, Schiller M, Belter HJ, Coppolaro V, Wenslandt D and Nicolaus M (2017) A New Remotely Operated Sensor Platform for Interdisciplinary Observations under Sea Ice. Front. Mar. Sci. 4:281. doi: 10.3389/fmars.2017.00281
Received: 17 May 2017; Accepted: 18 August 2017;
Published: 04 September 2017.
Edited by:
Lars Boehme, University of St. Andrews, United KingdomCopyright © 2017 Katlein, Schiller, Belter, Coppolaro, Wenslandt and Nicolaus. This is an open-access article distributed under the terms of the Creative Commons Attribution License (CC BY). The use, distribution or reproduction in other forums is permitted, provided the original author(s) or licensor are credited and that the original publication in this journal is cited, in accordance with accepted academic practice. No use, distribution or reproduction is permitted which does not comply with these terms.
*Correspondence: Christian Katlein, Christian.Katlein@awi.de