Organisms Composing an Experimental Coral Reef Community from Mo'orea, French Polynesia, Exhibit Taxon-Specific Net Production: Net Calcification Ratios
 Coulson A. Lantz
 Robert C. Carpenter2
  Steeve Comeau
 Peter J. Edmunds
- 1School of Environment, Science, and Engineering, Southern Cross University, Lismore, NSW, Australia
- 2Department of Biology, California State University, Northridge, CA, United States
- 3School of Earth Sciences, Ocean Institute, ARC Centre of Excellence for Coral Reef Studies, The University of Western Australia, Cawley, WA, Australia
Current research on coral reefs seeks to link the responses to anthropogenic stressors (such as global warming and ocean acidification [OA]) among differing functional levels of biological organization. While experimental studies have identified ex situ taxon-specific responses to OA and global warming, isolating and connecting these effects in situ at the community-level has proved difficult. The difficulties arise from the large number of naturally varying parameters affecting corals reefs, such as light intensity and seawater residence time that affect net community production and calcification. To control variation in seawater residence time and allow light intensity to vary naturally, experimental outer reef (17-m depth) benthic communities composed of calcified algae, corals, and reef pavement were constructed in large outdoor flumes in Mo'orea, French Polynesia. Net community production (P), net community calcification (G), the ratio of P/G (P/Gratio), and slope of P regressed on G (P/Gslope) were calculated for the communities, and concurrently for the constituent members under the same temperature, light, and flow conditions. P and G, for both the communities and constituent members, were correlated positively with light intensity, whereas P/Gratio and P/Gslope were unaffected by light intensity. P/Gratios and P/Gslopes exhibited values that were specific to each community member. These results suggest that the P/Gratio and P/Gslope may be unaffected by natural variability in light intensity and could serve as useful metrics to relate responses at the taxon and community level, which is an important step in assessing the effects of environmental changes on coral reefs.
Introduction
The excess dissolution of anthropogenic CO2 emissions into the global surface oceans, described as Ocean Acidification (OA), is decreasing surface seawater pH at 0.0017 units y−1 (Clarke et al., 2014), and threatens to impair physiological processes (e.g., calcification) of marine organisms (Gattuso et al., 2015). Anthropogenic CO2 is also warming the planet, a process referred to as global warming, which is predicted to increase sea surface temperature (SST) 1.2–3.2°C by the end of the century (Clarke et al., 2014) and may also decrease calcification in marine organisms (Hoegh-Guldberg et al., 2007). Many studies examining the effects of OA and temperature have focused on coral reefs, as this ecosystem represents the largest concentration of calcifying marine organisms on the planet (Hoegh-Guldberg et al., 2007).
The majority of OA studies have been performed ex situ at the cellular (e.g., Cohen and Holcomb, 2009; Venn et al., 2013), organismal (e.g., Ries et al., 2009; Erez et al., 2011), and community scales (e.g., Andersson et al., 2009; Comeau et al., 2015), and have manipulated seawater pCO2 or pH to simulate future ocean conditions and measured rates of net production (P) and net calcification (G) as response variables. On average, the response of taxon-specific G to OA predict that G in tropical marine calcifiers will decrease 14–30% by 2100 (Chan and Connolly, 2013; Kroeker et al., 2013), while P has been mostly predicted to be unaffected (Schneider and Erez, 2006; Kroeker et al., 2013; Comeau et al., 2015). Likewise, seawater warming studies performed ex situ at the organismal scale (e.g., Reynaud et al., 2003; Comeau et al., 2016a) show that G and P in tropical marine calcifiers is enhanced until a threshold temperature (~28°C in many organisms, but highly site specific; Pratchett et al., 2015) and then dramatically decreases thereafter due, in part, to bleaching or mortality (Hughes et al., 2017). Considering that many tropical reefs currently experience temperatures >28°C during the summer (Atkinson, 2011), there are concerns that even the minimum warming-driven increase in SST of 1.2°C will decrease G and P in tropical marine calcifiers by the end of this century (Hughes et al., 2017).
In contrast, there is little empirical research testing the effects of OA and global warming on P and G of a coral reef in situ at the community scale. In part, this reflects the difficulties of quantifying and predicting the response of coral reef communities to OA and warming given the logistical challenges of manipulating seawater pCO2 or temperature over entire coral reefs (but see Albright et al., 2016). Experimental analyses of the effect of OA and warming on coral reef communities therefore are rare, and generally require taxon-specific results to predict changes in situ at the community level. In theory, the predicted 14–30% decrease in G attributed to OA at ~800–1,000 μatm pCO2 (as predicted by 2100; Chan and Connolly, 2013) or decline in P and G as SST rises 1.2–3.2°C (Clarke et al., 2014; Comeau et al., 2016a) should be measureable in situ on a coral reef given the resolution and precision of contemporary methodologies.
However, these predicted century-scale changes in P and G due to OA and global warming are small when compared to natural diel variability in P and G, which amounts to 200–300% within a day, due mainly to variation in light intensity (PAR), which modulates P and G (Falter et al., 2008). Diurnal variability in PAR drives diurnal changes in P and G that is three-to-four times greater than the predicted decline in P and G over the next century (Hofmann et al., 2011), and is thought to obscure any OA- or warming-mediated changes in coral reef community P and G that already have occurred (Atkinson, 2011). As absolute P and G are dependent on PAR, they are not well-suited to providing benchmark values against which the effects of environmental change on the same processes can be measured.
To address the effects of environmental variability on community metabolism, P and G can also be expressed as a ratio (P/G) that characterizes the relative rates of organic and inorganic metabolism. In the literature, this relationship can be based on the ratio of a single measurement of P and G (P/Gratio), or a linear regression of P on G, when multiple measures of each response variable are available (P/Gslope). The P/Gratio is useful in tests of the association between singular measurements of the P-G quotient and contemporaneous environmental conditions (e.g., light; Lantz et al., 2014), whereas the P/Gslope is valuable in examining relationships between P and G over the entire day where multiple measurements of P and G are available (Page et al., 2016). While the experimental and statistical approaches to calculating these two relationships between P and G slightly differs, both approaches express net primary production (P) as a function of inorganic carbon flux attributed to calcification and dissolution (G) (Suzuki and Kawahata, 2003). Although the physiological mechanisms linking P and G argue for a stronger connection for P driving G (rather than the other way around; Barnes and Chalker, 1990), and it would, therefore, be more appropriate to consider G as a function of P (G/P), the majority of the literature expresses this relationship as P/G (see Shaw et al., 2015). Consequently, we express the relationship as P/G for comparative purposes.
The P/G relationship is useful in establishing a benchmark against which change in community function can be measured, because, unlike individual measures of P or G, the relationship between the two potentially is unaffected by daily variability in PAR (Watanabe et al., 2006). Daily changes in PAR may amplify or depress community P, but because the majority of coral reef community G is a product of photosynthetic calcifiers (Atkinson and Cuet, 2008), P and G generally are tightly-coupled so that the ratio of P/G is relatively constant over diurnal timescales (Lantz et al., 2014). Therefore, it has been hypothesized that changes in community P/G over time reflect variation in biotic parameters, such as community composition (e.g., percent cover of calcifying organisms; Andersson and Gledhill, 2013; Page et al., 2016).
The hypothesis that community composition influences P/G on coral reefs relies on the assumption that each taxon within the community (e.g., corals and algae) exhibits a characteristic P/G relationship that contributes to the overall community P/G. A review of literature found that an average coral reef community exhibited a P/Gslope of 4.1 when coral cover was ~20% (Shaw et al., 2015), and suggested that a benthic coral reef community with a relatively high percent cover of calcifiers (e.g., corals and calcifying algae >20%), is associated with high rates of G (>5 mmol CaCO3 m−2 h−1) relative to mean P (~ 20 mmol C m−2 h−1). In this case, the community may exhibit a P/Gslope approaching ~2 (e.g., Albright et al., 2013). In contrast, a community with a relatively low cover of calcifiers (< 20%) is predicted to have low rates of G (< 5 mmol CaCO3 m−2 h−1) relative to mean P (~20 mmol C m−2 h−1), and a P/Gslope of ~ 6 (e.g., Lantz et al., 2014; Figure 1). However, before P/G relationships can be used to make accurate predictions of benthic community function on tropical coral reefs, further work is needed to evaluate if constituent organisms within a coral reef community exhibit taxon-specific P/G relationships.
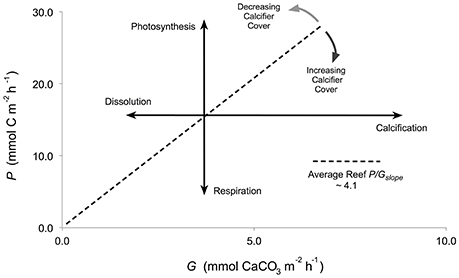
Figure 1. Conceptual diagram representing reef net production (mmol C m−2 h−1) as a function of net calcification (mmol CaCO3 m−2 h−1) with an average P/Gslope of 4.1 (Shaw et al., 2015). Bold arrows represent the slope for the individual processes of photosynthesis, respiration, calcification, and dissolution. Light gray arrows represent the theoretical shift to a P/Gratio >4.1 for a reef with >20% cover of calcifiers. Dark gray arrows represent a shift to a P/Gratio <4.1 for a reef with <20% cover of calcifiers.
Quantifying P/Gratio or P/Gslope for a benthic community and its constituent members requires measurements in an experimental environment where the benthic communities are replicated and controlled over time. Where this can be accomplished, community-member P/Gratio and P/Gslope can be calculated at a resolution lower than functional groups (i.e., corals, calcified algae), and potentially by species. To examine how P/Gratio is affected by naturally varying light intensity, and how P/Gslope differs among the taxa composing a shallow coral reef community, the present study measured the metabolism of coral reef communities assembled in replicate experimental flumes using a controlled community composition. P and G were measured in two experimental coral reef communities, and concurrently for each of the constituent taxa of these same communities. Measurements were made during repeated 3-h incubations (09:00–12:00 h) over 3-weeks in Mo'orea, French Polynesia. Daily measured community- and taxa-level P was divided by G to derive P/Gratio, and all measurements of community- and taxa-level P were regressed linearly against G to obtain P/Gslope.
Materials and Methods
Experimental Design
This experiment was carried out from September 1 to October 11, 2014, in Mo'orea, French Polynesia, at the Richard B. Gump South Pacific Research Station. Coral reef communities were assembled in two replicate flumes (hereafter, Communities 1 and 2), and their composition was adjusted to match the average planar cover measured on the fore reef of Mo'orea at 17-m depth in 2006 (Edmunds, 2015). The scleractinian components of the communities were the spatially dominant corals Pocillopora verrucosa (11% cover), massive Porites spp. (P. lobata and P. lutea) (8%), and Acropora retusa (8%) (Comeau et al., 2016b). In addition, 5% of the floor of the flumes was covered by the crustose coralline algae (CCA) Porolithon onkodes, which approximated the cover of this functional group on the fore reef in 2006. Pieces of P. onkodes, consisting of ~ 8 × 8 cm sections (~ 3 cm thick), were chiseled from the reef at 17-m depth and placed in the flumes. To recreate the benthic inorganic substratum, 55% of the floor of the flume was covered by reef pavement. Pieces of reef pavement (~20 × 20 cm) consisted of dead coral skeleton fragments naturally covered in turf algae.
The two flumes were located outdoors and each consisted of a working section of 5.0 × 0.3 × 0.3 m, through which seawater was re-circulated using pumps (W. Lim Wave II 31800 L h−1) to obtain a mean flow speed of 8 cm s−1, which is similar to the average flow speed on the fore reef of Mo'orea at 17-m depth (Washburn and Brooks, 2014). Seawater in the flumes was refreshed continuously at 5 L min−1 with seawater pumped from Cook's Bay at 12-m depth, and filtered through sand (0.45–0.55 mm nominal pore size). Clear UV-transparent acrylic covers were placed on top of the flumes to keep out rain, and blue acetate filters (Lee Filters #183 Moonlight Blue) were placed on the covers to filter ambient sunlight to simulate the photon flux density of photosynthetically active radiation (PAR, ~500–1,200 mmol photons m−2 cm−1; measured with a 2π quantum sensor LI-189 and a LiCor LI-1400 meter) and the spectral composition of light at 17-m depth (CA Lantz unpublished data). Temperature in the flumes was maintained at ~27.0°C, which was the ambient seawater temperature on the fore reef at the time of the study. Light was measured at 30-min intervals with a PAR logger (2π Odyssey PAR sensor) in each flume. An average PAR value was calculated for each incubation based on the six PAR measurements taken over the 3-h incubation period.
Community metabolism (P and G arising from all community members) in each flume was measured from changes in seawater chemistry as determined during replicate 3-h incubations between 9:00 and 12:00 h on 14 days between 1 September and 11 October. With two separate flumes operated in a closed circuit for 3-h sampling periods on 14 days, this created 14 replicated measurements for each flume. To compare the response of P and G to variation in PAR for the community and the constituent taxa, the metabolism of each of the species comprising the community was measured separately for five benthic groups (P. verrucosa, Porites spp. A. retusa, P. onkodes, and pavement) using four chambers placed within each flume that were operated simultaneously. The four chambers consisted of a 2-L clear acrylic cylinder enclosed on the bottom and fitted with an individual Atman 340 L h−1 powerhead to create turbulent conditions (Figure 2). The top of each chamber (height 30-cm) remained open and above the flume water level to prevent water exchange in order to separate the chemical changes in seawater, but maintain identical temperature and PAR conditions between the chambers and flume. Trials were completed in triplicate for each community member (to provide n = 12 for each community member), and community members were randomly selected for each incubation.
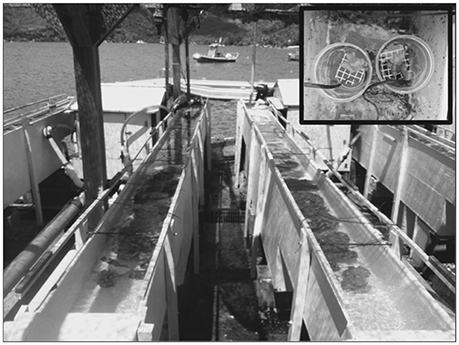
Figure 2. Picture of flumes with experimental coral reef communities 1 and 2 in place. Covers with blue filters are not in place so as to show coral reef community within the flume. Inset shows 2-L chamber, containing a Pocillopora verrucosa colony and a small pump for seawater circulation, which were placed within the flumes at the time of incubation.
Seawater Measurements
Seawater samples were taken from each flume and chamber at the beginning and end of each 3-h incubation (09:00–12:00 h) and analyzed for temperature, salinity, total alkalinity (TA), and pH. Temperature was measured using a ThermoFisher Scientific Traceable Thermometer (± 0.01°C) and salinity was measured using a conductivity meter (YSI 3100). Measurements of TA were made within 24 h of collection of seawater samples using open-cell potentiometric titrations (Dickson et al., 2007) on a Mettler Toledo T-50 titrator fitted with a DG115 pH electrode, and analyses were completed in duplicate using ~50 g seawater samples. Measurements of pH were performed using a spectrophotometric procedure with m-cresol dye, and calculated on the Total Scale (pHT). Titrations of certified reference materials (batch #140 from A. G. Dickson, Scripps Institute of Oceanography) yielded TA values ≤2.9 mmol kg−1 of the certified value (SE = 2.8 mmol kg−1; n = 12). Weekly analyses of the pH of prepared Tris buffers (pHT = 8.096 at 25oC) yielded an average difference of 0.009 pH units (SE = 0.004 pHT units; n = 12). Values for dissolved inorganic carbon (DIC) were calculated from the measured TA, pHT, salinity, and temperature using the R package seacarb (Lavigne and Gattuso, 2010).
Net Production and Net Calcification Measurements
Net production (P, mmol C m−2 h−1) and net calcification (G, mmol CaCO3 m−2 h−1), were calculated from changes in DIC (ΔDIC) and TA (ΔTA) using equations from Gattuso et al. (1996):
where (ρ) is the density of seawater (kg m−3) at the time seawater samples were collected, calculated from temperature and salinity, (v) is the volume (L) of the flumes and incubation chambers, (a) is the projected area (m2) of the community and community members, and (t) is time (hours) of the incubation. The ratio of P/G (mmol C mmol ), for both the community and each individual community member, was calculated by dividing each day's measured P by the contemporaneously measured G (P/Gratio). The slope of P regressed on G (mmol C mmol ), for both the community and each individual community member, was calculated from a best fit type II sum of squares residual model, in which all measures of P over the course of the study were regressed on G for the respective community (P/Gslope), or individual community members.
Statistical Analyses
Statistical analyses were performed with SPSS software (SPSS Inc. Version 22.0, (SPSS Inc. IBM Corp., 2013)) running in a Windows environment, and the assumptions of normality and equality of variance were evaluated with graphical analyses of the residuals. An analysis of covariance (ANCOVA) was used to test the hypothesis that the relationships between P (dependent variable) and G (independent variable) differed among the flume community and community members. If P/Gslopes did not differ and, assuming that the null hypothesis of no differences was not rejected (for either slope or elevation), the results were pooled for the community (n = 28), and each community member (n = 12), and a new regression of P on G prepared, from which the slope of P/G was determined. To test for differences in the measured P/Gratio between each flume community and each community member, an analysis of variance (ANOVA) was conducted where each community and community member were a fixed factor. A Bonferroni post-hoc test was used to compare the measured P/Gratio among community members.
As the replicate 3-h incubations between 09:00 and 12:00 h (described above) took place on different days between 1 September 2014 and 11 October 2014, each day was characterized by different natural light regimes caused by variation in cloud cover and rain showers. The variation in PAR provided the opportunity to explore the relationship between the measured P/Gratio and average PAR from each incubation period. A Pearson correlation was used to test the hypothesis that the P/Gratio for each day was dependent on ambient PAR (averaged over the 3-h incubation period), and analyses were completed for each community and for the component community members.
Results
Relationship between P and G in the Community and Community Members
Rates of metabolism are reported as the mean ± SE, pooled among replicates. Community P was not significantly different between flumes [F(1, 26) = 1.92, p = 0.311] and, when pooled between flumes (n = 28 per community), was 11.9 ± 1.2 mmol C m−2 h−1. Constituent members in the flume communities (n = xx), when incubated separately, exhibited a P of 7.8 ± 6.7 mmol C m−2 h−1 (pooled among all taxa), which was highest for P. verrucosa (15.4 ± 1.1 mmol C m−2 h−1), and lowest for P. onkodes (2.9 ± 0.1 mmol C m−2 h−1; Table 1). Community G was not significantly different between flumes [F(1, 26) = 1.56, p = 0.297] and, when pooled between flumes (n = 28 per community), was 3.6 ± 0.3 mmol CaCO3 m−2 h−1. Constituent members in the flume communities exhibited a G of 3.2 ± 2.7 mmol CaCO3 m−2 h−1 (pooled among taxa), which was highest for P. verrucosa (6.9 ± 0.5 mmol CaCO3 m−2 h−1), and lowest for P. onkodes (0.7 ± 0.1 mmol CaCO3 m−2 h−1).
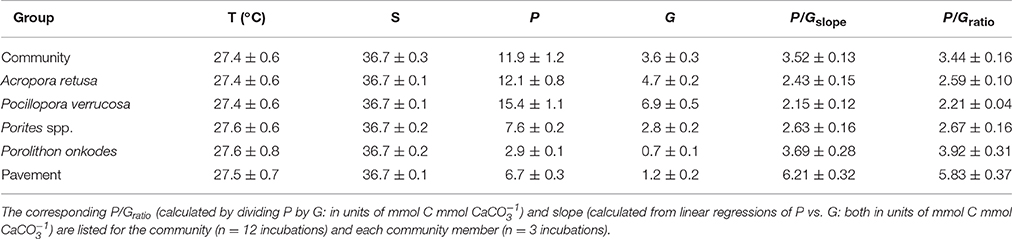
Table 1. Seawater temperature [T (°C)], salinity (S), net production (P), and net calcification (G) for the experimental communities and their constituent members; values are mean ± SE.
Community P/Gslopes were not significantly different between flumes [F(1, 26) = 1.21, p = 0.282] and when pooled between flumes (n = 28 per community), yielded a slope of 3.52 ± 0.13 mmol C mmol (Figure 3). Community P/Gratios did not vary between flumes [F(1, 26) = 1.057, p = 0.313] and, when pooled between flumes, was 3.44 ± 0.16 mmol C mmol (Table 1). Community-member P/Gslopes were significantly different from one another [F(4, 54) = 19.21, p < 0.001] and, for each community member (n = 12), slopes were maximal for the inorganic CaCO3 pavement (6.21 ± 0.32 mmol C mmol ), and minimal for P. verrucosa (2.15 ± 0.12 mmol C mmol ; Figure 4). Community-member P/Gratios differed among community members [F(4, 54) = 22.57, p < 0.001], and for each community member, were maximal for the inorganic CaCO3 pavement (5.83 ± 0.37 mmol C mmol ) and minimal for P. verrucosa (2.21 ± 0.04 mmol C mmol ). Post-hoc analyses showed that P/Gratios differed between community members (p < 0.001) except between A. retusa and Porites spp. (p > 0.05).

Figure 3. Net production (mmol C m−2 h−1) of reef communities as a function of net calcification (mmol CaCO3 m−2 h−1) in Community 1 (black) and Community 2 (gray). Slope and R2 values are shown for each community.
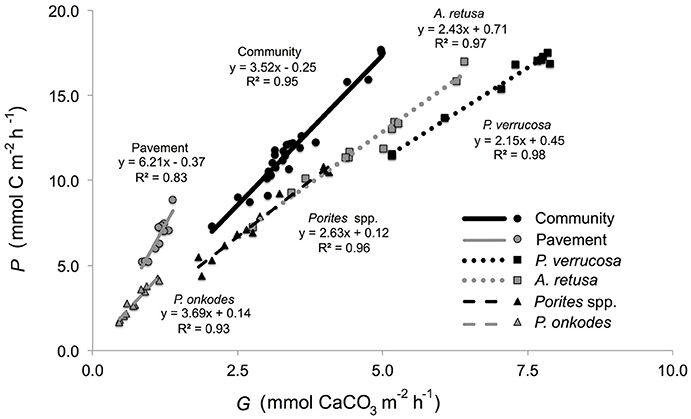
Figure 4. Net production (mmol C m−2 h−1) of reef communities as a function of net calcification (mmol CaCO3 m−2 h−1) for the community, P. verrucosa, A. retusa, Porites spp., P. onkodes, and pavement. Slope and r2-values shown for each respective community member and the community.
Relationship between Par and P/G
Over all days that metabolism was measured, PAR varied from 452 to 1,237 mmol photons m−2 s−1 during the 3-h incubation period, with a mean PAR of 996 ± 238 mmol photons m−2 s−1 (n = 14). Over each incubation, P and G were positively and significantly correlated with PAR in community 1 (P1: r = 0.86, df = 27, p = 0.01; G1: r = 0.76, df = 27, p = 0.03) and community 2 (P2: r = 0.78, df = 27, p = 0.032; G2: r = 0.73, df = 27 p = 0.04). At the community member-level, P and G for A. retusa, P. verrucosa, and Porites spp. were significantly and positively correlated (p < 0.05) with PAR over each incubation period, but PAR was not significantly correlated (p > 0.05) with P and G for P. onkodes or pavement. PAR from each incubation period was not significantly correlated with any of the P/G values either at the community level or for each individual community member (p > 0.05).
Discussion
Comparing P and G for the communities and constituent taxa in this study revealed consistent values for P/Gratio and P/Gslope across time (3 h) for reef communities and their community members, and a significant difference in P/Gratio among community members. Correlations between the P/Gratio and PAR revealed that P and G were positively correlated with PAR, which has been shown in most previous studies of these relationships (Chalker and Taylor, 1978; Barnes and Chalker, 1990; Gattuso et al., 1993). However, PAR and P/Gratio were unrelated. These results are similar to previous measurements of the community metabolism of coral reefs (e.g., Lantz et al., 2014; Shaw et al., 2015), and together they support two conclusions.
First, the lack of a significant relationship between average PAR intensity and P/Gratio supports the notion that the P/Gratio can provide an effective benchmark for the functional performance of coral reefs that normalizes the influence of variable PAR on P and G. Studies measuring coral reef community P and G in situ usually go to great lengths to quantify the influence of the abiotic parameters on these factors, and typically consider reef water residence time, wind speed, and average reef water depth. The commonly used Lagrangian and Eulerian methodologies (Gattuso et al., 1996; Falter et al., 2008) for measuring community P and G depend on the quantification of these abiotic parameters, so that P and G can be normalized for residence time of reef waters in order to support comparisons among varying time periods, or among different reefs. Once measurements are normalized for residence time, previous studies of shallow coral reefs have shown a strong coupling between PAR and P, and between PAR and G on 12-h diurnal timescales (Falter et al., 2012), which supports the notion that P/Gratio does not change in response to differences in PAR. An increase in PAR will enhance P and G, but because these two metabolic processes are tightly coupled on timescales of hours to days, P/G remains relatively constant when integrated over a day (Suzuki and Kawahata, 2003). This finding is supported by the present study given that the P/Gratio and P/Gslope for the communities and community members, remained nearly the same among days, even though mean daily P and G differed these among days. These results indicate that P/G relationships can be a reflection of the coupled daily balance between P and G, and do not change among days due to variation in average PAR.
The second conclusion from these data is that each community member exhibited a characteristic P/Gslope and P/Gratio that remained statistically indistinguishable within each member over the study. This result suggests that the P/Gslope and P/Gratio is a community- and taxon-specific value, which characterizes the balance in P and G specific to that community or organism, respectively. It is premature to conclude that the P/G relationship provides a general application to scaling between organisms and community-level process for coral reefs in situ, given the multitude of other parameters, such as body size, temperature, and stoichiometry, which also can affect intraspecific differences in metabolism (Brown et al., 2004; Edmunds et al., 2016). It must also be noted that the P/Gratio is dependent on community P and, therefore, it should be affected by changes in the cover of non-calcifying autotrophic organisms (e.g., macroalgae). Similarly, while the P/G relationship reflects the balance between organic and inorganic carbon fixation, if both processes are changing proportionately to another environmental driver (natural or anthropogenic), then the P/G relationship may be insensitive to these changes.
These two conclusions suggest that changes in the in situ P/G relationship for a coral reef over time (e.g., months to years) may be a function of the relative cover of constituent community members, and reflects the balance between the P and G of a coral reef regardless of daily changes in light intensity. Given these results, the use of the P/Gratio or P/Gslope could serve as a baseline ratio of carbon production for a coral reef, against which changes on disturbed reefs can be evaluated. This hypothesis is supported by the relationship between the mean P/Gslope and benthic cover of calcifiers in previous studies of coral reefs. An examination of studies that have measured the P/Gslope and recorded the percent benthic cover of coral or calcifying taxa shows that P/Gslope values are higher on reefs with a lower percent cover of calcifying taxa (Figure 5). A linear regression of the P/Gslope against percent cover of benthic calcifiers is statistically significant with a negative slope (y = −0.18x + 8.62, r2 = 0.94, p < 0.05; Figure 5). According to this relationship, the P/Gslope value decreases by ~1 unit for each 5.1 ± 0.6% increase in cover of benthic calcifiers. The relationship between percent cover of calcifying taxa and the P/Gslope suggests that future work need measure these two parameters in unison in order to create the opportunity to further test the hypothesis that the P/G relationship can serve as a baseline ratio of carbon production for coral reefs.
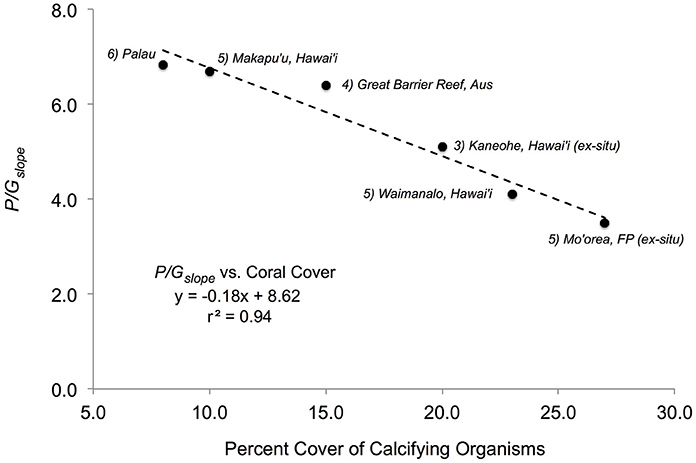
Figure 5. P/Gslope values from different studies (which have measured net P and net G together with percent coral cover on natural reef flat communities) as a function of percent cover of calcifying organisms for each study. (1) Present study with a P/Gslope = 3.52 and 27% coral cover; (2) a natural reef community in Waimanalo (Oahu), Hawai'i, with a P/Gslope = 4.1 and 23% coral cover (Lantz et al., 2014); (3) an experimental reef community in Oahu, Hawai'i, with P/Gslope = 5.10 and 20% coral cover (Andersson et al., 2009); (4) a natural reef community on the Great Barrier Reef with a P/Gslope = 6.4 and 15% coral cover (Suzuki and Kawahata, 2003); (5) a natural reef community at Makapu'u (Oahu), Hawai'i, with a P/Gslope = 6.7 and 10% coral cover (Lantz et al., 2014), and (6) a natural reef community in Palau with a P/Gslope = 6.83 and 8% coral cover (Watanabe et al., 2006). Slope and r2-value shown for the overall linear relationship.
While the present study focused on the relationship between the P/Gratio and PAR, we suggest that future work employ experimental designs that can distinguish the effects of other abiotic factors on the P/G relationship. These abiotic factors could include water flow (e.g., Comeau et al., 2014), temperature (e.g., Reynaud et al., 2003), or CO2 (e.g., Schneider and Erez, 2006). For example, water flow usually is correlated positively with both P (Nakamura et al., 2003; Finelli et al., 2006) and G (Dennison and Barnes, 1988; Comeau et al., 2014) at the organism level for tropical marine calcifiers due to the enhanced flux of metabolites between the organisms and the surrounding seawater (Mass et al., 2010). However, the relationship between water flow and the ratio of P to G is unknown (i.e., if P and G change at the same rate in response to water flow). Likewise, it is unknown if a warming-driven decrease in G at temperatures >~28°C (Pratchett et al., 2015) will occur at the same rate. In some cases, seawater warming has actually increased rates of scleractinian calcification (e.g., McCulloch et al., 2012) and macro-algal photosynthesis (e.g., Zou and Gao, 2013). Additionally, the overall response in G to temperature has varied both intra- (e.g., Comeau et al., 2016a) and inter-specifically (Shaw et al., 2016). A large number of OA studies have shown that an increase in pCO2 will decrease G but not P (Kroeker et al., 2013; Comeau et al., 2017), although some studies suggest P may increase in response to a CO2-fertilization effect (Ries et al., 2009; Kroeker et al., 2010).
Therefore, it is difficult to predict how global climate change will modify the P/G relationships for coral reef communities given the potential for interspecific variation in the response of community members to global warming and OA. As global climate change continues to threaten the existence of coral reefs, there is a growing need for techniques to scale up results from perturbation experiments at the organism level to the community level. Building upon the present results and further quantifying community, as well as community member, P/G relationships for multiple reefs and community members will contribute to meeting these needs.
Author Contributions
All authors listed have made a substantial, direct, and intellectual contribution to the work, and approved it for publication.
Funding
During the course of this study, CL was supported by a National Science Foundation grant (OCE 14-15268) to PE and RC, which funded the entirety of work conducted, including the collection of taxa, maintenance of aquaria systems, and post-experimental laboratory analyses. SC was supported by ARC (Discovery Early Career Researcher Award; DE160100668) during the writing of the manuscript.
Conflict of Interest Statement
The authors declare that the research was conducted in the absence of any commercial or financial relationships that could be construed as a potential conflict of interest.
Acknowledgments
This research was conducted at the Richard B. Gump South Pacific Research Station (UC Berkeley) in collaboration with the Mo'orea Coral Reef Long-Term Ecological Research (MCR LTER) program. We thank the MCR LTER for logistical support during boating and SCUBA diving field operations. This is contribution number xx of the CSUN Marine Biology Program.
References
Albright, R., Caldeira, L., Hosfelt, J., Kwiatkowski, L., MacLaren, J. K., Mason, B. M., et al. (2016). Reversal of ocean acidification enhances net coral reef calcification. Nature 531, 362–365. doi: 10.1038/nature17155
Albright, R., Langdon, C., and Anthony, K. R. N. (2013). Dynamics of seawater carbonate chemistry, production, and calcification of a coral reef flat, central great barrier reef. Biogeosci. Discuss. 10, 7641–7676. doi: 10.5194/bgd-10-7641-2013
Andersson, A. J., and Gledhill, D. (2013). Ocean Acidification and coral reefs: effects on breakdown, dissolution, and net ecosystem calcification. Ann. Rev. Mar. Sci. 5, 321–348. doi: 10.1146/annurev-marine-121211-172241
Andersson, A. J., Kuffner, I. B., MacKenzie, F. T., Jokiel, P. L., Rodgers, K. S., and Tan, A. (2009). Net loss of CaCO3 from a subtropical calcifying community due to seawater acidification: mesocosm-scale experimental evidence. Biogeosciences 6, 1811–1823. doi: 10.5194/bg-6-1811-2009
Atkinson, M. J. (2011). “Biogeochemistry of nutrients,” in Coral Reefs: An Ecosystem in Transition, eds Z. Dubinksy and N. Stambler (Dordrecht: Springer), 199–206.
Atkinson, M. J., and Cuet, P. (2008). Possible effects of ocean acidification on coral reef biogeochemistry: topics for research. Mar. Ecol. Prog. Ser. 373, 249–256. doi: 10.3354/meps07867
Barnes, D. J., and Chalker, B. E. (1990). Calcification and photosynthesis in reef-building corals and algae. Ecosyst. World Coral Reefs 25, 109–131.
Brown, J. H., Gillooly, J. F., Allen, A. P., Savage, V. M., and West, G. B. (2004). Toward a metabolic theory of ecology. Ecology 85, 1771–1789. doi: 10.1890/03-9000
Chalker, B. E., and Taylor, D. L. (1978). Rhythmic variations in calcification and photosynthesis associated with the coral Acropora cervicornis (Lamarck). Proc. R. Soc. B Biol. Sci. 201, 179–189. doi: 10.1098/rspb.1978.0039
Chan, N. C. S., and Connolly, S. R. (2013). Sensitivity of coral calcification to ocean acidification: a meta-analysis. Glob. Chang. Biol. 19, 282–290. doi: 10.1111/gcb.12011
Clarke, L., Sokka, L., Jiang, K., Akimoto, K., Babiker, M., Blanford, G., et al. (2014). “Assessing transformation pathways,” in Climate Change 2014: Mitigation of Climate Change. Contribution of Working Group III to the Fifth Assessment Report of the Intergovernmental Panel on Climate Change, eds O. Edenhofer, R. Pichs-Madruga, Y. Sokona, E. Farahani, S. Kadner, K. Seyboth, A. Adler,. I. Baum, S. Brunner, P. Eickemeier, B. Kriemann, J. Savolainen, S. Schlömer, C. von Stechow, T. Zwickel, and J. C. Minx (Cambridge; New York, NY: Cambridge University Press), 424–428.
Cohen, A. L., and Holcomb, M. (2009). Why corals care about ocean acidification Uncovering the mechanism. Oceanography 22, 118–127. doi: 10.5670/oceanog.2009.102
Comeau, S., Carpenter, R. C., Lantz, C. A., and Edmunds, P. J. (2015). Ocean acidification accelerates dissolution of experimental coral reef communities. Biogeosciences 12, 365–372. doi: 10.5194/bg-12-365-2015
Comeau, S., Carpenter, R. C., Lantz, C. A., and Edmunds, P. J. (2016a). Parameterization of the response of calcification to temperature and pCO2 in the coral Acropora pulchra and the alga Lithophyllum kotschyanum. Coral Reefs 35, 929–939. doi: 10.1007/s00338-016-1425-0
Comeau, S., Edmunds, P. J., Lantz, C. A., and Carpenter, R. C. (2014). Water flow modulates the response of coral reef communities to ocean acidification. Sci. Rep. 4:6681. doi: 10.1038/srep06681
Comeau, S., Edmunds, P. J., Lantz, C. A., and Carpenter, R. C. (2017). Daily variation in net primary production and net calcification in coral reef communities exposed to elevated pCO2. Biogeosciences 14, 3549–3560. doi: 10.5194/bg-14-3549-2017
Comeau, S., Lantz, C. A., Edmunds, P. J., and Carpenter, R. C. (2016b). Framework of barrier reefs threatened by ocean acidification. Glob. Chang. Biol. 22, 1225–1234. doi: 10.1111/gcb.13023
Dennison, W. C., and Barnes, D. J. (1988). Effect of water motion on coral photosynthesis and calcification. J. Exp. Mar. Bio. Ecol. 115, 67–77. doi: 10.1016/0022-0981(88)90190-6
Dickson, A. G., Sabine, C. L., and Christian, J. R. (2007). Guide to Best Practices for Ocean CO2 Measurements. San Diego, CA: North Pacific Marine Science Organization.
Edmunds, P. J. (2015). MCR LTER: Coral Reef: Long-term Population and Community Dynamics: Corals, Ongoing since 2005. knb-lter-mcr.4.33. doi: 10.6073/pasta/1f05f1f52a2759dc096da9c24e88b1e8
Edmunds, P. J., Comeau, S., Lantz, C. A., Andersson, A., Briggs, C., Cohen, A., et al. (2016). Integrating the effects of ocean acidification across functional scales on tropical coral reefs. Bioscience 66, 350–362. doi: 10.1093/biosci/biw023
Erez, J., Reynaud, S., Silverman, J., Schneider, K., and Allemand, D. (2011). “Coral calcification under ocean acidification and global change,” in Coral Reefs: An Ecosystem in Transition, eds Z. Dubinksy and N. Stambler (Dordrecht: Springer), 151–176.
Falter, J. L., Lowe, R. J., Atkinson, M. J., and Cuet, P. (2012). Seasonal coupling and de-coupling of net calcification rates from coral reef metabolism and carbonate chemistry at Ningaloo Reef, Western Australia. J. Geophys. Res. Ocean 117:C05003. doi: 10.1029/2011JC007268
Falter, J. L., Lowe, R. J., Atkinson, M. J., Monismith, S. G., and Schar, D. W. (2008). Continuous measurements of net production over a shallow reef community using a modified Eulerian approach. J. Geophys. Res. Ocean 113:C07035. doi: 10.1029/2007JC004663
Finelli, C. M., Helmuth, B. S. T., Pentcheff, N. D., and Wethey, D. S. (2006). Water flow influences oxygen transport and photosynthetic efficiency in corals. Coral Reefs 25, 47–57. doi: 10.1007/s00338-005-0055-8
Gattuso, J.-P., Magnan, A., Billé, R., Cheung, W. W. L., Howes, E. L., Joos, F., et al. (2015). OCEANOGRAPHY. Contrasting futures for ocean and society from different anthropogenic CO2 emissions scenarios. Science 349:aac4722. doi: 10.1126/science.aac4722
Gattuso, J. P., Pichon, M., Delesalle, B., Canon, C., and Frankignoulle, M. (1996). Carbon fluxes in coral reefs. I. Lagrangian measurement of community metabolism and resulting air-sea CO2 disequilibrium. Mar. Ecol. Prog. Ser. 145, 109–121. doi: 10.3354/meps145109
Gattuso, J. P., Pichon, M., Delesalle, B., and Frankignoulle, M. (1993). Community metabolism and air-sea CO2 fluxes in a coral reef ecosystem. Mar. Ecol. Prog. Ser. 96, 259–267. doi: 10.3354/meps096259
Hoegh-Guldberg, O., Mumby, P. J., Hooten, A. J., Steneck, R. S., Greenfield, P., Gomez, E., et al. (2007). Coral reefs under rapid climate change and ocean acidification. Science 318, 1737–1742. doi: 10.1126/science.1152509
Hofmann, G. E., Smith, J. E., Johnson, K. S., Send, U., Levin, L. A., Micheli, F., et al. (2011). High-frequency dynamics of ocean pH: a multi-ecosystem comparison. PLoS ONE 6:e28983. doi: 10.1371/journal.pone.0028983
Hughes, T. P., Kerry, J. T., Álvarez-Noriega, M., Álvarez-Romero, J. G., Anderson, K. D., Baird, A. H., et al. (2017). Global warming and recurrent mass bleaching of corals. Nature 543, 373–377. doi: 10.1038/nature21707
Kroeker, K. J., Kordas, R. L., Crim, R., Hendriks, I. E., Ramajo, L., Singh, G. S., et al. (2013). Impacts of ocean acidification on marine organisms: quantifying sensitivities and interaction with warming. Glob. Chang. Biol. 19, 1884–1896. doi: 10.1111/gcb.12179
Kroeker, K. J., Kordas, R. L., Crim, R. N., and Singh, G. G. (2010). Meta-analysis reveals negative yet variable effects of ocean acidification on marine organisms. Ecol. Lett. 13, 1419–1434. doi: 10.1111/j.1461-0248.2010.01518.x
Lantz, C. A., Atkinson, M. J., Winn, C. W., and Kahng, S. E. (2014). Dissolved inorganic carbon and total alkalinity of a Hawai'ian fringing reef: Chemical techniques for monitoring the effects of ocean acidification on coral reefs. Coral Reefs 33, 105–115. doi: 10.1007/s00338-013-1082-5
Lavigne, H., and Gattuso, J. P. (2010). Seacarb: Seawater Carbonate Chemistry with R. R Package Version 2.3. 3.
Mass, T., Genin, A., Shavit, U., Grinstein, M., and Tchernov, D. (2010). Flow enhances photosynthesis in marine benthic autotrophs by increasing the efflux of oxygen from the organism to the water. Proc. Natl. Acad. Sci. U.S.A. 107, 2527–2531. doi: 10.1073/pnas.0912348107
McCulloch, M., Falter, J., Trotter, J., and Montagna, P. (2012). Coral resilience to ocean acidification and global warming through pH up-regulation. Nat. Clim. Chang. 2, 623–627. doi: 10.1038/nclimate1473
Nakamura, T., Yamasaki, H., and van Woesik, R. (2003). Water flow facilitates recovery from bleaching in the coral Stylophora pistillata. Mar. Ecol. Prog. Ser. 256, 287–291. doi: 10.3354/meps256287
Page, H. N., Andersson, A. J., Jokiel, P. L., Rodgers, K. S., Lebrato, M., Yeakel, K., et al. (2016). Differential modification of seawater carbonate chemistry by major coral reef benthic communities. Coral Reefs 35, 1–15. doi: 10.1007/s00338-016-1490-4
Pratchett, M. S., Anderson, K. D., Hoogenboom, M. O., Widman, E., Baird, A. H., Pandolfi, J. M., et al. (2015). Spatial, temporal, and taxonomic variation in coral growth - implications for the structure and function of coral reef ecosystems. Oceanogr. Mar. Biol. 53, 215–296. doi: 10.1201/b18733-7
Reynaud, S., Leclercq, N., Romaine-Lioud, S., Ferrier-Pagès, C., Jaubert, J., and Gattuso, J. P. (2003). Interacting effects of CO2 partial pressure and temperature on photosynthesis and calcification in a scleractinian coral. Glob. Chang. Biol. 9, 1660–1668. doi: 10.1046/j.1365-2486.2003.00678.x
Ries, J. B., Cohen, A. L., and McCorkle, D. C. (2009). Marine calcifiers exhibit mixed responses to CO2-induced ocean acidification. Geology 37, 1131–1134. doi: 10.1130/G30210A.1
Schneider, K., and Erez, J. (2006). The effect of carbonate chemistry on calcification and photosynthesis in the hermatypic coral Acropora eurystoma. Limnol. Oceanogr. 51, 1284–1293. doi: 10.4319/lo.2006.51.3.1284
Shaw, E. C., Carpenter, R. C., Lantz, C. A., and Edmunds, P. J. (2016). Intraspecific variability in the response to ocean warming and acidification in the scleractinian coral Acropora pulchra. Mar. Biol. 163, 210. doi: 10.1007/s00227-016-2986-8
Shaw, E. C., Phinn, S. R., Tilbrook, B., and Steven, A. (2015). Natural in situ relationships suggest coral reef calcium carbonate production will decline with ocean acidification. Limnol. Oceanogr. 60, 777–788. doi: 10.1002/lno.10048
Suzuki, A., and Kawahata, H. (2003). Carbon budget of coral reef systems: an overview of observations in fringing reefs, barrier reefs and atolls in the Indo-Pacific regions. Tellus Ser. B Chem. Phys. Meteorol. 55, 428–444. doi: 10.3402/tellusb.v55i2.16761
Venn, A. A., Tambutté, E., Holcomb, M., Laurent, J., Allemand, D., and Tambutté, S. (2013). Impact of seawater acidification on pH at the tissue–skeleton interface and calcification in reef corals. Proc. Natl. Acad. Sci. U.S.A. 110, 1634–1639. doi: 10.1073/pnas.1216153110
Washburn, L., and Brooks, A. (2014). Moorea Coral Reef Long Term Ecological Research. MCR LTER: Coral reef: Gump Station meteorological data, ongoing since 2006. Dataset knb-filter-mcr. 9.41.
Watanabe, A., Kayanne, H., Hata, H., Kudo, S., Nozaki, K., Kato, K., et al. (2006). Analysis of the seawater CO2 system in the barrier reef-lagoon system of Palau using total alkalinity-dissolved inorganic carbon diagrams. Limnol. Oceangr. 51, 1614–1629. doi: 10.4319/lo.2006.51.4.1614
Keywords: ocean acidification, coral reef, calcification, photosynthesis, production:calcification ratio
Citation: Lantz CA, Carpenter RC, Comeau S and Edmunds PJ (2017) Organisms Composing an Experimental Coral Reef Community from Mo'orea, French Polynesia, Exhibit Taxon-Specific Net Production: Net Calcification Ratios. Front. Mar. Sci. 4:298. doi: 10.3389/fmars.2017.00298
Received: 21 March 2017; Accepted: 30 August 2017;
Published: 28 September 2017.
Edited by:
Hajime Kayanne, The University of Tokyo, JapanReviewed by:
Takashi Nakamura, Tokyo Institute of Technology, JapanJuan Pablo Carricart-Ganivet, National Autonomous University of Mexico, Mexico
Copyright © 2017 Lantz, Carpenter, Comeau and Edmunds. This is an open-access article distributed under the terms of the Creative Commons Attribution License (CC BY). The use, distribution or reproduction in other forums is permitted, provided the original author(s) or licensor are credited and that the original publication in this journal is cited, in accordance with accepted academic practice. No use, distribution or reproduction is permitted which does not comply with these terms.
*Correspondence: Coulson A. Lantz, coulsonlantz@gmail.com