Informing Marine Protected Area Designation and Management for Nesting Olive Ridley Sea Turtles Using Satellite Tracking
 Tiffany M. Dawson1*
  Angela Formia2 Pierre D. Agamboué2
  Georges M. Asseko3 François Boussamba4 Floriane Cardiec2 Emmanuel Chartrain2
  Philip D. Doherty5,6 J. Michael Fay7
  Brendan J. Godley5 Francis Lambert7 Brice D. Koumba Mabert8 Jean C. Manfoumbi9
  Kristian Metcalfe5 Gianna Minton10 Ivan Ndanga2,4 Jacob Nzegoue2 Carmen K. Kouerey Oliwina2 Philippe Du Plessis11 Guy-Philippe Sounguet4,7 Dominic Tilley5 Matthew J. Witt6
  Sara M. Maxwell1
- 1Department of Biological Sciences, Old Dominion University, Norfolk, VA, United States
- 2Wildlife Conservation Society, Gabon-Program, Libreville, Gabon
- 3Agence Nationale des Pêches et de l'Aquaculture, Libreville, Gabon
- 4Aventures Sans Frontières, Libreville, Gabon
- 5Centre for Ecology and Conservation, College of Life and Environmental Sciences, University of Exeter, Penryn, United Kingdom
- 6Environment and Sustainability Institute, University of Exeter, Penryn, United Kingdom
- 7Agence Nationale des Parcs Nationaux, Libreville, Gabon
- 8Centre Nationale des Données et des Informations Océanographiques, Libreville, Gabon
- 9Ibonga-ACPE, Libreville, Gabon
- 10WWF Gabon, Libreville, Gabon
- 11Fondation Liambissi, Port-Gentil, Gabon
Understanding the horizontal and vertical habitat of olive ridley sea turtles (Lepidochelys olivacea), a threatened species, is critical for determining regions for protection and relevant gear modifications that may effectively reduce bycatch, the largest threat to this species. Satellite transmitters were used to determine the movement and dive behavior of 21 female olive ridley turtles tagged in Pongara National Park, Gabon during the 2012, 2013, and 2015 nesting seasons. A switching state-space model was used to filter the tracking data and categorize the internesting and post-nesting movements. Gridded utilization distribution (UD) home range analysis of tracking data revealed that the entire core habitat occurred in the Komo Estuary during the internesting period. Within the Komo Estuary, 58% of this core UD occurred in shipping lanes. Dive data from the 2015 tagging season revealed that during the internesting period, turtles spent the majority of their time resting on the estuary seabed. Approximately 20% of all dive time was spent on the bottom and all maximum dive depths corresponded to the depth of the seabed, indicating that bottom set gear during the internesting period may pose the greatest potential for fisheries interactions. National parks currently protect many of the nesting sites and the Gabon Bleu initiative has formally designated 10 new marine parks and a network of community and industrial fishing zones; this data was a layer used in determining the park and zone boundaries. Shared use of the estuary by fisheries, shipping, and olive ridley turtles creates a need for management measures to reduce interactions. Thus, the results from this study can further provide detailed information that can be used to support the development of evidence-based management plans.
Introduction
Protecting long-lived, highly migratory marine species is challenging since they encounter multiple threats across broad areas and in different life stages (Witt et al., 2011; Maxwell et al., 2013; Lascelles et al., 2014), often requiring multi-faceted and multi-national conservation efforts (Blumenthal et al., 2006; Gore et al., 2008; Maxwell et al., 2011; Croxall et al., 2012; Pikesley et al., 2013b; Doherty et al., 2017). Several studies have used satellite telemetry to describe the horizontal movement data of large marine vertebrates (Godley et al., 2008; Block et al., 2011; Hawkes et al., 2011; Hazen et al., 2012; Yurkowski et al., 2016; Citta et al., 2017; Vaudo et al., 2017) and to determine overlap with anthropogenic threats such as fisheries (seabirds: Suryan et al., 2007; Bugoni et al., 2009; Žydelis et al., 2011; sea turtles: da Silva et al., 2011; Witt et al., 2011; Revuelta et al., 2015; marine mammals: Geschke and Chilvers, 2010; Rosenbaum et al., 2014; sharks: Holmes et al., 2014), shipping (marine mammals: Mate et al., 1997; Schorr et al., 2009), and in-water habitat degradation (seabirds: Montevecchi et al., 2012; marine mammals: Johnson and Tyack, 2003; Rosenbaum et al., 2014). Satellite telemetry has been critical in evaluating threat exposure for marine species (Witt et al., 2008; Maxwell et al., 2013; Lascelles et al., 2014) and assessing how efficient conservation boundaries, such as Marine Protected Areas (MPA), are at encompassing the wide ranging habitat distribution of migratory species (Hart et al., 2010; Scott et al., 2012; Young et al., 2015; Maxwell et al., 2016).
Olive ridley turtles (Lepidochelys olivacea), like other sea turtle species, lay multiple clutches of eggs in a nesting season (Plotkin, 2007; Maxwell et al., 2011). Therefore, they remain in the vicinity of nesting beaches for several weeks at a time (Whiting et al., 2007; Hamel et al., 2008; da Silva et al., 2011; Maxwell et al., 2011), termed the internesting period, during which they are susceptible to additional anthropogenic impacts (Pikesley et al., 2013a). This period also makes sea turtles ideal candidates for conservation measures because both sexes congregate in the same waters to breed and females typically return to the same beaches to nest multiple times in the same season (Van Buskirk and Crowder, 1994).
Olive ridley turtles are a vulnerable species as defined by the International Union for Conservation of Nature and Natural Resources (IUCN) Red List due to over-exploitation and characteristics such as slow growth rate, late reproductive maturity, and low hatchling survival rate (Abreu-Grobois and Plotkin, 2008). These factors make it difficult to maintain sufficient populations in the face of anthropogenic influences (Abreu-Grobois and Plotkin, 2008). In the East Atlantic, one of the largest threats to olive ridley turtles is fisheries bycatch, including trawls and gillnets (Frazier et al., 2007; Parnell et al., 2007). In this region, olive ridley turtles are distributed across multiple commercial and artisanal fishing hotspots as well as political boundaries, making conservation practices difficult (Godgenger et al., 2009; Wallace et al., 2013; Metcalfe et al., 2015b), however MPAs are being developed in some parts of the East Atlantic, such as in Gabon, Africa.
Horizontal movement and habitat use are important measures for conservation but dive behavior can also be critical to understanding in-water threats to marine species. Understanding water column use can influence fisheries management strategies such as gear set depth, soak time, and gear type (Lewison et al., 2013). For example, in the North Pacific, Polovina et al. (2003) used turtle dive data to determine that banning shallower set longlines would decrease the amount of bycatch for sea turtles, specifically loggerheads (Caretta caretta) and olive ridley turtles, because they spent most of their time in the upper water column. Presently, little is known about dive behavior of olive ridley turtles and even less is known about their dive behavior during the internesting period. The only olive ridley turtle dive studies are from the West Atlantic and focus on post-nesting dive behavior (Plot et al., 2015). Understanding how olive ridley turtles use the water column is crucial to developing evidence based management plans within the MPA fishery zones.
In 2014, the President of Gabon announced and initiative known as “Gabon Bleu,” a marine spatial planning process that included the creation a network of MPAs in Gabonese waters. The final boundaries were released in June 2017. In order to inform this process, planners required the distribution of species as well as putative threats (Roberts and Hamann, 2016). Similar to other Central African countries, Gabon has more small-scale fishing than industrial fishing and a majority of fishermen use purse seine, drift gillnet, and bottom set gillnet techniques (Metcalfe et al., 2015b). Through field surveys, Metcalfe et al. (2015b) found that 62% of the 1,831 boats were working out of Libreville and the Komo Estuary, which is also adjacent to Pongara National Park, one of the largest olive ridley nesting beaches in Gabon (Metcalfe et al., 2015a). Artisanal fishing was also found to be heavily aggregated in estuaries, and river and lagoon mouths (Metcalfe et al., 2015b). Based on a study of sea turtle bycatch from industrial fisheries in Gabonese waters, olive ridley turtles were the most impacted sea turtle species, representing 80% of the total sea turtle bycatch (Casale et al., 2017). Furthermore, a study on beached carcasses has indicated that bycatch of sea turtles, particularly olive ridley turtles, is appreciable in Gabon (Parnell et al., 2007). The Komo Estuary is also a major shipping region, however, the impacts of shipping on sea turtles have not been well studied. Impacts may occur in the form of pollution from vessels via discharge of oil, fuel, organic pollutants, sewage, and debris, noise pollution, or through direct ship strikes (Abdulla and Linden, 2008; Maxwell et al., 2013 and references within). Even when the magnitude of impacts is unclear, understanding where and when turtles and threats overlap is necessary to inform conservation strategies.
To inform the Gabon Bleu initiative, we undertook satellite tracking of olive ridley turtles in Northern Gabon to determine distribution of sea turtles within Pongara National Park and the adjacent Komo Estuary, a heavily used waterway, and compared this distribution to threats in the region. We collected location and dive depth data from nesting female olive ridley turtles to better understand their vertical and horizontal habitat movement along the Gabonese coast. We further consider the movements of olive ridley turtles in relation to the boundaries of shipping lanes and the boundaries of newly designated MPAs. Movement and dive data provided a basis to inform the boundaries of MPAs and other marine zones and can be used to further inform management plan for zones in the area.
Methods
Ethics Statement
All federal, international, and institutional guidelines were followed, and this study was approved by and carried out in accordance with the recommendations of University of Exeter's College of Life and Environment Sciences Ethics Committee and the Institutional Animal Care and Use Committee at Old Dominion University (IACUC Permit 15-016). Permissions to work within park boundaries and with the study species were issued by the Gabon Agence Nationale des Parcs Nationaux (AEl5025, AR0010/12, AE140003).
Study Area
Gabon, Central West Africa, is home to the largest olive ridley rookery in the Atlantic (Metcalfe et al., 2015a), however, even with global decline and their vulnerable status this region remains data deficient. Previously, an expansive network of national parks protected 81% of sea turtle beach nesting sites (Metcalfe et al., 2015a), but in-water protection only existed in southern Gabon via Mayumba National Park. However, the government recently designated a new network of MPAs that consist of 10 marine parks covering 23% of the Gabonese Economic Exclusive Zone.
One of the newly created MPAs is contiguous to Pongara National Park. It is an important area for both people and marine life, adjacent to the Komo Estuary and proximate to Gabon's capital city, Libreville, one of the main anthropogenic use regions in Gabon and most populated city in the country with ~800,000 inhabitants. The Komo Estuary is the location of a major port and is also an important artisanal fishing region.
Satellite Transmitter Deployment
The internesting movements of 21 olive ridley sea turtles were monitored from Pongara National Park, one of the largest nesting beaches in Gabon (Metcalfe et al., 2015a), over three nesting seasons (2012, 2013, 2015). Satellite transmitters were attached to nesting females early in the nesting season to capture internesting movements (Maxwell et al., 2011). Olive ridley turtles at Pongara National Park nest between October and January, peaking in late October to early November (Metcalfe et al., 2015a). SPOT-293A transmitters (Wildlife Computers, Redmond WA, USA) were deployed between 26th October and 5th November 2012 (n = 6) and 12nd October and 13th October 2013 (n = 5). SPLASH10-351C (Wildlife Computers, Redmond WA, USA) were deployed between 27th October and 31st October 2015 (n = 10). Attachment followed techniques described in Maxwell et al. (2011), and did not start until the female began oviposition and care was taken not to disturb the nest during attachment. Transmitters were attached to the flattest portion of the two front most vertebral scutes of the carapace using either T308+™ Epoxy (Powers Fastners, Brewster NY, USA) in 2012 and 2013 or Superbond 1:1 Expoxy Adhesive (FiberGlass Coatings, Inc. St. Petersburg FL, USA) in 2015. First, the carapace was cleaned of algae and smoothed using sandpaper and sea water; once cleared the area was dried with acetone. The transmitter was placed with the antennae pointing toward the head and perpendicular to the top of the carapace and the epoxy was molded to ensure attachment around the edges. To minimize stress and handling, a wooden box was placed around the female after she finished covering the nest. Once the epoxy set, the female was released and monitored to make sure she returned to the water. Before tag attachment curved carapace length (CCL) and curved carapace width (CCW) were measured, and metal flipper tags Monel 1005-62 (National Band and Tag Co., Newport, KY) were attached to the front flippers. Satellite data were collected via the Argos Satellite System.
Track Analysis and State-Space Model
All Argos location quality points except for 0 and Z were used in the movement analysis (i.e., location classes 3, 2, 1, A, B) and a hierarchal state-space model (hSSM) with a time interval of 3.5 h was used to filter the location data and determine internesting behavior (Breed et al., 2009; Jonsen et al., 2013). SSMs use parameters associated with an animal's position (Jonsen et al., 2003) and determine a behavioral state for each point in time (Breed et al., 2009; Jonsen et al., 2013). Through the use of a two part model, an equation is used to determine how behavioral states change randomly in time and previous locations are used to estimate the next location based on an independent random walk model and biological constraints of the animal, such as how far they can travel in a day (Jonsen et al., 2013). SSMs are used to draw inferences from data on behavioral changes through time and how it can be related to actual biological processes (e.g., foraging, breeding, or migrating). The model also accounts for observation error between the satellite-produced location and the unseen true location and credible limits for the predicted locations (Breed et al., 2009). A hSSM structure was used since we had multiple tagged animals and wanted to focus on population level dynamics instead of individual movement. A short track, run individually through the model, could not produce accurate behavioral states but when run with other tracks in the hSSM, behaviors can then be categorized (Breed et al., 2009). The hSSM is ideal when behaviors cannot be directly observed throughout the track, such as with the olive ridley turtles, therefore data such as speed and turn angle are used to delineate probable behavior (Jonsen et al., 2013).
We used the hSSM model to run 2 Markov Chain Monte Carlo simulations for 10,000 iterations with a burn-in of 15,000 to generate 10,000 posterior samples in the “bsam” package in R (Jonsen et al., 2005; Jonsen, 2016). We used a thinning factor of 10 to minimize the within-chain sample autocorrelation. We used a time step of 0.15, creating a 3.5-h time interval between points; time step determined by finding the average time between existing points, following Maxwell et al. (2011). Trace plots were examined for autocorrelation and to ensure that they converged on a mean density, and resulting tracks were examined to determine if tracks made biological sense, the most important validation metric (G. Breed, pers. comm.). Due to the coastal and estuarine nature of our study area, resulting hSSM locations occasionally occurred on land. These locations were shifted, such that previous and post-locations were used to determine directionality of movement. The inland location was then manually moved to the closest in-water location. If a relatively confident location could not be estimated then the location was discarded from analysis.
The hSSM also assigned a behavioral estimate between 1 and 2 to each location point based on the mean turn angle (Θ) and the autocorrelation between speed and direction (γ). We defined the “transiting” behavior state as behavioral estimates between 1.0–1.39 and “internesting” behavioral state as 1.6–2.0, and only internesting locations were used for the remainder of the analyses. Behavioral estimates between 1.4 and 1.59 were considered behavioral transitions from internesting behavior to transiting; comprising only 2.4% (47 locations) of the data, and transition locations were not considered in the analysis.
We also identified renesting events within the tracks. Renesting events were inferred by consecutive high quality location points directed toward land and consistent with the known re-nesting interval of 17–30 days for olive ridley turtles (Miller, 1997; Maxwell et al., 2011).
Comparison of Sea Turtle Distribution, Zone Boundaries, and Commercial Shipping
Home range analysis, in the form of a gridded utilization distribution (UD) was used in the software R to determine the core use area, where 50% or more of the hSSM locations occurred during the internesting period (Maxwell et al., 2011). Using custom scripts in R 3.0.1 (R Core Team, 2003) we visually determined a base grid size of 0.015° (~1.5 km2) which allowed for the best spatial resolution within the restricted area of the Komo Estuary without oversmoothing as a turtle moved between cells (Maxwell et al., 2011). To aid in future zoning of the Komo Estuary, we quantified the percent of the internesting locations inside of the Komo Estuary. Additionally, we divided the estuary into 6 zones based on draft management zones in the Gabon Bleu initiative and nautical landmarks within the estuary. Zones 1, 3, 4, and 5 represent sections of current community fishing areas within the estuary, Zone 2 is the newly-designated MPA boundary adjacent to Pongara National Park, and Zone 6 is the current Pongara National Park and Buffer boundary. Zone 4 was further divided into three subsections, A-C, to examine whether turtle movement occurred equally across the zone or closer to Zone 2, the MPA boundary. The percentage of internesting locations that fell within each zone were then calculated to identify high use areas that could be used to inform development of management plans for the regions.
The UD was also compared to a UD of commercial shipping location data collected by the Automatic Identification Systems onboard vessels and downloaded from ExactEarth. Under Regulation 19 of the Safety of Life at Sea: Chapter V by the International Maritime Organization, location data, transmitted every minute at variable intervals, for shipping vessels are recorded globally for all vessels greater than 300 tons if traveling internationally and greater that 500 tons if localized (IMO, 2001). We used available vessel location data along the Gabonese coast from October and November 2012 to mirror the internesting period of the olive ridley turtles. All anchored or moored data points were removed from analysis (1.6% of all data points), such that only transiting data were used. The shipping UD was created using the same base grid as the olive ridley UD. The shipping and turtle UDs were then compared to determine the percent of overlap within the internesting habitat.
Dive Depth Analysis
Dive depth was collected in 2015 only (n = 10), with depth recorded every 2.5 min. The transmission of dive data, however, was variable and dependent on satellite availability. Additionally, the transmitted dive data did not necessarily correspond to known locations as dive data was recorded continuously while location can only be determined by satellites when turtles are at the surface. To determine dive behavior near known locations, dive depths within a 1-h window before and after a high-quality Argos location (location quality 3, 2, and 1 only) were extracted. The maximum dive depth within this 2-h window was compared to a gridded bathymetric map of the Komo Estuary to determine if turtles likely used the estuary bottom. The gridded bathymetric map was created from Bahia de Corsico to Estuaire du Gabon, Nautical Chart 1356, a nautical chart of the estuary, rasterized using the Raster package in R (Hijmans, 2016) with the same resolution and extent as the grid used for the UDs.
Using all of the dive data available from the 2-h windows, regardless of location quality, we determined the portion of the water column used by the olive ridley turtles. In this analysis, we included all depth locations that were recorded along the course of the dives. We normalized the dive data from each 2-h window previously described by dividing each depth by the maximum depth of that window creating a proportion between 0 (representing surface use) and 1 (representing bottom use). This allowed us to determine where in the water column turtles spent time throughout the internesting period across all dive data. Using the proportion created for each dive depth, we compared the surface and bottom use to the time of day to look for diel dive patterns.
Results
Satellite Transmitter Deployment
Twenty-one satellite transmitters were attached to nesting female olive ridley turtles in 2012 (n = 6), 2013 (n = 5), and 2015 (n = 10) in Pongara National Park (Table S1, Figures 1A–D). The overall mean track duration was 102.8 days (±58.4, min = 29, max = 203) with an average duration of 82.4 days (±53.9, min = 29, max = 151) in 2012, 169 days (±36.4, min = 112, max = 203) in 2013, and 79.9 days (±45.5, min = 34, max = 184) in 2015. The mean overall internesting period was 15.6 days (±12.2). An approximate re-nesting event was identified for turtles G, H, and, P and each event was an estimated 15, 15, and 18 days after the transmitter deployment date, respectively. Turtle M from the 2015 season stopped transmitting before switching from internesting to post-nesting movement but remained in the Komo Estuary for 43 days and was therefore retained in the analysis. Turtle B from the 2012 season was discarded from further analysis because the Argos data returned improbable locations and movement patterns thought to be from transmitter failure. Turtle P had location points within the internesting period that demonstrated an unexpected full behavioral switch from internesting to transiting then back to internesting. During the switch, the turtle remained in the Komo Estuary and later we saw the anticipated long-term behavioral switch to transiting along with a southward movement toward the foraging grounds (Pikesley et al., 2013b). Therefore, we included the short behavioral change in our internesting period analysis.
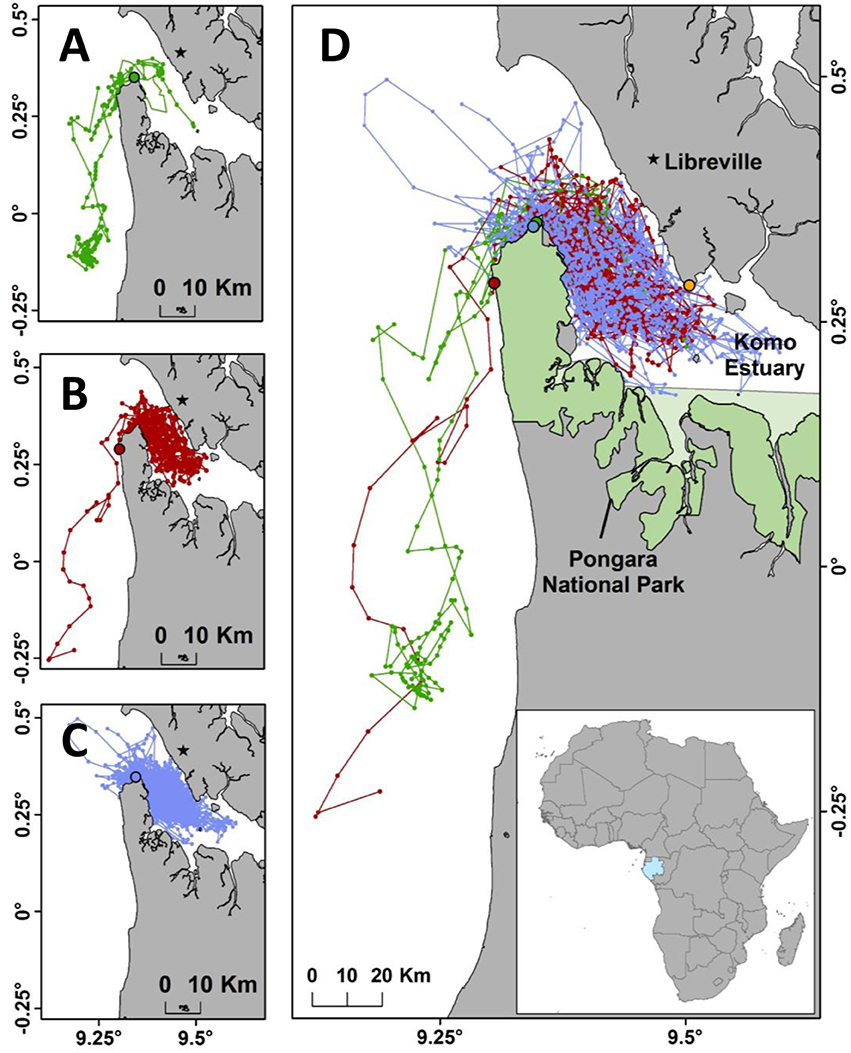
Figure 1. (A) State-space modeled internesting tracks of female olive ridley sea turtles tagged from Pongara National Park, Gabon from the 2012 field season (n = 5). The green dot represents the tagging location for this season. (B) Tracks from the 2013 field season (n = 5). The red dot represents the tagging location for this season. (C) Tracks from the 2015 field season (n = 10). The blue dot represents the tagging location for this season. (D) Combined tracks from all three field seasons (n = 20). Green, red, and blue tracks represent 2012, 2013, and 2015 data respectively along with the coordinating colored dots representing the tagging locations. The orange dot represents the Owendo commercial shipping port in the Komo Estuary.
Comparison of Sea Turtle Distribution, Boundaries, and Commercial Shipping Data
The full (100%) UD demonstrated that olive ridley turtles remained in the Komo Estuary and within 20 km of the coast south of the estuary during the internesting period. This includes use of the waters off the nesting beach of Pongara National Park (Figure 2A). The core UD highlighted that the high use areas are entirely within the Komo Estuary and at the mouth of the estuary near to where much of the nesting occurred and where most tags were deployed. Using the mouth of the estuary as an arbitrary divide, 89% of the hSSM internesting points were within the estuary and 95% of the points were in the mapped zones. Zone 2, the new MPA, and Zone 4, a new community fishing area, had the highest density of points, with 45 and 40% respectively. Zone 4A contained the highest percentage of the three subsections with 17% of the points. Zones 4B and 4C contained 11 and 12% of the internesting points, respectively. Zones 3 and 5 each had 5% of the points, Zone 1 contained 0.5%, and Zone 6, the in-water portion of the current Pongara National Park, only encompassed 0.21% of the points (Figure 2B).
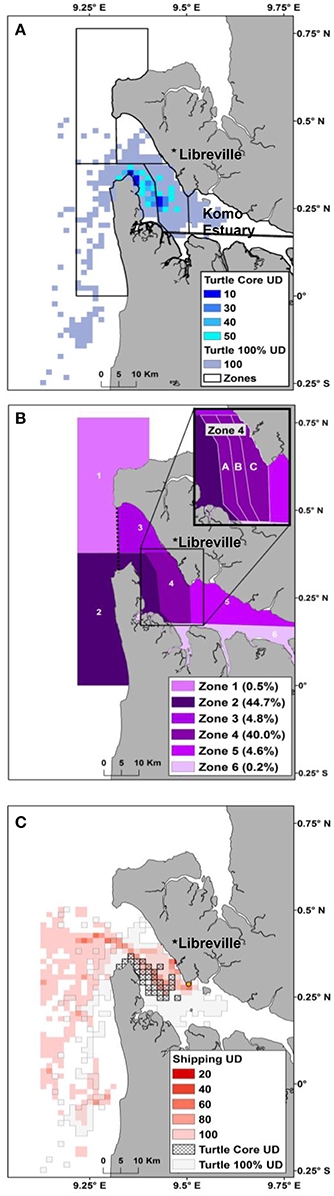
Figure 2. (A) Utilization distribution (UD) of all female olive ridley sea turtles during the internesting period tagged in Pongara National Park, overlaid by zones. Zonation of the Komo Estuary is based on newly designated MPA boundaries and community fishing areas as well as nautical landmarks. The turtle core (50%) UD represents the most used areas, dark blue representing the most intensely used, by the olive ridley turtles. (B) Zones are colored based on utilization by the tagged olive ridley turtles during the internesting period with darker areas more heavily used and Zones 2 (the new MPA) and 4 (community fishing area) being the most utilized areas, implying areas of conservation potential. The dotted line represents the boundary used to calculate density in and out of the estuary. (C) UD of October 1—November 30, 2012 transiting shipping location data (red) compared to the olive ridley full UD (dotted) and the core UD (hashed) within the Komo Estuary. The orange circle represents the Owendo Port, the majoring shipping port in the Komo Estuary.
The UD of the commercial shipping data demonstrated the highest ship traffic in the mid estuary from the Owendo port and out along the Gabonese coast line. The full shipping (100%) UD overlapped with 34.1% of the olive ridley full UD and 48.5% of the core UD (Figure 2C).
Dive Depth Analysis
The dive depth data from the 10 satellite tags deployed in 2015 provided a mean of 185.3 h of data across all turtles (±136.3, min = 32.0, max = 403.4) during the internesting period. The mean maximum depth recorded was 33 meters (±10, min = 19, max = 51) with mean dive depths ranging between 7 and 12 m (mean = 9 ± 2) (Table S1).
Of the transmitted dive data that correlated with high quality locations (n = 89), 100% of the maximum dive depths were found to coincide with depth of the seabed (Figure 3). Normalized depths (the proportion of time spent at depths within each dive normalized across all dives) demonstrated that 19.7% of the recorded depths occurred on the bottom and 7.8% were at the surface, with the remainder in the water column (Figure 4). Both surface and seabed use occurred at all hours of the day. However, 64% of surface time, represented by a proportion of 0–0.2 from the normalized depths, occurred at night between 6:00 p.m. and 6:00 a.m. The seabed use, proportions 0.8–1.0, was more evenly dispersed throughout the day with 53% of time spent during the day, 6:00 a.m.–6:00 p.m., and 47% at night, suggesting that turtles avoided coming to the surface during the day.
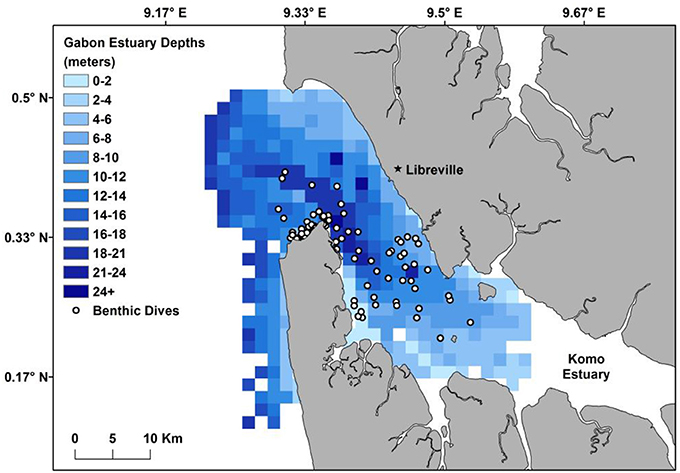
Figure 3. Benthic grid of the Komo Estuary highlighting locations where olive ridley turtles location data correlated with dive depth data (white points) providing a comparison between max dive depth and the estuary bottom.
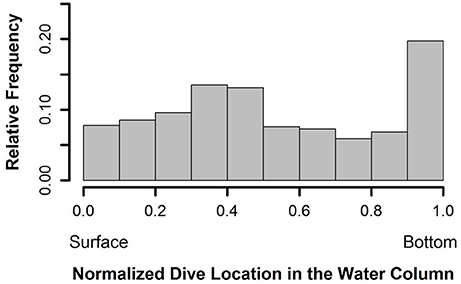
Figure 4. Proportion of time spent at dive depths, normalized across all dives. Dive data was extracted from the 2-h window surrounding each location where dive data was transmitted and normalized based on the maximum depth of the respective window.
Discussion
In 2014, the President of Gabon announced plans to create a network of marine protected areas (MPAs) in Gabonese waters and the final boundaries were released in June 2017. The planning process explicitly incorporated the habitat utilization data of sea turtles, including the olive ridley turtles tagged in this study, and as a result an MPA has been designated is located off of Pongara National Park matching Zone 2 (Figure 2B). To examine estuary use and inform the process, we created zones similar to those being considered within the planning process and our results indicate that the area around the mouth of the estuary, Zone 2, is a critical area in need of conservation strategies and will be protected as a marine protected area under the newly established Nature Preservation Agency, and likely designated as an expansion of Pongara National Park. The beaches within Pongara National Park are the most heavily used nesting beach for olive ridley turtles in northern Gabon, hence where most tagging occurred. As a result, close to 45% of the tracking locations occurred within Zone 2 and with its protection, particularly during the nesting season, it is more beneficial than the existing park boundaries (Zone 6), which encompass 0.2% of the locations. This reaffirms the benefit of the new network of marine parks that have recently been implemented.
Internesting Estuarine Movements
The female olive ridley turtles that nest in Pongara National Park are an example of marine vertebrates whose habitat use is understudied and are at risk from fishing pressures in the adjacent estuary. The telemetry tracks illustrate that females remain in the vicinity of the nesting beach (<20 km), and spend a majority of their time within the Komo Estuary (89% of locations, Figures 1A–D). There can be considerable variability in internesting movements among species at different nesting beaches and within the same nesting population (Godley et al., 2008). In most leatherback populations, females cover extensive areas between nesting events, though normally stay within the continental shelf (Eckert et al., 2006; Georges et al., 2007; Hitipeuw et al., 2007). Despite some loggerhead, olive ridley, and green sea turtle (Chelonia mydas) populations undertaking oceanic loops during internesting periods (Blumenthal et al., 2006; McMahon et al., 2007) and flatback sea turtles (Natator depressus) demonstrating variable behaviors in Western Australia (Waayers et al., 2011; Whittock et al., 2014), most hard shelled turtles tend to stay close to their nesting beaches (loggerheads: Godley et al., 2003; greens: Hays et al., 1999; Craig et al., 2004; Troëng et al., 2005; Fuller et al., 2008; hawksbills (Eretmochelys imbricate): Troëng et al., 2005; Whiting et al., 2006; Hoenner et al., 2016; Kemp's ridley (Lepidochelys kempii): Seney and Landry, 2008; Shaver and Rubio, 2008). This intense habitat use allows for more targeted conservation measures (Godley et al., 2008).
Some of the tracked females remained in the area for over a month before switching to the transiting phase and moving south, likely to known foraging grounds off the coast of Angola (Pikesley et al., 2013b). This is the first noted occurrence where olive ridley turtles almost exclusively used estuarine habitat during their internesting period. Green sea turtles nesting in French Guiana similarly used the Maroni River Estuary during their internesting period (Chambault et al., 2016) but additional occurrences are not known. In the Indian Ocean, female olive ridley turtles tagged on nesting beaches in Oman display consistent coastal use (Rees et al., 2012) but other populations of olive ridley turtles have been seen to move to offshore waters adjacent to the nesting beaches or immediately end the internesting period after their last nesting event and migrate toward foraging grounds (Whiting et al., 2007; Maxwell et al., 2011; Plot et al., 2015).
Within the estuary both the shallower coastal and deeper mid-estuary areas were used, highlighting the importance of this enclosed area to the internesting females. There are several hypotheses for estuarine use. Shallower depths in the estuary may result in reduced energy expenditure by turtles coming to the surface to breathe as they wait for egg development between clutches. During their time in the estuary, the olive ridley turtles appear to be utilizing the bottom habitat with U-shaped dives, which are likely related to resting or foraging (Figures 3, 5, Plot et al., 2015). In addition, turtles may find increased foraging opportunities in the estuary; whether olive ridley turtles forage during the internesting period is unclear, but some turtles remained in the estuary long after nesting was completed, suggesting that they were likely taking advantage of available resources, as has been hypothesized in other regions (Rees et al., 2012).
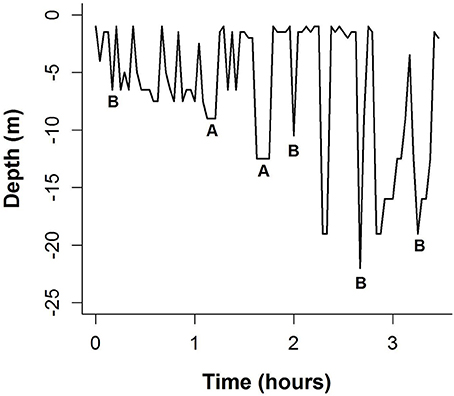
Figure 5. Dive profile of Turtle U during the internesting period. “A” represents a U-shaped dive indicative of resting or foraging and “B” represents a V-shaped dive indicative of exploratory dives.
Turtle-Threat Overlap and Conservation Measures
Using a multi-use human area, we showcase an example where data collected on a marine vertebrate species overlaps with putative threats in the habitat. We further augment with diving data, a behavioral component, to evidence where bycatch and boat interaction risk might be high and where management interventions may lead to improved conservation outcomes. The newly designated MPA boundary, Zone 2, is an example of management intervention for the marine species utilizing the Komo Estuary. The Gabon Bleu initiative also took socioeconomic impacts into consideration in designating the zones and MPA, resulting in the community fishing areas where industrial fishing will be prohibited but artisanal fishing is allowed. While artisanal fishing can result in bycatch, commercial fishing gears such as trawls are also responsible for considerable bycatch (Metcalfe et al., 2015b) so the restriction of commercial vessels in this region will be beneficial to turtles.
Dive data indicated that olive ridley turtles spent a large portion of their time on the estuary bottom during all hours (Figures 3, 4). Bottom set gillnets, which are widely used by artisanal fisheries in Central Africa (Metcalfe et al., 2015b, 2016), pose a direct threat to sea turtles resting on the bottom and studies have highlighted the depth at which fishing occurs can influence the bycatch rates of sea turtles (Polovina et al., 2003; Gilman et al., 2006). Outside of the MPA, the estuary has been designated for community fishing activities; management plans may consider seasonal fishing restrictions during the internesting period, particularly for bottom-set fishing gear, which restricts turtles' ability to breathe at the surface. Midwater or surface gear also has the potential to result in interactions with turtles, particularly as our data demonstrates that the olive ridley turtles spend more time at the surface between the hours of 6:00 p.m. and 6:00 a.m. Gear set at the surface and frequently monitored for capture of turtles could be an alternative to bottom-set gear to at least increase the potential for turtles to be released alive if captured.
The overlap between the core turtle UD and the shipping lane poses a potential threat, however the new MPA also overlaps with the deepest part of the estuary and necessary depths for a shipping channel. While management plans for the new MPA have not been completed, the new MPA is likely to restrict fishing but regulations on shipping are unclear. With a major port located in the Komo Estuary, heavy ship traffic occurs throughout the year in addition to coinciding with the internesting period (Figure 2C, Figure S1). Management, however, could include speed restrictions or designated shipping lanes during the internesting months.
Conclusions
There are examples of marine vertebrates from all ocean basins that are under threat throughout their range as seen by large-scale declines in recent decades (Baum et al., 2003; Myers and Worm, 2003; Heithaus et al., 2008). Red List Status might be improving for some species (Balazs and Chaloupka, 2004; Dutton et al., 2005; Simpfendorfer and Dulvy, 2017), highlighting that improved knowledge can lead to better management and conservation outcomes. Nonetheless, threats are highest where species aggregate such as to breed or forage (Edgar et al., 2008; Hays et al., 2010) and where species and humans frequently overlap; for marine species this is often in coastal zones (Maxwell et al., 2013). Quantifying specific threats can be difficult due to limited data, largely because of the feasibility of collection, but quantitative data is necessary to undertake comprehensive assessments and quantify impacts on marine vertebrates. With robust data on human impact and species distribution it becomes possible to accurately gauge threats in space and time, and then appropriately manage human activities for the preservation of species of conservation concern. Here, as the first study to look at internesting movements at this site, we were able to quantitatively determine fine-scale movements of olive ridley sea turtles and compare them with anthropogenic activities, and—critically—this data was used to development of an MPA designated off of Pongara National Park.
While the insights gained from this study greatly improve knowledge on the movement of female olive ridley turtles during the internesting period, there are still critical data gaps for this population. We know very little about male olive ridley turtle movement in general (Godley et al., 2008) and also in this area and they could also be at risk from fishing and boat strikes if they aggregate in the area to breed. Coastal waters could be even more of a conservation concern if the males are shown to utilize coastal waters such as zone 2, as has been demonstrated in other regions (James et al., 2005; Shaver et al., 2005; Hays et al., 2010), but this is entirely unknown in Gabon. Additionally, we are lacking data on the seasonality of males in the region. As they are likely to arrive at breeding grounds prior to females (Plotkin, 2007), they are potentially exposed to threats before the internesting period highlighted in this paper. Understanding this seasonality is critical to ensuring that management measures align with when turtle abundance occurs across sexes. Furthermore, while our data spans three nesting seasons, looking at long-term interannual data could reveal different patterns and habitat use of this area. There may be interannual variability in habitat utilization as well as variability in the distribution of threats such as fishing and shipping. More information on threats would also better aid in designing effective conservation measures. While there is the potential for sea turtle-ship interactions, little is known about how likely these interactions are to occur, or what the impact is on either individuals or populations. More detailed fishing data on the bycatch rate of sea turtles, specifically within the artisanal fisheries, in the estuary or off the coast could guide conservation strategies for restrictions or gear modifications in the area that best suit both the species and fishermen. Though more knowledge is needed, the current data we provide can lead to beneficial conservation strategies for the nesting females from Pongara National Park, Gabon, and provide a framework for studies in other regions.
Author Contributions
TD, PDD, AF, BG, KM, DT, MW, and SM conceived the study and conducted data analyses. All authors contributed to the data collection and logistics and writing the manuscript.
Funding
Funding for this project was provided by Harvest Natural Resources Inc., Old Dominion University, the Sea World and Busch Gardens Conservation Fund, Tullow Inc., VAALCO Inc. BG, MW, and KM are supported by the Darwin Initiative (Projects 20-009 and 23-011) through funding from the Department for International Development (DFID) and the Department for Environment, Food and Rural Affairs (Defra) in the UK. The Gabon Sea Turtle Partnership was funded by the Marine Turtle Conservation Fund (United States Fish and Wildlife Service, Department of the Interior, USA).
Conflict of Interest Statement
The authors declare that the research was conducted in the absence of any commercial or financial relationships that could be construed as a potential conflict of interest.
Acknowledgments
We gratefully acknowledge the Agence National des Parcs Nationaux and the CENAREST for granting necessary authorizations to work in the national park, as well as the NGO Aventures Sans Frontieres which manages the field sites and technicians on the ground in collaboration with the Gabon Sea Turtle Partnership. We thank Jean-Michel Casanova and the staff of Pongara Lodge, particularly Charly Saal, for their support during the 2012 tagging season; the staff of Pongara Lodge for their support during the 2013 tagging season; Abbad Engone Obame El Hadj and the staff of La Baie des Tortues Luth Hotel, especially Wilfrid Agamboue, Stephane Lamou Allan, and Patrick Ogandaga, for their support during the 2015 tagging season; Jamie Dias for his assistance throughout the 2015 field season; the Wildlife Conservation Society-Gabon for their immense support throughout the duration of the project; Danielle Achterfeld and Mary Hayward for logistical support at ODU; and Kristen Hart and Aaron Gross for swiftly sending marine epoxy when baggage was lost in transit.
Supplementary Material
The Supplementary Material for this article can be found online at: https://www.frontiersin.org/article/10.3389/fmars.2017.00312/full#supplementary-material
Figure S1. AIS location points of the transiting ships from October 1 to November 30, 2012 illustrating the shipping channel within the Komo Estuary. The orange circle represents the Owendo Port, the majoring shipping port in the Komo Estuary.
References
Abdulla, A., and Linden, O. (2008). Maritime Traffic Effects on Biodiversity and Potential Mitigation Measures: A Synthesis. (Malaga: IUCN Centre for Mediterranean Cooperation), 159.
Abreu-Grobois, A., and Plotkin, P., (IUCN SSC Marine Turtle Specialist Group) (2008). Lepidochelys olivacea. IUCN Red List Threat. Spec. 2008:e.T11534A3292503. doi: 10.2305/IUCN.UK.2008.RLTS.T11534A3292503.en
Balazs, G. H., and Chaloupka, M. (2004). Thirty-year recovery trend in the once depleted Hawaiian green sea turtle stock. Biol. Conserv. 117, 491–498. doi: 10.1016/j.biocon.2003.08.008
Baum, J. K., Myers, R. A., Kehler, D. G., Worm, B., Harley, S. J., and Doherty, P. A. (2003). Collapse and conservation of shark populations in the Northwest Atlantic. Science 299, 389–392. doi: 10.1126/science.1079777
Block, B. A., Jonsen, I., Jorgensen, S., Winship, A., Shaffer, S. A., Bograd, S., et al. (2011). Tracking apex marine predator movements in a dynamic ocean. Nature 475, 86–90. doi: 10.1038/nature10082
Blumenthal, J. M., Solomon, J. L., Bell, C. D., Austin, T. J., Ebanks-Petrie, G., Coyne, M. S., et al. (2006). Satellite tracking highlights the need for international cooperation in marine turtle management. Endanger. Species Res. 2, 51–61. doi: 10.3354/esr002051
Breed, G. A., Jonsen, I. D., Myers, R. A., Bowen, W. D., and Leonard, M. L. (2009). Sex-specific, seasonal foraging tactics of adult grey seals (Halichoerus grypus) revealed by state–space analysis. Ecology 90, 3209–3221. doi: 10.1890/07-1483.1
Bugoni, L., D'Alba, L., and Furness, R. W. (2009). Marine habitat use of wintering spectacled petrels Procellaria conspicillata, and overlap with longline fishery. Mar. Ecol. Prog. Ser. 374, 273–285. doi: 10.3354/meps07750
Casale, P., Abitsi, G., Aboro, M. P., Agamboue, P. D., Agbode, L., Allela, N. L., et al. (2017). A first estimate of sea turtle bycatch in the industrial trawling fishery of Gabon. Biodivers. Conserv. 26, 1–13. doi: 10.1007/s10531-017-1367-z
Chambault, P., de Thoisy, B., Kelle, L., Berzins, R., Bonola, M., Delvaux, H., et al. (2016). Inter-nesting behavioural adjustments of green turtles to an estuarine habitat in French Guiana. Mar. Ecol. Prog. Ser. 555, 235–248. doi: 10.3354/meps11813
Citta, J. J., Richard, P., Lowry, L. F., O'Corry-Crowe, G., Marcoux, M., Suydam, R., et al. (2017). Satellite telemetry reveals population specific winter ranges of beluga whales in the Bering Sea. Mar. Mamm. Sci. 33, 236–250. doi: 10.1111/mms.12357
Craig, P., Parker, D., Brainard, R., Rice, M., and Balazs, G. (2004). Migrations of green turtles in the central South Pacific. Biol. Conserv. 116, 433–438. doi: 10.1016/S0006-3207(03)00217-9
Croxall, J. P., Butchart, S. H., Lascelles, B., Stattersfield, A. J., Sullivan, B., Symes, A., et al. (2012). Seabird conservation status, threats and priority actions: a global assessment. Bird Conserv. Int. 22, 1–34. doi: 10.1017/S0959270912000020
da Silva, A. C., Dos Santos, E. A., Oliveira, F. L. d. C., Weber, M. I., Batista, J. A., Serafini, T. Z., et al. (2011). Satellite-tracking reveals multiple foraging strategies and threats for olive ridley turtles in Brazil. Mar. Ecol. Prog. Ser. 443, 237–247. doi: 10.3354/meps09427
Doherty, P., Baxter, J., Gell, F., Godley, B., Graham, R., Hall, G., et al. (2017). Long-term satellite tracking reveals variable seasonal migration strategies of basking sharks in the north-east Atlantic. Sci. Rep. 7:42837. doi: 10.1038/srep42837
Dutton, D. L., Dutton, P. H., Chaloupka, M., and Boulon, R. H. (2005). Increase of a Caribbean leatherback turtle Dermochelys coriacea nesting population linked to long-term nest protection. Biol. Conserv. 126, 186–194. doi: 10.1016/j.biocon.2005.05.013
Eckert, S. A., Bagley, D., Kubis, S., Ehrhart, L., Johnson, C., Stewart, K., et al. (2006). Internesting and postnesting movements and foraging habitats of leatherback sea turtles (Dermochelys coriacea) nesting in Florida. Chelon. Conserv. Biol. 5, 239–248. doi: 10.2744/1071-8443(2006)5[239:IAPMAF]2.0.CO;2
Edgar, G. J., Langhammer, P. F., Allen, G., Brooks, T. M., Brodie, J., Crosse, W., et al. (2008). Key biodiversity areas as globally significant target sites for the conservation of marine biological diversity. Aquat. Conserv. 18, 969–983. doi: 10.1002/aqc.902
Frazier, J., Arauz, R., Chevalier, J., Formia, A., Fretey, J., Godfrey, M. H., et al. (2007). Human-Turtle Interactions at Sea. Biology and Conservation of Ridley Sea Turtles, Johns Hopkins University Press, Baltimore, MD.
Fuller, W., Broderick, A., Phillips, R., Silk, J., and Godley, B. (2008). Utility of geolocating light loggers for indicating at-sea movements in sea turtles. Endanger. Species Res. 4, 139–146. doi: 10.3354/esr00048
Georges, J.-Y., Billes, A., Ferraroli, S., Fossette, S., Fretey, J., Grémillet, D., et al. (2007). Meta-analysis of movements in Atlantic leatherback turtles during nesting season: conservation implications. arXiv preprint q-bio/0701040. doi: 10.3354/meps338225
Geschke, K., and Chilvers, B. L. (2010). Managing big boys: a case study on remote anaesthesia and satellite tracking of adult male New Zealand sea lions (Phocarctos hookeri). Wildl. Res. 36, 666–674. doi: 10.1071/WR09133
Gilman, E., Zollett, E., Beverly, S., Nakano, H., Davis, K., Shiode, D., et al. (2006). Reducing sea turtle by-catch in pelagic longline fisheries. Fish Fish. 7, 2–23. doi: 10.1111/j.1467-2979.2006.00196.x
Godgenger, M.-C., Bréheret, N., Bal, G., N'Damité, K., Girard, A., and Girondot, M. (2009). Nesting estimation and analysis of threats for Critically Endangered leatherback Dermochelys coriacea and Endangered olive ridley Lepidochelys olivacea marine turtles nesting in Congo. Oryx 43, 556–563. doi: 10.1017/S0030605309990329
Godley, B. J., Blumenthal, J., Broderick, A., Coyne, M., Godfrey, M., Hawkes, L., et al. (2008). Satellite tracking of sea turtles: where have we been and where do we go next? Endanger. Species Res. 4, 3–22. doi: 10.3354/esr00060
Godley, B., Broderick, A., Glen, F., and Hays, G. (2003). Post-nesting movements and submergence patterns of loggerhead marine turtles in the Mediterranean assessed by satellite tracking. J. Exp. Mar. Biol. Ecol. 287, 119–134. doi: 10.1016/S0022-0981(02)00547-6
Gore, M. A., Rowat, D., Hall, J., Gell, F. R., and Ormond, R. F. (2008). Transatlantic migration and deep mid-ocean diving by basking shark. Biol. Lett. 4, 395–398. doi: 10.1098/rsbl.2008.0147
Hamel, M., McMahon, C., and Bradshaw, C. (2008). Flexible inter-nesting behaviour of generalist olive ridley turtles in Australia. J. Exp. Mar. Biol. Ecol. 359, 47–54. doi: 10.1016/j.jembe.2008.02.019
Hart, K. M., Zawada, D. G., Fujisaki, I., and Lidz, B. H. (2010). Inter-nesting habitat-use patterns of loggerhead sea turtles: enhancing satellite tracking with benthic mapping. Aquat. Biol. 11, 77–90. doi: 10.3354/ab00296
Hawkes, L. A., Witt, M. J., Broderick, A. C., Coker, J. W., Coyne, M. S., Dodd, M., et al. (2011). Home on the range: spatial ecology of loggerhead turtles in Atlantic waters of the USA. Divers. Distrib. 17, 624–640. doi: 10.1111/j.1472-4642.2011.00768.x
Hays, G. C., Fossette, S., Katselidis, K. A., Schofield, G., and Gravenor, M. B. (2010). Breeding periodicity for male sea turtles, operational sex ratios, and implications in the face of climate change. Conserv. Biol. 24, 1636–1643. doi: 10.1111/j.1523-1739.2010.01531.x
Hays, G., Luschi, P., Papi, F., Del Seppia, C., and Marsh, R. (1999). Changes in behaviour during the inter-nesting period and post-nesting migration for Ascension Island green turtles. Mar. Ecol. Prog. Ser. 189, 263–273. doi: 10.3354/meps189263
Hazen, E. L., Maxwell, S. M., Bailey, H., Bograd, S. J., Hamann, M., Gaspar, P., et al. (2012). Ontogeny in marine tagging and tracking science: technologies and data gaps. Mar. Ecol. Prog. Ser. 457, 221–240. doi: 10.3354/meps09857
Heithaus, M. R., Frid, A., Wirsing, A. J., and Worm, B. (2008). Predicting ecological consequences of marine top predator declines. Trends Ecol. Evol. 23, 202–210. doi: 10.1016/j.tree.2008.01.003
Hitipeuw, C., Dutton, P. H., Benson, S., Thebu, J., and Bakarbessy, J. (2007). Population status and internesting movement of leatherback turtles, Dermochelys coriacea, nesting on the northwest coast of Papua, Indonesia. Chelon. Conserv. Biol. 6, 28–36. doi: 10.2744/1071-8443(2007)6[28:PSAIMO]2.0.CO;2
Hoenner, X., Whiting, S. D., Hamann, M., Limpus, C. J., Hindell, M. A., and McMahon, C. R. (2016). High-resolution movements of critically endangered hawksbill turtles help elucidate conservation requirements in northern Australia. Mar. Freshw. Res. 67, 1263–1278. doi: 10.1071/MF15013
Holmes, B. J., Pepperell, J. G., Griffiths, S. P., Jaine, F. R., Tibbetts, I. R., and Bennett, M. B. (2014). Tiger shark (Galeocerdo cuvier) movement patterns and habitat use determined by satellite tagging in eastern Australian waters. Mar. Biol. 161, 2645–2658. doi: 10.1007/s00227-014-2536-1
IMO (2001). Resolution A.917(22): Guidelines for the Onboard Operational Use of Shipborne Automatic Identification Systems (AIS).
James, M. C., Eckert, S. A., and Myers, R. A. (2005). Migratory and reproductive movements of male leatherback turtles (Dermochelys coriacea). Mar. Biol. 147, 845–853. doi: 10.1007/s00227-005-1581-1
Johnson, M. P., and Tyack, P. L. (2003). A digital acoustic recording tag for measuring the response of wild marine mammals to sound. IEEE J. Ocean. Eng. 28, 3–12. doi: 10.1109/JOE.2002.808212
Jonsen, I. (2016). Joint estimation over multiple individuals improves behavioural state inference from animal movement data. Sci. Rep. 6:20625. doi: 10.1038/srep20625
Jonsen, I. D., Flemming, J. M., and Myers, R. A. (2005). Robust state–space modeling of animal movement data. Ecology 86, 2874–2880. doi: 10.1890/04-1852
Jonsen, I. D., Myers, R. A., and Flemming, J. M. (2003). Meta-analysis of animal movement using state-space models. Ecology 84, 3055–3063. doi: 10.1890/02-0670
Jonsen, I., Basson, M., Bestley, S., Bravington, M., Patterson, T., Pedersen, M. W., et al. (2013). State-space models for bio-loggers: a methodological road map. Deep Sea Res. Part II Top. Stud. Oceanogr. 88, 34–46. doi: 10.1016/j.dsr2.2012.07.008
Lascelles, B., Notarbartolo Di Sciara, G., Agardy, T., Cuttelod, A., Eckert, S., Glowka, L., et al. (2014). Migratory marine species: their status, threats and conservation management needs. Aquat. Conserv. 24, 111–127. doi: 10.1002/aqc.2512
Lewison, R., Wallace, B., Alfaro-Shigueto, J., Mangel, J. C., Maxwell, S. M., and Hazen, E. L. (2013). “Fisheries bycatch of marine turtles,” in The Biology of Sea Turtles, Vol. III, eds P. L. Lutz, J. A. Musick, and J. Wyneken (Boca Raton, FL: CRC Press), 329–352.
Mate, B. R., Nieukirk, S. L., and Kraus, S. D. (1997). Satellite-monitored movements of the northern right whale. J. Wildl. Manag. 61, 1393–1405. doi: 10.2307/3802143
Maxwell, S. M., Breed, G. A., Nickel, B. A., Makanga-Bahouna, J., Pemo-Makaya, E., Parnell, R. J., et al. (2011). Using satellite tracking to optimize protection of long-lived marine species: olive ridley sea turtle conservation in Central Africa. PLoS ONE 6:e19905. doi: 10.1371/journal.pone.0019905
Maxwell, S. M., Conners, M. G., Sisson, N. B., and Dawson, T. M. (2016). Potential benefits and shortcomings of marine protected areas for small seabirds revealed using miniature tags. Front. Mar. Sci. 3:264. doi: 10.3389/fmars.2016.00264
Maxwell, S. M., Hazen, E. L., Bograd, S. J., Halpern, B. S., Breed, G. A., Nickel, B., et al. (2013). Cumulative human impacts on marine predators. Nat. Commun. 4:2688. doi: 10.1038/ncomms3688
McMahon, C. R., Bradshaw, C. J., and Hays, G. C. (2007). Satellite tracking reveals unusual diving characteristics for a marine reptile, the olive ridley turtle Lepidochelys olivacea. Mar. Ecol. Prog. Ser. 329, 239–252. doi: 10.3354/meps329239
Metcalfe, K., Agamboué, P. D., Augowet, E., Boussamba, F., Cardiec, F., Fay, J. M., et al. (2015a). Going the extra mile: ground-based monitoring of olive ridley turtles reveals Gabon hosts the largest rookery in the Atlantic. Biol. Conserv. 190, 14–22. doi: 10.1016/j.biocon.2015.05.008
Metcalfe, K., Cardiec, F., Collins, T., De Bruyne, G., McClellan, C., Minton, G., et al. (2015b). A Description of Small-Scale Fisheries in the Republic of Congo and Gabon, Central Africa. A report for the IUCN Marine & Coastal Programme; West and Central Africa. University of Exeter and Wildlife Conservation Society (WCS), 20.
Metcalfe, K., Collins, T., Abernethy, K. E., Boumba, R., Dengui, J. C., Miyalou, R., et al. (2016). Addressing uncertainty in marine resource management; combining community engagement and tracking technology to characterize human behavior. Conserv. Lett. 10, 460–469. doi: 10.1111/conl.12293
Miller, J. (1997). “Reproduction in Sea Turtles,” in The Biology of Sea Turtles, eds P. Lutz and J. Musick (Boca Raton, FL: CDC Press), 51–81.
Montevecchi, W., Hedd, A., Tranquilla, L. M., Fifield, D., Burke, C., Regular, P., et al. (2012). Tracking seabirds to identify ecologically important and high risk marine areas in the western North Atlantic. Biol. Conserv. 156, 62–71. doi: 10.1016/j.biocon.2011.12.001
Myers, R. A., and Worm, B. (2003). Rapid worldwide depletion of predatory fish communities. Nature 423, 280–283. doi: 10.1038/nature01610
Parnell, R., Verhage, B., Deem, S., Van Leeuwe, H., Nishihara, T., Moukoula, C., et al. (2007). Marine turtle mortality in southern Gabon and northern Congo. Mar. Turtle Newslett. 116, 12–14.
Pikesley, S. K., Agamboue, P. D., Bonguno, E. A., Boussamba, F., Cardiec, F., Fay, J. M., et al. (2013a). Here today, here tomorrow: beached timber in Gabon, a persistent threat to nesting sea turtles. Biol. Conserv. 162, 127–132. doi: 10.1016/j.biocon.2012.11.002
Pikesley, S. K., Maxwell, S. M., Pendoley, K., Costa, D. P., Coyne, M. S., Formia, A., et al. (2013b). On the front line: integrated habitat mapping for olive ridley sea turtles in the southeast Atlantic. Divers. Distrib. 19, 1518–1530. doi: 10.1111/ddi.12118
Plot, V., de Thoisy, B., and Georges, J.-Y. (2015). Dispersal and dive patterns during the post-nesting migration of olive ridley turtles from French Guiana. Endanger. Species Res. 26, 221–234. doi: 10.3354/esr00625
Polovina, J. J., Howell, E., Parker, D. M., and Balazs, G. H. (2003). Dive-depth distribution of loggerhead (Caretta caretta) and olive ridley (Lepidochelys olivacea) sea turtles in the central North Pacific: might deep longline sets catch fewer turtles? Fish. Bull. 101, 189–193.
R Core Team (2003). R: A Language and Environment for Statistical Computing. Vienna: R Foundation for Statistical Computing.
Rees, A. F., Al-Kiyumi, A., Broderick, A. C., Papathanasopoulou, N., and Godley, B. J. (2012). Conservation related insights into the behaviour of the olive ridley sea turtle Lepidochelys olivacea nesting in Oman. Mar. Ecol. Prog. Ser. 450, 195–205. doi: 10.3354/meps09527
Revuelta, O., Hawkes, L., León, Y. M., Godley, B. J., Raga, J. A., and Tomás, J. (2015). Evaluating the importance of Marine Protected Areas for the conservation of hawksbill turtles Eretmochelys imbricata nesting in the Dominican Republic. Endanger. Species Res. 27, 169–180. doi: 10.3354/esr00660
Roberts, J. D., and Hamann, M. (2016). Testing a recipe for effective recovery plan design: a marine turtle case study. Endanger. Species Res. 31, 147–161. doi: 10.3354/esr00755
Rosenbaum, H. C., Maxwell, S. M., Kershaw, F., and Mate, B. (2014). Long-range movement of humpback whales and their overlap with anthropogenic activity in the South Atlantic Ocean. Conserv. Biol. 28, 604–615. doi: 10.1111/cobi.12225
Schorr, G. S., Baird, R. W., Hanson, M., Webster, D. L., McSweeney, D. J., and Andrews, R. D. (2009). Movements of Satellite-Tagged Blainville's Beaked Whales Off the Island of Hawaii. DTIC Document.
Scott, R., Hodgson, D. J., Witt, M. J., Coyne, M. S., Adnyana, W., Blumenthal, J. M., et al. (2012). Global analysis of satellite tracking data shows that adult green turtles are significantly aggregated in Marine Protected Areas. Global Ecol. Biogeogr. 21, 1053–1061. doi: 10.1111/j.1466-8238.2011.00757.x
Seney, E. E., and Landry, A. M. Jr. (2008). Movements of Kemp's ridley sea turtles nesting on the upper Texas coast: implications for management. Endanger. Species Res. 4, 73–84. doi: 10.3354/esr00077
Shaver, D. J., and Rubio, C. (2008). Post-nesting movement of wild and head-started Kemp's ridley sea turtles Lepidochelys kempii in the Gulf of Mexico. Endanger. Species Res. 4, 43–55. doi: 10.3354/esr00061
Shaver, D., Schroeder, B., Byles, R., Burchfield, P., Pena, J., Marquez, R., et al. (2005). Movements and home ranges of adult male Kemp's ridley sea turtles (Lepidochelys kempii) in the Gulf of Mexico investigated by satellite telemetry. Chelon. Conserv. Biol. 4, 817–827.
Simpfendorfer, C. A., and Dulvy, N. K. (2017). Bright spots of sustainable shark fishing. Curr. Biol. 27, R97–R98. doi: 10.1016/j.cub.2016.12.017
Suryan, R. M., Dietrich, K. S., Melvin, E. F., Balogh, G. R., Sato, F., and Ozaki, K. (2007). Migratory routes of short-tailed albatrosses: use of exclusive economic zones of North Pacific Rim countries and spatial overlap with commercial fisheries in Alaska. Biol. Conserv. 137, 450–460. doi: 10.1016/j.biocon.2007.03.015
Troëng, S., Evans, D. R., Harrison, E., and Lagueux, C. J. (2005). Migration of green turtles Chelonia mydas from Tortuguero, Costa Rica. Mar. Biol. 148, 435–447. doi: 10.1007/s00227-005-0076-4
Van Buskirk, J., and Crowder, L. B. (1994). Life-history variation in marine turtles. Copeia 1994, 66–81. doi: 10.2307/1446672
Vaudo, J. J., Byrne, M. E., Wetherbee, B. M., Harvey, G. M., and Shivji, M. S. (2017). Long-term satellite tracking reveals region-specific movements of a large pelagic predator, the shortfin mako shark, in the western North Atlantic Ocean. J. Appl. Ecol. doi: 10.1111/1365-2664.12852. [Epub ahead of print].
Waayers, D., Smith, L., and Malseed, B. (2011). Inter-nesting distribution of green turtles (Chelonia mydas) and flatback turtles (Natator depressus) at the Lacepede Islands, Western Australia. J. R. Soc. West. Aust. 94:359–364.
Wallace, B. P., Kot, C. Y., DiMatteo, A. D., Lee, T., Crowder, L. B., and Lewison, R. L. (2013). Impacts of fisheries bycatch on marine turtle populations worldwide: toward conservation and research priorities. Ecosphere 4:art40. doi: 10.1890/ES12-00388.1
Whiting, S. D., Hartley, S., Lalara, S., White, D., Bara, T., Maminyamunja, C., et al. (2006). Hawksbill turtle tracking as part of initial sea turtle research and conservation at Groote Eylandt, Northern Australia. Mar. Turtle Newslett. 114, 14–15.
Whiting, S., Long, J., and Coyne, M. (2007). Migration routes and foraging behaviour of olive ridley turtles Lepidochelys olivacea in northern Australia. Endanger. Species Res. 3, 1–9. doi: 10.3354/esr003001
Whittock, P. A., Pendoley, K. L., and Hamann, M. (2014). Inter-nesting distribution of flatback turtles Natator depressus and industrial development in Western Australia. Endanger. Species Res. 26, 25–38. doi: 10.3354/esr00628
Witt, M. J., Bonguno, E. A., Broderick, A. C., Coyne, M. S., Formia, A., Gibudi, A., et al. (2011). Tracking leatherback turtles from the world's largest rookery: assessing threats across the South Atlantic. Proc. Biol. Sci. 278, 2338–2347. doi: 10.1098/rspb.2010.2467
Witt, M. J., Broderick, A. C., Coyne, M. S., Formia, A., Ngouessono, S., Parnell, R., et al. (2008). Satellite tracking highlights difficulties in the design of effective protected areas for Critically Endangered leatherback turtles Dermochelys coriacea during the inter-nesting period. Oryx 42, 296–300. doi: 10.1017/S0030605308006947
Young, H. S., Maxwell, S. M., Conners, M. G., and Shaffer, S. A. (2015). Pelagic marine protected areas protect foraging habitat for multiple breeding seabirds in the central Pacific. Biol. Conserv. 181, 226–235. doi: 10.1016/j.biocon.2014.10.027
Yurkowski, D. J., Semeniuk, C. A., Harwood, L. A., Rosing-Asvid, A., Dietz, R., Brown, T. M., et al. (2016). Influence of sea ice phenology on the movement ecology of ringed seals across their latitudinal range. Mar. Ecol. Prog. Ser. 562, 237–250. doi: 10.3354/meps11950
Keywords: home range, marine protected area, shipping, bycatch, dive behavior, Central West Africa
Citation: Dawson TM, Formia A, Agamboué PD, Asseko GM, Boussamba F, Cardiec F, Chartrain E, Doherty PD, Fay JM, Godley BJ, Lambert F, Koumba Mabert BD, Manfoumbi JC, Metcalfe K, Minton G, Ndanga I, Nzegoue J, Kouerey Oliwina CK, Du Plessis P, Sounguet G-P, Tilley D, Witt MJ and Maxwell SM (2017) Informing Marine Protected Area Designation and Management for Nesting Olive Ridley Sea Turtles Using Satellite Tracking. Front. Mar. Sci. 4:312. doi: 10.3389/fmars.2017.00312
Received: 14 April 2017; Accepted: 15 September 2017;
Published: 29 September 2017.
Edited by:
Ellen Hines, San Francisco State University, United StatesReviewed by:
Mariana M. P. B. Fuentes, Florida State University, United StatesMario Santoro, Istituto Zooprofilattico Sperimentale del Mezzogiorno, Italy
Copyright © 2017 Dawson, Formia, Agamboué, Asseko, Boussamba, Cardiec, Chartrain, Doherty, Fay, Godley, Lambert, Koumba Mabert, Manfoumbi, Metcalfe, Minton, Ndanga, Nzegoue, Kouerey Oliwina, Du Plessis, Sounguet, Tilley, Witt and Maxwell. This is an open-access article distributed under the terms of the Creative Commons Attribution License (CC BY). The use, distribution or reproduction in other forums is permitted, provided the original author(s) or licensor are credited and that the original publication in this journal is cited, in accordance with accepted academic practice. No use, distribution or reproduction is permitted which does not comply with these terms.
*Correspondence: Tiffany M. Dawson, tdaws001@odu.edu