Autonomous Coral Reef Survey in Support of Remote Sensing
 Steven G. Ackleson
 Joseph P. Smith
 Luis M. Rodriguez
 Wesley J. Moses
 Brandon J. Russell
- 1Naval Research Laboratory, Washington, DC, United States
- 2United States Naval Academy, Annapolis, MD, United States
- 3Department of Marine Sciences, University of Connecticut, Avery Point, Groton, CT, United States
An autonomous surface vehicle instrumented with optical and acoustical sensors was deployed in Kane'ohe Bay, HI, U.S.A., to provide high-resolution, in situ observations of coral reef reflectance with minimal human presence. The data represented a wide range in bottom type, water depth, and illumination and supported more thorough investigations of remote sensing methods for identifying and mapping shallow reef features. The in situ data were used to compute spectral bottom reflectance and remote sensing reflectance, Rrs,λ, as a function of water depth and benthic features. The signals were used to distinguish between live coral and uncolonized sediment within the depth range of the measurements (2.5–5 m). In situ Rrs, λ were found to compare well with remotely sensed measurements from an imaging spectrometer, the Airborne Visible and Infrared Imaging Spectrometer (AVIRIS), deployed on an aircraft at high altitude. Cloud cover and in situ sensor orientation were found to have minimal impact on in situ Rrs, λ, suggesting that valid reflectance data may be collected using autonomous surveys even when atmospheric conditions are not favorable for remote sensing operations. The use of reflectance in the red and near infrared portions of the spectrum, expressed as the red edge height, REHλ, was investigated for detecting live aquatic vegetative biomass, including coral symbionts and turf algae. The REHλ signal from live coral was detected in Kane'ohe Bay to a depth of approximately 4 m with in situ measurements. A remote sensing algorithm based on the REHλ signal was defined and applied to AVIRIS imagery of the entire bay and was found to reveal areas of shallow, dense coral and algal cover. The peak wavelength of REHλ decreased with increasing water depth, indicating that a more complete examination of the red edge signal may potentially yield a remote sensing approach to simultaneously estimate vegetative biomass and bathymetry in shallow water.
Introduction
Coral reefs are among the most diverse and productive ecosystems worldwide (Odum and Odum, 1955) and provide a variety of goods and services to many tropical and sub-tropical coastal nations (Spurgeon, 1992; Moberg and Folke, 1999). Coral reef health and diversity are on the decline worldwide in response to local human impacts and global changes in climate (Hughes et al., 2003) and this trend is expected to continue (Kleypas et al., 1999; Anthony et al., 2008; Hoegh-Guldberg, 2011). In response, programs to monitor the health of coral reef ecosystems have been and continue to be implemented, including remote sensing in the visible and near infrared portions of the light spectrum (Dekker et al., 2011). Likewise, more capable remote sensing systems are planned with features that are designed to enhance coral reef monitoring on a global scale. For example, the NASA Hyperspectral Infrared Imager (HyspIRI) is envisioned as an imaging spectrometer operating in the visible to the near infrared region of the spectrum (0.38–2.5 μm, 10 nm channels) with a nadir spatial resolution of 30 m (Lee et al., 2015).
The success of any remote sensing application depends upon the collection of key environmental information that can be used to vicariously calibrate at-sensor radiance, test atmospheric correction procedures, and develop, test, and validate product algorithms. For shallow water aquatic applications, data sets that include water optical properties, depth, and benthic cover are needed that span appropriate length scales (e.g., >1,000 m) and with sufficient spatial resolution (e.g., <1 m). This is especially true of spatially complex coral reef ecosystems, but the collection of such observations with diver-based approaches alone is not feasible. in situ measurements of benthic reflectance using diver-operated spectrometers have, for example, highlighted the spectral differences between various coral reef components and aided assessments of remote sensing systems for coral reef mapping (Hochberg and Atkinson, 2000; Hochberg et al., 2003; Kutser et al., 2003), but field operations are laborious and inefficient for surveying purposes. In situ photogrammetric and spectral imaging approaches to mapping coral reef structure have been reported using diver-operated and towed systems (e.g., Gleason et al., 2007; Lirman et al., 2007; Shihavuddin et al., 2013). While these approaches have yielded high-quality photo mosaics and thematic images of benthic features that can be used to validate remote sensing products, such as benthic cover, the data are generally qualitative from a radiometric perspective and of limited use in developing and testing shallow-water light models.
To address these limitations, this research explored the use of an autonomous surface vessel (ASV) instrumented with calibrated radiometers and a side-scan sonar for surveying large areas of shallow coral reef environments in high spatial resolution in support of remote sensing operations. To illustrate the potential utility of the data from a remote sensing perspective, a coral biomass detection algorithm was developed based on reflectance features within the red and near-infrared portions of the spectrum and applied to data collected in the same time frame using an airborne imaging spectrometer deployed at high-altitude. It was shown that high resolution optical and acoustical surveys can be conducted with minimal human presence resulting in high-quality data necessary to support remote sensing operations and algorithm development. The work was conducted in Kane'ohe Bay, Hawai'i, to assess the potential application of HyspIRI data in studies of coral reef health in support of planning for the NASA HyspIRI mission (https://hyspiri.jpl.nasa.gov).
Materials and Methods
The approach consisted of instrumenting a small ASV with synchronized optical and acoustical sensors, deploying the system to collect in situ observations in high spatial resolution on and around a small patch reef within Kane'ohe Bay, using the observations to derive shallow benthic properties of ecological importance, including water depth, benthic cover and reflectance, relating these properties to computations of water column reflectance, and comparing the in situ measurements with similar remotely sensed observations corrected for atmospheric effects. Measurements of water optical properties, collected manually, were used to aid the analysis of the autonomous data. The data processing procedures and underpinning radiative transfer theory are presented briefly in the following sections.
Study Site
Kane'ohe Bay is a semi-enclosed embayment (surface area of 41.4 km2) located on the east coast of O'ahu, Hawai'i. The bay is bounded on the eastern side by a barrier reef that is cut by two tidal channels that bracket a semi-exposed barrier island, Ahu O Laka. The bay is flushed with clear oceanic waters driven by waves topping the barrier reef and tidal exchange through the channels. Seaward of the barrier island, within the depth range 0.3–1.2 m, the bottom consists almost entirely of mixed corals and sand (Jokiel, 1991). Landward of the barrier island, the bay is characterized as an estuarine lagoon of average depth 19 m and highlighted by numerous patch reefs with depths of less than 1 m that are partially exposed during extreme spring tides. Shallow fringing reefs are present along most of the shoreline. Bottom sediments within the bay are composed of coral rubble and gray coral mud.
The study was focused primarily on a 33,000 m2 patch reef located southeast of Moku o Lo'e (Coconut Island) in the southern portion of Kane'ohe Bay (centered at 21.4304°N latitude and 157.7849°W longitude, Figure 1). The reef, referenced as the coconut patch reef, forms a nearly flat plateau that rises abruptly from the surrounding bay floor to an average depth of between 3 and 4 m. The reef was dredged during World War II in order to make room for a seaplane base (Hunter and Evans, 1995). Since that time, the area has become partially recolonized by coral and associated reef organisms that have gradually built up portions of the reef to within 2.5 m of the surface.
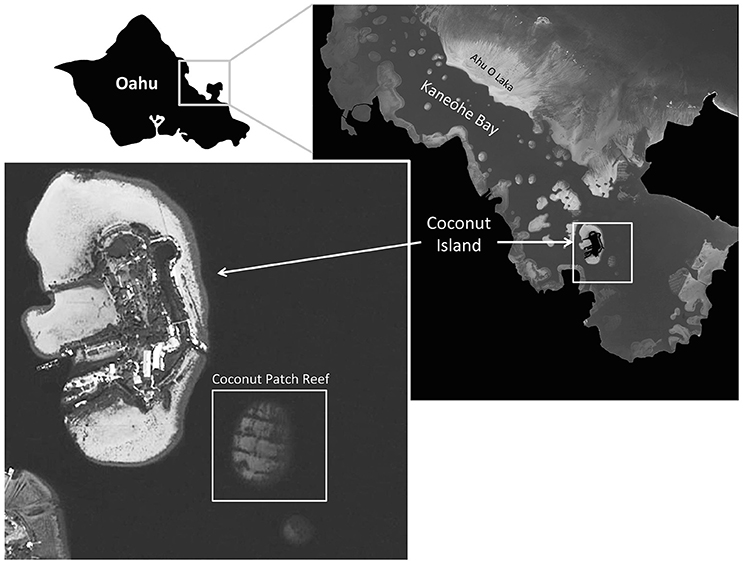
Figure 1. The study location, Kane'ohe Bay, is located on the east coast (windward side) of O'ahu, Hawai'i. In situ physical and optical measurements were collected across a shallow patch reef located off the southeast shore of Coconut Island in the southern portion of the bay.
Measurements
Physical and optical data were collected in situ on 12 February 2017 using sensors deployed with a small, commercially available, coastal kayak equipped for autonomous operations (Figure 2) and described in detail by Curcio et al. (2005) and Wood et al. (2007). The ASV received GPS signals and navigated to pre-defined waypoints by controlling the speed and orientation of an articulating electric trolling motor located in the stern and powered with a 12 V marine battery. Autonomous control was achieved with a 3D Robotics Pixhawk auto-controller and GPS with compass and mission planning and execution was conducted using Mission Planner software. A Lowrance Structure Scan 3-D side-scan sonar and depth finder was mounted through the center of the keel and operated at 800 KHz, yielding bathymetry and high-resolution acoustical images of the surrounding bay floor. SonarTRX Pro side-scan sonar software was used to process and view sonar images as geo-referenced mosaics and to extract bathymetric information including water depth and benthic roughness. Surfer v.11 2D & 3D mapping and visualization software was used to create geo-referenced, 2-D bathymetric contour plots and 3-D bathymetric contour surfaces using Kriging interpolation.
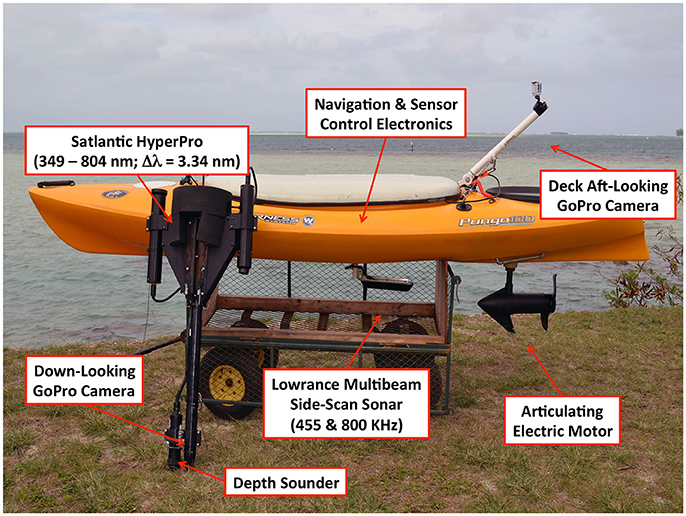
Figure 2. A survey of the coconut patch reef was conducted on 12 February 2017 using an instrumented, autonomous kayak capable of navigating pre-planned routes and collecting simultaneous optical and acoustical observations of benthic features in high spatial resolution.
A Satlantic HyperPro hyperspectral radiometer buoy was attached to the ASV with a power and communications cable and towed at a trailing distance of approximately 3 m, in order to avoid shadows cast by the ASV hull. The system measured downwelling irradiance above the water surface Ed, λ(0+) and upwelling radiance just below the surface at a depth of 0.24 m Lu, λ(0.24) in 137 spectral bands between 349 nm and 804 nm with an average half-power bandwidth of 3.34 nm. The Ed, λ(0+) sensor was fitted with a diffuse cosine collector. The in-water field of view (FOV) of the Lu, λ(0.24) sensor was 8.5°. A weighted keel of length 1 m was built into the radiometer buoy and provided a relatively stable, vertical orientation. A tilt and roll sensor provided deviations in radiometer orientation (measured in degrees) from a horizontal plane in two orthogonal directions. A Teledyne Benthos PSA-916 acoustical depth sounder was attached to the keel of the radiometer at a depth of 0.95 m, and it measured the distance to the bottom Dr m beneath the radiometer with an accuracy of ±0.01 m. Therefore, the total water column depth was computed as D = Dr + 0.95.
A down-looking GoPro camera (GP1), enclosed in a watertight housing, was affixed to the bottom of the radiometer keel, and it provided high definition photographic documentation of shallow benthic features. The in-water FOV of the camera was determined to be 83.4° in the long direction and 63.9° in the short direction. It was uncertain precisely where the radiometer sampled within the GP1 imagery. However, care was taken to visually aligned the camera with the radiometer keel to ensure that the radiometer subsampled the GP1 frames simultaneously. A second GoPro camera (GP2) was affixed to the aft deck of the ASV and pointed toward the stern to provide simultaneous photographic documentation regarding the orientation of the radiometer, the sea state, and atmospheric conditions. All data were collected at 1 Hz or greater and time-stamped for post processing.
The ASV survey consisted of a 3 km track, starting within a small boat basin on the southeast shore of Coconut Island, extending out of the basin through a narrow cut and to the study area, where nine East-West transects (labeled T1 through T9 from South to North) were conducted over the coconut patch reef before returning to the boat basin (Figure 3). The average speed of the ASV was approximately 1.8 km h−1, yielding a set of optical and acoustical measurements every 0.5 m.
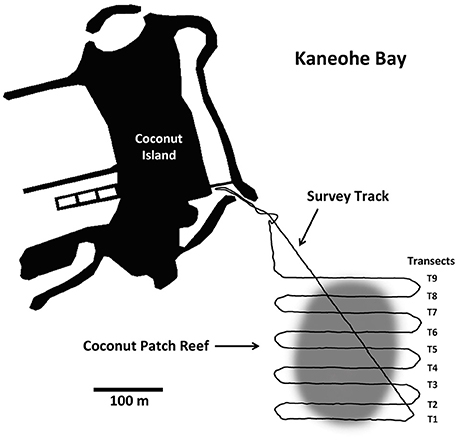
Figure 3. The ASV survey route (black line) on 12 February 2017, included nine East-West transects over the coconut patch reef labeled T1 through T9 from South to North.
Water column properties within 2 m of the surface, including spectral absorption (apg,λ m−1), attenuation (cpg,λ m−1), and backscatter (bbp,λ m−1) due to particulate and dissolved impurities, were collected over the coconut patch reef from a small boat several days after the ASV survey, on 17 February 2017, using equipment and methods reported by Dierssen and Russell (2017). In addition, fluorometric chlorophyll, Fchl mg m−3, water temperature t°C, and salinity s psu were collected on 16 and 18 February using a pre-calibrated, self-logging YSI EXO2 water quality sonde deployed by hand from a second, manned kayak.
A hyperspectral image of the study site was collected on 3 March 2017 using the Jet Propulsion Laboratory Airborne Visible Infrared Imaging Spectrometer-Classic sensor (AVIRIS) deployed on the NASA ER-2 aircraft at an altitude of approximately 19.8 km (Figure 4). AVIRIS measures radiance in 224 contiguous bands between 400 nm and 2,500 nm with a nominal spectral channel full-width at half maximum and sampling interval of 10 nm (Vane et al., 1993). At the deployed altitude, the ground sampling distance was approximately 7 m. The overflight occurred at 19:00 GMT, 09:00 local time, with the sky partly cloudy, but clear over most of Kane'ohe Bay, including the coconut patch reef.
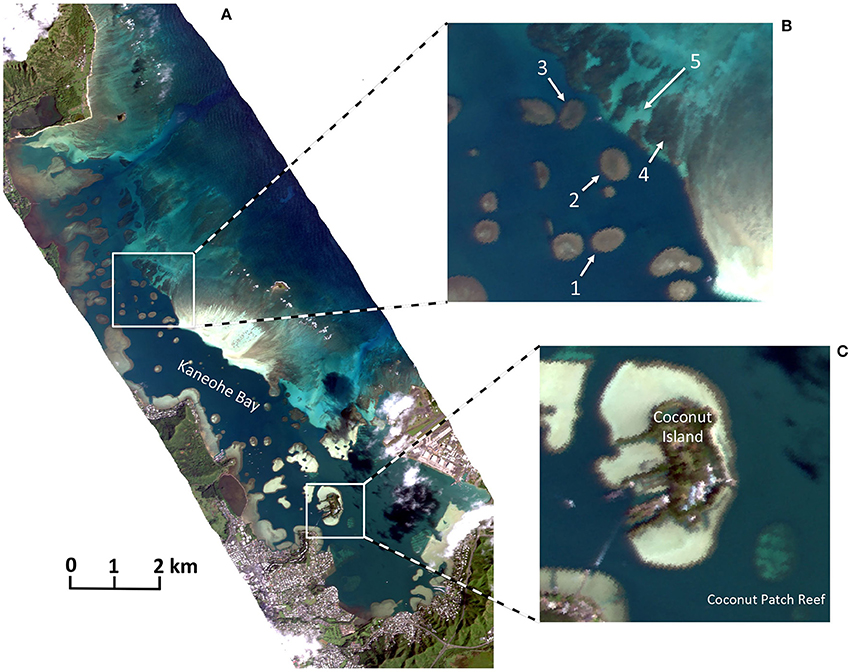
Figure 4. (A) Hyperspectral image of Kane'ohe Bay collected on 3 March 2017 at 19:00 GMT, 09:00 local time, using the Jet Propulsion Laboratory Airborne Visible Near Infrared Imaging Spectrometer - Classic (AVIRIS) deployed on the NASA ER-2 aircraft at an altitude of approximately 19.8 km. The ground sampling distance was approximately 7 m. (B) Reef areas examined for spectral reflectance. (C) The coconut patch reef, where ASV surveys were conducted.
Theoretical Considerations and Computations
In Situ Observations
Radiometer buoy data were used to compute in-water radiance reflectance at 0.24 m depth as
In order to perform this computation, the downwelling irradiance at 0.24 m must be computed from the measured downwelling irradiance impinging upon the surface and knowledge of the optical properties of the water;
where nw is the real portion of the refractive index of water relative to air (≈1.34), is the surface reflectance of downwelling irradiance illuminating the surface (≈0.02), and Kd, λ is the diffuse attenuation of downwelling irradiance within the top 0.24 m of the water column. The exponential term in Equation (2) defines how much downwelling irradiance is transmitted to the depth of the down-looking radiometer and Kd, λ is a function of the absorbing and scattering properties of the water, including particulate and dissolved matter (Mobley, 1994 and references cited therein). Kirk (1984) reported an empirical relationship for Kd, λ based on numerical simulations of radiative transfer;
where aλ (= aw, λ + apg, λ) is the total absorption coefficient of the water mixture and bλ (= bw, λ + cpg, λ − apg, λ) is the total scattering coefficient of the water mixture. The subscript w refers to pure water, the properties of which are considered constant (Smith and Baker, 1981; Pope and Fry, 1997), and μd is the average cosine of the in-water, near-surface, down-welling radiance distribution. In relatively clear water, as is the case in Kane'ohe Bay, μd may be approximated as the cosine of the in-water solar zenith angle θs, i.e., after refraction at the water surface; .
Following shallow water radiative transfer theory and modeling reported by Philpot (1987, 1989) and Maritorena et al. (1994), the in-water reflectance at 0.24 m depth may be expressed as
where the subscript ∞ refers to the reflectance of an optically deep water column and ρb, λ is the irradiance reflectance of the ocean floor. The diffuse attenuation for upwelling irradiance Ku, λ was computed using Eqn. (3) and replacing μd with uu = 0.7, the approximate average cosine for upward propagating light. As D ⇒ ∞, rrs, λ(0.24) approaches the optically deep solution, while as D ⇒ 0.24, the depth of the in-water radiometer, rrs, λ (0.24) approaches , the radiance reflectance of the bottom substrate. Rearranging Equation (4) for benthic reflectance yields
The unknown quantity in Equations (4, 5) is the reflectance of optically deep water. While the maximum depth encountered within the study site was approximately 14 m, this may not be deep enough to provide an accurate deep-water signal, especially in the green portion of the spectrum where transmittance is expected to be greatest and where the bottom substrate, uncolonized calcareous sediment, can be highly reflective. Gordon et al. (1988) provides an accurate empirical representation of rrs, λ, ∞ as a function of , where bb (= bbp + bbw) is the total backscatter coefficient for the water mixture;
and gi are coefficients empirically derived from a Monte Carlo radiative transfer model. Lee et al. (1999) provided updated values based on a large number of simulations using the community model Hydrolight (Mobley and Sundman, 2012); g1 = 0.084 and g2 = 0.125. Thus, benthic irradiance reflectance was computed from measured above water irradiance illumination, in-water, upwelling radiance, water depth, and estimated values of diffuse attenuation and deep-water reflectance from independent measurements of water optical properties.
In-water reflectance of optically shallow water was computed using ρb, λ, rrs, λ, ∞, and D to constrain Equation (5);
The implicit assumption in Equation (7) is that the deep-water reflectance measured at 0.24 m below the surface is equal to the reflectance measured immediately below the surface (zero depth). While reflectance is a function of radiance distribution and both μd and uu are known to change with depth independent of the water optical properties (Mobley, 1994 and references cited), changes between the surface and 0.24 m in the absence of strong bottom effects are expected to be negligible.
Finally, following Lee et al. (1999), above-water remote sensing reflectance, Rrs = Lu(0+)/Ed(0+), was computed from the in-water reflectance as
Remote Sensing Observations
In order to compare the remotely sensed observations with the ASV observations, AVIRIS measurements of at-sensor radiance, Ls,λ, must be corrected for atmospheric effects and the resulting radiances converted to remote sensing reflectance, [Rrs, λ]AVIRIS. Since no field measurements were collected at the time of the AVIRIS overpass, the atmospheric correction procedure must be completely image-based. Following procedures summarized by Chavez (1996),
where τ is the atmospheric transmittance in the direction of the sensor, Eo, λ(0+) is the downwelling solar irradiance at the water surface on a plane perpendicular to the solar direction, and θs is the solar zenith angle at the location and time of imaging. Chavez estimated that under a clear atmosphere, τ ≈ 0.81 for Landsat TM Bands 1 through 4, which span the spectral range 450–900 nm. La, λ is approximated with the at-sensor radiance representing dark pixels within the image for which surface reflectance is nearly zero; [Ls, λ]dark ≈ La, λ. Substituting the estimates for τ and La, λ into Equation (9) yields.
For the AVIRIS image of Kane'ohe Bay, a dark shadow cast upon a deep water area by a cloud, located slightly south of the coconut patch reef, was used to compute [Ls, λ]dark. Note that this likely yielded a slight over-adjustment as the shadowed water-leaving radiance, while quite small, is not zero. Finally, AVIRIS reflectance was corrected for sunglint, i.e., light reflected from the water surface, using methods reported by Hedley et al. (2005).
Equation (10) has been shown to work reasonably well over land where targets may be treated as Lambertian reflectors. However, over water where Rrs, λ is affected by reflectance and transmittance at the air/water interface, the amount of light entering the water and, thus, available to be reflected must also be taken into consideration. For θs < 30°, surface reflectance, ρs, ≈ 0.02 and about 98% of the energy enters the water. However, as θs increases, so does ρs according to the equations of Fresnel (see (Mobley, 1994) and citations referenced). Replacing Eo, λ(0+) in Equation (10) with (1 − ρs) Eo, λ(0+) yields.
At the time of the AVIRIS overflight, θs ≈ 61.4° and the corresponding Fresnel reflectance of unpolarized light, assuming the water surface to be flat, was ρs ≈ 0.067. Equation (11) was used to compute reflectance for all cloud-free water pixels within the AVIRIS image.
Results
The ASV survey of coconut reef was conducted under a clear to partly cloudy sky and low wind. The sea surface varied between smooth and slightly choppy. Acoustical measurements indicated that the reef rose up abruptly from the surrounding bay floor from a depth of approximately 14 m to an average depth on the reef plateau of 3.4 ± 0.57 m. (The confidence range, here and throughout the remainder of the paper, is expressed as plus or minus one standard deviation.) The side-scan sonar recorded higher acoustic backscatter in the central portion of the reef (i.e., lighter tones in the sonar image) and lower returns (i.e., darker tones in the sonar image) in areas mostly around the periphery (Figure 5). Imagery from the GP1 camera revealed benthic features down to approximately D = 5 m. Visual inspection of the imagery indicated that the higher acoustical returns represented uncolonized sediment while the lower returns represented areas colonized by coral. Coral areas tended to be shallower than adjacent areas of uncolonized sediment as a result of the coral structures having been built up over time by reef-forming organisms.
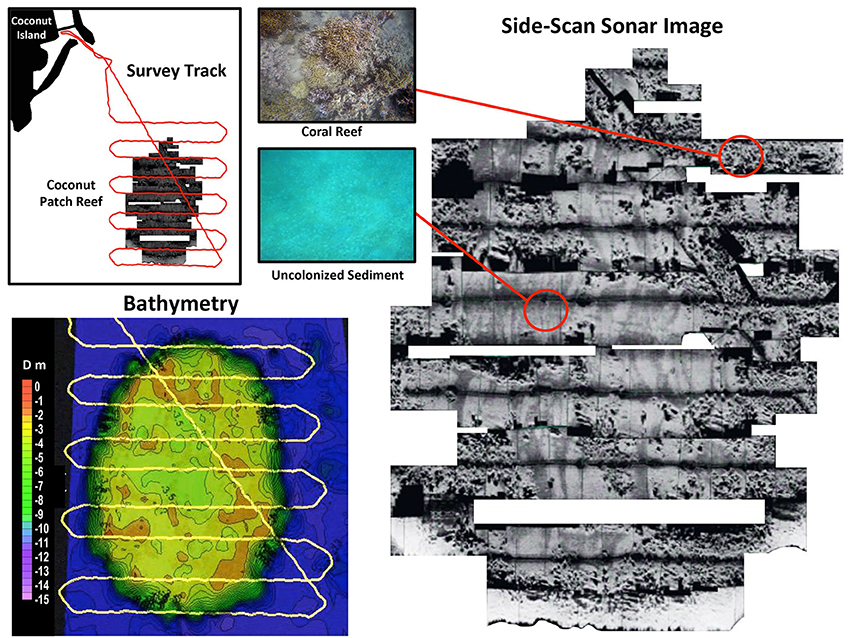
Figure 5. Acoustical data from an autonomous survey was used to map bathymetry within and around the coconut patch reef and identify areas colonized by coral (dark, heterogeneous tones in acoustical backscatter) and uncolonized sediment (lighter, more homogeneous tones). Visual inspection of imagery from a down-looking, in-water camera (GP1) was used to validate the interpretation of the acoustical backscatter signals.
Water Properties
In situ measurements made several days after the ASV survey indicated stable, near-surface temperatures, ranging between 23.5° and 24.6°C, and salinities, ranging between 33.45 and 33.6 psu. Total absorption due to impurities increased toward the blue portion of the spectrum, e.g., apg, 414 = 0.186 m−1, and indicated the presence of small quantities of colored dissolved organic matter (CDOM). Fluorometric chlorophyll concentrations ranged from Fchl = 0.2 to Fchl = 0.8 mg m−3. Light scatter due to suspended particulate matter was relative low, e.g., bp, 400 = 0.82 m−1, indicating relatively clear water, and decreased non-linearly with increasing wavelength, as is typical of coastal marine particles (Babin et al., 2003). Likewise, backscatter measured at three discrete wavelengths decreased with increasing wavelength; bbp, 470 = 0.0106 ± 0.0007 m−1, bbp, 532 = 0.0096 ± 0.0005 m−1, and bbp, 660 = 0.0065 ± 0.0004 m−1. The average fractional backscatter, , at each wavelength was = 0.0149, = 0.0141, and = 0.0117.
Equation (3) was used to compute near-surface Kd for optically deep water using total absorption and light scatter computed from in situ measurements of apg and bp = cpg − apg, literature values for pure water (Smith and Baker, 1981; Pope and Fry, 1997), and the average solar zenith angle during the February 12 survey, θs = 54.6° (Figure 6). A slight rise in Kd within the blue portion of the spectrum was likely due to the combined effects of absorption by small quantities of CDOM while the shape of the spectrum within the red portion was attributed to absorption by pure water. Likewise, in-water optically deep reflectance was computed using Equation (6), where and was the spectrally averaged fraction of light scatter in the backward direction (≈0.0136). Equation (8) was used to compute Rrs, λ, ∞. Similar to the Kd spectrum, the spectral shape of Rrs, λ, ∞ indicated that the water column was relatively clear (low reflectance) but, contained small quantities of CDOM (e.g., slightly depressed reflectance at wavelengths < 500 nm), and low concentrations of suspended particles (e.g., slightly elevated reflectance at wavelengths > 500 nm).
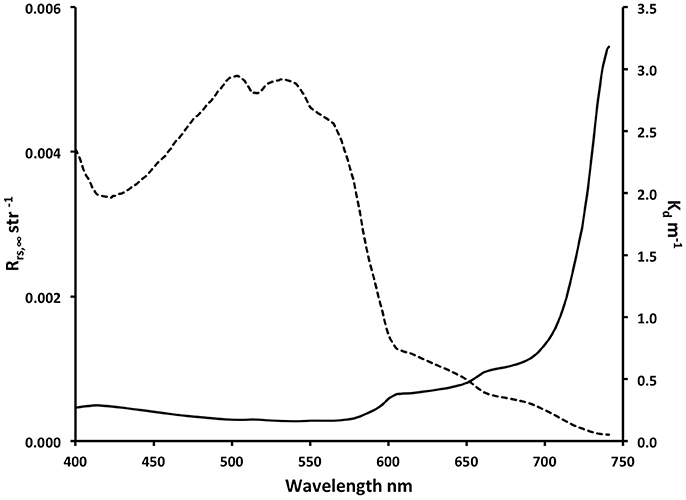
Figure 6. Remote sensing reflectance Rrs, ∞ str−1 (dashed curve) and diffuse attenuation of downwelling irradiance Kd, λ m−1 (solid curve) computed from near-surface, in situ optical measurements collected over the coconut patch reef.
ASV Survey
In-Water Reflectance
In-water reflectance was highly variable as the radiometer passed over shallow areas of the coconut patch reef due to reflectance from benthic features (e.g., rrs, 550, shown in Figure 7A).
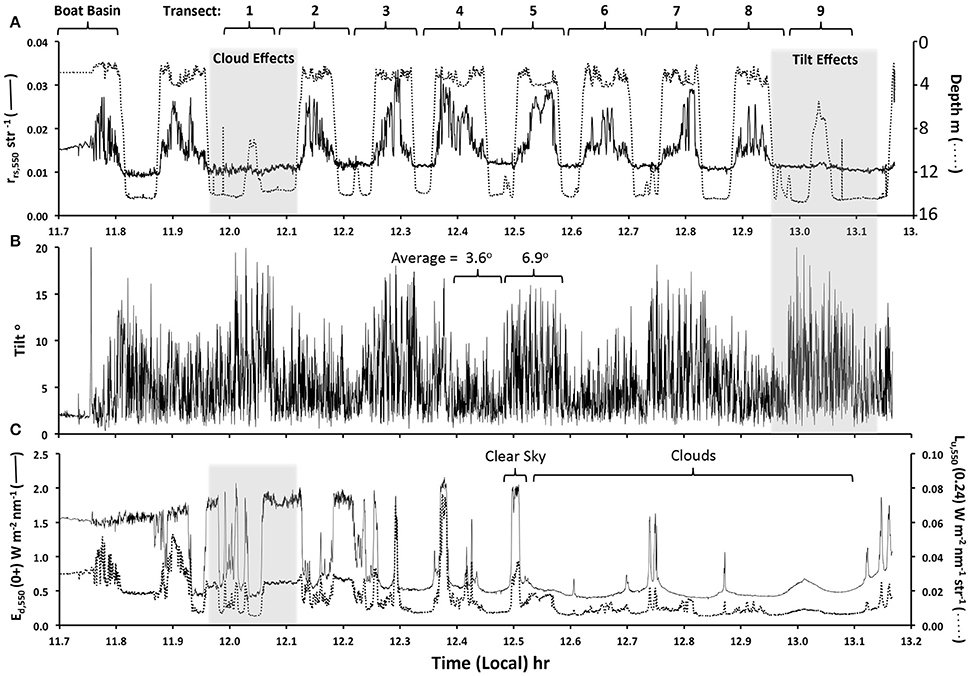
Figure 7. Radiometer data collected along the entire ASV survey course. The boat basin and transects over the coconut patch reef are indicated at the top of the figure and shaded areas indicate portions of the data where variability in cloud effects and radiometer orientation were apparent. (A) In-water reflectance (solid curve) and water bottom depth (dotted curve) along the ASV survey course. (B) Deviation of the radiometer from vertical. (C) Downwelling irradiance, λ = 550 nm, measured above the water surface (solid curve) and in-water, upwelling radiance measured at a depth of 0.24 m.
In comparison, adjacent deep-water areas, D ≈ 14 m, were consistently darker than the shallow reef features and much less variable.
Along the course of the ASV survey, the in situ radiometer orientation changed with the tow direction (Figure 7B) and variability was attributed to how the radiometer interacted with the local wave field. Along eastward transects (T2, T4, T6, and T8), the radiometer deviated an average of 3.6° from a vertical orientation and the maximum deviation at times exceeded 10°. When towed in a westward direction (T1, T3, T5, T7, and T9), the average radiometer deviation from a vertical orientation increased to 6.9° and the maximum deviation exceeded 20°. In order to assess the impact of sensor orientation on the computed reflectance, subsets of the data were examined where tow direction resulted in large changes in radiometer orientation and, at the same time, the effects of bottom reflectance were small and surface illumination was relatively stable. This situation occurred within the time interval between 12.95 and 13.14 h (shaded area within the right hand side of Figure 7B) when the radiometer was over deep water. The sky was fairly overcast, but illumination was reasonably stable. Radiometer orientation changed on average more than 10° as the ASV turned from the eastward T8 track to the westward T9 track and then back toward the boat basin. At the same time, variability in rrs, 550(0.24) was small, with the exception of a slight increase at 13.05 h when the radiometer passed over the northern edge of the reef and D decreased to 5 m. Thus, within the observed range of radiometer motion, radiometer orientation appeared to have a minor impact on computed reflectance relative to the dominant environmental factors, i.e., water depth and bottom type.
In addition to radiometer orientation, illumination due to clouds changed significantly along the course of the survey (Figure 7C). Downwelling irradiance, e.g., Ed, 550, varied by a factor of four, ranging from approximately 0.5 W m−2 nm−1 under clouds to >2 W m−2 nm−1 under direct, un-obstructed sunlight. At the same time, as in the case of the radiometer orientation, the response of rrs, 550(0.24) was quite small, as illustrated by the observations within the time interval between 11.96 and 12.12 h (i.e., the shaded area on the left hand side of Figure 7C).
Benthic Cover
The in-water, down-looking imagery (GP1 data) effectively documented the condition of the shallow bottom where D < 5 m (Figure 8). Visual inspection of the imagery indicated that, within the boat basin, the bottom was dominated by turf algae, mixed debris of terrigenous origin, and the frequent presence of benthic fauna, such as the sea cucumber O. spectabilis. The floor of the coconut patch reef, on the other hand, was either comprised of a mixed community of coral, dominated by Porites, or uncolonized sediment and silt.
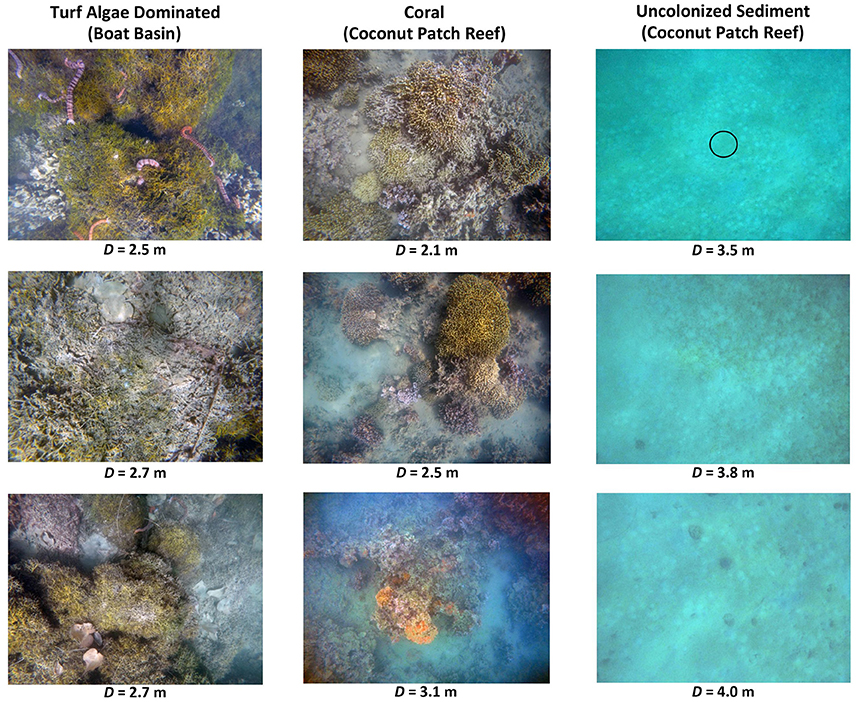
Figure 8. In-water, down-looking imagery (GP1 camera) of selected benthic conditions along the ASV survey track over the coconut patch reef. The approximate field of view of the in-water, down-looking radiometer is shown as a circle centered on the top right plate representing uncolonized sediment at a depth of 3.5 m.
Benthic Reflectance
Benthic reflectance, ρb,λ, was computed according to Equation (5) for all areas where D ≤ 5 m, the maximum depth at which benthic features could be identified within the GP1 imagery. In order to assess variability in ρb, λ as a function of bottom type, spectra representing coral and uncolonized sediment were selected based on visual inspection of the GP1 imagery. Given the uncertainty in the location of the radiometer sampling within the GP1 FOV (the approximate size of the radiometer FOV is shown as a circle in center of the upper right panel of Figure 8), radiometer data were selected for which the entire corresponding GP1 frame appeared to represent the bottom type of interest, i.e., the FOV was either all coral or all uncolonized sediment. Data representing images with a mixture of bottom type were not included in the analysis. Benthic reflectance representing the two bottom types indicated two distinct reflectance spectra with little overlap throughout the visible and near infrared spectrum (Figure 9). The average water depth for coral was D = 3.0 ± 0.5 m, and for uncolonized sediment the average was D = 3.9 ± 0.6 m.
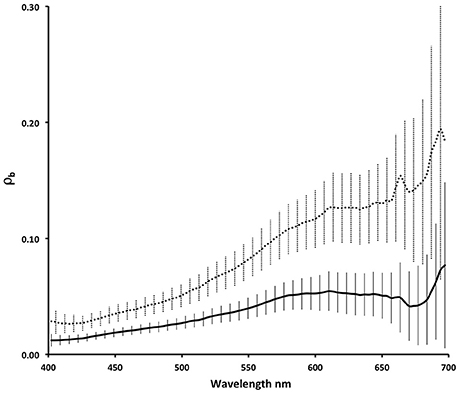
Figure 9. Mean benthic reflectance of coral (solid curve) and uncolonized sediment (dotted curve) within the coconut patch reef computed using Equation (5), where D < 5 m. Data were parsed based on manual interpretation of in-water imagery (GP1 camera). Vertical bars indicated ±1 standard deviation relative to the mean.
The coral reflectance spectra were similar to the lower range in reflectance of brown hermatypic coral and the uncolonized sediment spectra were similar to terrigenous mud and lower than the reflectance typical of calcareous sand (Hochberg et al., 2003). The low reflectance of the uncolonized sediment was in agreement with previous descriptions of bottom sediments in Kane'ohe Bay as coral ruble, sand, and “gray coral mud” (Bahr et al., 2015 and references cited therein). While the spectra were parsed based upon the apparent dominate bottom type within the GP1 images, it was likely that each spectrum represents a combination of bottom types. For example, gray colored sediment was often apparent within the GP1 imagery covering small spaces between coral features. Furthermore, the benthic environment had a heterogeneous appearance, such that the likelihood of obtaining a pure spectrum for either bottom type decreased with increasing benthic area viewed by the radiometer. Given the field of view of the down-looking radiometer (8.5°), a measurement 2 m from the bottom would integrate ρb, λ across an area of 0.08 m2 (horizontal length scale = 0.31 m), while a measurement made at an altitude of 4 m from the bottom would integrate over 0.31 m2 (horizontal length scale = 0.63 m).
Similar to published in situ measurements, ρb, λ increased rapidly for both uncolonized sediment and coral within the red portion of the spectrum, λ > 680 nm. When live vegetative biomass is present, the absorption of light by chlorophyll leads to a depression in reflectance within a narrow spectral region centered at roughly 675 nm, resulting in an abrupt increase in reflectance at longer wavelengths. This feature, often referred to as the red edge (e.g., Gates et al., 1965), is well documented for healthy terrestrial plants and aquatic grasses (Felella and Penuelas, 1994; Fyfe, 2003; Zimmerman, 2003) and it is apparent in published measurements of ρb, λ for both live coral and, to a lesser extent, uncolonized sediment (Hochberg et al., 2003).
In Situ Remote Sensing Reflectance
Remote sensing reflectance Rrs, λ was computed for each observation along the ASV track using Equation (8), where D < 5 m. The results represented the combined effects of ρb, λ and bottom depth, assuming stable water optical properties. Parsing the data into primary bottom types using the GP1 imagery indicated that Rrs, λ representing coral, turf algae, and uncolonized sediment remained distinct within the depth range observed (2 m ≤ D ≤ 5 m) and that each was distinguishable from the adjacent deep water signature (Figure 10).
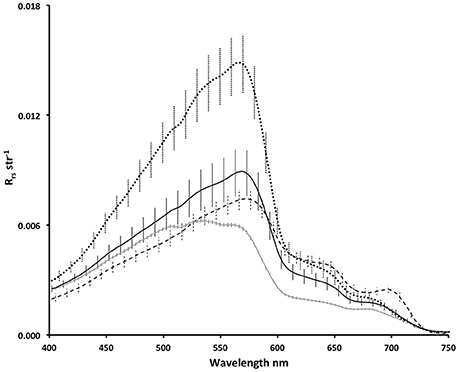
Figure 10. Mean remote sensing reflectance of coral (solid black curve) and uncolonized sediment (dotted black curve) on the coconut patch reef where D < 5 m, turf algae within the boat basin on Coconut Island, D < 2 m (dashed black curve), and over deep water, D > 14 m (solid gray curve), adjacent to the patch reef. Data representing shallow water were parsed on bottom type gleaned from manual interpretation of in-water imagery (GP1 camera). Vertical bars indicated ±1 standard deviation relative to the mean.
The reflectance spectra were slightly depressed in the blue portion of the spectrum, λ < 550 nm, typical of absorption by CDOM. Variability around the mean of each class represented the combined effects of ρb, λ and bottom depth, assuming that water optical properties were stable and that the influences of sensor orientation and illumination were small. Areas of uncolonized sediment were quite bright relative to the coral, turf algae, and deep-water reflectance, where λ ≤ 600 nm. Reflectance from coral and algae were generally greater than the deep-water signals, where λ ≤ 550 nm. While there were areas within the spectra where bottom type was indistinguishable, there were also areas where each bottom type was unique. All bottom types, for example, were similar in reflectance at 600 nm, but they exhibited little overlap at shorter wavelengths.
AVIRIS Remote Sensing Reflectance
AVIRIS remote sensing reflectance [Rrs, λ]AVIRIS was computed using Equation (11). Downwelling solar irradiance measured during the ASV survey representing clear sky conditions was used to estimate downwelling irradiance with the sun at nadir; , where θs, ASV is the solar zenith angle at the time of the kayak survey. [Rrs, λ]AVIRIS was in agreement with in situ determinations of remote sensing reflectance, [Rrs,λ]ASV, representing coral and uncolonized sediment within the coconut patch reef and adjacent deep water (Figure 11). The magnitude of the AVIRIS reflectance tended to be greater than the in situ determinations, especially in the blue portion of the spectrum and, for the adjacent deep water, at all visible wavelengths. This was not surprising as Kane'ohe Bay is influenced by runoff from the adjacent land areas during rain events that transports particulate and dissolved matter into the bay. Light scatter from suspended particles impacted all wavelengths while the effects of impurity absorption were mostly constrained to wavelengths 550 nm. However, for the shallow coral and sand areas, where benthic reflectance dominated the signal, the in situ and remotely sensed measurements for λ > 600 nm were similar in both magnitude and spectral shape.
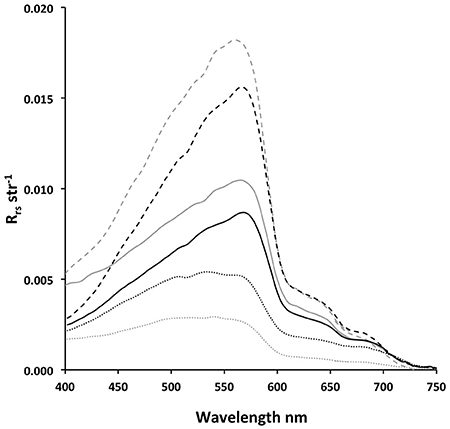
Figure 11. Comparison of remote sensing reflectance derived from in situ measurements of the coconut patch reef collected on 12 February 2017 (black curves) and high-altitude AVIRIS imagery collected on 3 March 2017 (gray curves) representing coral (solid curves), uncolonized sediment (dashed curves) and deep water adjacent to the reef (dotted curves).
The red edge spectral feature was evident in both the coral and sediment reflectance along the ASV survey route as an increase in red and near-infrared reflectance (Figures 10, 11). The feature was also apparent, but to a lesser extent, within the surrounding deep water area and was likely the result of phytoplankton absorption. An examination of the AVIRIS reflectance from selected reef features within the northern portion of Kane'ohe Bay (locations 1 through 5 indicated in Figure 4) revealed red edge features associated with coral that were far more pronounced than in the coconut patch reef (Figure 12). The patch reefs in the northern bay are very shallow, occasionally piercing the water surface during low tide, and the coral cover tends to be greater than on the coconut patch reef due to the absence of dredging. Also, the water in the northern portion of the bay tends to be clearer due to more efficient flushing by adjacent Pacific Ocean water. Thus, the larger red edge signals in the northern bay were attributed to greater coral biomass and less water attenuation of the benthic signal by the relatively clear, shallow water column.
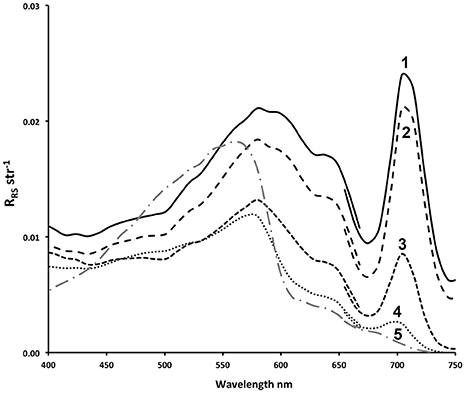
Figure 12. Reflectance from selected shallow reef features in northern Kane'ohe Bay derived from AVIRIS imagery, collected on 3 March 2017; black curves, labeled 1 through 4 (see labeled areas in Figure 4B), represent patch reefs colonized by coral and algae and the gray curve, labeled 5, represents an area that appears to be uncolonized sediment.
Red Edge Height
Given that the waters in the Kane'ohe Bay, and on coral reefs in general, are typically very low in chlorophyll concentration, the red edge feature can potentially be used as a proxy for shallow, benthic vegetative biomass. In order to examine the red edge feature further, the red edge height, REHλ, was defined as the difference between the measured reflectance and a baseline reflectance, computed as a cord connecting the endpoints of the spectral region of interest; Rrs, λ1 at the shorter wavelength end and Rrs, λ2 at the longer wavelength end;
where
Based upon inspection of the in situ and AVIRIS reflectance data, the lower and upper wavelengths bounds of the red edge feature were defined as λ1 = 675 nm and λ2 = 740 nm, respectively. Positive values of REHλ were expected to indicate the presence of live, photosynthetic biomass.
Computations of REHλ with in situ measurements over the coconut patch reef representing both coral and uncolonized sediment was positive at shorter wavelengths, λ < 710 nm, and negative at longer wavelengths (Figure 13). The curves representing coral decreased in amplitude with increasing water depth and appeared to converge upon the deep-water signal. This result was to be expected since deeper water, i.e., a longer optical path length, will result in greater attenuation of the benthic signal at longer wavelengths. Furthermore, the wavelength of maximum REHλ representing coral decreased with increasing water depth from approximately 690 nm, where 2 m ≤ D ≤ 3 m, to approximately 688 nm, where 3 m ≤ D ≤ 4 m. The peak REHλ wavelength for uncolonized sediment, where 3.5 m ≤ D ≤ 4.5 m, was approximately 687 nm. REHλ computed from AVIRIS data collected over the coconut patch reef yielded results that were similar to both coral and uncolonized sediment, where D > 3 m. AVIRIS data representing shallow patch reefs in the northern portion of the bay yielded REHλ values that were as much as 2 orders of magnitude greater than the coconut patch reef and values were generally positive for all wavelengths within the computation range. AVIRIS data representing adjacent bright areas within the image that appeared to be shallow uncolonized sediment yielded REHλ values that were similar to the in situ results for uncolonized sediment on the coconut patch reef. Furthermore, the maximum REHλ values for the northern bay patch reefs were shifted to longer wavelengths relative to the coconut patch reef results, 702 nm ≤ λ ≤ 708 nm, suggesting that the northern patch reefs were shallower and perhaps more densely covered with coral.
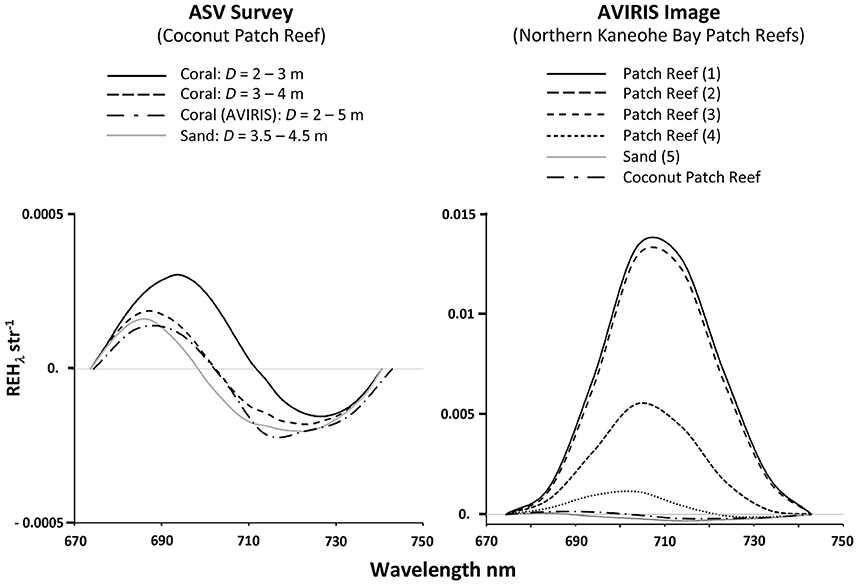
Figure 13. Red edge height computed for data collected during the in situ survey of the coconut patch reef on 12 February 201 (left) and selected patch reefs in the northern Kane'ohe Bay imaged by AVIRIS on 3 March 2017 (right; locations indicated in Figure 4B). For comparison, the AVIRIS REHλ signal is also plotted with the ASV data (dash-dot curve in both panels).
As an operational means of detecting and mapping the distribution of live vegetation biomass associated with coral, a REHλ-based algorithm was defined as
where the magnitude of the red edge height at 705 nm was normalized to the computed base reflectance at that wavelength. This approach was necessary to reduce the effects of the magnitude of the baseline reflectance, e.g., high reflectance over areas of very shallow, bright sand, such as the Ahu O Laka barrier island. Applying Equation (14) to the in situ data revealed areas of coral cover along each transect across the coconut patch reef (Figure 14). For D < 5 m, REHN > 0 and positive values tended to occur in shallower areas, where the GP1 imagery and sonar data indicated the presence of coral, i.e., dark acoustical returns due to increased benthic roughness associated with coral cover (Figure 5). The maximum depth at which positive REHN values were detected was between 3 and 4 m. Parsing the data between coral-dominated and sediment-dominated observations, [REHN]CORAL = 0.06 ± 0.13 and [REHN]SAND = −0.13 ± 0.05. Where D ≤ 3 m, [REHN]CORAL = 0.12 ± 0.33.
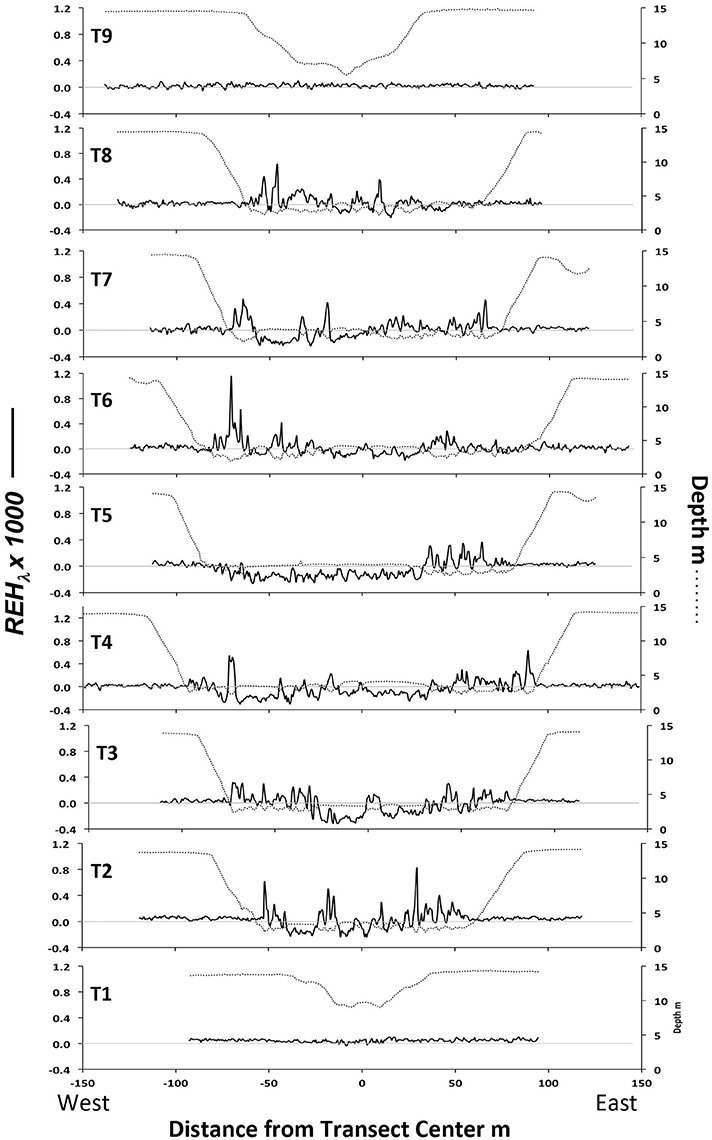
Figure 14. Red edge height (REHλ, solid curves) and depth (dotted curves) representing observations collected by the ASV along transects across the coconut patch reef.
The REHλ signal was used to estimate coral cover as the fraction of observations exceeding a defined threshold value. Defining the threshold as [REHN]CORAL ≥ 0.057 (the mean [REHN]CORAL minus one standard deviation) and constraining the analysis to in situ measurements over the coconut patch reef where D ≤ 5 m, the percent coral cover along the combined nine ASV transects was 25.2% (N = 2,039). Hunter and Evans (1995) reported on decadal changes in coral cover at selected sites within Kane'ohe Bay, including the coconut patch reef, in response to sewage exposure using traditional diver-based methods. The coconut patch reef was found to have increased in coral coverage, from 1.2% in 1971, when the bay was impacted by sewage outflow, to 33.3% in 1990, after the sewage outflow was diverted to deeper waters outside of the bay. In addition, the percent coral cover generally increased with decreasing depth to a maximum cover of >40% where D = 2 m. From the ASV survey of the coconut patch reef, the percent coral cover was also found to increase as depth decreased; coral cover was 28.4% (N = 1,800) where D ≤ 4 m and 63.4% (N = 688) where D ≤ 3 m.
As a further test of the utility of the red edge algorithm, Equation (14) was applied to the AVIRIS image of the entire Kane'ohe Bay (Figure 15). The results indicated areas of high vegetative biomass that were in agreement with the reported distribution of near-surface coral cover (e.g., Bahr et al., 2015 and references cited therein). Highest REHN values were found fringing many of the shallow banks bordering the coastline, including Coconut Island, and over many of the small patch reefs in the northern bay. Shallow, bright areas that were relatively barren of healthy coral were generally characterized as low REHN. While the central portions of the Ahu O Laka barrier island indicated relatively low REHN values, the seaward side of the island, where the bottom gradually falls off to the deeper waters of the adjacent Pacific Ocean, revealed a broad area of moderate REHN.
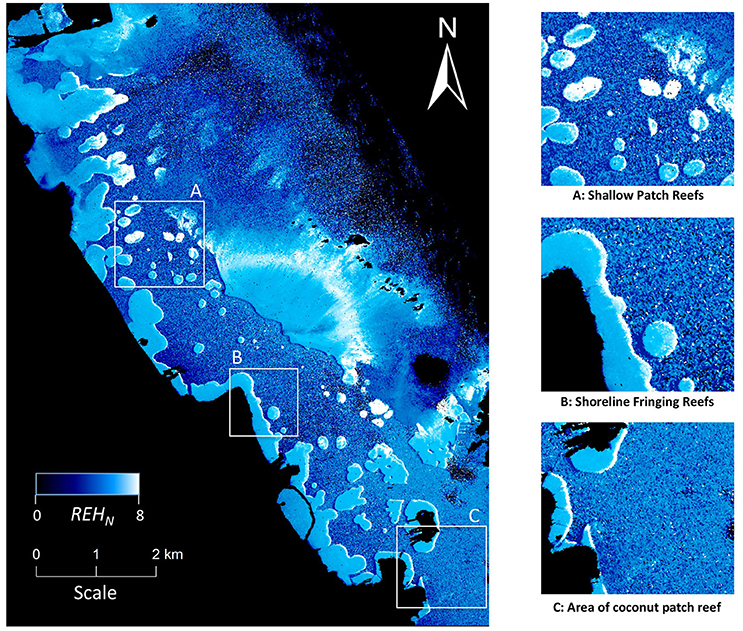
Figure 15. REHN derived from AVIRIS imagery of Kane'ohe Bay collected on 3 March 2017. Land, clouds, and values of REHN < 0 are displayed as black. (A) Shallow patch reefs in the northern bay yielded some of the largest signals. (B) Narrow fringing reefs along the coastline are well resolved. (C) REHN from the area of the coconut patch reef, where D > 3 m, was not significantly different than the surrounding deep water.
Contrary to the patch reefs in the northern portion of the bay, the coconut patch reef did not stand out within the AVIRIS imagery as higher REHN values relative to the surrounding deeper water, even though data from the ASV survey indicated slightly enhanced red edge features detectable at depths of between 3 and 4 m, (Figure 11). This result may have been due to the observed heterogeneity of benthic features across the coconut patch reef. Coral cover and vibrancy in dredged areas of the southern portion of the bay had not yet recovered to pre-dredging conditions (Jokiel, 1991). Thus, less coral cover, deeper average coral depth, and less clear water resulted in more subtle differences between the remotely sensed signals from coral and the adjacent deep water. In addition, the in situ measurements represent reflectance averaged across a much smaller area (0.08–0.31 m2) compared with a typical AVIRIS pixel (49 m2). The averaging of coral and sediment signals across an AVIRIS pixel would have tended to decrease REHN. Thus, the useful depth of remotely sensed REHN was somewhat less than 3 m within the southern portion of the bay. The depth limit for detecting REHN from healthy coral was expected to be deeper within the northern portion of the bay where coral cover was greater, the water was more transparent due to flushing with adjacent ocean waters, and the reefs had not been impacted by dredging activities.
Discussion
The ASV was shown to rapidly survey physical and optical properties of the coconut patch reef in high spatial resolution. Simultaneous measurements of bathymetry and reflectance from acoustical sensors were in agreement with optical signals and in-water photographic evidence of bottom features associated with coral and uncolonized sediment. In situ measurements of remote sensing reflectance were shown to reasonably match surface reflectance derived from atmospherically corrected measurements from an imaging spectrometer deployed at high altitude. In situ data, collected over the course of a 2 h autonomous survey, comprised over 10,000 sets of simultaneous optical and acoustical observations representing a diverse combination of bottom type and cover, water depth, sea state, and illumination. Highly diverse data sets, such as this, should permit more scientific and technical questions to be addressed than would be possible with traditionally sparse and less diverse data sets collected manually by divers. Additionally, the sampling error associated with radiometer orientation and cloud cover was determined to be small and to have no discernable impact on in situ remote sensing reflectance. Consequently, these results suggested that valid field surveys could be conducted under more diverse environmental conditions, including those that would confound high-altitude aircraft or satellite-based remote sensing operations. The insensitivity of remote sensing reflectance to cloud cover also suggested that under-cloud remote sensing, e.g., the application of drone-based sensors, is possible with minimal impact on algorithm performance.
Autonomous observations of high resolution spectral and spatial measurements of the visible and near infrared spectrum with radiometers positioned above and below the water surface provided detailed information regarding a large range in reef environmental conditions and permitted the investigation of a potential remote sensing algorithm and the associated limits of application. The red edge signal, characteristic of healthy vegetation, was shown to reveal the presence of live coral and turf algae and provided a means of distinguishing between benthic vegetation and uncolonized sediments within shallow water. While the REHN was shown to decrease with depth due to attenuation of the light reflected from benthic features, the signal was detectable over the coconut patch reef at depths of between 3 m and 4 m using in situ observations. However, the REHN signal over the coconut patch reef computed from AVIRIS imagery, while similar to the in situ determinations, were not significantly different from the surrounding deep water signal, and suggested that remote determinations may be limited to areas where D < 3 m, at least in the southern portions of the bay. The REHN algorithm applied to the AVIRIS image of the entire Kane'ohe Bay revealed shallow areas known to contain moderate to dense coral cover. These results, including the negative results over the coconut patch reef, were in general agreement with a previous application of AVIRIS imagery to map coral and algae within Kane'ohe Bay using spectral matching techniques (Goodman and Ustin, 2007).
The detailed hyperspectral signal was necessary to optimize the wavelength range for the REHN algorithm, but once determined, only three wavelengths were required for an effective algorithm; two wavelengths bracketing the red edge signal, e.g., 675 and 740 nm, and one wavelength representing the REH peak, e.g., 705 nm. Any remote sensor meeting these requirements should be able to detect the red edge signal from shallow coral environments, assuming that the spatial resolution is appropriate. The Landsat series of satellites, for example, with 30 m spatial resolution, have been used to map coral reefs (e.g., Palandro et al., 2008) and the most recent Landsat multispectral sensor to date, the Operational Land Imager (OLI) onboard Landsat-8, has five bands spread across the visible and near-infrared spectrum. Within the red edge region, band 4 (centered at 655 nm, Δλ = 50 nm) and band 5 (centered at 865 nm, Δλ = 40 nm) could potentially serve to bracket the red edge region, but there is no appropriate intermediate band coinciding with the peak REHλ wavelengths. The Multispectral Imager (MSI) onboard the Sentinel-2 satellite, on the other hand, has a higher spatial resolution, between 10 and 20 m, compared to OLI data, and it includes several bands that could satisfy an REHN algorithm; band 4 (665 nm, Δλ = 10 nm), band 5 (705 nm, Δλ = 10 nm), and band 6 (740 nm, Δλ = 10 nm). In fact, MSI bands 5 and 6 were selected specifically for detecting red edge signals from terrestrial vegetation. However, spatial convolution of the benthic signal across a 10 m ground sampling distance may reduce the maximum depth of red edge detection where coral coverage is sparse, as was the case with the AVIRIS data (with 7 m spatial resolution) collected over the coconut patch reef. Thus, the optimum spatial resolution for coral reef remote sensing remains an open question.
However, in order to measure the peak REH wavelength, which is expected to be sensitive to the depth of the vegetative material, the entire red and near-infrared portion of the spectrum must be measured in high spectral resolution. To date, there are no operational satellite systems capable of providing such data.
One limitation of the REHN algorithm was that it could not alone distinguish between the type of vegetation responsible for the signal. Coral, turf algae, sea grass, and any floating vegetation would all result in similar signals. Therefore, application of the REHN algorithm would require a level of a priori knowledge about the study site that may not exist for remote locations. While this can be problematic for remote observations, an in situ autonomous system that includes in-water imagery, such as the system developed for this project, provides a degree of benthic classification capability that can be used to parse the data and provide class-specific statistics.
We have illustrated the utility of a low-cost, commercially available, coastal kayak, modified for autonomous operations and instrumented with optical and acoustical sensors to survey coral reefs in support of remote sensing operations. We examined the utility of the red edge height as an indicator of live coral and algae and, based on the results, constructed a remote sensing algorithm to map corals in shallow water within Kane'ohe Bay. A more complete examination of the red edge signal may potentially yield information regarding benthic cover and biomass, e.g., as a function of REHλ amplitude, and water depth derived from the peak REHλ wavelength. While these results are encouraging, the details of REHλ response to physical conditions (e.g., water depth and optical properties) and vegetation type (e.g., coral and algae species), cover, and health (e.g., the effects of coral bleaching) remain to be elucidated.
Data Availability
All data are freely available through public access repositories; the in situ radiometer and inherent optical property data may be downloaded from the NASA SeaBASS ocean optics data repository (https://seabass.gsfc.nasa.gov) and AVIRIS data may be obtained from the NASA Jet Propulsion Laboratory (https://aviris.jpl.nasa.gov). All acoustical data are available from the authors upon request.
Author Contributions
All authors contributed significantly to the writing and/or final editing of the manuscript. SA was the lead author and was responsible for integration and analysis of all data and the writing of the manuscript. JS was the lead for the development, testing, and operations of the ASV and was responsible for the analysis of all of the acoustical and navigation data associated with the in situ survey. LR was responsible for analysis of the acoustical and YSI EXO2 data. WM was responsible for the analysis of the AVIRIS hyperspectral data, including implementation of the REHN algorithm. BR was responsible for the collection and analysis of the in situ water optical properties data.
Funding
Financial support for this project was provided by the National Aeronautic and Space Administration HyspIRI Program through grants NNH15AB471 and NNX16AB05G, the U.S. Naval Research Laboratory, and the Midshipman Research Office at the U.S. Naval Academy.
Conflict of Interest Statement
The authors declare that the research was conducted in the absence of any commercial or financial relationships that could be construed as a potential conflict of interest.
Acknowledgments
The authors are grateful to Dr. Ruth Gates and the University of Hawai'i Marine Biological Laboratory for their generous time and logistical support while operating out of Coconut Island, Dr. Art Tremabanis and Mr. Timothy Pilegard of the University of Delaware, and Mr. Andrew Keppel, MIDN Brian Laboy, and MIDN Michael Madigan of the U. S. Naval Academy Oceanography Department for their support of the ASV development, testing, and operations, Joseph Rhea of the U. S. Naval Research Laboratory, Remote Sensing Division, for his aid in managing the in situ field data, and the Jet Propulsion Laboratory for timely access to the AVIRIS imagery collected over Kane'ohe Bay. Without their efforts, this project would not have been possible.
References
Anthony, K. R. N., Kline, D. I., Diaz-Pulido, G., Dove, S., and Hoegh-Guldberg, O. (2008). Ocean acidification causes bleaching and productivity loss in coral reef builders. Proc. Natl. Acad. Sci. U.S.A. 105, 442–446. doi: 10.1073/pnas.0804478105
Babin, M., Morel, A., Fournier-Sicre, V., Fell, F., and Stramski, D. (2003). Light scattering properties of marine particles in coastal and open ocean waters as related to the particle mass concentration. Limnol. Oceanogr. 48, 843–859. doi: 10.4319/lo.2003.48.2.0843
Bahr, K. D., Jokiel, P. L., and Toonen, R. J. (2015). The unnatural history of Kane'ohe Bay: coral reef resilience in the face of centuries of anthropogenic impacts. PeerJ 3:e950. doi: 10.7717/peerj.950
Chavez, P. S. (1996). Image-based atmospheric corrections - revisited and improved. Photogr. Eng. Rem. Sens. 62, 1025–1036.
Curcio, J., Leonard, J., and Patrikalakis, A. (2005). “SCOUT - A low cost autonomous surface platform for research in cooperative autonomy,” in Proceedings of MTS/IEEE OCEANS (Washington, DC).
Dekker, A. G., Phinn, S. R., Anstee, J., Bissett, P., Brando, V. E., Casey, B., et al. (2011). Intercomparison of shallow water bathymetry, hydro-optics, and benthos mapping techniques in Australian and Caribbean coastal environments. Limnol. Oceanogr. Methods 9, 396–425. doi: 10.4319/lom.2011.9.396
Dierssen, H., and Russell, B. (2017). Coral Reef Airborne Laboratory. SeaWiFS Bio-optical Archive and Storage System (SeaBASS). NASA. doi: 10.5067/SeaBASS/CORAL/DATA001
Felella, I., and Penuelas, J. (1994). The red edge position and shape as indicators of plant chlorophyll content, biomass and hydric status. Int. J. Rem. Sens. 15, 1459–1470.
Fyfe, S. K. (2003). Spatial and temporal variation in spectral reflectance: Are seagrass species spectrally distinct? Limnol. Oceanogr. 48(pt. 2), 464–479. doi: 10.4319/lo.2003.48.1_part_2.0464
Gates, D. M., Keegan, H. J., Schleter, J. C., and Weidner, V. R. (1965). Spectral properties of plants. Appl. Opt. 4, 11–20. doi: 10.1364/AO.4.000011
Gleason, A. C. R., Reid, R. P., and Voss, K. J. (2007). “Automated classification of underwater multispectral imagery for coral reef monitoring,” in Proceedings of Oceans 2007 (Vancouver, BC).
Goodman, J. A., and Ustin, S. L. (2007). Classification of benthic composition in a coral reef environment using spectral unmixing. J. Appl. Re. Sens. 1:011501. doi: 10.1117/1.2815907
Gordon, H. R., Brown, O. B., Evans, R. H., Brown, J. W., Smith, R. C., Baker, K. S., et al. (1988). A semianalytic radiance model of ocean color. J. Geophys. Res. 93, 10909–910924. doi: 10.1029/JD093iD09p10909
Hedley, J. D., Harborne, A. R., and Mumby, P. J. (2005). Simple and robust removal of sun glint for mapping shallow-water benthos. Int. J. Rem. Sens. 26, 2107–2112. doi: 10.1080/01431160500034086
Hochberg, E. J., and Atkinson, N. J. (2000). Spectral discrimination of coeal reef benthic communities. Coral Reefs 19, 164–171. doi: 10.1007/s003380000087
Hochberg, E. J., Atkinson, N. J., and Andréfouët, S. (2003). Spectral reflectance of coral reef bottom-types worldwide and implications for coral reef remote sensing. Rem. Sens. Env. 85, 159–173. doi: 10.1016/S0034-4257(02)00201-8
Hoegh-Guldberg, O. (2011). “The impact of climate change on coral reef ecosystems,” in Coral Reefs: An Ecosystem in Transition, eds Z. Dubinsky and N. Stambler (Dordrecht: Springer), 391–403.
Hughes, T. P., Baird, A. H., Bellwood, D. R., Card, M., Connolly, S. R., Folke, C., et al. (2003). Climate change, human impacts, and the resilience of coral reefs. Science 301, 929–933. doi: 10.1126/science.1085046
Hunter, C. L., and Evans, C. W. (1995). Coral reefs in Kane'ohe Bay, Hawai'i: Two centuries of western influence and two decades of data. Bull. Mar. Sci. 57, 501–515.
Jokiel, P. L. (1991). Jokiel's Illustrated Scientific Guide to Kane'ohe Bay. Kaneohe: University of Hawaii.
Kirk, J. T. O. (1984). Dependence of relationship between inherent and apparent optical properties of water on solar altitude. Limnol. Oceanogr. 29, 350–356.
Kleypas, J. A., McManus, J. W., and Menez, L. A. B. (1999). Environmental limits to coral reef development: Where do we draw the line? Am. Zool. 39, 146–159.
Kutser, T., Dekker, A. G., and Skirving, W. (2003). Modeling spectral discrimination of Great Barrier Reef benthic communities by remote sensing instruments. Limnol. Oceanogr. 48(1, part 2), 497–510. doi: 10.4319/lo.2003.48.1_part_2.0497
Lee, C. M., Cable, M. L., Hook, S. J., Green, R. O., Ustin, S. L., Mandl, D. J., et al. (2015). An introduction to the NASA Hyperspectral Infrared Imager (HyspIRI) mission and preparatory activities. Rem. Sens. Environ. 167, 6–19. doi: 10.1016/j.rse.2015.06.012
Lee, Z. P., Carder, K. L., Mobley, C. D., Steward, R. G., and Patch, J. S. (1999). Hyperspectral remote sensing for shallow waters: 2. Deriving bottom depths and water properties by optimization. Appl. Opt. 38, 3831–3843.
Lirman, D., Gracias, N. R., Gintert, B. E., Gleason, A. C., Reid, R. P., Negahdaripour, S., et al. (2007). Development and application of a video-mosaic survey technology do document the status of coral reef communities. Environ. Monit. Assess. 125, 59–73. doi: 10.1007/s10661-006-9239-0
Maritorena, S., Morel, A., and Gentili, B. (1994). Diffuse reflectance of oceanic shallow waters: influence of water depth and bottom albedo. Limnol. Oceanogr. 39, 1689–1703.
Moberg, F., and Folke, C. (1999). Ecological goods and services of coral reef ecosystems. Ecolog. Econom. 29, 215–233.
Mobley, C. D., and Sundman, L. K. (2012). Hydrolight 5.1 Ecolight 5.1 Users Guide. Bellevue, WA: Sequoia Sequoia Scientific.
Odum, H. T., and Odum, E. P. (1955). Trophic structure and productivity of a windward coral reef community on Eniwetok Atoll. Ecol. Monogr. 25, 291–320.
Palandro, D. A., Andréfouët, S., Hu, C., Hallock, P., Muller-Karger, F. E., Dustan, P., et al. (2008). Quantification of two decades of challoe-water reef habitat decline in the Florida Kys National Marine Sanctuary using Landsat data (1984-2002). Rem. Sens. Environ. 112, 3388–3399. doi: 10.1016/j.rse.2008.02.015
Philpot, W. D. (1987). Radiative transfer in stratified waters: a single-scattering approximation of irradiance. Appl. Opt. 26, 4123–4132. doi: 10.1364/AO.26.004123
Philpot, W. D. (1989). Bathymetric mapping with passive multispectral imagery. Appl. Opt. 28, 1569–1578.
Pope, R. M., and Fry, E. S. (1997). Absorption spectrum (380–700 nm) of pure water. II. Integrating cavity measurements. Appl. Opt. 36, 8710–8723. doi: 10.1364/AO.36.008710
Shihavuddin, A. S. M., Gracias, N., Garcia, R. Gleason, A. C. R., and Gintert, B. (2013). Image-based coral reef classification and thematic mapping. Rem. Sens. 5, 1809–1841. doi: 10.3390/rs5041809
Smith, R. C., and Baker, K. S. (1981). Optical properties of the clearest natural waters (200-800 nm). Appl. Opt. 20, 177–184.
Vane, G., Green, R. O., Chrien, T. G., Enmark, H. T., Hansen, E. G., and Porter, W. M. (1993). The airborne visible/infrared imaging spectrometer (AVIRIS). Rem. Sens. Environ. 44, 127–143.
Wood, S., Rees, M., and Pfeiffer, Z. (2007). “An autonomous self-mooring vehicle for littoral and coastal observations,” in OCEANS 2007 (Aberdeen, UK).
Keywords: coral reef, Kane'ohe Bay, autonomous survey, hyperspectral remote sensing, red edge height
Citation: Ackleson SG, Smith JP, Rodriguez LM, Moses WJ and Russell BJ (2017) Autonomous Coral Reef Survey in Support of Remote Sensing. Front. Mar. Sci. 4:325. doi: 10.3389/fmars.2017.00325
Received: 30 June 2017; Accepted: 29 September 2017;
Published: 24 October 2017.
Edited by:
Jesús Ernesto Arias González, Center for Research and Advanced Studies of the National Polytechnic Institute (CINVESTAV), MexicoReviewed by:
Stuart Phinn, University of Queensland, AustraliaCharles Alan Jacoby, St Johns River Water Management District, United States
Copyright © 2017 Ackleson, Smith, Rodriguez, Moses and Russell. This is an open-access article distributed under the terms of the Creative Commons Attribution License (CC BY). The use, distribution or reproduction in other forums is permitted, provided the original author(s) or licensor are credited and that the original publication in this journal is cited, in accordance with accepted academic practice. No use, distribution or reproduction is permitted which does not comply with these terms.
*Correspondence: Steven G. Ackleson, steve.ackleson@nrl.navy.mil