Opportunism on the High Seas: Foraging Ecology of Olive Ridley Turtles in the Eastern Pacific Ocean
 Lindsey E. Peavey1,2*
  Brian N. Popp3
  Robert L. Pitman1 Steven D. Gaines2 Karen E. Arthur3 Shaleyla Kelez4 Jeffrey A. Seminoff1
- 1National Oceanic and Atmospheric Administration (NOAA), National Marine Fisheries Service, Southwest Fisheries Science Center, La Jolla, CA, United States
- 2Bren School of Environmental Science and Management, University of California, Santa Barbara, Santa Barbara, CA, United States
- 3Department of Geology and Geophysics, School of Ocean and Earth Science and Technology, University of Hawaii, Honolulu, HI, United States
- 4ecOceanica, Lima, Peru
Stable isotopic compositions in animal tissues have been widely used to gain insight into trophic dynamics, especially of mobile aquatic predators whose behavior and dietary preferences are difficult to directly measure. Olive ridley sea turtles (Lepidochelys olivacea) range across >3 million km2 of the tropical and subtropical eastern Pacific Ocean and their trophic ecology in open ocean areas has not yet been adequately described. Individuals feed within biogeographic regions where varying nutrient cycling regimes result in phytoplankton with distinct δ13C and δ15N values that are assimilated by the turtles. We sampled 346 turtles at-sea between 2003 and 2009 and used bulk tissue (n = 346) and amino acid compound specific isotope analysis (AA-CSIA, n = 31) to empirically support the conventional understanding that olive ridleys are omnivores. Bulk δ15N values did not significantly vary with carapace length, a proxy for age, or with putative sex of adults. We therefore hypothesize that trophic position (TP) does not vary across age or sex. In line with other isotopic studies of this biogeographic scale in the same region, we observed a trend of bulk tissue 15N enrichment with increasing latitude. Using AA-CSIA to account for δ15N baseline shifts among food webs (space), we estimated the TP of adult foragers using two methods. We found that across their eastern Pacific range, olive ridley δ13C and δ15N niche area varied, but median TP of adults remained constant (~3.1). Using a two-amino acid TP estimation method, we detected a small but notable elevation of TP for olive ridleys on the Costa Rica Dome. This study underscores the value of large-scale in-water olive ridley sea turtle research across oceanic foraging habitats to confirm or challenge anecdotal understanding of trophic roles, susceptibility to environmental change, and critical habitats. Further, it improves our understanding of why this species is now abundant in the eastern Pacific Ocean. A prey generalist with plenty of suitable foraging habitat can recover from the brink of extinction despite the presence of major threats. However, such foraging characteristics may require dynamic open ocean management approaches to meet conservation objectives if threats persist and/or increase.
Introduction
The complexity of ecosystem function depends on food web biodiversity, predator-prey relationships, and the degree of consumer generalism (Duffy et al., 2007). Understanding the trophic role(s) of wide-ranging consumers can shed light on spatial variation in trophic structure and/or resource availability across oceanic food webs. For example, consumers may exhibit faster trophic responses to sudden changes in food supply or phenology in simple food webs vs. complex food webs (Suryan et al., 2009). A response such as an increase in trophic position may have demographic benefits, like increased survival.
Defined by their nutrient regimes, the three main types of pelagic systems are upwelling, oligotrophic oceanic, and eutrophicated coastal systems (Sommer et al., 2002). Regardless of the mechanistic drivers of the trophic structure within these systems [e.g., resource-driven (bottom-up) and/or predation (top-down)], it is well established that the biological characteristics of dominant species regulate biogeochemical cycling in spatially subsidized (i.e., patchy) open ocean food webs (Menge and Sutherland, 1976; Longhurst and Harrison, 1989; Polis et al., 1997). Today, humans are an important element of marine food webs by influencing both bottom-up and top-down controls via nutrient enrichment and resource extraction, respectively.
Mobile marine consumers like sea turtles can have variable foraging strategies. Omnivores feed on an array of prey within a food web and often span multiple trophic levels (Thompson et al., 2007). Omnivores are considered generalists when they access prey resources across food webs (Pillai et al., 2011). In contrast, specialists feed on a lower diversity of prey items within and across food webs, generally within only a single trophic level. Both types of consumers play important roles in top-down regulation of food webs. Phenology, physiology, and/or community structure can influence changes in trophic role across space (e.g., habitat) and time (e.g., with growth). Understanding the trophic position of a consumer, along with its ecological niche within a given food web, can provide insight into foraging preferences and/or response to ecosystem heterogeneity.
Stable carbon and nitrogen isotopic compositions have been used extensively to gain insights into foraging strategy, particularly for consumers whose behavior and dietary preferences are difficult to observe directly (Fry, 1988; Olson et al., 2010). δ13C and δ15N values vary across ecosystems and are tracers of metabolic and biogeochemical processes (Montoya, 2007). For example, the variability of primary producer δ13C values is driven by physical forces of the carbon cycle, temperature and [CO2]aq, as well as biology (Laws et al., 1995; Cassar et al., 2006; McMahon et al., 2013). Coastal and benthic systems are typically nutrient rich compared to offshore and pelagic systems, and thus have phytoplankton more 13C-enriched (France, 1995). As such, δ13C values of consumer tissues reflect those at the baseline of the food web. Nitrogen integrated into consumer tissues is enriched in 15N relative to prey, such that top predators have the highest δ15N values (DeNiro and Epstein, 1981; Fry, 1988; Cabana and Rasmussen, 1996). Because the dominant nitrogen cycling regime in a region influences δ15N values at the base of the food chain (Hobson, 1999; Vander Zanden and Rasmussen, 2001), spatially discrete food webs with differing nutrient cycling offer distinct biogeochemical frameworks to study animal movement and trophic ecology (Hobson et al., 2012). In practice, measuring δ15N values of tissues from multiple individuals within a population can provide insights about local nitrogen sources, trophic level, and niche space (Thomas and Crowther, 2015).
When investigating wide-ranging consumers, it is important to consider natural variations of δ13C and δ15N values at the base of the food web, in addition to trophic fractionation. “Bulk” (whole) tissue δ13C and δ15N values reflect a composite view of all assimilated organic compounds (e.g., protein amino acids). Many marine studies of cryptic consumers have examined bulk tissue to infer diet composition and/or trophic interactions (Ruiz-Cooley and Gerrodette, 2012; Allen et al., 2013; Thompson et al., 2015), including isotopic niche space—a multi-dimension measure of all interactions between a consumer and its habitat and prey (Elton, 1927; Hutchinson, 1957; Bearhop et al., 2004; Newsome et al., 2007; Yeakel et al., 2016). However, the interpretation of bulk analysis results is constrained by an inability to discern trophic vs. baseline influences on δ13C and δ15N values of consumer tissues (Hussey et al., 2014; Bowes and Thorp, 2015). A second approach, amino acid compound-specific nitrogen isotopic analyses (AA-CSIA), can help overcome this limitation.
The δ15N values of amino acids fall into two groups: “source” amino acids (e.g., phenylalanine, lysine) that minimally fractionate with trophic processing, and “trophic” amino acids (e.g., glutamic acid, alanine) that undergo 15N-enrichment with trophic transfers (McClelland and Montoya, 2002; Chikaraishi et al., 2007; Popp et al., 2007). Source amino acids reflect the isotopic composition at the base of the food web, whereas trophic amino acids reflect the trophic level of the consumer. Examining δ15N values of both types of amino acids can thus yield insights that cannot be gained with bulk-tissue analysis alone (Chikaraishi et al., 2009, 2010).
The integration of bulk-tissue stable isotope analysis with AA-CSIA has provided insights about several marine taxa, including sea turtles (Seminoff et al., 2012; Vander Zanden et al., 2013; Arthur et al., 2014). This combined approach is useful for studying the trophic ecology of cryptic species as well as those for which empirical dietary information is limited. The olive ridley sea turtle (Lepidochelys olivacea) is an example of both. It is an oceanic species, and individuals live offshore in waters largely inaccessible for research for the majority of their lives. Although long-term diet studies would be challenging, it is possible to collect tissue samples from individuals at sea.
Olive ridleys are the smallest and most abundant sea turtle species in eastern Pacific Ocean and are thought to mature at a younger age (~13 years) than other turtles (Zug et al., 2006; Eguchi et al., 2007; Seminoff and Wallace, 2012). They range >3 million km2 across this dynamic ocean basin and are thus present in multiple biogeographic regions (Pennington et al., 2006; Olson et al., 2010; Plotkin, 2010). As nomadic opportunistic omnivores, they don't undergo ontogenetic habitat shifts and may feed in both benthic and pelagic habitats (Bjorndal, 1997; NMFS and USFWS, 1998; Robins et al., 2002; Bolten, 2003; Whiting et al., 2007; Behera et al., 2015). Olive ridleys often forage via passive drifting rather than active swimming, meaning they eat within the same food web for many days (Block et al., 2002; Polovina et al., 2003; McMahon et al., 2007; Whiting et al., 2007; Plotkin, 2010). Their oceanic diet consists of mostly planktonic items or items living on or near flotsam including algae, crustaceans, and salps (Kopitsky et al., 2005; Jones and Seminoff, 2013; Wedemeyer-Strombel et al., 2015; Pitman, Kopitsky and Peavey, pers. comms.). Thus, the trophic position of the olive ridley may be different than for other large vertebrates such as marine mammals, sharks, and seabirds. Despite these insights, olive ridley open ocean trophic ecology has not yet been sufficiently investigated. However, their foraging behavior and temporal scale makes them perhaps the best large consumer to study spatial differences in trophic roles across oceanic food webs.
Here we apply bulk-tissue stable isotope analysis and AA-CSIA to olive ridley sea turtles foraging in the eastern Pacific Ocean. We quantitatively describe isotopic niche variation for olive ridleys across a large portion of their range, and estimate the trophic positions of adult olive ridleys. To our knowledge, this is the first account of the isotope ecology of olive ridley turtles in the Pacific Ocean. We discuss our findings as they relate to persistent but dynamic oceanic foraging habitats, conservation implications of potentially unique open-ocean foraging areas, and the olive ridley's resilience to climate, habitat quality and prey changes.
Methods
Study Region and Sub-Regions
The study region spans the tropical and subtropical eastern Pacific Ocean, extending from ~30° N (Gulf of California) to ~16° S (Peru Current), and ~76° W (west coast of the Americas) to ~115°W (Figure 1). This region is oceanographically dynamic but has persistent and predictable areas of upwelling, warm pools, cold tongues, and boundary currents that support spatially explicit nutrient cycling regimes, such as nitrogen fixation and denitrification (Fiedler and Talley, 2006). Per these regimes, δ15N values are distributed across the region's oceanographic features and distinct δ15N baselines are assumed to represent distinct food webs.
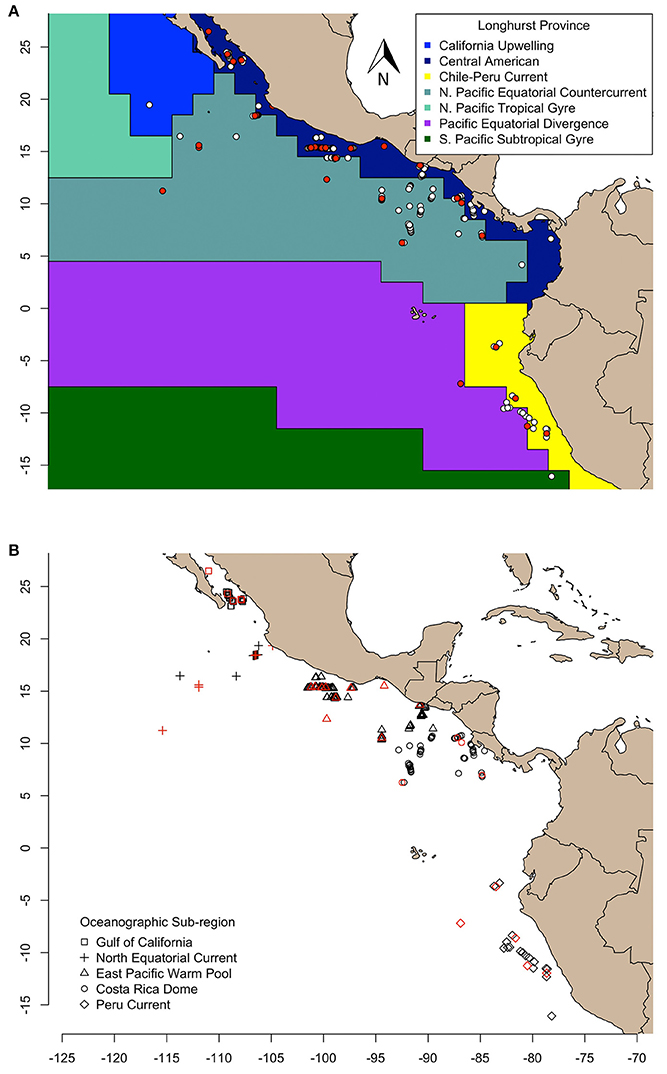
Figure 1. Olive ridley turtles sampled in this study are represented as symbols and aggregated according to (A) Longhurst province (VLIZ, 2009), and (B) oceanographic sub-region (Fiedler and Talley, 2006). The δ13C and δ15N values of skin of all turtles were determined, and compound specific amino acid δ15N values were measured for only those colored in red.
We examined geographic variation of stable isotope compositions in olive ridleys relative to regions of varying biogeochemical processes at two different scales. First, we grouped samples by Longhurst biogeochemical provinces (VLIZ, 2009), and second, by oceanographic features described in Fiedler and Talley (2006). Longhurst provinces (L) were defined by the following numeric labels: 7 (“Coastal—Central American Coastal Province”), 8 (“Coastal—Chile-Peru Current Coastal Province”), and 35 (“Trades—North Pacific Equatorial Countercurrent Province”) (VLIZ, 2009; Figure 1A). Alternatively, samples were grouped into five distinct sub-regions based on the following oceanographic features: the Gulf of California (GC), the North Equatorial Current (NEC), the Eastern Pacific Warm Pool (EPWP), the Costa Rica Dome (CRD, an oceanic thermal feature), and the Peru Current (PC) (Figure 1B). Spatial analyses across sub-regions were limited to individuals sampled within feature boundaries. Our analyses relied on the premise that stable isotope values of olive ridley skin reflect the local food web in which the turtle was sampled, considering the isotopic turnover of sea turtle skin tissue (ca. 40–50 d, Reich et al., 2008) and the passive movements of olive ridleys foraging at-sea.
Sample Collection and Preparation
From August to December 2006, in total, 320 olive ridley sea turtles were opportunistically hand-captured from a small boat deployed from the National Oceanographic Atmospheric Administration R/V David Starr Jordan during the Stenella Abundance Research (STAR) cruise (Jackson et al., 2008). Morphometric information was collected for all turtles, and putative sex was recorded for mature/adult individuals. Based on external morphology, individuals with straight carapace length ≥ ca. 56 cm are considered adult (NMFS and USFWS, 1998). Putative sex of adult-sized turtles was based on tail length; individuals with long tails (>20 cm length) were classified as males whereas those with shorter tails were considered females. For individuals sampled within the GC (n = 29), NEC (n = 36), EPWP (n = 192), and CRD (n = 63) sub-regions [alternatively: L7 (n = 172), L8 (n = 21), and L35 (n = 151)], a razor blade was used to collect epidermis (“skin”) samples ~2 mm from the dorsal neck surface, and samples were immediately frozen at −80°C and then stored at −20°C at the Southwest Fisheries Science Center (La Jolla, CA, USA) until laboratory analysis. All turtles were released unharmed within ~20 km of where they were captured.
Prior to stable isotope analyses, samples were thawed and rinsed with distilled water, freeze dried for one 8-h cycle, and lipid-extracted using an Accelerated Solvent Extractor (ASE 200) according to previously published methods (Lemons et al., 2011; Allen et al., 2013). Lipid extraction is not known to significantly alter δ13C or δ15N values in sea turtle skin (Medeiros et al., 2015; Bergamo et al., 2016). All samples were analyzed for bulk-tissue stable isotope values (δ13C and δ15N), whereas 4–14 samples in each sub-region were processed for AA-CSIA (Figure 1).
In total, 22 adult olive ridleys in the Peru Current were sampled from turtles incidentally captured by Peruvian longline fishing vessels. Using a 2-mm biopsy punch, skin samples were taken from the dorsal neck surface of adult olive ridleys in 2003 (n = 3), 2004 (n = 5), 2008 (n = 10), and 2009 (n = 4), preserved with salt, and archived at −20°C at the Southwest Fisheries Science Center (La Jolla, CA, USA) until laboratory analysis. These samples were lipid extracted using the same methods as above, and analyzed for bulk-tissue stable isotope values as described in Kelez (2011) and Arthur et al. (2014). AA-CSIA was completed for five samples from 2008 and 2009 using the same methods described below and in Arthur et al. (2014). Note that these samples were originally for a separate study, and as such they are unique in their collection year and method.
Bulk Tissue Analysis
i) Mass Spectrometry
For GC, NEC, EPWP, and CRD 2006 samples (n = 320), 0.7–1 mg of skin was homogenized with a razor blade and loaded into tin capsules. Samples were analyzed by a Costech Instruments elemental combustion system (ECS4010) coupled to a continuous-flow Thermo Finnigan MAT Delta Plus XL isotope ratio mass spectrometer in the Stable Isotope Laboratory at the University of Florida, Gainesville. PC samples were analyzed in an analogous way in the same facilities, as described in Kelez (2011). Bulk isotope values are reported in standard delta notation (δ) in parts per thousand (‰): δHX = ([Rsample/Rstandard] – 1) × (1,000), where the superscript “H” is the mass of the heavy isotope, X is the element of interest, and R is the ratio of the heavy X isotope to the light X isotope (Fry, 2006). Rstandard was atmospheric N2 and Vienna Pee Dee Belemnite (VPDB) for δ15N and δ13C, respectively. Continuous calibration was completed using USGS40 (L-glutamic acid: δ15N = −4.52‰ and δ13C = −26.39‰) with an average precision of 0.07‰ for δ15N and 0.10‰ for δ13C. To ensure accuracy, 1–3 blind sample duplicates were run per 30 samples with an average standard deviation of 0.14‰ for δ15N and 0.27‰ for δ13C.
ii) Exploring δ15N Shift with Size, Gender
Both curved carapace length (CCL) and straight carapace length (SCL) was measured for all STAR turtles. However, only CCL was measured for Peru turtles. In order to estimate SCL for Peru turtles based on the CCL measurements, we used the following model (R2 = 0.99) derived from the linear relationship between SCL and CCL for STAR turtles (n = 354, see Supplementary Table 1):
Subsequently, a linear regression model (α = 0.05) was used to explore if bulk δ15N values in skin varied with SCL (cm; n = 337), after controlling for latitude by specifying sub-region as a factor:
To explore if adult bulk δ15N values in skin varied with gender (sex: female/male; n = 185) after controlling for latitude by specifying sub-region, a two-way ANOVA (Type III, α = 0.05) was used:
iii) Isotopic Niche Area
Standard niche width ellipse and convex hull areas were estimated using maximum likelihood, and Markov chain Monte Carlo (MCMC) credible intervals were generated to calculate uncertainty around ellipse estimates using Stable Isotope Bayesian Ellipses (SIBER) functions (Jackson et al., 2011) in the Stable Isotope Analysis in R (SIAR) package (Parnell et al., 2008, 2010). Probability of size differences between ellipses were calculated by comparing pairs of draws from the posterior MCMC distributions.
Amino Acid Compound-Specific Nitrogen Isotopic Analyses (AA-CSIA)
i) Mass Spectrometry
Of the 320 STAR samples used for bulk tissue stable isotope analysis, a subset of 26 samples from adults were dried and homogenized with a mortar and pestle and/or razor blade (2–10 mg). Samples making up the subset were chosen to cover the widest geographic area of each sub-region: GC (n = 6), NEC (n = 6), EPWP (n = 10), and CRD (n = 4); and alternatively, L7 (n = 14) and L35 (n = 12).
Samples were prepared (hydrolysis and derivatization) and analyzed for compound-specific isotopic composition of amino acids at the Biogeochemical Stable Isotope Laboratory at the University of Hawaii at Manoa following Popp et al. (2007), Hannides et al. (2009) and Décima et al. (2013). Briefly, samples were hydrolyzed (6N HCl, 150°C), the hydrolysate purified (0.2 μm pore size Polyethersulfone filters, cation exchange chromatography), the carboxyl terminus the amino acids esterified (4:1 C3H8O and CH3COCl, 110°C) and the amino group acelyated (3:1 CH2Cl2 and 200 μl C4F6O3, 100°C). A final solvent extraction assured that the sample derivatives were pure. Samples were stored frozen at −20°C until analysis in triplicate using a mass spectrometer (Thermo Scientific DeltaPlusV or MAT 253 interfaced with a Trace GC/GCIII; see Hannides et al. (2009) and Bradley et al. (2015) for further mass spectrometry details).
The δ15N values of 13 amino acids [alanine, glycine, valine, serine, leucine, isoleucine, proline, glutamic acid, phenylalanine, lysine, tyrosine, and norleucine (Nor) and aminoadipic acid (AAA)], measured against internal Nor/AAA reference material of known isotopic composition, were quantified in each sample. Every block of three sample measurements was bookended by a suite of amino acids with known δ15N values (alanine, threonine, isoleucine, proline, glutamic acid, and phenylalanine). Suite/samples were co-injected with Nor and AAA with known δ15N values serving as internal reference material and to control for errors due to sample loss, injection variations, and variability in dilution preparations. Sample δ15N values for 11 amino acids were normalized using regression (typically R2 > 0.9) of either the Nor/AAA or suite standards. Accuracy was maintained to within 1‰ of the known value, and the average standard deviation of δ15N across all 2006 samples and amino acids was 0.75‰.
The Peru Current samples were prepared and analyzed separately but in the same lab and with the same protocol at the University of Hawaii at Manoa. These were grouped as PC (n = 5), and alternatively L8 (n = 5), and had an average standard deviation of δ15N across all samples and amino acids of 0.56 and 0.63‰, respectively (Arthur et al., 2014).
ii) Exploring Variation of Bulk δ15N Values
To test our hypothesis that the variation in bulk δ15N values in olive ridley sea turtle skin [standard deviation (SD) = 0.8] is driven by δ15N values of source nitrogen, we built the following Deming regression (Type II, α = 0.05) using the “mcr” package. Deming regression is an extension of simple linear regression that compares two estimation methods by accounting for measurement errors along both the x- and y-axis, instead of only along the y-axis. If two methods are parallel, a slope of one is expected.
We ran the regression two ways across the 31 samples that had both bulk and amino acid δ15N values, one using phenylalanine (SD = 0.5) as the source amino acid (ratio of variance = 1.6), and one using the weighted mean of three source amino acids [glycine, lysine and phenylalanine] (SD = 0.4, ratio of variance = 2).
iii) Trophic Position Estimations
We compared two approaches to estimate trophic position (TP) according to Chikaraishi et al. (2009, 2010) and Bradley et al. (2015). We used δ15N values for either phenylalanine (Phe) or the weighted mean of three source amino acids (glycine, lysine, and phenylalanine), and glutamic acid (Glu) or the weighted mean of three trophic amino acids (alanine, leucine, and glutamic acid) to estimate olive ridley TP in each sub-region. If samples had missing values for any of these amino acids, they were excluded from the weighted mean trophic position approach and the method comparison. All samples had values for Glu and Phe. We propagated error to calculate SD (see Dale et al., 2011; Choy et al., 2012; Bradley et al., 2015 for details). The two approaches were compared with a two-sided, paired Wilcoxon Signed-Rank test.
The following TP equation shows Glu and Phe as placeholders but were replaced with weighted means for the second approach (see Equation 2 in Nielsen et al., 2015). Trophic discrimination is reasonably predictable and can be accounted for with an enrichment factor (DeNiro and Epstein, 1981; Minagawa and Wada, 1984; Bradley et al., 2014). Estimates of 15N enrichment among amino acids in primary producers (βGlu–Phe = 3.6‰) and for each trophic level (ΔGlu−Phe = 5.7‰) were recommended by Bradley et al. (2015) and were equivalent across the two approaches. For trophic enrichment, others suggest ΔGlu−Phe = 7.6‰ (Chikaraishi et al., 2009), 6.6‰ (Nielsen et al., 2015), or other values (see Lorrain et al., 2009; Dale et al., 2011). We chose values vetted in the literature (β = 3.6, Δ = 5.7), and because they resulted in more reasonable omnivorous TP estimates considering the range of known δ15N values for eastern Pacific olive ridley prey (Supplementary Tables 1 and 2).
Due to the small AA-CSIA sample sizes, we did not assume that TP estimates are normally distributed, and thus used the Kruskal–Wallis non-parametric statistical test to compare TP distribution across sub-regions. Exploratory analysis of δ15N probability densities, median TP, and confidence intervals of each sub-region prompted a pooled pairwise comparison (Mann–Whitney U-test) of trophic position estimates between the Costa Rica Dome and all others. We treated sub-region as a blocking factor in the Mann-Whitney rank sum test, and α = 0.05 for both tests. All statistical tests were performed in R (www.r-project.org/).
Results
Bulk δ13C values across the study region (n = 346) ranged from −17.8‰ (Gulf of California) to −14.5‰ (East Pacific Warm Pool), and 8.8‰ (Peru Current) to 15.6‰ (Gulf of California) for δ15N (Table 1). We observed a general trend of 15N enrichment with increasing latitude (Supplementary Figure 1). Within the northern latitudes, the turtle sampled at the lowest latitude (4.17°N) had a δ15N value of 11.9‰ and the turtle sampled at the highest latitude (26.48°N) had a δ15N value of 15.6‰ (Figure 2). Bulk δ15N values were not correlated with the δ15N values of phenylalanine (Deming regression slope ≈ 2.7, 95% confidence bounds: 1.8, 5.6) or the weighted mean δ15N values of source amino acid (Deming regression slope ≈ 2.9, 95% confidence bounds: 1.4, 12.1).
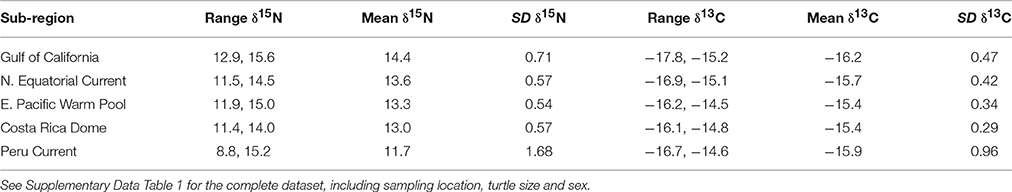
Table 1. Bulk δ15N and δ13C (‰) information summarized by oceanographic sub-region, listed in latitudinal order from north to south.
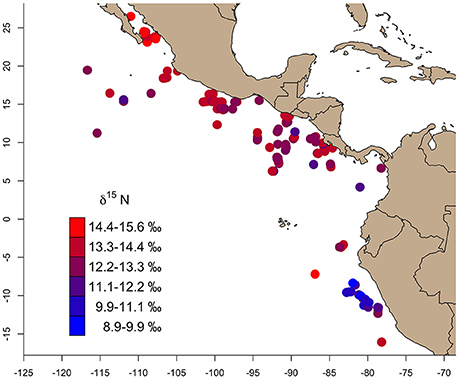
Figure 2. The gradient of bulk skin tissue δ15N values from olive ridley turtles sampled across the study area ranged from 8.9 to 15.6‰. In general, δ15N values increased from south (Peru Current) to north (Gulf of California).
After controlling for sub-region, SCL was only a significant predictor of bulk skin δ15N values when the model included PC turtles (p = 0.02). When PC turtles were excluded, SCL was not a significant predictor of δ15N values [p = 0.06; Supplementary Table 2; Supplementary Figure 2]. After controlling for sub-region, adult gender was not a significant predictor of bulk skin δ15N values [F(1) = 0.2, p = 0.70; Supplementary Table 4].
Maximum likelihood sub-region ellipse area estimates (with small sample size corrections in parentheses) are as follows: L7 = 0.7(0.7) ‰2, L35 = 0.9(0.9) ‰2, L8 = 2.7(2.8) ‰2, CRD = 0.5(0.5) ‰2, EPWP = 0.6(0.6) ‰2, GC = 1.0(1.1) ‰2, NEC = 0.7(0.8) ‰2, PC = 2.7(2.8) ‰2 (Figures 3A,B). In comparing niche area across Longhurst provinces (Figure 3C), olive ridley niche area is much larger in L8 than in either L35 or L7 (>99% probability). Further, their niche in L35 is significantly larger than in L7, even though the two are much more similar in size compared to in L8.
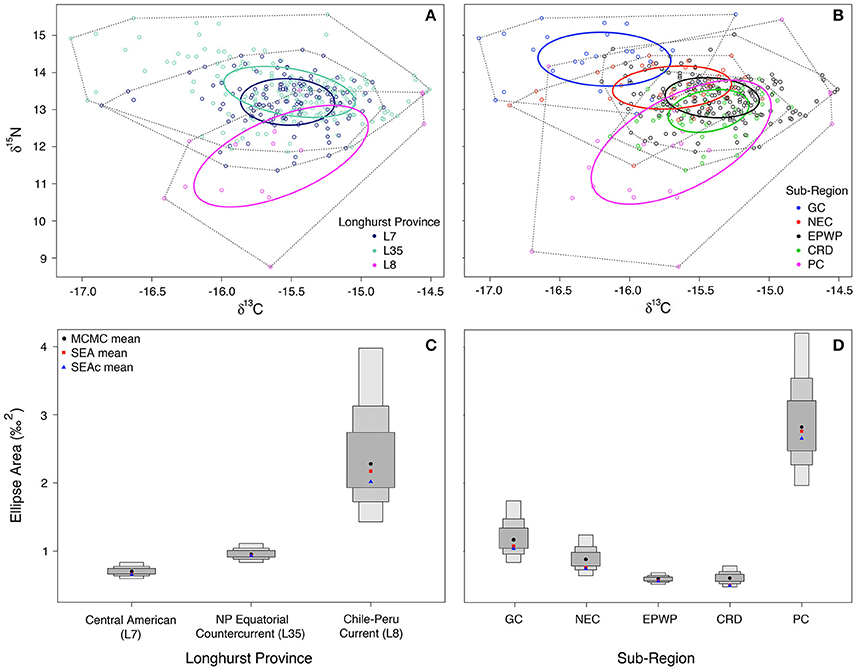
Figure 3. Maximum likelihood standard ellipse area (‰2) estimation is plotted for (A) (L7) Central American (n = 186), (L35) North Pacific Equatorial Countercurrent (n = 137), and (L8) Chile-Peru Current (n = 15) Longhurst provinces; and (B) Gulf of California (n = 29), North Equatorial Current (n = 36), East Pacific Warm Pool (n = 192), and Costa Rica Dome (n = 63) oceanographic sub-regions. Plotted in (C,D) are the Bayesian inference credible intervals (CI) around the Markov chain Monte Carlo (MCMC) ellipse area means, standard ellipse area (SEA) means, and the small sample size-corrected standard ellipse (SEAc) means (Parnell et al., 2010) for the Longhurst provinces and oceanographic sub-regions, respectively. The smallest/darkest gray box around the MCMC means (black circles) represents the 50% CI, and the next largest the 75% CI, and the largest the 95% CI.
Comparison of niche area across oceanic food webs defined by oceanographic features (Figure 3D) shows that olive ridley niche in the Peru Current is over two and half times larger than it is in the Gulf of California (>99% probability). Further, niche is larger in the Gulf of California than in the North Equatorial Current and the Costa Rica Dome (>89% and 99% probabilities, respectively). However, there is only moderate (~60%) confidence that niche is larger in the Costa Rica Dome than in the East Pacific Warm Pool, as their ellipse areas are quite similar.
Trophic position estimates using δ15NGlu – δ15NPhe vs. weighted means of multiple trophic and source amino acids were not significantly different [V = 231, p = 0.98; Supplementary Table 3]. Median TP across the entire eastern Pacific seascape was 3.14 ± 0.2 SD using the δ15NGlu – δ15NPhe approach (n = 31), and 3.18 ± 0.2 SD using the weighted mean approach (n = 29).
When comparing median TP across sub-regions, there was no significant difference across Longhurst provinces [χ2(2) = 1.83, p = 0.40], and no significant difference across oceanographic regions GC, NEC, EPWP, CRD, and PC [χ2(4) = 5.52, p = 0.24], regardless of TP estimation method. We see a significant difference in median TP between the Costa Rica Dome and all other oceanographic sub-regions pooled [W = 20, p = 0.046] when using the TPs estimated with δ15NGlu – δ15NPhe. Using this method, we find that individuals on the Costa Rica Dome were feeding at a 0.36 median TP higher than in other oceanographic sub-regions. However, we do not see a significant difference in median TP between the Costa Rica Dome and all other sub-regions pooled [W = 45, p = 0.70] using the TPs estimated with weight means of δ15N source and trophic amino acids. See Figure 4 and Supplementary Table 3 for results for both approaches.
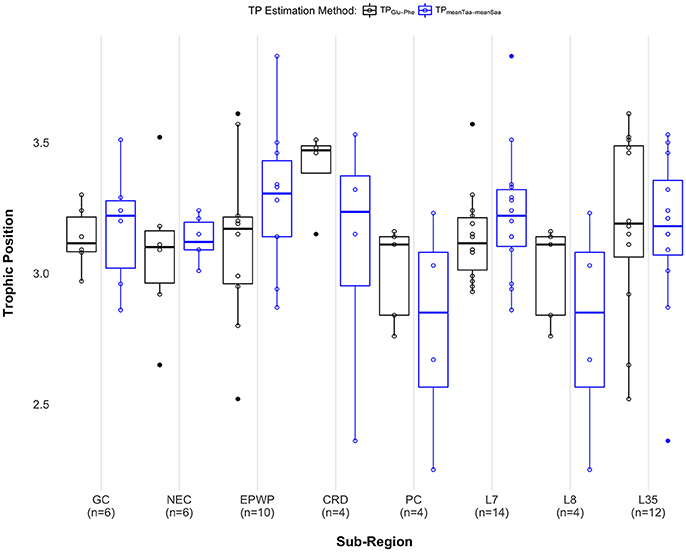
Figure 4. Paired boxplots show individual trophic position estimates as open black circles for the two-amino acid approach (TPGlu−Phe) and open blue circles for the weighted mean approach (TPmeanTaa−meanSaa). Median trophic position for each method is indicated as a dark black (TPGlu−Phe) or a blue (TPmeanTaa−meanSaa) band within each box, first and third quartiles as the lower and upper box sections, respectively, and the minimum and maximum estimates as whiskers. Outliers are displayed as solid circles. Sample sizes are labeled along the x-axis as follows: GC, Gulf of California (n = 6); NEC, North Equatorial Current (n = 6); EPWP, East Pacific Warm Pool (n = 10); CRD, Costa Rica Dome (n = 4); PC, Peru Current (n = 5 for the two-amino acid method; n = 4 for the weighted mean method); L7, Central American Coastal (n = 14); L8, Chile-Peru Current (n = 4); L35, North Pacific Equatorial Countercurrent (n = 12). Note that only the pair PC and L8 include the exact same data points. See Supplementary Material Data Table 2 for complete AA-CSIA data, including error propagation.
Discussion
This study is the first to quantify olive ridley isotopic niche and trophic position. Whereas trophic level estimates based on bulk tissue isotopic composition exists for other wide-ranging marine consumers, few studies compare trophic position across a species' range by accounting for baseline δ15N differences using AA-CSIA. We found that olive ridley trophic position is consistent across the eastern Pacific (~3.1), apart from perhaps on the Costa Rica Dome where it may be slightly elevated. Our AA-CSIA results also indicate that trophic position does not differ between adult males and females. Trophic consistency among olive ridleys within a given region is further supported by finding that bulk skin δ15N values do not vary with size (i.e., age), and this lack of diet shift may explain the lack of an ontogenetic habitat shift, as found in other sea turtle species (Turner Tomaszewicz et al., 2015). Together, these findings demonstrate the value of combining bulk-tissue analysis and AA-CSIA and highlights the status of the olive ridley as a unique oceanic consumer with relatively uniform foraging strategies among individuals, regardless of age, sex, or oceanic food web.
Isotopic Niche Space and Omnivory
The large ranges of δ13C [−17.08, −14.51‰] and δ15N [11.36, 15.56‰] values support the notion that olive ridleys are generalist omnivores, preying on a variety of primary producers (basal carbon sources) from primary and secondary trophic levels and in different areas of the ocean. Our findings suggest that despite potential individual foraging differences (e.g., prey species), the functional role of olive ridleys as omnivores, albeit largely planktivorous, remains consistent across oceanic food webs separated by thousands of kilometers. This is consistent with the few empirical dietary data for olive ridleys in this region (Bjorndal, 1997; NMFS and USFWS, 1998; Holt et al., 1999; Supplementary Tables 1, 5).
By estimating isotopic niche ellipse areas for each food web we are able to think critically about why the niche space of an omnivore may vary across a species' range. Since baseline δ13C and δ15N values and their within-food web variation influences niche space, we discuss each ellipse estimate in relation to the biological and physical forces acting in each food web. Although, Longhurst province boundaries are defined by physical forces that regulate the distribution of phytoplankton in the ocean, grouping foraging turtles accordingly was too coarse a scale for this investigation. While these ecological partitions are useful in guiding large-scale biogeochemical (e.g., isotope) studies concerned with nutrient cycling, they are static and quite large compared to the sub-regions that have been defined based on persistent oceanographic features with distinct biogeochemical cycling. Given this, we focus our discussion on the latter.
Ellipse area estimates suggest that the olive ridley's isotopic niche is larger in the Gulf of California and the North Equatorial Current than on the Costa Rica Dome or in East Pacific Warm Pool. Further, their Peru Current isotopic niche space is roughly three times the size of any eastern Pacific food web that we examined north of the equator, driven by large variations in both δ13C and δ15N values.
One explanation for a broader isotopic niche (~1‰2) for olive ridleys in the Gulf of California compared to the other northern sub-regions might be that the majority of turtles were sampled in the Gulf entrance, where some hypothesize regional coupling of denitrification-nitrification occurs (Mee et al., 1984; White et al., 2007). There, nitrogen inputs come from a mix of 15N-enriched (denitrified) subsurface water from the Eastern Tropical North Pacific (ETNP) transported via the California Undercurrent; relatively 15N-depleted warm surface water from the west; and 15N-enriched terrestrial inputs (sediments, guano, runoff). Whereas N2-fixation in the Gulf of California appears to be episodic and seasonal (White et al., 2013), all the Gulf of California olive ridleys were sampled during the month of August. During summer months, the water column is stratified and Gulf of California surface waters, including entrance zone waters, are dominated by picocynaobacteria and modest N2 fixation (White et al., 2013). We suggest turtles could have conceivably fed offshore or in deeper entrance zone waters within the month prior to sampling, retaining the “offshore” δ13C signal as they moved into the Gulf (Hobson et al., 1994; Hill et al., 2006; Miller et al., 2008), or perhaps turtles fed in both pelagic and benthic habitats across the entrance zone and lower Gulf (France, 1995; Hill et al., 2014). Both scenarios could result in the observed δ13C range [−17.08, −15.24].
The East Pacific Warm Pool supports an impressively small isotopic niche area for olive ridleys (0.6‰2) considering it is the largest sub-region by geography, spanning 10° of latitude and 16° of longitude. N* values (a metric used to trace nitrate deficit relative to phosphate) in this sub-region indicate a high degree of denitrified waters that are likely a dominant control on the δ15N values of bioavailable nitrogen. As such, across the entire subtropical and tropical eastern Pacific, nitrate concentrations are lowest in the East Pacific Warm Pool, as are N* concentrations, modeled downwards of < −20 (μM; Rafter et al., 2012). Further, characteristics that influence the bioavailable nitrogen in the euphotic zone such as temperature, pycnocline, and mixed layer depth are particularly stable and reliable during the season in which our sampling was conducted (Fiedler and Talley, 2006). The Gulf of Tehuantepec and the Gulf of Papagayo are two especially productive gulfs (relatively higher chlorophyll and concentrations) within the East Pacific Warm Pool due to wind-driven upwelling. Many of the samples we examine within the East Pacific Warm Pool were in or near those two gulfs because encounter rates were so high there.
The Costa Rica Dome supports an isotopic niche area almost equal in size (0.5‰2) to the East Pacific Warm Pool, but is considerably smaller in geographic size (we consider it 800–1,000 km in diameter). It is the most seasonally dynamic oceanographic feature in the eastern tropical Pacific (ETP) with a predictable strong and shallow thermocline (15 m at the peak of the dome, shoaling off to 50 m to the N and S) (Fiedler, 2002). Both the East Pacific Warm Pool and the Costa Rica Dome are within the Tropical Surface Water mass (Fiedler and Talley, 2006) and have high concentrations of chlorophyll and nitrate compared to other areas in the eastern Pacific (Pennington et al., 2006). While driven by different physical sources, the gulfs of Tehuantepec and Papagayo and the Costa Rica Dome share characteristics, such as upwelling, nitrate concentrations, and denitrification, that determine basal isotopic signals, which is why we believe these areas support a similar isotope niche for olive ridleys.
The Peru Current is one of the strongest upwelling regions in the world, particularly during austral winter, and thus denitrification is dominant and CO2 efflux is high. This creates large variation in δ15N, upwards of 11‰, and δ13C, upwards of 5‰, just south of the equator and along the equatorial belt (Farrell et al., 1995; Arguelles et al., 2012). The pattern of low δ15N values in olive ridley skin in this food web, specifically between 5° and 15° S, follow observations of low δ15N values of particulate organic material in surface waters. This suggests that the observed variation of bulk skin δ15N values was caused by baseline shifts, not trophic shifts. The large Peru Current isotopic niche area estimate (~2.7‰2) suggests there may be unique food web dynamics in the south equatorial region.
Trophic Position
Our understanding of olive ridleys as opportunistic foragers implies that their trophic role (i.e., trophic position) would not differ across their range. This study design provided an opportunity to test that assumption, as well as to compare the results of estimating TP using the weighted mean approach with the approach of using just two amino acids (phenylalanine and glutamic acid). Recent studies by Bradley et al. (2015) and Nielsen et al. (2015) show that using weighted means to estimate marine teleost TPs resulted in more precise estimates across taxa and trophic levels. Using the weighted mean approach, we did not find any statistical difference in TP across food webs; but using the two-amino acid approach, we detected a 0.36 TP elevation on the Costa Rica Dome.
Similar to other organisms in the eastern Pacific (e.g., copepods, laternfishes and tuna; Popp et al., 2007; Olson et al., 2010; Hetherington et al., 2017), olive ridley bulk skin δ15N values showed a tendency to be more 15N-enriched in higher latitudes. Often, differences in δ15N values of consumers may be driven by trophic differences among spatially discrete foraging populations (Vander Zanden and Rasmussen, 2001). However, the TP of adult olive ridleys was remarkably constant (3.1 ± 0.2 SD) across a variety of oceanographic settings in the eastern Pacific, including the Peru Current. With this, we are confident that variation of bulk δ15N values was indeed driven by the shifting δ15N baseline across food webs.
TP estimates from both methods, ranging from ~2.4 to ~3.6, make biological sense and reflect the expected omnivory. Other sea turtles studies that have estimated TP have raised concern over the reasonability of their TP estimates, driven by the beta and trophic discrimination factors used, and/or the TP estimation method (Seminoff et al., 2012; Vander Zanden et al., 2013). It is important to note that these constants can be somewhat arbitrary for species that have not been the focus of controlled feeding studies, and varying them can noticeably change TP estimates. In this study, constants from Bradley et al. (2015) were chosen carefully; they did not vary between TP estimation methods and appear to have performed well.
Source amino acids grouped nicely from trophic amino acids across samples, and the bulk skin δ15N values reflected a composite of both groups. For each group of amino acids, there was a median δ15N spread of about 7‰. Among the source amino acids, the largest spread was between lysine (low) and tyrosine (high), and among the trophic amino acids the largest spread was between aspartic acid (low) and alanine (high). No amino acids appeared to be intermediate. Regardless of the robustness of this study's amino acid isotope data, across taxa, to date the amino acids that seem to most reliably estimate TPs indicative of ecological expectations are phenylalanine and glutamic acid (Chikaraishi et al., 2009). Quantification of amino acid-specific incorporation rates and trophic discrimination for multiple taxa and tissues types would provide clarity as to which approach (two-amino acid vs. weight mean) is most reliable.
Costa Rica Dome—A Unique Food Web?
There was one exception to the trophic position consistency for olive ridleys: on the Costa Rica Dome, individuals fed at a 0.36 median level higher than in any other sub-region (Figure 4). As stated above, this conclusion can be drawn from estimating TPs using δ15NGlu – δ15NPhe, however it does not hold when using weighted means. While the former result seems reasonable, as many high-level consumers (cetaceans, seabirds, tuna) consistently aggregate to feed on the Costa Rica Dome's standing stocks of zooplankton and other prey (Reilly and Thayer, 1990; Sissenwine et al., 1998; Ballance et al., 2006), this discrepancy highlights the need to continue to advance the application of stable isotopes to understand sea turtle ecology.
To our knowledge, all AA-CSIA studies of wide-ranging consumers, both generalists and specialists, find the same TP consistency that we found for adult olive ridleys. For example, TPs of tuna, adult leatherbacks, lanternfishes, dragonfishes, and zooplankton do not change across ocean basins (Popp et al., 2007; Olson et al., 2010; Choy et al., 2012; Seminoff et al., 2012; Hetherington et al., 2017). This underscores the uniqueness of detecting a potential trophic shift on the Costa Rica Dome. Such a shift could be a reflection of a diet of a slightly wider variety of prey items, or a diet of a relatively larger proportion of high order prey (see Supplementary Table 5).
The benefits of using stable isotopes are many; the analyses can be cost effective and integrated with other techniques like telemetry and genetics. However, limitations can cloud our ability to interpret results and/or can produce conflicting results, as in this case. Limitations include the lack of accurate and species-specific discrimination factors, and our understanding of what might drive variation across groups of amino acids (source, trophic). The approach used to estimate TP seems to matter, however more research on this is needed for sea turtles.
Conservation Implications
Olive ridley subpopulations in the eastern Pacific are genetically distinct from subpopulations in the western Pacific breeding population (Bowen et al., 1997; Shanker et al., 2004; Wallace et al., 2010; Jensen et al., 2013). While individuals have the ability to migrate >1,500 km, as nomads they do not have consistent home ranges (Pandav and Choudhury, 1998; Polovina et al., 2003; Whiting et al., 2007; Plotkin, 2010). Rather, they continuously forage opportunistically on a wide variety of prey. The empirical characterization of open ocean foraging ecology via stable isotope analyses has provided insight into why this turtle species has been successful compared to other, coastal species. We believe that foraging plasticity combined with relatively fast generation time allowed olive ridleys to recover quickly in the eastern Pacific, compared to other depleted turtle species, after near extinction from over-harvest in the 1960s (Abreu-Grobois and Plotkin, 2008; Plotkin et al., 2012).
The olive ridley's generalist foraging strategy is advantageous for survivorship and suggests that they may be resilient to disturbance (Heppell et al., 2005; Plotkin, 2010; Clavel et al., 2011). However, they have other biological characteristics such as low metabolism, narrow thermal niche and nesting dichotomy that may make them vulnerable to environmental change unless they are able to adapt on relevant time scales (Merchant-Larios et al., 1997; Lutz et al., 2003; Polovina et al., 2003; McMahon and Hays, 2006; Plotkin et al., 2012). Climate change may be particularly problematic for sea turtles given population sex-ratios are temperature-dependent, and they nest on beaches that may be impacted by sea level rise (Hawkes et al., 2009). As ocean temperature, chemistry, circulation, and species distributions are changing with climate (Doney et al., 2012), it is a critical time to broaden our understanding of phenology, demography, trophic roles and function of mobile consumers so that vulnerable species and their oceanic habitats can be better managed in the face of environmental variability (Micheli, 1999; Edwards and Richardson, 2004).
Since olive ridleys encounter spatially-explicit resources and threats, innovative management approaches may be necessary to achieve modern conservation objectives. A promising dynamic ecosystem-based management approach would be to predict areas where suitable foraging habitat overlaps with other areas of interest, or the presence of threats (e.g., fishing) (Howell et al., 2008; Maxwell et al., 2014, 2015; Scales et al., 2014). Given their enormous eastern Pacific range across swaths of unproductive warm waters, where they feed largely on things humans are not yet interested in harvesting, strategic conservation measures (e.g., protecting key nesting beaches) may enable olive ridleys to be a global warming winner.
Conclusions
This study demonstrates the value of large-scale, in-water research across different foraging habitats to understand the foraging ecology of highly migratory marine species, such as the olive ridley sea turtle. As the frequency and durations of costly research cruises decrease, the value of taking advantage of research platforms of opportunity to study oceanic species like olive ridleys increases. Further, we have presented yet another example of how stable isotope analyses provide a relatively non-invasive and cost-effective analytical approach to describe the trophic ecology of a cryptic, mobile species with a large oceanic distribution. We used bulk tissue and compound-specific analyses to develop the hypotheses that in the ETP, the trophic position of the omnivorous olive ridley sea turtle remains constant with ontogenesis and sex.
We conclude that olive ridley turtles exploit persistent but dynamic oceanographic features as distinct food webs. Using AA-CSIA, we did not detect a shift in the trophic position of adult olive ridleys across any of the identified sub-regions using the weighted mean approach, indicating their energetic requirements are comparably met throughout their range. The isotopic data generated in this study adds to the growing body of work describing stable isotope baseline data for marine organisms in the eastern Pacific Ocean (Arthur et al., 2008; Olson et al., 2010; Ruiz-Cooley and Gerrodette, 2012; Seminoff et al., 2012). A natural future direction would be to estimate marine isoscapes across taxa and trophic levels to provide a systematic framework for stable isotope ecological applications, as well as empirical studies of trophic dynamics (Somes et al., 2010; Ceriani et al., 2014; Vander Zanden et al., 2015; Magozzi et al., 2017; Kurle and McWhorter, 2017). A central repository of stable isotope data for sea turtles would support the advancement of this field and reduce duplication of efforts (Pauli, 2017). Refinement of species-specific diet-tissue δ15N values and other parameters will minimize assumptions, improve interpretation, and aid our understanding of oceanic food webs.
Ethics Statement
Peruvian research and protocol were reviewed and approved by the Duke University Ethics Committee and all necessary permits were obtained from Peruvian authorities (Peruvian Government Authorization No. 177-2008-IRENA-IFFS-DCB).
Author Contributions
LP, RP, and JS conceived of and designed this study. LP, BP, KA, and SK completed the laboratory analysis. LP completed the quantitative analysis. LP and JS wrote the paper with input from all authors. LP, BP, SG, and JS provided financial support.
Conflict of Interest Statement
The authors declare that the research was conducted in the absence of any commercial or financial relationships that could be construed as a potential conflict of interest.
Acknowledgments
All samples from the eastern tropical Pacific Ocean were collected under NOAA PRD Research Permit #774 1714. Special thanks to the captains, crews, and sea-going scientists of the NOAA Ship DAVID STARR JORDAN; Chief Scientists and Survey Coordinators of ETP Cetacean and Ecosystem Assessment Surveys (MMTD, SWFSC); CDA, MGB, LED, RMF, MPJ, BEK, DAS, and KRS for helpful reviews of earlier drafts of this manuscript; Natalie Wallsgrove and Cassie Lyons at the University of Hawaii for laboratory assistance; and J. Schumacher, B. D. MacDonald, G. E. Lemons, and D. Prosperi for laboratory and database assistance at SWFSC. Funding for this project was provided by NOAA Southwest Fisheries Science Center, Protected Resources Division; the National Science Foundation Graduate Research Fellowship grant #0946813; the NSF award #1137336, Inter-university Training in Continental-scale Ecology; and Turtles in the Deep crowdfunders via SciFund Round One. Open access to this publication was made possible by the UC Santa Barbara Library's Open Access Fund. This is SOEST contribution number 10210.
Supplementary Material
The Supplementary Material for this article can be found online at: https://www.frontiersin.org/articles/10.3389/fmars.2017.00348/full#supplementary-material
References
Abreu-Grobois, A., and Plotkin, P. (2008). Lepidochelys olivacea. The IUCN Red List of Threatened Species Version 2014.3.
Allen, C. D., Lemons, G. E., Eguchi, T., LeRoux, R. A., Fahy, C. C., Dutton, P. H., et al. (2013). Stable isotope analysis reveals migratory origin of loggerhead turtles in the Southern California Bight. Mar. Ecol. Prog. Ser. 472, 275–285. doi: 10.3354/meps10023
Arguelles, J., Lorrain, A., Cherel, Y., Graco, M., Tafur, R., Alegre, A., et al. (2012). Tracking habitat and resource use for the jumbo squid Dosidicus gigas: a stable isotope analysis in the Northern Humboldt Current System. Mar. Biol. 159, 2105–2116. doi: 10.1007/s00227-012-1998-2
Arthur, K. E., Boyle, M. C., and Limpus, C. J. (2008). Ontogenetic changes in diet and habitat use in green sea turtle (Chelonia mydas) life history. Mar. Ecol. Prog. Ser. 362, 303–311. doi: 10.3354/meps07440
Arthur, K. E., Kelez, S., Larsen, T., Choy, C. A., and Popp, B. N. (2014). Tracing the biosynthetic source of essential amino acids in marine turtles using δ13C fingerprints. Ecology 95, 1285–1293. doi: 10.1890/13-0263.1
Ballance, L. T., Pitman, R. L., and Fiedler, P. C. (2006). Oceanographic influences on seabirds and cetaceans of the eastern tropical Pacific: a review. Prog. Oceanogr. 69, 360–390. doi: 10.1016/j.pocean.2006.03.013
Bearhop, S., Adams, C. E., Waldron, S., Fuller, R. A., and Macleod, H. (2004). Determining trophic niche width: a novel approach using stable isotope analysis. J. Anim. Ecol. 73, 1007–1012. doi: 10.1111/j.0021-8790.2004.00861.x
Behera, S., Tripathy, B., and Sivakumar, K. (2015). Stomach contents of olive ridley turtles (Lepidochelys olivacea) occurring in Gahirmatha, Odisha Coast of India. Proc. Zool. Soc. 68, 91–95. doi: 10.1007/s12595-014-0100-0
Bergamo, T. F., Botta, S., and Copertino, M. (2016). Lipid extraction in stable isotope analyses of juvenile sea turtle skin and muscle. Aquat. Biol. 25, 1–6. doi: 10.3354/ab00652
Bjorndal, K. A. (1997). “Foraging ecology and nutrition of sea turtles,” in The Biology of Sea Turtles, eds P. L. Lutz and J. A. Musick (Boca Raton, FL: CRC Press), 199–231.
Block, B. A., Costa, D. P., Boehlert, G. W., and Kochevar, R. E. (2002). Revealing pelagic habitat use: the tagging of Pacific pelagics program. Oceanol. Acta 25, 255–266. doi: 10.1016/S0399-1784(02)01212-4
Bolten, A. B. (2003). “Variation in sea turtle life history patterns: neritic vs. oceanic developmental stages,” in The Biology of Sea Turtles, Vol. 2, eds P. L. Lutz, J. A. Musick, and J. Wyneken (Boca Raton, FL), 243–258.
Bowen, B. W., Clark, A. M., Abreu-Grobois, F. A., Chaves, A., Reichart, H. A., and Ferl, R. J. (1997). Global phylogeography of the ridley sea turtles (Lepidochelys spp.) as inferred from mitochondrial DNA sequences. Genetica 101, 179–189.
Bowes, R. E., and Thorp, J. H. (2015). Consequences of employing amino acid vs. bulk-tissue, stable isotope analysis: a laboratory trophic position experiment. Ecosphere 6, 1–12. doi: 10.1890/ES14-00423.1
Bradley, C. J., Madigan, D. J., Block, B. A., and Popp, B. N. (2014). Amino acid isotope incorporation and enrichment factors in Pacific bluefin tuna, Thunnus orientalis. PLoS ONE 9:e85818. doi: 10.1371/journal.pone.0085818
Bradley, C. J., Wallsgrove, N. J., Anela Choy, C., Drazen, J. C., Hetherington, E. D., Hoen, D. K., et al. (2015). Trophic position estimates of marine teleosts using amino acid compound specific isotopic analysis. Limnol. Oceanogr. 13, 476–493. doi: 10.1002/lom3.10041
Cabana, G., and Rasmussen, J. B. (1996). Comparison of aquatic food chains using nitrogen isotopes. Proc. Natl. Acad. Sci. U.S.A. 93, 10844–10847. doi: 10.1073/pnas.93.20.10844
Cassar, N., Laws, E. A., and Popp, B. N. (2006). Carbon isotopic fractionation by the marine diatom Phaeodactylum tricornutum under nutrient- and light-limited growth conditions. Geochim. Cosmochim. Acta 70, 5323–5335. doi: 10.1016/j.gca.2006.08.024
Ceriani, S. A., Roth, J. D., Sasso, C. R., McClelland, C. M., James, M. C., Haas, H. L., et al. (2014). Modeling and mapping isotopic patterns in the Northwest Atlantic derived from loggerhead sea turtles. Ecosphere 5, 1–24. doi: 10.1890/ES14-00230.1
Chikaraishi, Y., Kashiyama, Y., Ogawa, N. O., Kitazato, H., and Ohkouchi, N. (2007). Metabolic control of nitrogen isotope composition of amino acids in macroalgae and gastropods: implications for aquatic food web studies. Mar. Ecol. Prog. Ser. 342, 85–90. doi: 10.3354/meps342085
Chikaraishi, Y., Ogawa, N. O., and Ohkouchi, N. (2010). Further Evaluation of the Trophic Level Estimation Based on Nitrogen Isotopic Composition of Amino Acids. Kyoto: Kyoto University Press.
Chikaraishi, Y., Ogawa, N. O., Kashiyama, Y., Takano, Y., Suga, H., Tomitani, A., et al. (2009). Determination of aquatic food-web structure based on compound-specific nitrogen isotopic composition of amino acids. Limnol. Oceanogr. 7, 740–750. doi: 10.4319/lom.2009.7.740
Choy, C. A., Davison, P. C., Drazen, J. C., Flynn, A., Gier, E. J., Hoffman, J. C., et al. (2012). Global trophic position comparison of two dominant mesopelagic fish families (Myctophidae, Stomiidae) using amino acid nitrogen isotopic analyses. PLoS ONE 7:e50133. doi: 10.1371/journal.pone.0050133
Clavel, J., Julliard, R., and Devictor, V. (2011). Worldwide decline of specialist species: toward a global funcational homogenization? Front. Ecol. Environ. 9, 222–228. doi: 10.1890/080216
Dale, J. J., Wallsgrove, N. J., Popp, B. N., and Holland, K. (2011). Nursery habitat use and foraging ecology of the brown stingray Dasyatis lata determined from stomach contents, bulk and amino acid stable isotopes. Mar. Ecol. Prog. Ser. 433, 221–236. doi: 10.3354/meps09171
Décima, M., Landry, M. R., and Popp, B. N. (2013). Environmental perturbation effects on baseline δ15N values and zooplankton trophic flexibility in the southern California Current Ecosystem. Limnol. Oceanogr. 58, 624–634. doi: 10.4319/lo.2013.58.2.0624
DeNiro, M. J., and Epstein, S. (1981). Influence of diet on the distribution of nitrogen isotopes in animals. Geochim. Cosmochim. Acta 45, 341–351. doi: 10.1016/0016-7037(81)90244-1
Doney, S. C., Ruckelshaus, M., Duffy, J. E., Barry, J. P., Chan, F., English, C. A., et al. (2012). Climate change impacts on marine ecosystems. Annu. Rev. Mar. Sci. 4, 11–37. doi: 10.1146/annurev-marine-041911-111611
Duffy, J. E., Cardinale, B. J., France, K. E., McIntyre, P. B., Thebault, E., and Loreau, M. (2007). The functional role of biodiversity in ecosystems: incorporating trophic complexity. Ecol. Lett. 10, 522–538. doi: 10.1111/j.1461-0248.2007.01037.x
Edwards, M., and Richardson, A. J. (2004). Impact of climate change on marine pelagic phenology and trophic mismatch. Nature 430, 881–884. doi: 10.1038/nature02808
Eguchi, T., Gerrodette, T., Pitman, R., Seminoff, J. A., and Dutton, P. H. (2007). At-sea density and abundance estimates of the olive ridley turtle Lepidochelys olivacea in the Eastern Tropical Pacific. Endang. Species Res. 3, 191–203. doi: 10.3354/esr003191
Farrell, J. W., Pedersen, T. F., Calvert, S. E., and Nielsen, B. (1995). Glacial-interglacial changes in nutrient utilization in the equatorial Pacific Ocean. Nature 377, 514–517.
Fiedler, P. C. (2002). The annual cycle and biological effects of the Costa Rica Dome. Deep Sea Res. I Oceanogr. Res. Pap. 49, 321–338. doi: 10.1016/S0967-0637(01)00057-7
Fiedler, P. C., and Talley, L. D. (2006). Hydrography of the eastern tropical Pacific: a review. Prog. Oceanogr. 69, 143–180. doi: 10.1016/j.pocean.2006.03.008
France, R. L. (1995). Carbon-13 enrichment in benthic compared to planktonic algae: foodweb implications. Mar. Ecol. Prog. Ser. 124, 307–312. doi: 10.3354/meps124307
Fry, B. (1988). Food web structure on Georges Bank from stable C, N, and S isotopic compositions. Limnol. Oceanogr. 33, 1182–1190. doi: 10.4319/lo.1988.33.5.1182
Hannides, C. C. S., Popp, B. N., Landry, M. R., and Graham, B. S. (2009). Quantification of zooplankton trophic position in the North Pacific Subtropical Gyre using stable isotope nitrogen isotopes. Limnol. Oceanogr. 54, 50–61. doi: 10.4319/lo.2009.54.1.0050
Hawkes, L. A., Broderick, A. C., Godfrey, M. H., and Godley, B. J. (2009). Climate change and marine turtles. Endangered Species Res. 7, 137–154. doi: 10.3354/esr00198
Heppell, S. S., Crouse, D. T., Crowder, L. B., Epperly, S. P., Gabriel, W., Henwood, T., et al. (2005). A population model to estimate recovery time, population size, and management impacts on Kemp's ridley sea turtles. Chelonian Conserv. Biol. 4, 767–773.
Hetherington, E. D., Olson, R. J., Drazen, J. C., Lennert-Cody, C. E., Ballance, L. T., Kaufmann, R. S., et al. (2017). Spatial food-web structure in the eastern tropical Pacific Ocean based on compound-specific nitrogen isotope analysis of amino acids. Limnol. Oceanogr. 62, 541–560. doi: 10.1002/lno.10443
Hill, J. M., McQuaid, C. D., and Kaehler, S. (2006). Biogeographic and nearshore-offshore trends in isotope ratios of intertidal mussels and their food sources around the coast of southern Africa. Mar. Ecol. Prog. Ser. 318, 63–73. doi: 10.3354/meps318063
Hill, T. M., Myrvold, C. R., Spero, H. J., and Guilderson, T. P. (2014). Evidence for benthic-pelagic food web coupling and carbon export from California margin bamboo coral archives. Biogeosciences 11, 3845–3854. doi: 10.5194/bg-11-3845-2014
Hobson, K. A. (1999). Tracing origins and migration of wildlife using stable isotopes: a review. Oecologia 120, 314–326. doi: 10.1007/s004420050865
Hobson, K. A., Piatt, J. F., and Pitocchelli, J. (1994). Usiing stable isotopes to determine seabird trophic relationships. J. Anim. Ecol. 63, 786–798. doi: 10.2307/5256
Hobson, K. A., Van Wilgenburg, S. L., Wassenaar, L. I., Powell, R. L., Still, C. J., and Craine, J. M. (2012). A multi-isotope (δ13C, δ15N, δ2H) feather isoscape to assign Afrotropical migrant birds to origins. Ecosphere 3, 1–20. doi: 10.1890/ES12-00018.1
Holt, R. D., Lawton, J. H., Polis, G. A., and Martinez, N. D. (1999). Trophic rank and the species-area relationship. Ecology 80, 1495–1504.
Howell, E. A., Kobayashi, D. R., Parker, D. M., Balazs, G. H., and Polovina, J. J. (2008). TurtleWatch: a tool to aid in the bycatch reduction of loggerhead turtles Caretta caretta in the Hawaii-based pelagic longline fishery. Endangered Species Res. 5, 267–278. doi: 10.3354/esr00096
Hussey, N. E., MacNeil, M. A., McMeans, B. C., Olin, J. A., Dudley, S. F. J., Cliff, G., et al. (2014). Rescaling the trophic structure of marine food webs. Ecol. Lett. 17, 239–250. doi: 10.1111/ele.12226
Hutchinson, G. E. (1957). Concluding remarks. Cold Spring Harb. Symp. Quant. Biol. 22, 415–427. doi: 10.1101/SQB.1957.022.01.039
Jackson, A. L., Inger, R., Parnell, A. C., and Bearhop, S. (2011). Comparing isotopic niche widths among and within communities: SIBER - Stable Isotope Bayesian Ellipses in R. J. Anim. Ecol. 80, 595–602. doi: 10.1111/j.1365-2656.2011.01806.x
Jackson, A., Gerrodette, T., Chivers, S., Lynn, M., Rankin, S., and Mesnick, S. (2008). Marine Mammal Data Collected during a Survey in the Eastern Tropical Pacific Ocean Aboard NOAA Ships David Starr Jordan and McArthur II, July 28 - December 7, 2006. USDO Commerce. NOAA-TM-NMFS-SWFSC-421.
Jensen, M. P., Limpus, C. J., Whiting, S. D., Guinea, M., Prince, R. I. T., Dethmers, K. E. M., et al. (2013). Defining olive ridley turtle Lepidochelys olivacea management units in Australia and assessing the potential impact of mortality in ghost nets. Endangered Species Res. 21, 241–253. doi: 10.3354/esr00521
Jones, T. T., and Seminoff, J. A. (2013). “Feeding biology: advances from field-based observations, physiological studies, and molecular techniques,” in The Biology of Sea Turtles, Vol. 3, eds J. Musick, J. Wyneken, and K. Lohman (Boca Raton, FL: CRC Press), 211–248.
Kelez, S. (2011). Bycatch and Foraging Ecology of Sea Turtles in the Eastern Pacific. Ph.D. Dissertation, Duke University.
Kopitsky, K. L., Pitman, R. L., and Dutton, P. H. (2005). “Aspects of olive ridley feeding ecology in the eastern tropical Pacific,” in Proceedings of the Twenty-First Annual Symposium on Sea Turtle Biology and Conservation, eds M. S. Coyne and R. D. Clark USDO Commerce (Miami, FL: NOAA Technical Memo NMFS-SEFSC-528).
Kurle, C. M., and McWhorter, J. K. (2017). Spatial and temporal variability within marine isoscapes: implications for interpreting stable isotope data from marine systems. Mar. Ecol. Press Ser. 568, 31–45. doi: 10.3354/meps12045
Laws, E. A., Popp, B. N., Bidigare, R. R., Kennicutt, M. C., and Macko, S. A. (1995). Dependence of phytoplankton carbon isotopic composition on growth rate and [CO2]aq: theoretical considerations and experimental results. Geochim. Cosmochim. Acta 59, 1131–1138. doi: 10.1016/0016-7037(95)00030-4
Lemons, G. E., Lewison, R. L., Komoroske, L. M., Gaos, A. R., Lai, C. T., Dutton, P. H., et al. (2011). Trophic ecology of green sea turtles in a highly urbanized bay: insights from stable isotopes and mixing models. J. Exp. Mar. Biol. Ecol. 405, 25–32. doi: 10.1016/j.jembe.2011.05.012
Longhurst, A. R., and Harrison, W. G. (1989). The biological pump: profiles of plankton production and consumption in the upper ocean. Prog. Oceanogr. 22, 47–123. doi: 10.1016/0079-6611(89)90010-4
Lorrain, A., Graham, B., Ménard, F., Popp, B. N., Bouillon, S., Van Breugel, P., et al. (2009). Nitrogen and carbon isotope values of individual amino acids: a tool to study foraging ecology of penguins in the Southern Ocean. Mar. Ecol. Prog. Ser. 391, 293–306. doi: 10.3354/meps08215
Lutz, P. L., Musick, J. A., and Wyneken, J. (2003). The Biology of Sea Turtles, Vol. 2. New York, NY: CRC Press.
Magozzi, S., Yool, A., Vander Zanden, H. B., Wunder, M. B., and Trueman, C. N. (2017). Using ocean models to predict spatial and temporal variation in marine carbon isotopes. Ecosphere 8:e01763. doi: 10.1002/ecs2.1763
Maxwell, S. M., Ban, N. C., and Morgan, L. E. (2014). Pragmatic approaches for effective management of pelagic marine protected areas. Endangered Species Res. 26, 59–74. doi: 10.3354/esr00617
Maxwell, S. M., Hazen, E. L., Lewison, R. L., Dunn, D. C., Bailey, H., Bograd, S. J., et al. (2015). Dynamic ocean management: defining and conceptualizing real-time management of the ocean. Mar. Policy 58, 42–50. doi: 10.1016/j.marpol.2015.03.014
McClelland, J. M., and Montoya, J. P. (2002). Trophic relationships and the nitrogen isotopic composition of amino acids in plankton. Ecology 83, 2173–2180. doi: 10.1890/0012-9658(2002)083[2173:TRATNI]2.0.CO;2
McMahon, C. R., and Hays, G. C. (2006). Thermal niche, large-scale movements and implications of climate change for a critically endangered marine vertebrate. Global Change Biol. 12, 1–9. doi: 10.1111/j.1365-2486.2006.01174.x
McMahon, C. R., Bradshaw, C. J. A., and Hays, G. C. (2007). Satellite tracking reveals unusual diving characteristics for a marine reptile, the olive ridley turtle (Lepidochelys olivacea). Mar. Ecol. Prog. Ser. 329, 239–252. doi: 10.3354/meps329239
McMahon, K. W., Ling Hamady, L., and Thorrold, S. R. (2013). A review of ecogeochemistry approaches to estimating movements of marine animals. Limnol. Oceanogr. 58, 697–714. doi: 10.4319/lo.2013.58.2.0697
Medeiros, L., Monteiro, D. D., Petitet, R., and Bugoni, L. (2015). Effects of lipid extraction on the isotopic values of sea turtle bone collagen. Aquat. Biol. 23, 191–199. doi: 10.3354/ab00628
Mee, L. D., Cortes-Altamirano, R., and Garcia de la Paraa, L. M. (1984). Dinitrogen fixation in a eutrophic tropical bay. Coast. Shelf Sci. 19, 477–483. doi: 10.1016/0272-7714(84)90098-2
Menge, B. A., and Sutherland, J. P. (1976). Species-diversity gradients: synthesis of roles of predation, competition, and temporal heterogeneity. Am. Nat. 110, 351–369. doi: 10.1086/283073
Merchant-Larios, H., Ruiz-Ramirez, S., Moreno-Mendoza, N., and Marmolejo-Valencia, A. (1997). Correlation among thermosensitive period, estradiol response, and gonad differentiation in the sea turtle (Lepidochelys olivacea). Gen. Comp. Endocrinol. 107, 373–385. doi: 10.1006/gcen.1997.6946
Micheli, F. (1999). Eutrophication, fisheries, and consumer-resource dynamics in marine pelagic ecosystems. Science 285, 1396–1398.
Miller, T. W., Brodeur, R. D., and Rau, G. H. (2008). Carbon stable isotopes reveal relative contribution of shelf-slope production to the northern California Current pelagic community. Limnol. Oceanogr. 53, 1493–1503. doi: 10.4319/lo.2008.53.4.1493
Minagawa, M., and Wada, E. (1984). Stepwise enrichment of 15N along food chains: further evidence and the relation between δ15N and animal age. Geochim. Cosmochim. Acta 48, 1135–1140. doi: 10.1016/0016-7037(84)90204-7
Montoya, J. P. (2007). “Natural abundance of 15N in marine planktonic ecosystems,” in Stable Isotopes in Ecology and Environmental Science, 2nd Edn., eds R. Michener and K. Lajtha (Malden, MA: Blackwell Publishing Ltd), 176–201.
Newsome, S. D., del Rio, C. M., Bearhop, S., and Phillips, D. L. (2007). A niche for isotopic ecology. Front. Ecol. Environ. 5, 429–436. doi: 10.1890/060150.1
Nielsen, J. M., Popp, B. N., and Winder, M. (2015). Meta-analysis of amino acid stable nitrogen isotope ratios for estimating trophic position in marine organisms. Oecologia 178, 631–642. doi: 10.1007/s00442-015-3305-7
NMFS and USFWS (1998). Recovery Plan for U.S. Pacific Populations of the Olive Ridley Turtle (Lepidochelys olivacea). Silver Spring, MD: National Marine Fisheries Service.
Olson, R. J., Popp, B. N., Graham, B. S., López-Ibarra, G. A., Galván-Maga-a, F., Lennert-Cody, C. E., et al. (2010). Food-web inferences of stable isotope spatial patterns in copepods and yellowfin tuna in the pelagic eastern Pacific Ocean. Progr. Oceanogr. 86, 124–138. doi: 10.1016/j.pocean.2010.04.026
Pandav, B., and Choudhury, B. C. (1998). Olive ridley tagged in Orissa recovered in the coatal waters of eastern Sri Lanka. Mar. Turtle Newslett. 82, 9–10.
Parnell, A. C., Rands, S., Inger, R., Bearhop, S., and Jackson, A. L. (2010). Source partitioning using stable isotopes: coping with too much variation. PLoS ONE 5:e9672. doi: 10.1371/journal.pone.0009672
Pauli, J. N. (2017). Opinion: why we need a centralized repository for isotopic data. Proc. Natl. Acad. Sci. U.S.A. 114, 2997–3001. doi: 10.1073/pnas.1701742114
Pennington, J. T., Mahoney, K. L., Kuwahara, V. S., Kolber, D. D., Calienes, R., and Chavez, F. P. (2006). Primary production in the eastern tropical Pacific: a review. Prog. Oceanogr. 69, 285–317. doi: 10.1016/j.pocean.2006.03.012
Pillai, P., Gonzalez, A., and Loreau, M. (2011). Metacommunity theory explains the emergence of food web complexity. Proc. Natl. Acad. Sci. U.S.A. 108, 19293–19298. doi: 10.1073/pnas.1106235108
Plotkin, P. T. (2010). Nomadic behaviour of the highly migratory olive ridley sea turtle (Lepidochelys olivacea) in the eastern tropical Pacific Ocean. Endangered Species Res. 13, 33–40. doi: 10.3354/esr00314
Plotkin, P. T., Brise-o-Due-as, R., and Abreu-Grobois, F. A. (2012). “Interpreting signs of olive ridley recovery in the Eastern Pacific,” in Sea Turtles of the Eastern Pacific: Advances in Research and Conservation, eds J. A. Seminoff and B.P. Wallace. (Tuscon, AZ: The University of Arizona Press), 302–335.
Polis, G. A., Anderson, W. B., and Holt, R. D. (1997). Toward an integration of landscape and food web ecology: the dynamics of spatially subsidized food webs. Annu. Rev. Ecol. Syst. 28, 289–316. doi: 10.1146/annurev.ecolsys.28.1.289
Polovina, J. J., Howell, E., Parker, D. M., and Balazs, G. H. (2003). Dive-depth distribution of loggerhead (Carretta carretta) and olive ridley (Lepidochelys olivacea) sea turtles in the central North Pacific: might deep longline sets catch fewer turtles? Fish. Bull. 101, 189–193.
Popp, B. N., Graham, B. S., Olson, R. J., Hannides, C. C. S., Lott, M., López-Ibarra, G., et al. (2007). “Insight into the trophic ecology of yellowfin tuna, Thunnus albacares, from compound-specific nitrogen analysis of proteinaceous amino acids,” in Stable Isotopes as Indicators of Ecological Change, eds T. E. Dawson and R. T. W. Siegwolf (San Diego, CA: Elsevier Academic Press), 173–190.
Rafter, P. A., Sigman, D. M., Charles, C. D., Kaiser, J., and Haug, G. H. (2012). Subsurface tropical Pacific nitrogen isotopic composition of nitrate: biogeochemical signals and their transport. Glob. Biogeochem. Cycles 26:GB1003. doi: 10.1029/2010GB003979
Reich, K. J., Bjorndal, K. A., and Martínez del Rio, C. (2008). Effects of growth and tissue type on the kinetics of 13C and 15N incorporation in a rapidly growing ectotherm. Oecologia 155, 651–663. doi: 10.1007/s00442-007-0949-y
Reilly, S. B., and Thayer, V. G. (1990). Blue whale (Balaenoptera musculus) distriubtion in the eastern tropical Pacific. Mar. Mamm. Sci. 6, 265–277. doi: 10.1111/j.1748-7692.1990.tb00357.x
Robins, C. M., Goodspeed, A. M., Poiner, I., and Harch, B. D. (2002). Monitoring the catch of turtles in the Northern Prawn Fishery, Final Report. Commonwealth of Australia. Canberra, ACT: Bureau of Rural Sciences.
Ruiz-Cooley, R. I., and Gerrodette, T. (2012). Tracking large-scale latitudinal patterns of δ13C and δ15N along the E Pacific using epi-mesopelagic squid as indicators. Ecosphere 3, 1–17. doi: 10.1890/ES12-00094.1
Scales, K. L., Miller, P. I., Embling, C. B., Ingram, S. N., Pirotta, E., and Votier, S. C. (2014). Mesoscale fronts as foraging habitats: composite front mapping reveals oceanographic drivers of habitat use for a pelagic seabird. J. R. Soc. Interface 11:20140679. doi: 10.1098/rsif.2014.0679
Seminoff, J. A., and Wallace, B. P. (2012). Sea Turtles of the Eastern Pacific: Advances in Research and Conservatino. Tuscon, AZ: The University of Arizona Press.
Seminoff, J. A., Benson, S. R., Arthur, K. E., Eguchi, T., Dutton, P. H., Tapilatu, R. F., et al. (2012). Stable isotope tracking of endangered sea turtles: validation with satellite telemetry and δ15N analysis of amino acids. PLoS ONE 7:e37403. doi: 10.1371/journal.pone.0037403
Shanker, K., Ramadevi, J., Choudhury, B. C., Singh, L., and Aggarwal, R. K. (2004). Phylogeography of olive ridley turtles (Lepidochelys olivacea) on the east coast of India: implications for conservation theory. Mol. Ecol. 13, 1899–1909. doi: 10.1111/j.1365-294X.2004.02195.x
Sissenwine, M. P., Mace, P. M., Powers, J. E., and Scott, G. P. (1998). A commentary on western Atlantic bluefin tuna assessments. Trans. Am. Fish. Soc. 127, 838–855. doi: 10.1577/1548-8659(1998)127<0838:ACOWAB>2.0.CO;2
Somes, C. J., Schmittner, A., Galbraith, E. D., Lehmann, M. F., Altabet, M. A., Montoya, J. P., et al. (2010). Simulating the global distribution of nitrogen isotopes in the ocean. Glob. Biogeochem. Cycles 24, 1–16. doi: 10.1029/2009GB003767
Sommer, U., Stibor, H., Katechakis, A., Sommer, F., and Hansen, T. (2002). Pelagic food web configurations at different levels of nutrient richness and their implications for the ratio fish production: primary production. Hydrobiologia 484, 11–20. doi: 10.1023/A:1021340601986
Suryan, R. M., Saba, V. S., Wallace, B. P., Hatch, S. A., Frederiksen, M., and Wanless, S. (2009). Environmental forcing on life history strategies: evidence for multi-trophic level responses at ocean basin scales. Prog. Oceanogr. 81, 214–222. doi: 10.1016/j.pocean.2009.04.012
Thomas, S. M., and Crowther, T. W. (2015). Predicting rates of isotopic turnover across the animal kingdom: a synthesis of existing data. J. Anim. Ecol. 84, 861–870. doi: 10.1111/1365-2656.12326
Thompson, D. R., Torres, L. G., Taylor, G. A., Rayner, M. J., Sagar, P. M., Shaffer, S. A., et al. (2015). Stable isotope values delineater the non-breeding distributions of sooty shearwaters (Puffinus griseus) in the North Pacific Ocean. Mar. Ecol. Prog. Ser. 521, 277–282. doi: 10.3354/meps11128
Thompson, R. M., Hemberg, M., Starzomski, B. M., and Shurin, J. B. (2007). Trophic levels and trophic tangles: the prevalence of omnivory in real food webs. Ecology 88, 612–617. doi: 10.1890/05-1454
Turner Tomaszewicz, C. N., Seminoff, J. A., Avens, L., Goshe, L. R., Peckham, S. H., Rguez-Baron, J. M., et al. (2015). Age and residency duration of loggerhead turtles at a North Pacific bycatch hotspot using skeletochronology. Biol. Conserv. 186, 134–142. doi: 10.1016/j.biocon.2015.03.015
Vander Zanden, H. B., Arthur, K. E., Bolten, A. B., Popp, B. N., Lagueux, C. J., Harrison, E., et al. (2013). Trophic ecology of a green turtle breeding population. Mar. Ecol. Progress Series 476, 237–249. doi: 10.3354/meps10185
Vander Zanden, H. B., Tucker, A. D., Hart, K. M., Lamont, M. M., Fujisaki, I., Addison, D. S., et al. (2015). Determining origin in a migratory marine vertebrate: a novel method to integrate stable isotopes and satellite tracking. Ecol. Appl. 25, 320–335. doi: 10.1890/14-0581.1
Vander Zanden, M. J., and Rasmussen, J. B. (2001). Variation in δ15N and δ13C trophic fractionation: implications for aquatic food web studies. Limnol. Oceanogr. 46, 2061–2066. doi: 10.4319/lo.2001.46.8.2061
VLIZ (2009). Longhurst Biogeographical Provinces. Available online at: http://marineregions.org
Wallace, B. P., DiMatteo, A. D., Hurley, B. J., Finkbeiner, E. M., Bolten, A. B., Chaloupka, M. Y., et al. (2010). Regional management units for marine turtles: a novel framework for prioritizing conservation and research across multiple scales. PLoS ONE 5:e15465. doi: 10.1371/journal.pone.0015465
Wedemeyer-Strombel, K. R., Balazs, G. H., Johnson, J. B., Peterson, T. D., Wicksten, M. K., and Plotkin, P. T. (2015). High frequency of occurrence of anthropogenic debris ingestion by sea turtles in the North Pacific Ocean. Mar. Biol. 162, 2079–2091. doi: 10.1007/s00227-015-2738-1
White, A. E., Foster, R. A., Benitez-Nelson, C. R., Masque, P., Verdeny, E., Popp, B. N., et al. (2013). Nitrogen fixation in the Gulf of California and the Eastern Tropical North Pacific. Prog. Oceanogr. 109, 1–17. doi: 10.1016/j.pocean.2012.09.002
White, A. E., Prahl, F. G., Letelier, R. M., and Popp, B. N. (2007). Summer surface waters in the Gulf of California: prime habitat for biological N2 fixation. Global Biogeochem. Cycles 21:GB2017. doi: 10.1029/2006GB002779
Whiting, S. D., Long, J. L., and Coyne, M. (2007). Migration routes and foraging behaviour of olive ridley turtles (Lepidochelys olivaces) in northern Australia. Endangered Species Res. 3, 1–9. doi: 10.3354/esr003001
Yeakel, J. D., Bhat, U., Elliott Smith, E. A., and Newsome, S. D. (2016). Exploring the isotopic niche: Isotopic variance, physiological incorporation, and the temporal dynamics of foraging. Front. Ecol. Evol. 4:1. doi: 10.3389/fevo.2016.00001
Keywords: amino acid compound specific isotope analysis, niche area, trophic position, oceanic food webs, olive ridley, Lepidochelys olivacea
Citation: Peavey LE, Popp BN, Pitman RL, Gaines SD, Arthur KE, Kelez S and Seminoff JA (2017) Opportunism on the High Seas: Foraging Ecology of Olive Ridley Turtles in the Eastern Pacific Ocean. Front. Mar. Sci. 4:348. doi: 10.3389/fmars.2017.00348
Received: 18 April 2017; Accepted: 17 October 2017;
Published: 08 November 2017.
Edited by:
Sara M. Maxwell, Old Dominion University, United StatesReviewed by:
Luis Huckstadt, University of California, Santa Cruz, United StatesRochelle Diane Seitz, Virginia Institute of Marine Science, United States
Copyright © 2017 Peavey, Popp, Pitman, Gaines, Arthur, Kelez and Seminoff. This is an open-access article distributed under the terms of the Creative Commons Attribution License (CC BY). The use, distribution or reproduction in other forums is permitted, provided the original author(s) or licensor are credited and that the original publication in this journal is cited, in accordance with accepted academic practice. No use, distribution or reproduction is permitted which does not comply with these terms.
*Correspondence: Lindsey E. Peavey, lindsey.peavey@noaa.gov