More Than Just a Spawning Location: Examining Fine Scale Space Use of Two Estuarine Fish Species at a Spawning Aggregation Site
 Ross E. Boucek
 Erin Leone
 Joel Bickford3
  Sarah Walters-Burnsed
 Susan Lowerre-Barbieri
- 1Bonefish and Tarpon Trust, Florida Keys Initiative, Marathon, FL, United States
- 2Center for Biostatistics and Modeling, Florida Fish and Wildlife Research Institute, Gainesville, FL, United States
- 3Florida Fish and Wildlife Research Institute, St Petersburg, FL, United States
- 4Fisheries and Aquatic Science Program, School of Forest Resources and Conservation, University of Florida, Gainesville, FL, United States
Many species that provide productive marine fisheries form spawning aggregations. Aggregations are predictable both in time and space and constitute nearly all of the reproductive activity for these species. For species that spend weeks to months on spawning aggregation sites, individuals may need to rely on a forage base at or near the spawning site to balance the high energetic cost associated with reproduction. Here, we ask: do spawning fish with protracted spawning seasons use spawning aggregation sites more or less than adjacent foraging habitats? To answer our research question, we tracked 30 Snook (Centropomus undecimalis) and 29 Spotted Seatrout (Cynoscion nebulosus) at a spawning site during the 2007 spawning season in Tampa Bay (FL, U.S.) using acoustic telemetry. We quantified the amount of time both males and females of both species spent in various habitats with network analyses. Surprisingly, results from network analyses revealed that receivers with the highest edge densities for Snook and Seatrout occurred within the seagrass habitat, not the location of spawning. Likewise, we found that both Snook and Seatrout during the spawning season were using the seagrass habitat near the spawning site as much, or more than the location where spawning occurs. Our results show that if protected areas are formed based on only where spawning occurs, the reproductive stock will not be protected from fishing. Further, our results suggest that spawning aggregation sites and areas surrounding used by fishes, may have multiple ecological functions (i.e., larval dispersal and energy provisioning) that may need to be considered in conservation actions. Our case study further supports hypotheses put forth in previous work that suggest we must consider more than just spawning sites in protected area development and ecological conservation.
Introduction
Many species that provide productive marine fisheries form high-density spawning aggregations (Beets and Friedlander, 1998; Secor, 2015). Spawning aggregations are defined as group of conspecific fish, gathered at a specific site and time for the purposes of spawning, with fish densities significantly higher than densities found during the non-reproductive period (Domeier and Colin, 1997). Aggregations are predictable in both time and space and can constitute nearly all of the reproductive activity for some species (Domeier and Colin, 1997). At the same time, the spatial-temporal predictability of spawning aggregations, and extremely high catch rates associated with aggregation fishing, often result in these sites being fished to exhaustion once they are discovered (Sala et al., 2001). When these spawning aggregations reach a low-density threshold of individuals where reproduction there ceases to contribute to the population, the fishery associated with that stock often crashes (Sadovy and Domeier, 2005). Given the biological importance of these sites, developing conservation strategies aimed at protecting the functions of those locations and the spawning fish there, are crucial to maintaining the sustainability of marine fisheries (Sadovy de Mitcheson and Colin, 2012).
Species that spend weeks to months at spawning aggregation sites likely must rely on energy resources from the spawning site or adjacent habitats, to sustain reproduction throughout the spawning season (Lowerre-Barbieri et al., 2011; McBride et al., 2015; and reviewed in Sadovy de Mitcheson and Colin, 2012). Aggregating fish with protracted spawning season's use of spawning sites and adjacent foraging habitats may be contrasted to nesting migratory birds that require abundant prey near nesting sites to feed chicks (Both and Visser, 2001). For migratory birds, access to abundant prey during the nesting season is vital to reproductive success, and can be the single most important driver influencing the survival of offspring (Both et al., 2006). In the Greater Everglades ecosystem, for instance, prey density during the winter and spring nesting season is inversely proportional with nest failures for Great Egrets (Ardea spp.), White Ibis (Eudocimus albus), and Wood Storks (Mycteria Americana). In years where prey densities are low, breeding bird colonies can suffer almost complete nest failures (Kushlan et al., 1975; Frederick and Collopy, 1989; Sklar et al., 2005). Using migratory bird conceptual models and models already developed for aggregating fishes (i.e., Functional Migration Area, FMA; Sadovy de Mitcheson and Colin, 2012), the connectedness between and productivity of foraging landscapes at, or adjacent to, spawning aggregation sites may have some effect on reproductive success for aggregating fishes with protracted spawning seasons (Sadovy de Mitcheson and Colin, 2012).
Tracking technology have made indirectly observing fish behaviors at fine spatial temporal scales feasible, allowing us research space use at spawning aggregation sites (Hussey et al., 2015; Lowerre-Barbieri et al., 2016). Using animal tracking techniques (i.e., passive acoustic telemetry) we ask: Relative to where spawning occurs, to what extent are adjacent potential foraging habitats for aggregating fish with protracted spawning seasons being used? To answer our research questions, we used two well-studied aggregating species as a model, Common Snook (Centropomus undecimalis), and Spotted Seatrout (Cynoscion nebulosus), in South Florida (U.S.). Both species can form spawning aggregations with individuals spending several weeks at spawning aggregation sites (Lowerre-Barbieri et al., 2013; Young et al., 2014). Importantly, the general spatial-temporal patterns of spawning are well-understood for both species, making these species ideal models to test hypotheses related to the foraging and reproduction at spawning aggregation sites.
We tracked the movements of Snook and Seatrout during the 2007 spawning season in Tampa Bay (FL, U.S.) using acoustic telemetry. Fish were marked at a spawning aggregation site subject to comprehensive and long-term study. At this site, direct observations of spawning for both species (visual and acoustic) have been observed and females of both species have been captured with hydrated oocytes and fresh post-ovulatory follicles, indicating active spawning (Walters et al., 2009; Lowerre-Barbieri et al., 2014). On the leeward side of the pass where spawning occurs, a productive seagrass meadow exists which could act as a key foraging habitat for spawning fish that would allow them to overcome body size constraints on egg production, which may result in different spawning behaviors than what would be expected from total spawners (i.e., Nassau Grouper Epinephelus striatus; Bolden, 2000). Based on previous work on spawning aggregations (see Sadovy de Mitcheson and Colin, 2012), we hypothesize that spawning fish of both species would use both the spawning inlet and the seagrass habitat during the spawning season due to mechanisms related to spawning (inlet use) and foraging (seagrass use; McBride et al., 2015). To test our hypothesis, we applied both network analysis and more traditional analytical techniques to telemetry observations. Previous work on this dataset indicates at least for Snook, that the seagrass habitat is of importance to their space use (Lowerre-Barbieri et al., 2014).
Methods
Study System
This study was conducted at an inlet spawning site in Tampa Bay (FL). The climate of Tampa Bay and surrounding areas are sub-tropical, experiencing seasonal variation in temperature and daylight length and a distinct rainy and dry seasonality, which affects salinities and other environmental conditions within most of the estuarine system (Schmidt et al., 2001). The shorelines and watershed around the bay are urbanized and integrated within a major metropolis (Lewis and Estevez, 1988). The focal inlet connects Tampa Bay with the Gulf of Mexico and falls between two less developed island preserves, Shell Key preserve on the North, and Fort Desoto County Park to the south. The inlet is 300 m across and 8.5 m deep (Lowerre-Barbieri et al., 2013, 2014). On the leeward side of Shell Key, an extensive seagrass meadow exists, which is a component of the 8,880 acres of seagrass coverage in the entire Boca Ciega Bay area. The seagrass beds in that area consist of approximately an even split between shoal grass (Halodule sp.) and turtle grass (Thalassia sp.), and occur within depths ranging between less than a meter to 2 m. As for other seagrass beds in Tampa Bay, meadows within the Boca Ciega bay are relatively intact, with seagrass coverage, meadow texture, species composition, and trends over time being stable or improving (Harrison and Kaufmann, 2016).
Tracking Arena
An array of 42 acoustic VR2 receivers were deployed in the inlet and adjacent areas to track Snook and Spotted Seatrout movement throughout the spawning sites and other habitats. The core area of the array, in the region where spawning occurs, was strategically designed to overcome biases associated with detection absences (i.e., present in a habitat, but not being detected). For instance, the array configuration within the spawning habitat consisted of 17 receivers with overlapping detection radii, organized in a way that all paths through the area where spawning is observed would be detected by at least 3 VR2 receivers. Thus, under this array configuration, the lack of detections are interpreted as absent fish (Lowerre-Barbieri et al., 2014; Figure 1). At the west periphery of the spawning site, two other receivers were deployed in the Gulf of Mexico. Last, to track movement in and out of the seagrass habitat, 3 receivers were also placed in key channels that connect seagrass habitats on the leeward side of Shell key to the spawning site (Figure 1). Control tags were deployed to estimate variation in detection radii overtime and extensive range testing was conducted (Lowerre-Barbieri et al., 2014).
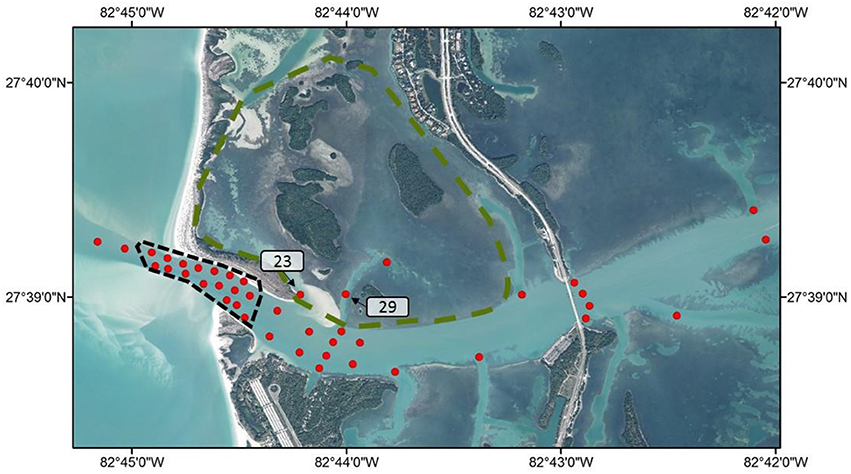
Figure 1. Map of the focal spawning area. Region within the gray dashed line represents the spawning site, and area within green dashed line represents the seagrass habitat. Red dots show the receiver array. Key receivers in Snook and Seatrout spatial networks are labeled for referencing.
Species Description
Snook are a tropical broadly distributed pan-Caribbean species common from south Florida to Northern half of Brazil (Taylor et al., 1998; Adams, 2016). Snook provide extremely important fisheries where they occur, both commercially and recreationally (Adams, 2016). In Florida, the fishery is recreational, and harvest is highly managed with both a slot limit and seasonal closures (Adams, 2016). Snook are marine obligate, highly fecund, batch spawners, that form spawning aggregations at rivermouths, inlets, and possibly on offshore structures (Taylor et al., 1998; Trotter et al., 2012; Boucek unpublished data). The general spawning season for snook is from May to October, with peak spawning occurring in June and July. During the spawning season, individual Snook generally spend 40–70 days at or near spawning aggregation sites, spawning around dusk on multiple occasions during the spawning season, before migrating back to non-spawning habitats such as freshwater rivers (Trotter et al., 2012; Young et al., 2014). At the focal spawning site during the spawning season, previous research has shown a majority of Snook occupying that area migrate there from inshore overwintering habitats, although a segment of the population are year round residents to the barrier island region (Lowerre-Barbieri et al., 2014).
Like Snook, Spotted Seatrout are highly fecund broadcast spawners (Walters et al., 2009). Seatrout spawning season is protracted, lasting from April through November. Unlike Snook, that have spawning concentrated in few locations, Spotted Seatrout spawning site selection is less discriminant, with spawning being reported in lagoons, channels, and in deep passes, and generally around seagrass habitats (Walters et al., 2009). Trout are a relatively broadly distributed temperate species, with a core range from Florida, to the Carolinas (U.S.). Trout produce productive recreational fisheries and are highly managed where they occur (Saucier and Baltz, 1993). Though trout are often considered to form more resident spawning aggregations, at the focal site, previous research has shown that Seatrout migrate to the area from adjacent habitats to spawn (Lowerre-Barbieri et al., 2013).
Tagging
Both Snook and Seatrout were captured using seining methods. Fish were sampled in the early evening (1,735–2,144 h) in the 2007 spawning season. Individuals were kept continuously immersed in transit from the net to the surgery station on the boat. Prior to surgery, fish were kept in a live well (795 L capacity) with a flow through system at densities < 5 fish. The surgical procedure followed that of Lowerre-Barbieri et al. (2003) with the exception that anesthesia was not used due to regulatory changes. Using these methods, surgeries lasted ~7 min. All males expressed milt on pressure indicating active spawning. Ovarian biopsies were taken from all females prior to surgery for histological analysis of reproductive state and the presence of spawning indicators.
A total of 31 Snook (15 F:16 M) and 29 (9 M:20 F) Spotted Seatrout were intra-peritoneally implanted with Vemco coded transmitters. Eleven Snook were implanted with V13 tags (30–90 s ping delay) and 20 Snook (10 F:10 M) were implanted with V9 tags (15–45 s ping delay). Based on the expected spatio-temporal behavior of Snook, the V13 tags were programmed to be active for 6 months (22 March through 20 September) to track fish during the spawning season and inactive the remaining 6 months to conserve battery. For Spotted Seatrout, 31 individuals were tagged (22 F:9 M), with a combination of V9 (10, 5 M:5 F), and V13 (21, 17 F: 4 M) transmitters. We aimed to tag an even 1:1 sex ratio for both species. Seatrout sex ratios in the focal system are close to 1:1, and snook sex ratios in Tampa are likely skewed more toward males (1.2:1, Taylor et al., 2000; Lowerre-Barbieri et al., 2009). We used a combination of tag types to allow for at least some of the larger fish implanted with V-13s to be detected for multiple years.
Animal Care Ethics
The Florida Fish and Wildlife Conservation Commission has reviewed and approved this research. Ethics approval was not obtained and this was not required as per institutional guidelines and national regulations. However, all necessary and appropriate measures were taken to decrease stress on the fish.
Statistics
To answer our question related to the habitat use between spawning and foraging habitats, we used network analyses as well as compared proportional habitat use of male and female Seatrout and Snook on seagrass vs. spawning habitat. Prior to analysis, we excluded any observations which were recorded within 60 m at the same receiver (a means to condense the dataset, and reduce auto-correlation), or which were recorded between receivers at a speed greater than 35 m/min, as this swim speed would be faster than the physiological swimming capacity of these two species. Any individuals that were detected fewer than 7 days were also excluded. Snook and seatrout observations were analyzed separately.
For the network analysis, combined network for males and females as well as a network for each individual fish were created. To test for differences in networks between the sexes, we estimated the global metric of edge density as well as the node-local metrics of eigenvector centrality from each individual network (Jacoby et al., 2012). Edge density represents the proportion of available edges observed. Eigenvector centrality is a measure of connectedness, which not only indicates how many direct links a node has but also the relative important of each node to which it is connected. We averaged the eigenvector centrality for males and females at each receiver (network node) and performed a Wilcoxon signed-rank (non-parametric t-test) in SAS v9.4 (Cary, NC) to compare for differences between males and females. We used an analysis of covariance (ANCOVA) in SAS v9.4 (Cary, NC) to test the categorical effect of sex on network edge density. In order to test whether individual networks different from random we used permutation tests (10,000 random permutations of observed edge weights) and compared the edge density variance of the random permutations to the observed edge density at the 95th percentile.
We supplemented the network analysis by comparing daily proportional habitat use of Snook or Seatrout on the spawning site vs. the seagrass habitats. We quantified a habitat use event by the time (proportion of day) between first and last detection within a specific zone (spawning site vs. foraging site). For this habitat use metric, if consecutive detections occurred on the same receiver, we assumed that fish was at or near that location for the time between detections. We acknowledge that there are differences in the completeness of array coverage between the spawning site and the seagrass habitat (three receivers at the edges of the seagrass habitat), namely that the seagrass habitat is not gated, and directionality of movement in and out of that habitat cannot be inferred. To compensate for this bias, we constrained habitat use events only when an individual (1) either was detected on multiple receivers within a zone, or (2) had consecutive detections on the same receiver for longer than an hour. These constraints likely resulted in estimates of habitat use that are conservative in the seagrass habitat. From these data, we calculated the habitat usage for both species by sexes. If less than two individuals were detected per day (i.e., male or female for species x), those days were excluded from analysis. To reduce effects of auto correlation, we grouped these daily proportions into 10 day bins, and used the average of those bins for analyses (See Walsh et al., 2013; Boucek et al., 2017). Wilcoxon sign rank tests were used to test whether proportional habitat use of Snook and Seatrout was different on seagrass habitats vs. spawning sites, as well as differences between males and females use of spawning and seagrass habitat. We point out that this analysis is a reflection of the average behavior of individuals within a population and captures both the number of individuals using the habitat, and the time individuals would spend within a habitat. As such, these data presented are not showing the duration of time fish are spent spawning (i.e., if a fish goes to spawn, how long does that fish stay), and should not be interpreted in that way.
Results
Network Analysis
Snook
Individual summary statistics and acoustic network metrics for Snook are provided in Appendix 1. Most individuals' (with the exception of two fish) acoustic network differed significantly from random (P < 0.05). There were subtle differences in the way female and male Snook utilized the acoustic array (Figure 2). While there was no effect of sex [F(1, 25) = 0.34, P = 0.5668] or length [F(1, 25) = 0.11, P = 0.7468] on edge density, which represents the proportion of available edges utilized, there was a different in average eigenvector centrality score, which indicates the connectivity of a node in the network, between the sexes (Wilcoxon Sign = −10, P = 0.0012). While receiver #23, which is within in the seagrass habitat, was consistently identified as the most important receiver for both sexes, males showed stronger affinity for it.
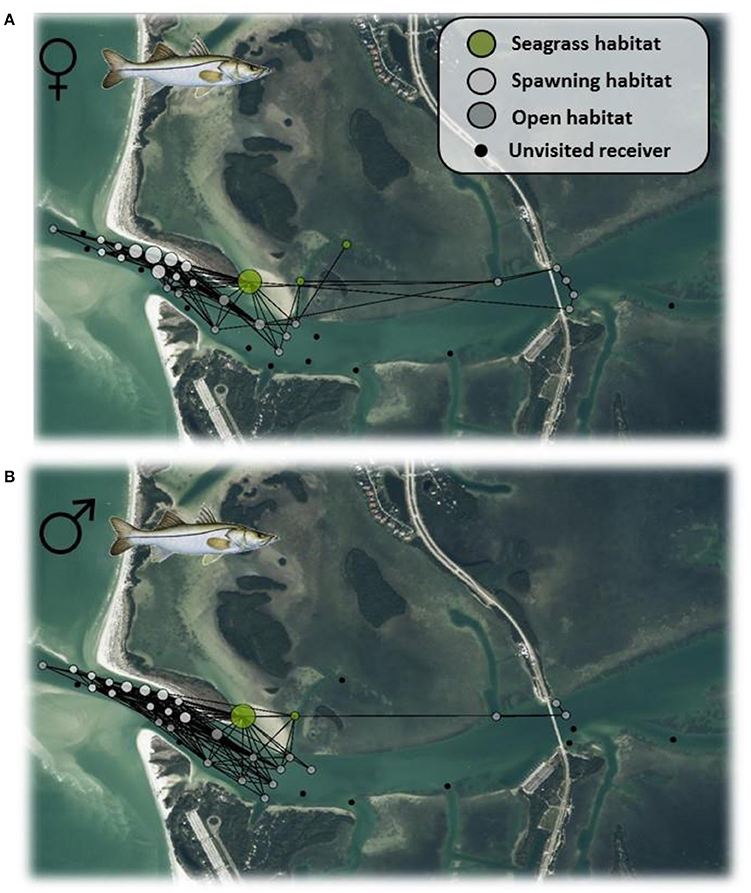
Figure 2. Weighted network for female (A) and male (B) Snook in Tampa Bay according to the spatial layout of acoustic receivers. Node coloration corresponds to different habitats, while node size corresponds to the degree centrality, a measure of node connectedness. Green shading represent the seagrass habitat, and light gray shading represent the spawning habitat, dark gray shading shows open habitats, and black dots show unused nodes.
Seatrout
Individual summary statistics and acoustic network metrics are provided in Appendix 2. Most individuals' (with the exception of two fish) acoustic network differed significantly from random (P < 0.05). There were clear differences in the way male and female Seatrout used the acoustic array, as shown in Figure 3. While receiver #29 appeared to be the most important for females, receiver #23 was most important for males, both receivers occur within the seagrass habitat. The importance of these receivers were further reflected by the significant difference in average eigenvector centrality scores between the sexes (Wilcoxon Sign = 15, P < 0.001). There was no difference between the sexes in edge density [F(1, 34) = 0.04, P = 0.8443] indicated that the overall size of the acoustic network was similar across the species.
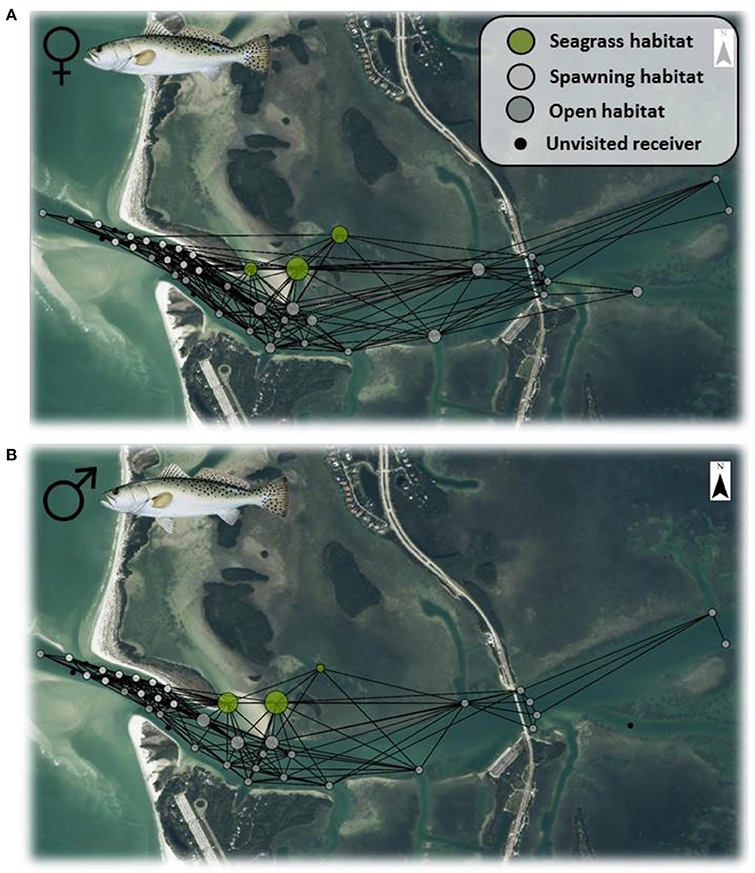
Figure 3. Weighted network for female (A) and male (B) Seatrout in Tampa Bay according to the spatial layout of acoustic receivers. Node coloration corresponds to different habitats, while node size corresponds to the degree centrality, a measure of node connectedness. Green shading represent the seagrass habitat, and light gray shading represent the spawning habitat, dark gray shading shows open habitats, and black dots show unused nodes.
Proportional Use of Spawning vs. Seagrass Habitat
Snook
We tracked at least two female and two male Snook for 101 days (June 5th–September 14th 2007). On average, we were actively tracking 8 female and 11 male Snook per day. Both males and females used the seagrass habitat more than the spawning habitat (Wilcoxon Sign > 92, p < 0.01). For instance, the mean 10-day average proportional daily use for female snook on the spawning habitat was 0.020, approximately an order of magnitude less than their daily usage of the seagrass habitat (0.320; Figure 4A). Similarly, the mean 10-day proportional daily use for male Snook on the spawning site was 0.030, an order of magnitude less than on the seagrass habitat (0.34 of the day Figure 4B). There were no significant differences between male and female use at spawning sites (Wilcoxon Sign = 30, p = 0.14), but males spent significantly more time per day on the seagrass habitat than females (Wilcoxon Sign = 15, p = 0.01).
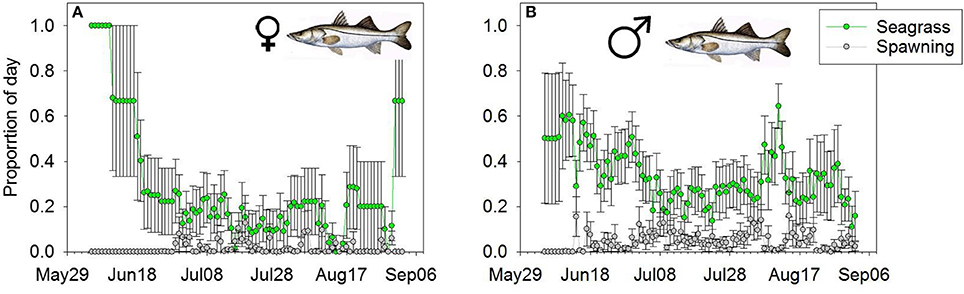
Figure 4. Mean daily proportion use of (A) female and (B) male Snook of the spawning (gray line) or foraging (green line) habitat. Error bars represent (1 ± SE).
Spotted Seatrout
Over the course of the spawning season, we tracked at least 2 male and female trout for 74 days (April 27th–July 9th 2007). During the 74 day window, on average we were actively tracking 5 males and 10 females per day. Like Snook, both male and female Seatrout spent a greater proportion of the day at the seagrass habitat (Wilcoxon Sign > 49, p < 0.01) (Figures 5A,B). The mean 10-day average proportional use of female Seatrout on spawning areas was 0.010, vs. 0.180 at the seagrass habitat. Similarly, the mean 10-day average proportion of time that male trout spent on spawning areas was 0.012, and 0.250 on seagrass habitats (Figures 5A,B). There were no sex specific differences between time spent at aggregation sites or on seagrass habitats (W < 36, p > 0.1649).
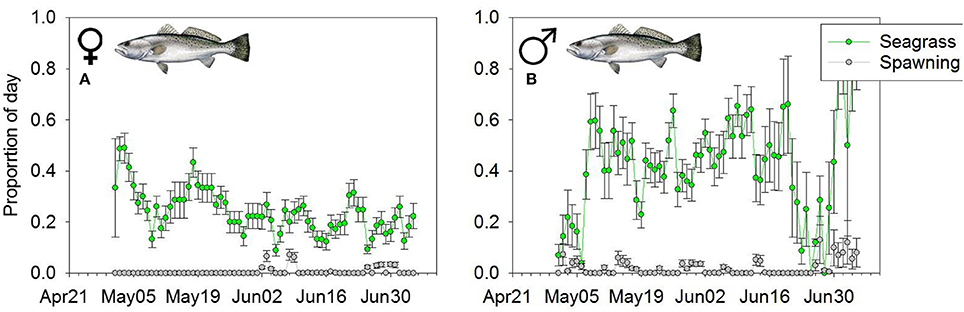
Figure 5. Mean daily proportion use of (A) female and (B) male Seatrout of the spawning (gray line) or foraging (green line) habitat. Error bars represent (1 ± SE).
Discussion
Results from our study show that a seagrass habitat immediately adjacent to a spawning site may play an important role during the spawning season for two aggregating species. Though we are uncertain of the exact role of the seagrass habitat serves, our results suggest that at least for these species on the year of the study, where spawning occurs is only one component of the spatial ecology of the area. We acknowledge that this study is only conducted over one spawning season, thus generalizations should be made cautiously. However, our findings support other research suggesting that spawning aggregations are spatially more complex than just a spawning site (Sadovy de Mitcheson and Colin, 2012). There are three management implications that this study highlights (1) time area closures focused only where spawning occurs may not fully protect aggregating species like Snook and Seatrout from harvest during the spawning season. (2) We should consider identifying, maintaining, and protecting multiple ecological functions of spawning sites and habitats near them. And (3) we could potentially use the configuration of habitats (i.e., mechanism of larval transport connected to a productive foraging arena) to predict where other spawning sites that are not yet identified may occur. We discuss these implications below.
Much of our knowledge of spawning aggregations have been built studying tropical reef fishes. Tropical reef fish aggregations occur in low productivity environments, are massive, consisting in some cases of tens of thousands of individuals, and only last days to weeks. From these conceptual models, the prey base at or near the spawning site, due to the extremely high densities of spawning fish and the short time they spend there, is thought to play a minimal role in gonadal provisioning (reviewed in Domeier and Colin, 1997). With these types of aggregations, time area closures limiting fishing to where only spawning occurs has shown to adequately protect the spawning stock (Sala et al., 2001). For other species that spawn over longer durations, with less abundant aggregations, in environments that may be more productive (estuaries), spawning aggregation sites may have additional spatial dimensionality that are not captured in those tropical reef fish models. In particular, for a species like Seatrout that spawn over 60 times per season, immediate energy sources are necessary to provision that level of spawning output, similar to nesting birds (Sadovy de Mitcheson and Colin, 2012). From our study, a time-area closure on the spawning site would offer spawning fishing almost no protection from fishing, as these species are only spending a fraction of their day there on average. To elucidate these time area closure boundaries for aggregating species like Snook and Seatrout that may rely on other functions of the spawning aggregation sites, telemetry coupled with network analyses provides a useful tool. The application of telemetry and network analyses to design MPAs have already been implemented for shark species in remote tropical islands. In the Seychelles, network analysis and telemetry revealed strong species specific habitat use, with corresponding variation in MPA use and consequent level of protection. From their network analysis, the MPA configuration was changed and expanded to increase protection of multiple habitats used by focal species (Lea et al., 2016). Similar to their study, we could use the same approaches to protect aggregating species with more spatially complex spawning behaviors by designing MPA boundaries around core areas within their spatial network. Recognizing the need to make protected areas of adequate size to buffer for variability and uncertainty in exactly where spawning aggregations occur, or to protect “staging areas” has been discussed in Sadovy de Mitcheson and Colin (2012). Our case study provides an additional example to support the need to consider more than just spawning sites in protected area development.
There are multiple potential roles that the seagrass habitat may play during the spawning season. First, the habitat could serve as a predation refuge, as the nearby spawning inlet is structurally less complex. Likewise, the seagrass habitat could serve as a refuge from high currents that move at a speed of 1 m/s through the inlet (Lowerre-Barbieri et al., 2014). And last, the seagrass habitat could serve as a foraging ground. These functions are not mutually exclusive and all are probably playing some role in Snook and Seatrout habitat use decisions. Regardless of the exact mechanism, protecting the ecological functions of seagrass habitats may require additional conservation actions to consider beyond limiting fishing effort and time area closures. These conservation actions may include maintaining water quality and foodweb structure, reducing physical habitat degradation (propeller scarring Uhrin and Holmquist, 2003) as well as other ecological mitigation actions. Seagrass beds are vulnerable to numerous stressors and are declining worldwide (Waycott et al., 2009). In Florida estuaries in particular, due to freshwater mis-management, the loss of seagrass has become a pervasive environmental issue, with extensive ongoing seagrass losses in many estuaries (Hall et al., 2016; Santos et al., 2017). With these ongoing seagrass die-offs in mind, future research should aim to more mechanistically link and quantify role that these habitats are playing in spawning activity of Snook and Seatrout, which are two of the most productive sportfish in the region. Linking effects of seagrass die-offs to spawning activity could provide additional support for completing restoration actions in the region aimed at conserving coastal ecosystems.
Beyond best conserving known spawning aggregation sites, considering additional spatial and ecological dimensionality of spawning aggregation sites could help identify unknown spawning sites. For many marine aggregating species, only a fraction of spawning locations have been discovered (Grüss et al., 2014). Our lack of understanding of where many of aggregation sites exist represents a critical information gap for management that needs to be addressed for many species (Adams, 2016). In this study, the composition and configuration of the focal spawning site consists of both a high current inlet that can transport eggs and larvae to nurseries through ebb and flood tidal cycles, and a foraging and or refuge site immediately adjacent. At the focal study site, previous work suggests that this spawning site is preferred over other sites for at least Seatrout. For instance, Seatrout are considered resident spawners that form low density aggregations within their home range, and do not migrate to spawn (Walters et al., 2009). However, at this spawning site, previous work has demonstrated that Seatrout are actively migrating to this location for spawning, thus indicating some preference over other locations within their home range (Lowerre-Barbieri et al., 2013). Therefore, when aiming to identify future key spawning locations for species functionally similar to Snook and Seatrout, researchers should look for both components, mechanism for larval transport (i.e., inlet, eddies, ocean current patterns), and possibly foraging habitat (i.e., seagrass habitat, upwelling source etc.) or a refuge habitat, which in turn may help identify unknown spawning locations.
Further, at known spawning aggregations, we could use the configuration and quality of component patches to develop hypotheses related to how spawning productivity may vary across spawning sites. Spawning productivity may include measures such as; the abundance of fish at spawning sites, basin of attraction of spawning fish at a site, and the number of spawning attempts per individual. As such, we may expect spawning productivity to be higher at an aggregation site in the proximity to abundant prey resources or next to a structurally complex predation refuge compared to one that is not, despite the sites having similar mechanisms for larval transport.
To conclude, adequately protecting fish spawning aggregation sites and habitats adjacent is vital to conserving and or sustainability managing many marine species. Our case study shows that for two aggregating species, additional dimensionality in space use exists beyond just the spawning location. Identifying the drivers behind these space use patterns will help in developing the most efficient conservation strategies aimed at protecting spawning fish. As fish tracking technology continues to improve and spatial analyses become more sophisticated, unraveling these complexities in space use at spawning sites and other habitats will become easier. And as such, translating these findings in spatial ecology into management actions will continue to be a challenge and hopefully can keep pace with the science.
Author Contributions
RB was responsible for writing the manuscript. SL-B developed the survey design, provided funding for the research, and developing the vision of the paper. JB and SW-B conducted the field work and helped design the study. EL was responsible for the network analysis.
Conflict of Interest Statement
The authors declare that the research was conducted in the absence of any commercial or financial relationships that could be construed as a potential conflict of interest.
Acknowledgments
This project was funded by Grant F-59 from the Department of Interior, U.S. Fish and Wildlife Service, under the Sport Fish Restoration Act.
References
Adams, A. J. (2016). Guidelines for evaluating the suitability of catch and release fisheries: lessons learned from Caribbean flats fisheries. Fish. Res. 186, 672–680. doi: 10.1016/j.fishres.2016.09.027
Beets, J., and Friedlander, A. (1998). Evaluation of a conservation strategy: a spawning aggregation closure for red hind, Ephinephelus guttatus, in the U.S. Virgin Islands. Environ. Biol. Fishes 55, 91–98. doi: 10.1023/A:1007404421518
Bolden, S. K. (2000). Long-distance movement of a nassau grouper (Epinephelus striatus) to a spawning aggregation in the central Bahamas. Fish. Bull. 98, 642–645. Available online at: http://fishbull.noaa.gov/983/983toc.htm
Both, C., Bouwhuis, S., Lessells, C. M., and Visser, M. E. (2006). Climate change and population declines in a long-distance migratory bird. Nature 441, 81–83. doi: 10.1038/nature04539
Both, C., and Visser, M. E. (2001). Adjustment to climate change is constrained by arrival date in a long-distance migrant bird. Nature 411, 296–298. doi: 10.1038/35077063
Boucek, R. E., Rehage, J. S., Heithaus, M., Santos, R., and Stevens, P. (2017). Can animal habitat use patterns influence their vulnerability to extreme climate events? An estuarine sportfish case study. Glob. Chang. Biol. 23, 4045–4057. doi: 10.1111/gcb.13761
Domeier, M. L., and Colin, P. L. (1997). Tropical reef fish spawning aggregations: defined and reviewed. B. Mar. Sci. 60, 698–726.
Frederick, P. C., and Collopy, M. W. (1989). Nesting success of five ciconiiform species in relation to water conditions in the Florida Everglades. Auk 106, 625–634.
Grüss, A., Robinson, J., Heppell, S. S., Heppell, S. A., and Semmens, B. X. (2014). Conservation and fisheries effects of spawning aggregation marine protected areas: what we know, where we should go, and what we need to get there. ICES J. Mar. Sci. 71, 1515–1534. doi: 10.1093/icesjms/fsu038
Hall, M. O., Furman, B., Merello, M., and Durako, M. J. (2016). Recurrence of Thalassia testudinum seagrass die-off in Florida Bay, USA: initial observations. Mar. Ecol. Prog. Ser. 560, 243–249. doi: 10.3354/meps11923
Harrison, M., and Kaufmann, K. (2016). Summary report for Western Pinellas County Coastal Waters. Seagrass Integrated Mapping and Monitoring Report No. 2. Fish and Wildlife Research Institute Technical Report TR-17, version 2.0. eds L. Yarbro and P. R. Carlson Jr., Florida Fish and Wildlife Conservation Commission, St. Petersburg.
Hussey, N. E., Kessel, S. T., Aarestrup, K., Cooke, S. J., Cowley, P. D., Fisk, A. T., et al. (2015). Aquatic animal telemetry: a panoramic window into the underwater world. Science 348:1255642. doi: 10.1126/science.1255642
Jacoby, D. M., Brooks, E. J., Croft, D. P., and Sims, D. W. (2012). Developing a deeper understanding of animal movements and spatial dynamics through novel application of network analyses. Methods Ecol. Evol. 3, 574–583. doi: 10.1111/j.2041-210X.2012.00187.x
Kushlan, J. A., Ogden, J. C., and Higer, A. L. (1975). Relation of Water Level and Fish Availability to Wood Stork Reproduction in the Southern Everglades, Florida (No. 75–434). US Dept. of the Interior, Geological Survey.
Lea, J. S., Humphries, N. E., von Brandis, R. G., Clarke, C. R., and Sims, D. W. (2016). Acoustic telemetry and network analysis reveal the space use of multiple reef predators and enhance marine protected area design. Proc. R. Soc. B 283:1834.
Lewis, R. R. III., and Estevez, E. D. (1988). The Ecology of Tampa Bay, Florida: An Estuarine Profile (No. BR-85 (7.18)). Mangrove Systems, Inc., Tampa, FL (USA); Mote Marine Lab., Sarasota, FL.
Lowerre-Barbieri, S., Villegas-Ríos, D., Walters, S., Bickford, J., Cooper, W., Muller, R., et al. (2014). Spawning site selection and contingent behavior in common snook, Centropomus undecimalis. PLoS ONE 9:e101809. doi: 10.1371/journal.pone.0101809
Lowerre-Barbieri, S. K., Ganias, K., Saborido-Rey, F., Murua, H., and Hunter, J. R. (2011). Reproductive timing in marine fishes: variability, temporal scales, and methods. Mar. Coast. Fish. 3, 71–91. doi: 10.1080/19425120.2011.556932
Lowerre-Barbieri, S. K., Henderson, N., Llopiz, J., Walters, S., Bickford, J., and Muller, R. (2009). Defining a spawning population (spotted seatrout Cynoscion nebulosus) over temporal, spatial, and demographic scales. Mar. Ecol. Prog. Ser. 394, 231–245. doi: 10.3354/meps08262
Lowerre-Barbieri, S. K., Vose, F. E., and Whittington, J. A. (2003). Catch-and-release fishing on a spawning aggregation of common snook: does it affect reproductive output? Trans. Am. Fish. Soc. 132, 940–952. doi: 10.1577/T02-001
Lowerre-Barbieri, S. K., Walters, S., Bickford, J., Cooper, W., and Muller, R. (2013). Site fidelity and reproductive timing at a spotted seatrout spawning aggregation site: individual versus population scale behavior. Mar. Ecol. Prog. Ser. 481, 181–197. doi: 10.3354/meps10224
Lowerre-Barbieri, S. K., Walters Burnsed, S. L., and Bickford, J. W. (2016). Assessing reproductive behavior important to fisheries management: a case study with red drum, Sciaenops ocellatus. Eco. App. 26, 979–995. doi: 10.1890/15-0497
McBride, R. S., Somarakis, S., Fitzhugh, G. R., Albert, A., Yaragina, N. A., Wuenschel, M. J., et al. (2015). Energy acquisition and allocation to egg production in relation to fish reproductive strategies. Fish Fish. 16, 23–57. doi: 10.1111/faf.12043
Sadovy, Y., and Domeier, M. (2005). Are aggregation-fisheries sustainable? reef fish fisheries as a case study. Coral Reefs 24, 254–262. doi: 10.1007/s00338-005-0474-6
Sadovy de Mitcheson, Y., and Colin, P. L. (eds.). (2012). Reef Fish Spawning Aggregations: Biology, Research and Management, in Fish & Fisheries Series, Vol. 35 (New York, NY: Springer).
Sala, E., Ballesteros, E., and Starr, R. M. (2001). Rapid decline of nassau grouper spawning aggregations in Belize: fishery management and conservation needs. Fisheries 26, 23–30. doi: 10.1577/1548-8446(2001)026<0023:RDONGS>2.0.CO;2
Santos, R. O., Rehage, J. S., Adams, A. J., Black, B. D., Osborne, J. and Kroloff, E. K. (2017). Quantitative assessment of a data-limited recreational bonefish fishery using a time-series of fishing guides reports. PLoS ONE 12:e0184776. doi: 10.1371/journal.pone.0184776
Saucier, M. H., and Baltz, D. M. (1993). Spawning site selection by spotted seatrout, Cynoscion nebulosus, and black drum, Pogonias cromis, in Louisiana. Environ. Biol. Fish. 36, 257–272. doi: 10.1007/BF00001722
Schmidt, N., Lipp, E. K., Rose, J. B., and Luther, M. E. (2001). ENSO influences on seasonal rainfall and river discharge in Florida. J. Clim. 14, 615–628. doi: 10.1175/1520-0442(2001)014<0615:EIOSRA>2.0.CO;2
Sklar, F. H., Chimney, M. J., Newman, S., McCormick, P., Gawlik, D., Miao, S., et al. (2005). The ecological–societal underpinnings of Everglades restoration. Front. Ecol. Environ. 3, 161–169. doi: 10.1890/1540-9295(2005)003[0161:TEUOER]2.0.CO;2
Taylor, R. G., Grier, H. J., and Whittington, J. A. (1998). Spawning rhythms of common snook in Florida. J. Fish Biol. 53, 502–520. doi: 10.1111/j.1095-8649.1998.tb00998.x
Taylor, R. G., Whittington, J. A., Grier, H. J., and Crabtree, R. E. (2000). Age, growth, maturation, and protandric sex reversal in common snook, Centropomus undecimalis, from the east and west coasts of South Florida. Fish. Bull. 98, 612–624. Available online at: http://fishbull.noaa.gov/983/983toc.htm
Trotter, A. A., Blewett, D. A., Taylor, R. G., and Stevens, P. W. (2012). Migrations of common snook from a tidal river with implications for skipped spawning. Trans. Am. Fish. Soc. 141, 1016–1025. doi: 10.1080/00028487.2012.675903
Uhrin, A. V., and Holmquist, J. G. (2003). Effects of propeller scarring on macrofaunal use of the seagrass Thalassia testudinum. Mar. Ecol. Prog. Ser. 250, 61–70. Available online at: http://www.jstor.org/stable/24866529
Walsh, C. T., Reinfelds, I. V., Ives, M. C., Gray, C. A., West, R. J., and van der Meulen, D. E. (2013). Environmental influences onthe spatial ecology and spawning behaviour of an estuarine-resident fish, Macquaria colonorum. Estuar. Coast. Shelf Sci. 118, 60–71. doi: 10.1016/j.ecss.2012.12.009
Walters, S., Lowerre-Barbieri, S., Bickford, J., and Mann, D. A. (2009). Using a passive acoustic survey to identify spotted seatrout spawning sites and associated habitat in Tampa Bay, Florida. Trans. Am. Fish. Soc. 138, 88–98. doi: 10.1577/T07-106.1
Waycott, M., Duarte, C. M., Carruthers, T. J., Orth, R. J., Dennison, W. C., Olyarnik, S., et al. (2009). Accelerating loss of seagrasses across the globe threatens coastal ecosystems. Proc. Natl. Acad. Sci. U.S.A. 106, 12377–12381. doi: 10.1073/pnas.0905620106
Young, J. M., Yeiser, B. G., and Whittington, J. A. (2014). Spatiotemporal dynamics of spawning aggregations of common snook on the east coast of Florida. Mar. Ecol. Prog. Ser. 505, 227–240. doi: 10.3354/meps10774
Appendices
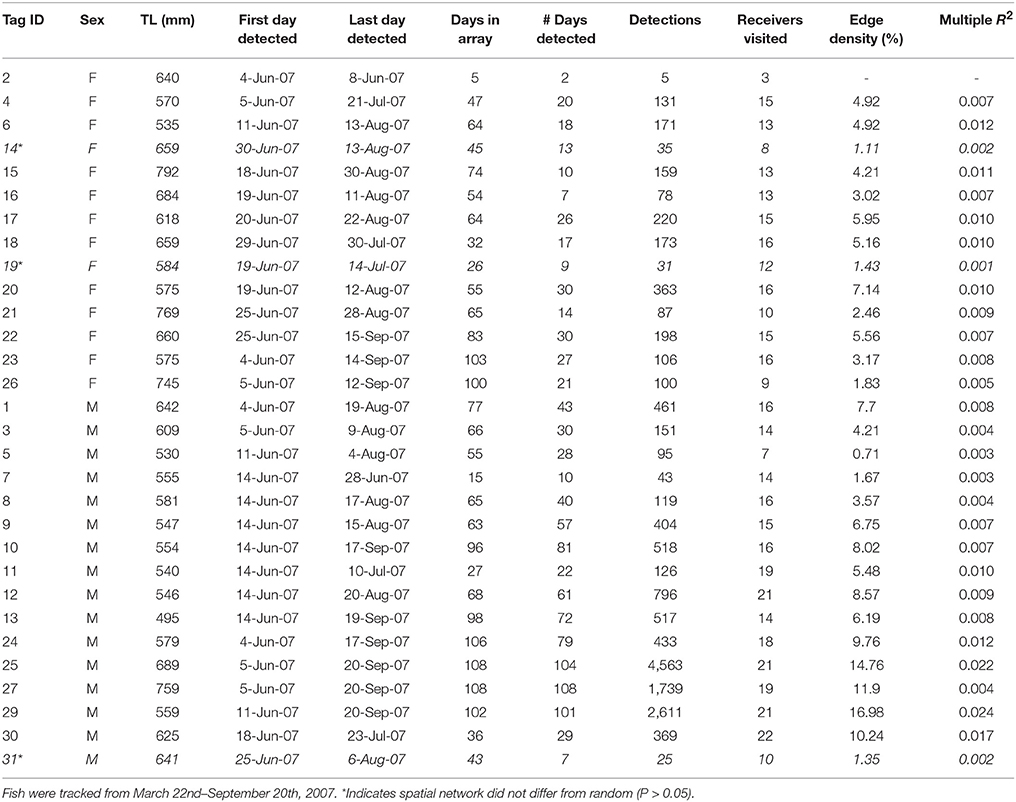
Table A1. Summary of movement data and spatial network metrics for individual C. undecimalis tagged with acoustic telemetry transmitters (n = 30) in Tampa Bay.
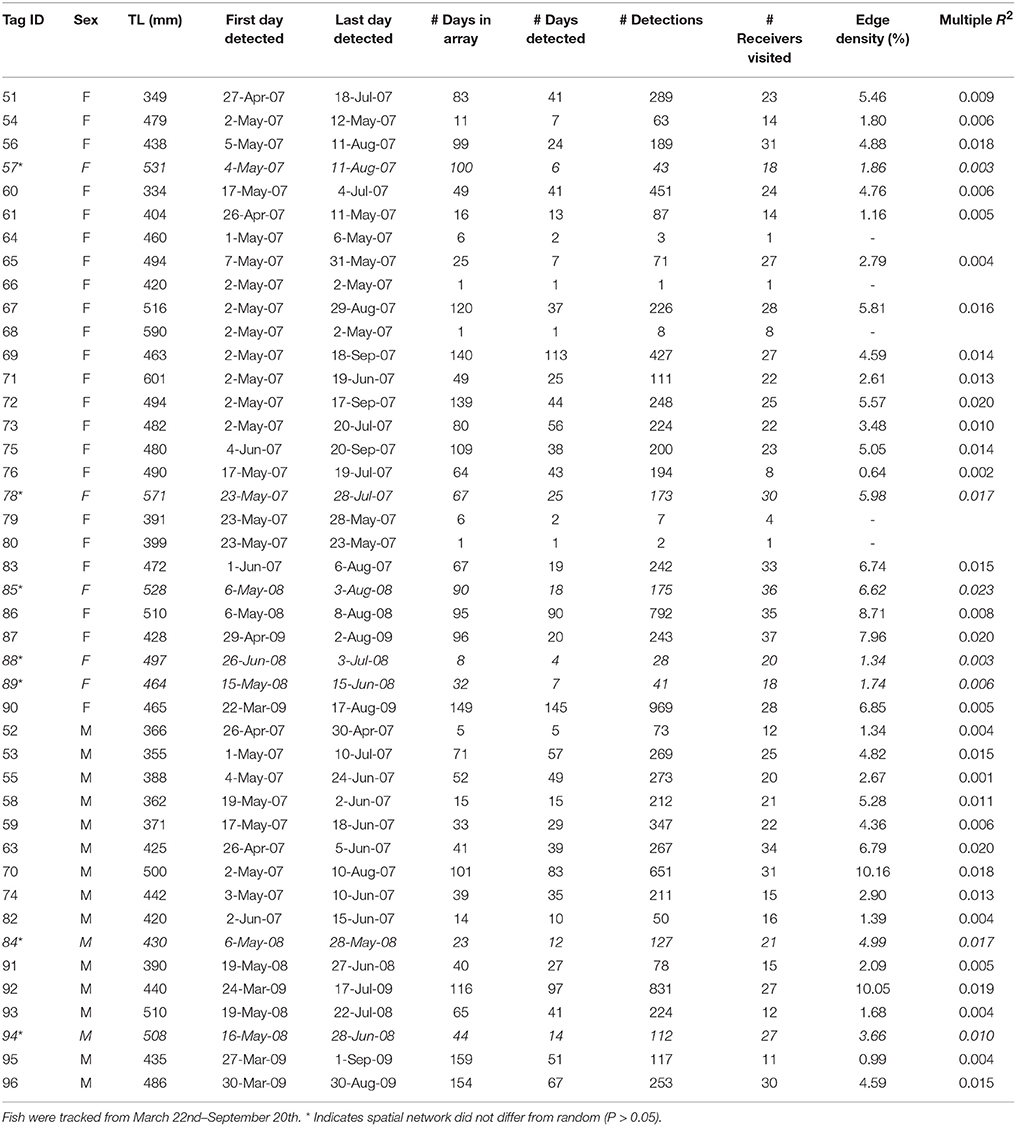
Table A2. Summary of movement data and spatial network metrics for individual C. nebulosus tagged with acoustic telemetry transmitters (n = 43) in Tampa Bay.
Keywords: network analysis, spawning aggregation sites, common Snook, spotted Seatrout, Tampa Bay, Florida
Citation: Boucek RE, Leone E, Bickford J, Walters-Burnsed S and Lowerre-Barbieri S (2017) More Than Just a Spawning Location: Examining Fine Scale Space Use of Two Estuarine Fish Species at a Spawning Aggregation Site. Front. Mar. Sci. 4:355. doi: 10.3389/fmars.2017.00355
Received: 08 April 2017; Accepted: 20 October 2017;
Published: 23 November 2017.
Edited by:
Lyne Morissette, M—Expertise Marine, CanadaReviewed by:
Catherine Sarah Longo, Marine Stewardship Council (MSC), United KingdomMariano González-Castro, Consejo Nacional de Investigaciones Científicas y Técnicas (CONICET), Argentina
Copyright © 2017 Boucek, Leone, Bickford, Walters-Burnsed and Lowerre-Barbieri. This is an open-access article distributed under the terms of the Creative Commons Attribution License (CC BY). The use, distribution or reproduction in other forums is permitted, provided the original author(s) or licensor are credited and that the original publication in this journal is cited, in accordance with accepted academic practice. No use, distribution or reproduction is permitted which does not comply with these terms.
*Correspondence: Ross E. Boucek, ross@bonefishtarpontrust.org