Ex-vessel Fish Price Database: Disaggregating Prices for Low-Priced Species from Reduction Fisheries
 Travis C. Tai
 Tim Cashion
 Vicky W. Y. Lam3,4
  Wilf Swartz
- 1Ocean Canada Partnership, Institute for the Oceans and Fisheries, University of British Columbia, Vancouver, BC, Canada
- 2Fisheries Economics Research Unit and Global Fisheries Cluster, Institute for the Oceans and Fisheries, University of British Columbia, Vancouver, BC, Canada
- 3Sea Around Us and Global Fisheries Cluster, Institute for the Oceans and Fisheries, University of British Columbia, Vancouver, BC, Canada
- 4Nippon Foundation-Nereus Program, Institute for the Oceans and Fisheries, University of British Columbia, Vancouver, BC, Canada
Ex-vessel fish prices are essential for comprehensive fisheries management and socioeconomic analyses for fisheries science. In this paper, we reconstructed a global ex-vessel price database with the following areas of improvement: (1) compiling reported prices explicitly listed as “for reduction to fishmeal and fish oil” to estimate prices separately for catches destined for fishmeal and fish oil production, and other non-direct human consumption purposes; (2) including 95% confidence limit estimates for each price estimation; and (3) increasing the number of input data and the number of price estimates to match the reconstructed Sea Around Us catch database. Our primary focus was to address this first area of improvement as ex-vessel prices for catches destined for non-direct human consumption purposes were substantially overestimated, notably in countries with large reduction fisheries. For example in Peru, 2010 landed values were estimated as 3.8 billion real 2010 USD when using separate prices for reduction fisheries, compared with 5.8 billion using previous methods with only one price for all end-products. This update of the price database has significant global and country-specific impacts on fisheries price and landed value trends over time.
Introduction
Initial construction of a global marine ex-vessel fish price database (hereon after referred to as the Price DB) by Sumaila et al. (2007) was to address the lack of appropriate information required to sustainably manage natural resources, as prices paid to fishers is an integral piece of information since it is a main determinant of fishing behavior. Ex-vessel prices are the prices that fishers receive directly for their catch, or the price at which the catch is sold when it first enters the supply chain. Therefore, in order to effectively manage the sustainable use of fisheries resources, managers and policymakers need reliable information on ex-vessel prices. The purpose of such a database is to provide ex-vessel prices for fisheries scientists to conduct socioeconomic analyses at various spatial scales—i.e., global, regional, and national-scale analyses. Here, we present an updated version of the database with major improvements by incorporating new estimates for low-priced species caught by reduction fisheries.
The first construction of the Price DB provided a complementary list of fish and market specific ex-vessel prices for each recorded catch in the Sea Around Us (SAU) catch database (Watson et al., 2004). It involved collecting data from widely scattered national and regional statistical reports from published and gray literature (e.g., governmental agencies, websites). Sumaila et al. (2007) amassed over 30,000 records of reported ex-vessel prices, but could only directly assign a price to 18% of total tonnage landed from the SAU catch database. They devised a rule-based approach to estimate missing prices, using a combination of various assumptions to relate fish prices across taxa, countries, and years. Such an extensive database, as they first noted, requires continuous updates over time for both the input data (e.g., increasing records of reported ex-vessel prices and increasing the diversity and evenness of the country sources for the data) and price estimation methodologies (i.e., revising the underlying assumptions to provide more accurate estimates).
The Price DB was next updated by Swartz et al. (2013) to address various limitations with the methodologies for estimating ex-vessel prices. For example, the rule-based approach could match prices from one species to a profoundly different species (e.g., from herring to tuna) in countries with few reported ex-vessel prices. Additionally, price estimates were also derived from data across multiple years, failing to account for inter-annual differences in market prices. To address these concerns, Swartz et al. (2013) devised a methodology to estimate ex-vessel prices using the country-product-dummy model (Summers, 1973), a multilateral method used by the International Comparison Programme to deal with incomplete matrices when estimating price levels and missing commodity prices. The country-product-dummy model addresses year-specific differences in market prices and prioritizes matching similar commodities for price estimation, where estimates are derived from price data sourced from other countries.
The Price DB has contributed to recent global and regional fisheries economic analyses (e.g., Börger et al., 2014; Nunoo et al., 2014; Teh and Sumaila, 2015), which underscores the importance of providing updated and accurate ex-vessel prices for research related to fisheries management and policy. First, we address a major concern identified by Swartz et al. (2013) where prices for low-value fishes destined for reduction were not distinguished from fishes for human consumption and thus were likely overestimated. We constructed a separate database of ex-vessel prices of fisheries catches destined for purposes other than human consumption. These price estimates are a result of the work of a recent effort to disaggregate catches by product usage: direct human consumption (DHC), fishmeal and fish oil (FMFO) production, and other uses including bait, direct feeding, and industrial uses (Cashion et al., 2017). Together, fish destined for FMFO and other uses are some of the largest fisheries globally in terms of catch in weight, such as the Peruvian anchoveta fishery, and account for approximately 20 million tons of annual landings presently (Pauly and Zeller, 2016). While the ten largest taxa for FMFO account for 77% of landings destined for this purpose historically, there is a growing diversity of species used for FMFO, especially for direct feed in aquaculture, and thus accounting for this diversity of end uses and prices is an important development (Cashion et al., 2017).
Aquaculture remains one of the largest consumers of global fishmeal (68%) and fish oil (89%) products (Tacon and Metian, 2015). However, there is a growing trend to use alternative sources of feed such as soy protein (Naylor et al., 2009; Salze et al., 2010), and the proportion of catch for FMFO production has decreased in some of the major reduction fisheries (e.g., Christensen et al., 2014). With global fish stocks in decline (Myers and Worm, 2003; Srinivasan et al., 2010; Pauly and Zeller, 2016), we may expect changes in supply and demand of reduction fisheries and thus an effect on prices and other substitutable products. Further, rising costs of FMFO feed may support the shift to more sustainable feeds (Tacon and Metian, 2008; Naylor et al., 2009; Pikitch et al., 2014).
We further updated the Price DB by providing uncertainty estimates of 95% confidence limits for prices, a valuable addition for researchers looking to use the price database. We were able to revise the use of the country-product-dummy model to provide uncertainty estimates, an important application overlooked by Swartz et al. (2013). Other updates included increasing the number of input reported ex-vessel price records and extending the database to 2010 to match the SAU catch database. In addition to the extension of catch records from 2007 to 2010, the SAU catch database has gone through major reconstruction efforts and includes 2.5 times more records of unique taxon-country-year marine fisheries catch than the previous version of the Price DB (Pauly and Zeller, 2016).
Methods
Data Collection
The first step in our data collection effort was to identify additional price data and obtain updated versions from many of the same sources used by Sumaila et al. (2007) and Swartz et al. (2013). We sourced data from governmental agencies, web sites, published and gray literature, and contacted partners around the world who helped locate data in their particular region (Table S1). We collected an additional ~20,000 reported prices for this price database for a total of over 60,000 reported prices spanning the years from 1950 to 2010 (Table S2). We filtered out the top 0.5% of data to remove any extremely high reported prices (exceeding 38,000 real 2010 USD ton−1) from the database that would then interfere with the estimation model. The top 0.5% was removed as many of these prices exceeded consumer market prices, especially those exceeding 100,000 USD ton−1. Many of these prices were also calculated from landings that were very small (i.e., < 0.1 ton) and therefore would have very little weight on average prices at the global scale and may reflect overinflated prices if regional stocks were low. While such prices are interesting when evaluating regional economic trends for individual fisheries, our database is tailored to large-scale global analyses and thus we removed these outliers. We also removed prices that were calculated to be $0 ton−1–in many instances landed value was recorded as $0 and thus a price of $0 ton−1. In total, less than 500 reported price records were removed.
The same sources used to collect DHC prices were used to collect reported ex-vessel prices of fish destined for non-DHC uses, as well as reports specifically on FMFO production (Table S1). Reported prices were explicitly listed as for “reduction to fishmeal and fish oil.” We attempted to find reported prices covering the years from 1950 to 2010 on major reduction taxa and taxa used for direct feed in aquaculture. We estimated prices of taxa by applying the reported price of “trash fish” to known taxa used for reduction purposes in the reporting country (see Cashion, 2016). We collected a total of over 2,600 prices of fish for non-DHC uses providing adequate regional, temporal, and taxonomic coverage of major reduction species and taxa used for other non-DHC uses (Table S2). Again, we filtered out the top 0.5% of data to remove extremely high reported prices (exceeding 3,280 real 2010 USD ton−1) and any prices calculated to be $0 ton−1. Fourteen reported price records were removed from the analysis.
The Sea Around Us (SAU) catch database (http://www.seaaroundus.org/; Pauly and Zeller, 2015, 2016) was used to create a list of prices to be estimated. Our goal was to provide an estimated ex-vessel price for each listed catch in the SAU catch database. This newly reconstructed version of the catch database provides a detailed list of catches from 1950 to 2010.
We determined market exchange rates and purchasing power parities from the Penn World Tables, Version 7.1 (http://www.rug.nl/research/ggdc/data/pwt/; Heston et al., 2012). Purchasing power parity (PPP) is a measure of the relative price level in a particular country, and accounts for the fact that the relative cost of goods in a country may not be fully reflected in market exchange rates. We use PPP to convert domestic prices into “real” prices for a direct international comparison of value, a method used by the International Comparison Program (Rao, 2004). For years where a country's PPP was unavailable (i.e., earlier years where price level data was scarce for developing countries), we used the price level index—equal to the PPP divided by the market exchange rate—from the nearest year (see Swartz et al., 2013). Regional averages of the price level were calculated for countries with no PPP data (Swartz et al., 2013). We accounted for inflation by standardizing all ex-vessel prices to a reference year using the United States (US) Consumer Price Index (CPI) prepared by the US Bureau of Labour Statistics (http://www.bls.gov/cpi/).
Price Estimation with the Country-Product-Dummy Model
Reported ex-vessel prices were assigned to matching taxon-country-year specific catch from the SAU database where possible. However, the majority of catch records in the SAU catch database were not recorded with an associated price or landed value. As in the previous version of the Price DB we estimated these “missing” prices using the country-product-dummy model (for details on the country-product-dummy model, see Swartz et al., 2013). Here we describe a revised application for the use of the country-product-dummy model to estimate “missing” prices and 95% confidence limits (Rao, 2004; Silver, 2009); confidence limits were not estimated in the previous version. Confidence limits were derived from applying a regression model to the data, described below.
Ex-vessel prices (denoted by pijt) of each unique commodity-country-year combination were estimated based on three factors: the price level of the i-th commodity (fish taxa) in year t relative to other commodities, also referred to as the international price (denoted by IPit); the general price level of the j-th country in year t relative to other countries, also referred to as the purchasing power parity (denoted by PPPjt); and a random variable with a lognormal distribution (denoted by uijt). Using these determinants, the country-product-dummy model can be stated as (Summers, 1973):
We estimated an international price for each taxa i and year t by taking the natural logarithm of model (Equation 1) yielding the dummy model:
where n = the number of countries (observations), j = 1,2,…, n, and y = the natural log of the reported price. The known coefficient x of the dummy variable B is the natural log of the country effect on price (PPP), and the estimated coefficient a = natural log of the international price. The error term ε in the dummy model is normally distributed with mean 0 and constant variance σ2 and related to u in model (Equation 1) such that ε = ln (u).
To estimate “missing” ex-vessel prices we first matched all raw reported price data (pijt) from various countries within year t to the taxonomic category of interest (i.e., matched to the species level). Next, we matched known purchasing power parity (PPPjt) values to reported ex-vessel prices from each j-th country. We then fit the dummy model using Equation (2) to estimate a and from this we calculated international prices (IPit)—expressed in a common currency, US dollars—for each i-th taxon. The relationship (i.e., slope) between PPP and price in Equation (1) is equal to the exponent of the coefficient a, also equal to the international price. We ran separate regression models for each year to maintain intraspecific year-to-year variability and eliminate any effects of price data from other years. We used non-linear least squares regression function in R statistical program to estimate coefficient a, as well as the 95% confidence limits (R Core Team, 2017). Next, we calculated “missing” ex-vessel prices (pijt) for each i-th commodity in country j in year t with Equation (1) using the estimated international price (i.e., coefficient a) and PPPjt. We used Equation (1) to estimate 95% confidence limits for “missing” ex-vessel prices (pijt) from estimates of 95% confidence limits for international prices and the PPPjt.
Where there was no specific reported price data for a particular taxon, we matched raw reported price data based on higher taxonomic classifications (e.g., genus, family), functional groupings (e.g., large pelagic), and habitat types (e.g., benthic) (as in Sumaila et al., 2007; Swartz et al., 2013) (see Table S3 for stepwise schematic). For cases with no matching input data for a taxon-year combination, we estimated prices by finding the average international price of the taxa for all years where it was estimated, accounting for inflation using the US CPI. We then used the CPI to convert the average price to the year of interest. Finally, the last estimation step was to use the median for all international prices estimated within the year of interest. Our estimation methods prioritize retaining inter-annual variability in market-specific prices.
Where our methods differ from previous versions of the Price DB is the price estimation for various fisheries end-products. Separate ex-vessel prices were estimated for the proportion of catches destined for DHC and for purposes other than DHC (i.e., FMFO and other uses) using separate input data sets. Ex-vessel prices for purposes other than DHC were assigned to the proportions of catch destined for FMFO and “other” uses. We assumed that prices between catch destined for FMFO and other uses are similar and therefore applied the same input reported price data set to both. “Other” uses represent a small proportion of landings and their price data are often not published. We estimated an international price for over 87,000 and 77,000 unique taxa-year combinations for catches destined for DHC and FMFO/other uses, respectively.
Landed Values
The parallel construction of this Price DB with the global SAU catch database (Pauly and Zeller, 2015) allowed us to calculate landed values for each catch using the constructed Price DB. Catches are broken down by product usage and landed values were calculated using ex-vessel prices for DHC, FMFO, and other uses (Cashion, 2016). Each catch is designated to a fishing entity and taxonomic group. Therefore, we were able to quantify the landed values by the top fishing nations and major taxonomic groups from 1950 to 2010. This allowed us to determine the distribution of the value of global marine fisheries resources. We compared the landed value by destination type for the specific taxonomic groups that comprise the majority of revenues for uses other than DHC. Additionally, we compared landed values for the top fishing nations for FMFO production value and its relative contribution to the country's economy. Values of 95% confidence limits for price estimates were carried through to estimate confidence limits for landed values.
Comparing Methods, Prices, and Landed Values
First, we compared ex-vessel price estimates and landed values between methods with and without separate input prices for fisheries destined for FMFO and other uses. Second, we compared the percent differences in the landed values for these top 12 species using our methods (separate prices for non-DHC purposes) vs. previous methods (one price for all purposes). Lastly, we applied a linear regression model to compare the average price and landed value trends over time between the two methods for each country.
We used the exchange rates from the Penn World Tables to convert prices from domestic currencies into USD. We used market exchange rates instead of PPP to compare market prices across currencies, and not the “real international” value of ex-vessel prices (Swartz et al., 2013). We converted prices to real 2010 values using the US CPI to account for inflation, and we assume that the relative PPP values capture country-specific inflation. These conversions allowed for comparisons to be made across countries and over time.
When comparing average ex-vessel prices, we used weighted-by-catch means instead of normal mean calculations. Weighted-by-catch means were calculated by taking reported catch and multiplying it by price to obtain the landed value, then dividing the sum of all landed values by the sum of all reported catches.
Model Validation
Our model was validated using a k-fold cross validation by separating half of the reported prices (training data) to estimate the remaining half of the reported prices (test data). We generated three subsamples, each representing ~50% of the data to measure how well our model estimated prices across countries, taxa, and overall. We removed price data from 35 randomly selected countries, 724 randomly selected taxa, and a random selection of half the data as training data for DHC prices. We did the same for FMFO/Other prices and removed price data from 13 randomly selected countries, 122 randomly selected taxa, and a random selection of half the data. We used Pearson's correlation coefficient to test how well our model was able to estimate the corresponding reported prices.
Model Assumptions
It should be noted that constructing such an extensive database relies on many assumptions, which creates uncertainties in the estimations. One of the main assumptions we applied is using input prices within the same year rather than prices with a more similar taxonomic match from other years. While this retains year-specific market prices, it assumes that prices can be transferred across higher taxonomic classifications. However, we assume that raw ex-vessel price data were available for the major fisheries of the world, and any fisheries catch data without reported prices were simply “substitutes” of their related taxa (Swartz et al., 2013). Our methods can also produce conversion errors. Some countries have gone through multiple currency changes (e.g., Chile), and their exchange rates and PPPs may be vastly different at the beginning of the year compared to the end of the year. Therefore, depending on when these prices were recorded, the reported ex-vessel prices may be over- or undervalued when converted to an international price, which can then be carried over to price estimates for other countries.
In using the country-product-dummy regression model to estimate missing prices and confidence intervals, we assume that the random variable term uijt in Equation (1) has a lognormal distribution and thus the error term ε in Equation (2) is normally distributed. This assumption allows us to use the Student's t-distribution table to estimate confidence intervals using Equation (2) (Summers, 1973). With lognormal distribution of errors, the estimates of international prices and confidence intervals can only take on positive real numbers and will be right-skewed, resulting in a larger upper 95% confidence limit relative to the lower confidence limit. Nonetheless, filling incomplete prices using the country-product dummy model has been shown to be superior to other methods commonly used (Rao, 2004).
All models and analyses were run using statistical programming software R (R Core Team, 2017) and the ‘dplyr’ R package (Wickham and Francois, 2016).
Results
Ex-vessel Prices and Landed Values
We estimated ex-vessel prices for over 667,000 and 364,000 unique taxon-country-year records of catch destined for DHC and FMFO/other uses, respectively, from the SAU reconstructed reported marine fisheries catch database (Pauly and Zeller, 2015). Approximately 31,000 catch records were matched directly to the raw reported ex-vessel price data, and ~100,000 records were estimated at the species level (Table S3). Fisheries catch records span the years 1950–2010, include 197 countries and entities, and over 1,700 different taxon groups.
Ex-vessel prices have generally increased over time. Since the 1950s, prices for DHC have increased by ~54%, while prices for FMFO and other products have increased by 60 and 10%, respectively (Figure 1). Total average ex-vessel price decreased in the 1960s but was much greater than the decrease observed for DHC prices (Figure 1), indicating that seafood was not necessarily getting cheaper. Instead, catches of low-value small pelagic fish, often destined for reduction purposes, increased substantially in the 1960s (Pauly and Zeller, 2016). Low average ex-vessel prices of fish destined for FMFO and “other uses” are reflected in the total landed values for each destination type.
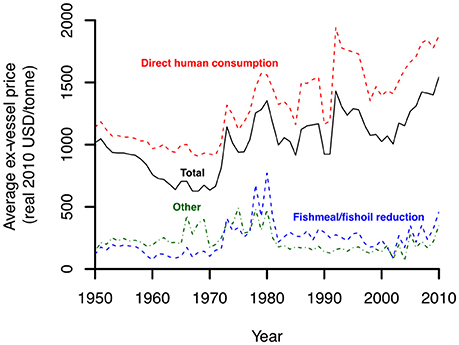
Figure 1. Global marine fisheries weighted-by-catch average ex-vessel prices from 1950 to 2010 as estimated by our model. Average ex-vessel prices are further disaggregated into product usage: direct human consumption, fishmeal and fish oil reduction, and other uses.
Global landed values in 2010 were estimated to be almost $150 billion, greater than a 5-fold increase since 1950 largely due to the increase in catch over this time (Figure 2A). Our 95% confidence limits for price estimates put the range for 2010 global landed values between $80 and 245 billion. Global landed values increased consistently with landings until peak catch rates in the mid-1990s, where landed values continued to increase while landings have decreased. Global landed values have continued to climb, currently (2009–2010) at an all time high. From 1950 to 2010, global landed values for FMFO have shown an increase from $640 million to over $6.3 billion, and have averaged ~5% in its proportion of global landed values over that period (Figure 2B). In 2010, fish for FMFO production was nearly 18% of global catch (Cashion et al., 2017) but only 5% of global landed value.
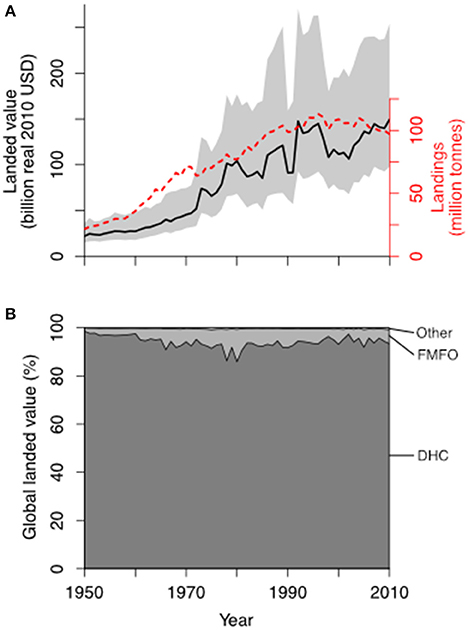
Figure 2. Global marine fisheries (A) landed values ± confidence limits (solid line) and landings (dashed line) from 1950 to 2010, and (B) the proportion of landed values derived from fisheries catch destined for direct human consumption (DHC), fishmeal and fish oil production (FMFO), and other uses.
Historically from 1950 to 2010, forage fishes—which include herring, sardines, and anchovies—accounted for over 70% of the tonnage for FMFO production (Cashion, 2016) and over 62% of the landed value of fish for FMFO (Table 1). In 2010 alone, forage fishes accounted for $11.8 billion and 61% of landed value of catch destined for FMFO production. However, the proportion of total forage fish landed value (including DHC, FMFO, and other uses) destined for FMFO production averaged 8%. Forage fishes are thus important to both the DHC and FMFO sector. The top 12 species used for FMFO production have historically accounted for over 80% of reduction fisheries landed value. Two species, anchoveta and the Pacific sardine, have each accounted for 20% of reduction fisheries landed values from the period 1950–2010. However, the percentage of landed values in 2010 for anchoveta was larger than its historical average at 25%, while they were much smaller for Pacific sardine.
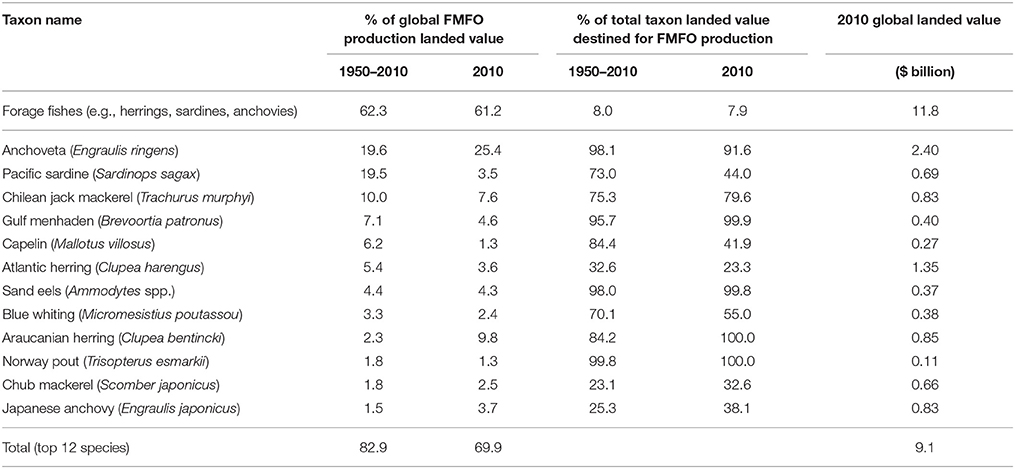
Table 1. Contribution of forage fishes and the top 12 taxa for FMFO landed value production.
The top five countries for FMFO landed value production in 2010 were Chile, Peru, China, Norway, and Denmark, totaling over 5.9 billion real 2010 USD and 68% of global landed value destined for FMFO production (Table 2). Proportion of each country's total fisheries revenues from catch destined for reduction fisheries were highest in Peru, Denmark, Chile, and other countries including Sweden, Georgia, and Finland, accounting for 29–51% of their total fisheries landed value in 2010. For China and Norway, the proportion of FMFO landed value represents less than 11% of their total fisheries landed values indicating their fisheries economy is not as dependent on FMFO fisheries.
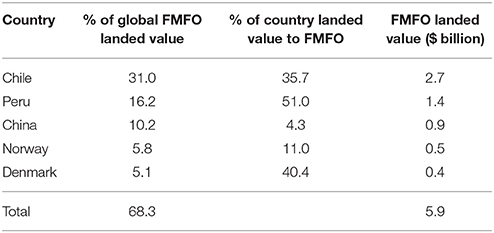
Table 2. Top 5 countries for FMFO landed value production in 2010.
Comparing Prices and Landed Values
When comparing this third version of the Price DB with the second version (Swartz et al., 2013), we found that price trends over time were better explained when DHC and FMFO prices were separated (Figure S2; Table S4). Model outputs suggest that global weighted average prices were significantly lower using our methods and that prices were overestimated by an average of $93.6 US ton−1 in the previous version of the price database (Figure S2) (K = 2; DFResidual = 111; AICweight = 0.55). Accounting for differences in slope trends of prices over time between the two estimation methods in the model suggested that the appreciation of price trends were higher by $2.12 US ton−1 year−1 using previous version of the price database (Figure S2) (K = 3; DFResidual = 111; ΔAIC = 0.44; AICweight = 0.55). Separating prices by the end-product usage is important as it increases specificity of prices and significantly affects trends of prices and landed values over time at the global and country level (Figure S2).
The differences in average ex-vessel prices between the methods were most pronounced in forage fishes (Figure 3; for other taxonomic groups see Figure S1). Average prices for forage fish were much lower when using our methods to estimate separate prices for non-DHC purposes, and were much more consistent with FAO prices. When using only one price for all end-products, average prices for forage fishes increased to over $1000 ton−1 (Figure 3).
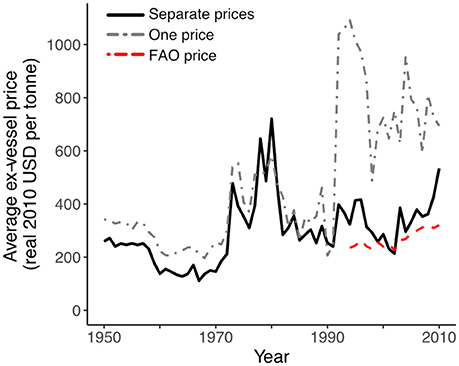
Figure 3. The effects of estimating prices separately for different product types versus one overall price, showing average ex-vessel prices for forage fishes.
Countries with a historically larger proportion of landed values destined for non-DHC purposes were likely to have prices and thus landed values over estimated when prices were not estimated separately for non-DHC purposes. In Peru for example, 2010 landed values were estimated at $3.8 billion when using separate prices for different products versus $5.8 billion using previous methods (Figure S2). Trends in price and landed values also differed for some countries when comparing the two methods (Table 3; Figure S2). Globally, price trends were overvalued, and landed value trends were over-appreciated when using the previous methods.
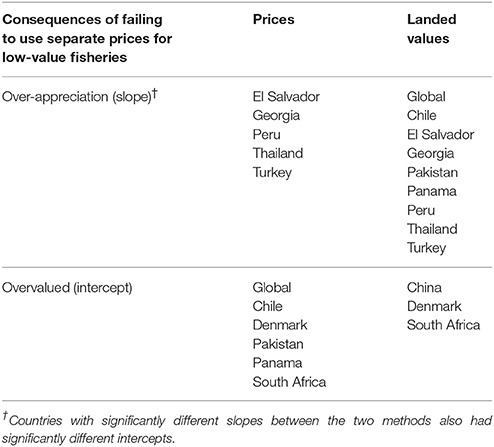
Table 3. Linear regression analysis showing the countries, and globally, where price and landed value trends over time significantly differed in either their slope† or intercept between the two estimation methods (Figure S2).
Model Validation
A cross validation showed that our model did well in predicting reported prices using a subset of reported price data. Our model was able to estimate prices for DHC across country and taxa, with R2-values greater than 0.43 (Figure 4). Prices estimates for FMFO/Other uses across countries had a low R2-value of 0.13. This highlights the importance of having adequate coverage of reported prices across countries (Supplementary Material). Additionally, the random models performed better than country and taxa models suggesting that the accuracy of price estimates increases with increased diversity of price data across countries and taxa.
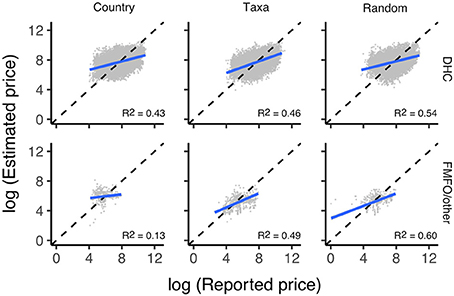
Figure 4. Cross validation where half of the reported prices were removed to estimate the remaining half of the reported prices for DHC (direct human consumption) and FMFO/Other (fishmeal, fish oil and other uses) based on country, taxa, or at random.
Discussion
Average ex-vessel prices for FMFO decreased in the 1960s (Figure 1), likely due to the growing production of FMFO and the increased proportion of low-value species such as the Peruvian anchoveta which rapidly expanded during this period (Bell et al., 1970; Naylor et al., 2000). Following, average ex-vessel prices for FMFO (and across product types) rapidly increased in the 1970s and 1980s, likely due to a combination of multiple global events (Figure 1). First, the cost of fishing likely increased due to the 1973 and 1979 oil crises which increased fuel costs (Barsky and Kilian, 2002), although its effect on fish prices are dependent on other factors such as management decisions and inputs of subsidies. Swartz et al. (2013) also attributes price increases during this time to the establishment of the Third United Nations Convention on the Law Of the Sea, which extended maritime jurisdictions to a 200 nautical mile exclusive economic zone and thus increased the distance traveled and costs. Peruvian anchoveta collapsed in 1972 due to El Niño and overfishing (Lluch-Belda et al., 1989; Pauly et al., 2002), which likely contributed to the rise in prices due to a combination of decreased supply of catch for FMFO production and the growing demand of FMFO for aquaculture production. Production of Peruvian anchoveta remained low until the mid-1990s (Alheit and Niquen, 2004), yet ex-vessel prices for reduction fisheries decreased in the 1980s (Figure 1). This may be attributed to the persistent growth of FMFO production and the growing diversity in species used for FMFO production throughout this period (Cashion et al., 2017), despite low anchoveta numbers. Another possible explanation is the 1980s “oil glut” (Ramcharran, 2002), where a surplus of oil and a drop in fuel costs likely reduced the cost of fishing and thus ex-vessel prices. Reduction fisheries prices steadily decreased into the 1990s (Figure 1), as Peruvian anchoveta has regained its substantial contribution to FMFO production (Alheit and Niquen, 2004). Since decreasing in the 1980s and 90s, prices for fish for FMFO have steadily increased through the 2000s, likely attributed to the combination of concurrent events, notably a decrease in global marine fisheries catch and supply (Pauly and Zeller, 2016), increased demand from aquaculture expansion (Shepherd and Jackson, 2013), and increasing fuel costs.
Aquaculture has expanded rapidly in the last few decades while forage fisheries production has recently decreased (Shepherd and Jackson, 2013). Stricter fisheries management controls (e.g., Aranda, 2009), increased DHC processing of fish species formerly used as FMFO (Shepherd and Jackson, 2013; Cashion et al., 2017), and alternative sources (e.g., terrestrial) of feed (Naylor et al., 2009) are some of the reasons why reduction fisheries production has not kept up with aquaculture production. While we may expect changes in demand or supply of FMFO to have an effect on ex-vessel prices, there may be other market factors restricting any drastic changes in price. Similar to other land-based farmers, feed will be substituted for other feeds if prices increase and quality is not compromised (Asche and Bjorndal, 1999; Asche and Tveterås, 2004). Soymeal, a close substitute for fishmeal in terms of crude protein, formerly prevented large changes in price for fishmeal despite the increase in demand (Asche and Tveterås, 2004; Asche et al., 2013). However, this price dynamic between fishmeal and soymeal has broken down in recent years (Asche et al., 2013) as fishmeal is substitutable only to a point in aquaculture diets. This recent development (post-2004) can be seen in the uptick in ex-vessel prices of fish destined for FMFO production.
The growing demands for FMFO for aquaculture feed is concerning due to its ecological and socioeconomic impacts. FMFO products are mostly derived from forage fishes (Table 1; Cashion et al., 2017), and many of these stocks are overexploited (Srinivasan et al., 2010; Cao et al., 2015). While many of these fish have favorable traits for exploitation (e.g., high growth rates, fecundity, turnover), their populations are vulnerable to collapse. Forage fishes serve an important ecological role as a primary source of prey, and are more valuable to the greater economy in the water than as FMFO (Pikitch et al., 2014). Further, about 90% of non-DHC fisheries catch (~18 million tons annually) are food-grade quality (Cashion et al., 2017), and would alleviate global food insecurities.
Global demands for FMFO are mainly driven by aquaculture in China, and FMFO use in aquaculture feed has increased overall despite the decrease in the inclusion of FMFO in aquaculture feed (Naylor et al., 2009). China's aquaculture industry has rapidly expanded and is currently the largest importer of FMFO products (Cao et al., 2015). There is an attempt to shift to more sustainable plant-based feeds, but many companies have already secured future rights to high quality FMFO products (Cao et al., 2015), limiting the capacity for change. However, the change in aquaculture formulations is driven by price (Hardy, 2010), and this will continue to incentivize the use of alternative sources of feed to substitute FMFO products. It is possible that any depleted reduction fisheries stocks and the higher prices associated with them will drive a decrease in demand for FMFO products as alternative sources of feed are sought. The result of this may be more forage fish for DHC.
There is currently a growing proportion of fish by-catch, often mislabeled as “trash fish,” used for fishmeal production (Cao et al., 2015). The FMFO products from this mixed fish catch are of a lower quality and sell for lower prices to be used for low-value aquaculture species (Chiu et al., 2013). While at first the use of by-catch as aquaculture feed may seem resourceful, it may put further strain on wild fish stocks and ecosystems (Cao et al., 2015). Current production remains relatively low but a rise in price due to a growing demand may increase fishing for these non-targeted species (Cao et al., 2015). What is a concern is that the group of species categorized as “trash fish” are variable and the growth of non-targeted fisheries will be inherently difficult to manage.
Our paper provides valuable information and tools for researchers to value fisheries catches destined for DHC, FMFO, and other uses. Distinguishing prices between product types showed to have effects on highly aggregated price and landed value trends over time (Table 3; Supplementary Material). This Price DB is comparable to other efforts in constructing an ex-vessel marine fish price database. Specifically, Melnychuk et al. (2016) used export prices to estimate ex-vessel prices using publicly available FAO data (FAO, 2014). They were also able to estimate prices for products destined for FMFO. The authors have strong arguments for their approach, such as the consistency of FAO data and its public availability. However, recent studies have shown that global catch may be much higher than reported by FAO (Pauly and Zeller, 2016). Our Price DB has greater temporal coverage (1950–2010) and provides price estimates for the disaggregated catch records from SAU. We also provided price estimates for the various species used for FMFO production and other uses, whereas Melnychuk et al. (2016) only provided an aggregate estimate of price for all FMFO catches.
Limitations of the Global Price Database
Application of our database is best directed toward large-scale regional and global analyses. We caution the use of our database for economic analyses on local and individual fisheries, and instead we suggest that raw data be collected from the fisheries themselves for such applications. Many of the ex-vessel prices were estimated from related taxa or prices from other countries, and thus may not reflect actual economic trends of the specific fisheries stocks of interest.
Price estimates are assigned to each unique taxon-country-year catch, regardless of fishing sector. The SAU catch database disaggregates catch by sector (industrial, artisanal, subsistence) and consequentially, prices and landed values may be underestimated for artisanal fisheries. Artisanal fisheries often have a shortened supply chain, where catches can be transferred directly from fisher to consumer, which can affect ex-vessel prices. Therefore, our estimates may better reflect industrial prices depending on where the data were sourced. The next steps for an update of the Price DB would be to break down prices and values by fishing sector.
Conclusion
Future research derived from this database will improve the understanding of the economic contributions and future potential of the different products derived from marine fisheries resources. As global aquaculture has rapidly expanded since the 1990s (Naylor et al., 2000), there are increasing demands for aquaculture feed inputs such as FMFO. However, the supply of fish destined for FMFO production remained relatively constant (Alder and Pauly, 2006) and has more recently declined to a lower proportion of global landings (Cashion et al., 2017). Prices for FMFO products have generally remained relatively elastic to growing demand due to the availability of substitutes such as soybean meal (Asche and Tveterås, 2004; Asche et al., 2013). However, prices have increased in the past few decades (Asche et al., 2013), alluding to changes in feed composition, demand and supply, and the structure of product ownership and future rights. Understanding price trends in response to market factors will facilitate in managing global fish stocks and the demand for FMFO. Further, our price database contributes to developing a better understanding of the price fluctuations of ex-vessel prices for estimating value chains for reduction fisheries (e.g., Christensen et al., 2014). Additionally, this Price DB will contribute to the growing literature on socioeconomic scenario development and analyses in fisheries science (e.g., Cheung et al., 2016; Lam et al., 2016).
An update of the Price DB was required as the global SAU catch database has undergone major reconstruction and is now more detailed and refined. However, the production of such large-scale databases does not come without its caveats. Therefore, application of our price database to finer scales of data poor fisheries, such as species- or community-specific analyses, must be exercised with caution. Nonetheless, our Price DB is a valuable resource for assessing large-scale trends. Landed values calculated from our prices can be found on the SAU website (www.seaaroundus.org).
Author Contributions
TT, WS, and US conceptualized and constructed the methodology for this paper. TT and TC collected data, implemented models, and analyzed results. TT drafted the manuscript. All authors contributed to editing and finalizing the manuscript.
Funding
This work was funded by the Social Sciences and Humanities Research Council (SSHRC) of Canada, through support from OceanCanada Partnership and MEOPAR. Funding sources did not have a role in study design, collection, analysis, or interpretation of data, writing the report, or the decision to submit the article for publication.
Conflict of Interest Statement
The authors declare that the research was conducted in the absence of any commercial or financial relationships that could be construed as a potential conflict of interest.
Acknowledgments
We thank Sea Around Us for providing data from the extensive work done to reconstruct their database. We would also like to thank Daniel Pauly for contributions to conceptualizing the new material and data that was added to this paper. We thank three reviewers for providing substantial comments that helped improve this manuscript. TC acknowledges support of the Sea Around Us that is supported by The Paul G. Allen Family Foundation and assisted by the staff of Vulcan, Inc., with additional support from the Rockefeller, MAVA, Oak, and Prince Albert II Foundations. This paper was a joint contribution from OceanCanada Partnership, Sea Around Us, and the Fisheries Economics Research Unit.
Supplementary Material
The Supplementary Material for this article can be found online at: https://www.frontiersin.org/articles/10.3389/fmars.2017.00363/full#supplementary-material
Abbreviations
Price DB, Global Marine Ex-Vessel Fish Price Database; SAU, Sea Around Us; DHC, direct human consumption; FMFO, fishmeal and fish oil; PPP, purchasing power parity.
References
Alder, J., and Pauly, D. (2006). On the multiple uses of forage fish: from ecosystem to markets. Fish. Cent. Res. Reports 14:109. doi: 10.14288/1.0074759
Alheit, J., and Niquen, M. (2004). Regime shifts in the Humboldt current ecosystem. Prog. Oceanogr. 60, 201–222. doi: 10.1016/j.pocean.2004.02.006
Aranda, M. (2009). Developments on fisheries management in Peru: the new individual vessel quota system for the anchoveta fishery. Fish. Res. 96, 308–312. doi: 10.1016/j.fishres.2008.11.004
Asche, F., and Bjorndal, T. (1999). Demand Elasticities for Fish and Seafood: A Review. Unpublished, Centre for Fisheries Economics, Norwegian School of Economics and Business Administration, Bergen.
Asche, F., Oglend, A., and Tveteras, S. (2013). Regime shifts in the fish meal / soybean meal price ratio. J. Agric. Econ. 64, 97–111. doi: 10.1111/j.1477-9552.2012.00357.x
Asche, F., and Tveterås, S. (2004). On the relationship between aquaculture and reduction fisheries. J. Agric. Econ. 55, 245–265. doi: 10.1111/j.1477-9552.2004.tb00095.x
Barsky, R., and Kilian, L. (2002). Oil and the macroeconomy since the 1970s. J. Econ. Perspect. 18, 115–134. doi: 10.1257/0895330042632708
Bell, F. W., Nash, D. A., Carlson, E. W., Waugh, F. V., Kinoshita, R. K., and Fullenbaum, R. F. (1970). The Future of The World's Fishery Resources: Forecasts of Demand, Supply, and Prices to The Year 2000 With a Discussion of Implications For Public Policy. Washington, DC: National Marine Fisheries Service Economic Research Laboratory.
Börger, T., Beaumont, N. J., Pendleton, L., Boyle, K. J., Cooper, P., Fletcher, S., et al. (2014). Incorporating ecosystem services in marine planning: the role of valuation. Mar. Policy 46, 161–170. doi: 10.1016/j.marpol.2014.01.019
Cao, L., Naylor, R., Henriksson, P., Leadbitter, D., Metian, M., Troell, M., et al. (2015). China's aquaculture and the world's wild fisheries. Science 347, 133–135. doi: 10.1126/science.1260149
Cashion, T. (2016). The end use of marine fisheries landings. Fish. Cent. Res. Reports 24:108. doi: 10.14288/1.0354481
Cashion, T., Le Manach, F., Zeller, D., and Pauly, D. (2017). Most fish destined for fishmeal production are food-grade fish. Fish Fish. 18, 837–844. doi: 10.1111/faf.12209
Cheung, W. W. L., Jones, M. C., Lam, V. W. Y., Miller, D., Ota, Y., Teh, L., et al. (2016). Transform high seas management to build climate-resilience in marine seafood supply. Fish Fish. 18, 254–263. doi: 10.1111/faf.12177
Chiu, A., Li, L., Guo, S., Bai, J., Fedor, C., and Naylor, R. L. (2013). Feed and fishmeal use in the production of carp and tilapia in China. Aquaculture 414–415, 127–134. doi: 10.1016/j.aquaculture.2013.07.049
Christensen, V., De la Puente, S., Sueiro, J. C., Steenbeek, J., and Majluf, P. (2014). Valuing seafood: the Peruvian fisheries sector. Mar. Policy 44, 302–311. doi: 10.1016/j.marpol.2013.09.022
FAO (2014). Fishery and Aquaculture Statistics. Available online at: http://www.fao.org/fishery/statistics/software/fishstatj/en
Hardy, R. W. (2010). Utilization of plant proteins in fish diets: effects of global demand and supplies of fishmeal. Aquac. Res. 41, 770–776. doi: 10.1111/j.1365-2109.2009.02349.x
Heston, A., Summers, R., and Aten, B. (2012). Penn World Table Version 7.1. Philadelphia, PA: Center for International Comparisons of Production, Income and Prices at the University of Pennsylvania.
Lam, V. W. Y., Cheung, W. W. L., Reygondeau, G., and Sumaila, U. R. (2016). Projected change in global fisheries revenues under climate change. Sci. Rep. 6:32607. doi: 10.1038/srep32607
Lluch-Belda, D., Crawford, R. J. M., Kawasaki, T., MacCall, A. D., Parrish, R. H., Schwartzlose, R. A., et al. (1989). World-wide fluctuations of sardine and anchovy stocks: the regime problem. South Afr. J. Mar. Sci. 8, 195–205. doi: 10.2989/02577618909504561
Melnychuk, M. C., Clavelle, T., Owashi, B., and Strauss, K. (2016). Reconstruction of global ex-vessel prices of fished species. ICES J. Mar. Sci. 74, 121–133. doi: 10.1093/icesjms/fsw169
Myers, R. A., and Worm, B. (2003). Rapid worldwide depletion of predatory fish communities. Nature 423, 280–283. doi: 10.1038/nature01610
Naylor, R. L., Goldburg, R. J., Primavera, J. H., Kautsky, N., Beveridge, M. C., Clay, J., et al. (2000). Effect of aquaculture on world fish supplies. Nature 405, 1017–1024. doi: 10.1038/35016500
Naylor, R. L., Hardy, R. W., Bureau, D. P., Chiu, A., Elliott, M., Farrell, A. P., et al. (2009). Feeding aquaculture in an era of finite resources. Proc. Natl. Acad. Sci. U.S.A. 106, 15103–15110. doi: 10.1073/pnas.0905235106
Nunoo, F. K. E., Asiedu, B., Amador, K., Belhabib, D., Lam, V., Sumaila, R., et al. (2014). Marine fisheries catches in ghana: historic reconstruction for 1950 to 2010 and current economic impacts. Rev. Fish. Sci. Aquac. 22, 274–283. doi: 10.1080/23308249.2014.962687
Pauly, D., Christensen, V., Guénette, S., Pitcher, T. J., Sumaila, U. R., Walters, C. J., et al. (2002). Towards sustainability in world fisheries. Nature 418, 689–695. doi: 10.1038/nature01017
Pauly, D., and Zeller, D. (2015). Sea Around Us Concepts, Design and Data (seaaroundus.org). Vancouver, BC: Sea Around Us.
Pauly, D., and Zeller, D. (2016). Catch reconstructions reveal that global marine fisheries catches are higher than reported and declining. Nat. Commun. 7:10244. doi: 10.1038/ncomms10244
Pikitch, E. K., Rountos, K. J., Essington, T. E., Santora, C., Pauly, D., Watson, R., et al. (2014). The global contribution of forage fish to marine fisheries and ecosystems. Fish Fish. 15, 43–64. doi: 10.1111/faf.12004
Ramcharran, H. (2002). Oil production responses to price changes: an empirical application of the competitive model to OPEC and non-OPEC countries. Energy Econ. 24, 97–106. doi: 10.1016/S0140-9883(01)00091-3
Rao, D. S. P. (2004). “The country-product-dummy method: a stochastic approach to the computation of purchasing power parities in the ICP,” in Price and Productivity Measurement, Vol. 4, International Comparisons and Trade, eds W. E. Diewert, B. M. Balk, D. Fixler, K. J. Fox, and A. O. Nakamura (Brisbane: Trafford Press), 23.
R Core Team (2017). R: A Language and Environment for Statistical Computing. Available online at: https://www.r-project.org/
Salze, G., McLean, E., Battle, P. R., Schwarz, M. H., and Craig, S. R. (2010). Use of soy protein concentrate and novel ingredients in the total elimination of fish meal and fish oil in diets for juvenile cobia, Rachycentron canadum. Aquaculture 298, 294–299. doi: 10.1016/j.aquaculture.2009.11.003
Shepherd, C. J., and Jackson, A. J. (2013). Global fishmeal and fish-oil supply: inputs, outputs and markets. J. Fish Biol. 83, 1046–1066. doi: 10.1111/jfb.12224
Silver, M. (2009). “The hedonic country product dummy method and quality adjustments for purchasing power parity calculations,” in IMF Working Paper WP/09/271 (Washington, DC: International Monetary Fund).
Srinivasan, U. T., Cheung, W. W. L., Watson, R., and Sumaila, U. R. (2010). Food security implications of global marine catch losses due to overfishing. J. Bioeconomics 12, 183–200. doi: 10.1007/s10818-010-9090-9
Sumaila, U. R., Marsden, A. D., Watson, R., and Pauly, D. (2007). A global ex-vessel fish price database: construction and applications. J. Bioeconomics 9, 39–51. doi: 10.1007/s10818-007-9015-4
Summers, R. (1973). International price comparisons based upon incomplete data. Rev. Income Wealth 19, 1–16. doi: 10.1111/j.1475-4991.1973.tb00870.x
Swartz, W., Sumaila, R., and Watson, R. (2013). Global ex-vessel fish price database revisited: a new approach for estimating “missing” prices. Environ. Resour. Econ. 56, 467–480. doi: 10.1007/s10640-012-9611-1
Tacon, A. G. J., and Metian, M. (2008). Global overview on the use of fish meal and fish oil in industrially compounded aquafeeds: trends and future prospects. Aquaculture 285, 146–158. doi: 10.1016/j.aquaculture.2008.08.015
Tacon, A. G. J., and Metian, M. (2015). Feed matters : satisfying the feed demand of aquaculture. Rev. Fish. Sci. Aquac. 23, 1–10. doi: 10.1080/23308249.2014.987209
Teh, L. S. L., and Sumaila, U. R. (2015). Trends in global shared fisheries. Mar. Ecol. Prog. Ser. 530, 243–254. doi: 10.3354/meps11049
Watson, R., Kitchingman, A., Gelchu, A., and Pauly, D. (2004). Mapping global fisheries: sharpening our focus. Fish Fish. 5, 168–177. doi: 10.1111/j.1467-2979.2004.00142.x
Wickham, H., and Francois, R. (2016). dplyr: A Grammar of Data Manipulation. Available online at: https://cran.r-project.org/package=dplyr
Keywords: catch destination, fisheries products, fishmeal, fish oil, forage fisheries, landed value, reduction fisheries
Citation: Tai TC, Cashion T, Lam VWY, Swartz W and Sumaila UR (2017) Ex-vessel Fish Price Database: Disaggregating Prices for Low-Priced Species from Reduction Fisheries. Front. Mar. Sci. 4:363. doi: 10.3389/fmars.2017.00363
Received: 14 July 2017; Accepted: 30 October 2017;
Published: 13 November 2017.
Edited by:
Simone Libralato, National Institute of Oceanography and Experimental Geophysics, ItalyReviewed by:
Valeria Mamouridis, Independent Researcher, SpainBrett W. Molony, Department of Fisheries, Western Australia, Australia
Copyright © 2017 Tai, Cashion, Lam, Swartz and Sumaila. This is an open-access article distributed under the terms of the Creative Commons Attribution License (CC BY). The use, distribution or reproduction in other forums is permitted, provided the original author(s) or licensor are credited and that the original publication in this journal is cited, in accordance with accepted academic practice. No use, distribution or reproduction is permitted which does not comply with these terms.
*Correspondence: Travis C. Tai, ttai2@alumni.uwo.ca
†Present Address: Wilf Swartz, Osaka Policy Research Institute, Sasakawa Peace Foundation, Tokyo, Japan