Inexpensive Aerial Photogrammetry for Studies of Whales and Large Marine Animals
 Stephen M. Dawson
 M. Hamish Bowman2
  Eva Leunissen
- 1Department of Marine Science, University of Otago, Dunedin, New Zealand
- 2Department of Geology, University of Otago, Dunedin, New Zealand
- 3School of Surveying, University of Otago, Dunedin, New Zealand
We describe a simple system enabling accurate measurement of swimming marine mammals and other large vertebrates from low-altitude single-frame photogrammetry via inexpensive modifications to a “prosumer” unmanned aerial vehicle (UAV) equipped with gimballed micro4/3 camera and 25 mm lens. Image scale is established via an independently powered LIDAR/GPS data-logging system recording altitude and GPS location at 1 Hz. Photogrammetric calibration of the camera and lens allowed distortion parameters to be rigorously accounted for during image analysis, via a custom-programmed Graphical User Interface (GUI) running in MATLAB. The datalogger, camera calibration methods and measurement software are adaptable to a wide range of UAV platforms. Mean LIDAR accuracy, measured from 10 bridges 9–39 m above water, was 99.9%. We conducted 136 flights in New Zealand's subantarctic Auckland Islands to measure southern right whales. Mean lengths of 10 individual whales, each photographed between 7 and 15 times, had CVs (SD/mean) ranging from 0.5 to 1.8% (mean = 1.2%). Repeated measurements of a floating reference target showed a mean error of c.1%. Our system is relatively inexpensive, easily put together, produces accurate, repeatable measurements from single vertical images, and hence is applicable to a wide range of ecological questions in marine and terrestrial habitats.
Introduction
Photogrammetry is widely used in ecological research, often to provide measurements of animals that are impractical or dangerous to capture (e.g., elephants, Rüther, 1982; sharks, Klimley and Brown, 1983; fin whales, Ratnaswamy and Winn, 1993; coelacanths, Décamps et al., 2016). Unmanned Aerial Vehicles (UAVs) are increasingly used in ecological research (see Linchant et al., 2015, for review). Their use as photogrammetric platforms to measure mobile animals, however, is a recent and evolving development.
The central challenge for photogrammetry from UAVs is establishment of scale, which, for mobile animals, must be achieved instantaneously. The simplest approach is to include in the image an object of known size, typically a boat (e.g., Whitehead and Payne, 1981; Christiansen et al., 2016), or projected laser dots a known distance apart (e.g., Durban and Parsons, 2006; Rowe and Dawson, 2008). Having a boat in the image involves the potential for disturbance, and our trials with lasers indicated that the dots may not show up on whales at the ranges required, and raised questions about eye-safety. Alternatively, provided that camera separation and orientation are known precisely, stereo camera systems do not require an independent measurement of range. The extra weight and awkwardness of a stereo camera system, however, are impractical on most UAVs. If the subject can be assumed to be lying in a horizontal plane, vertical photography using a single gimballed camera, ideally with a low-distortion lens, and a means of accurately measuring height, is far more practical.
There are at least three approaches to measuring height. The first uses data logged from a high-precision air pressure sensor (e.g., Durban et al., 2015). Provided there are no substantial atmospheric changes during the flight, such data can accurately record altitude. Carrier-phase GPS is also an option; several models are light enough to be carried on a medium-sized UAV and can support centimeter accuracy. This approach relies on having an accurate terrain model, and, if over water, correcting for tidal height. LIDAR (Light Detection and Ranging) technology involves illuminating a target with pulsed laser light and measuring reflected pulses to provide information about target range. LIDAR was first applied in meteorology (e.g., Goyer and Watson, 1963), but has found a very wide range of applications since, including recent use in obstacle avoidance and navigation in autonomous vehicles (e.g., Schwarz, 2010). Now that lightweight LIDAR units are available, they provide a simpler, practical solution for instantaneous measurement of altitude in UAVs. The system we describe here uses this technology.
Our purpose is to provide an example by adapting an off-the shelf “prosumer” quadcopter for specialized aerial photogrammetry, via inexpensive modifications. We provide results of testing the accuracy and precision of the LIDAR unit, describe the calibration of the UAV camera and lens, describe a software tool we developed to measure images, and quantify the accuracy and precision of resulting photogrammetric measurements of a floating reference target and living whales. A building guide for the datalogger, the code to run it, and our measurement software are provided as Supplementary Material. Our intention is to enable others to apply easily the potential of UAV-based aerial photogrammetry to their ecological research.
Methods and Results
Platform Choice
The competing needs of light weight, high resolution, dynamic range and low distortion led us to the Micro4/3 system, and to the Olympus 25 mm f1.8 lens. Rather than build a bespoke UAV, we chose to adapt the DJI Inspire 1 Pro (I1P) quadcopter for single-frame photogrammetry. This UAV has a gimballed camera (X5, 16 MP, Micro4/3), and supports the Olympus 25 mm f1.8 lens. Live video feedback is displayed while in flight via an Apple iOS or Android device running DJI “GO,” which allows adjustment of camera and gimbal settings. We use this particular UAV platform as an example only; the LIDAR datalogger, camera calibration process and measurement approach presented below are applicable to a wide range of multirotor and fixed wing UAV platforms.
LIDAR/GPS Datalogger
The I1P has no ports giving access to its GPS data or power. Therefore, we built an altitude measuring system that was completely independent (Figure 1). This comprised a Lightware SF11-C LIDAR, Pololu MinIMU-9 Inertial Measurement Unit, GlobalSat EM506 GPS module and 3.3 v 8 Mhz ProMicro Arduino-compatible microcontroller (and MicroSD flash card breakout). The GPS module is used to timestamp the altitude data so they can be matched to image timestamps. When hovering, multirotor UAVs must tilt into the wind to maintain position. If the LIDAR is rigidly mounted to the UAV, its measurements of altitude will be biased high (by the cosine of the tilt angle). For this reason the datalogger system incorporates an Inertial Measurement Unit (IMU) which measures UAV tilt. We wrote code to integrate LIDAR measurements and IMU data into the output data sentences from the GPS module (GGL and RMC-NMEA protocols). Data are logged (at 1 Hz) by the microcontroller to a Micro SD card as .csv files. Power is supplied by a separate 7.4 v 500 mAH lithium-polymer battery, with its output regulated to 5 v using a 3 A UBEC. Combined weight of this system is <100 g.
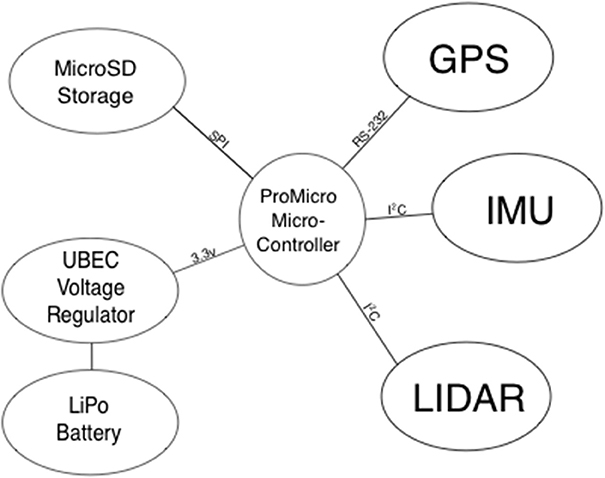
Figure 1. Block diagram of the datalogger. Text on the connecting lines shows communication protocols.
System components are non-invasively mounted to the I1P via double-sided foam tape and gaffer tape. We built carbon-fiber brackets to support the GPS module and power system. The latter is mounted at the aircraft nose to offset the weight of components added behind the center of balance (see Figure 2). Detailed building instructions and the code to run the datalogger are available in Supplementary Material.
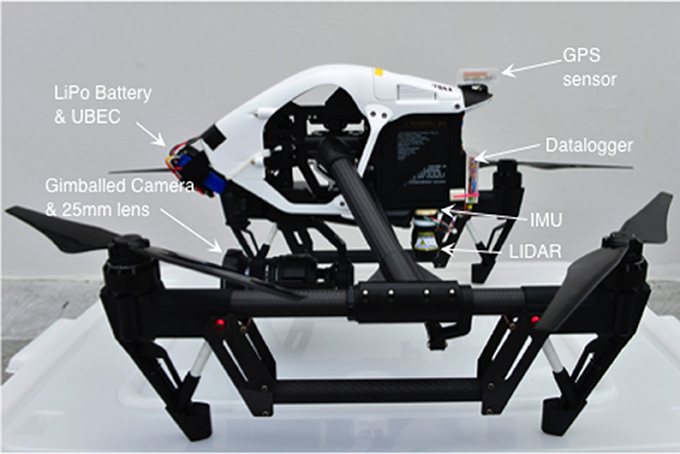
Figure 2. Components of the UAV photogrammetric system.
LIDAR Accuracy
The specifications of the SF11 LIDAR indicate ±10 cm accuracy for ranges up to 40 m over moving water. To gain a more detailed evaluation, we mounted the LIDAR/GPS datalogging system on a wooden board, and clamped it to bridges ranging in height above water from 9 to 39 m. Raw LIDAR measurements were recorded at 1 Hz for at least 60 s (n = 60–224). We were assured by the manufacturer that subsequent LIDAR measurements are independent. The Kawarau bridge was measured at two different heights above water (Table 1).
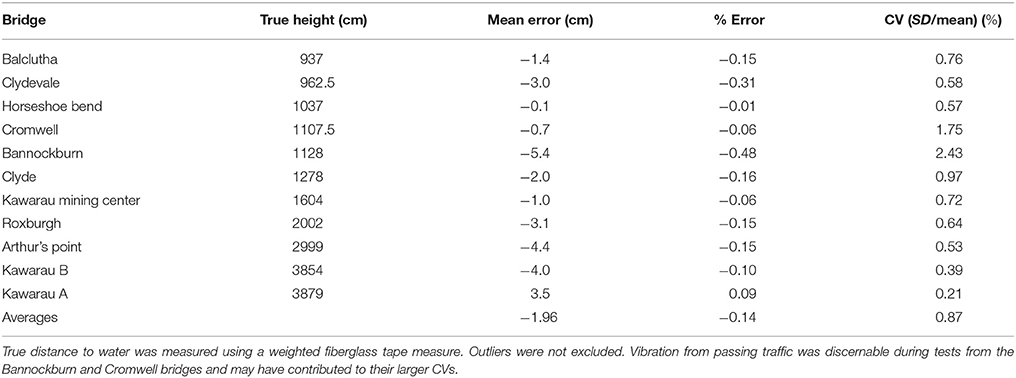
Table 1. Accuracy of raw SF-11 LIDAR ranges over water.
While mean accuracy across replicated tests is very good, the raw data showed occasional outliers, presumably due to the changing shape of the water surface. To investigate how these might be reduced via applying a median smoothing filter (which the SF-11 can do internally), we conducted a further test from the Clydevale bridge (9.77 m to water surface). We set the LIDAR to output a moving median of 16 measurements (made at 16 Hz). Both unfiltered and filtered data showed high accuracy (mean error +1.7 cm), but large differences in precision. Unfiltered data showed maximum errors of +1.74 m and −1.42 m (n = 2508, SD = 0.118 m) while the filtered data showed maximum errors of +0.06 m and −0.03 m (n = 2508, SD = 0.014 m).
Camera Calibration
To achieve rigorous scaling of distances to object size, the camera's interior orientation parameters (IOPs) and lens distortion parameters must be known accurately. To avoid slight changes in focal length due to focussing, the I1P's camera was set to infinity focus. We calibrated the camera and lens by taking multiple aerial images of a field containing 88 40 cm stakes placed 2 m apart in a 14 × 20 m grid pattern. A high-contrast target was fixed to the top of each stake. To support scaling, we also placed within the calibration field three precisely measured windsurfer masts each with a high-contrast target at each end. The I1P was flown around the calibration field, stopping to take oblique images every 45 degrees in a converging pattern, first at 20 m indicated altitude, then at an indicated 30 m and 40 m. This set was supplemented with nine vertical shots as the I1P was lowered from 40 to 20 m above the center of the grid (Figure 3). The resulting images were loaded into Australis photogrammetric software (www.Photometrix.com.au) in which stake-top targets were measured and scale defined. A free-net bundle adjustment (Mikhail et al., 2001) was performed to establish the calibration characteristics of the camera and lens combination (Table 2).
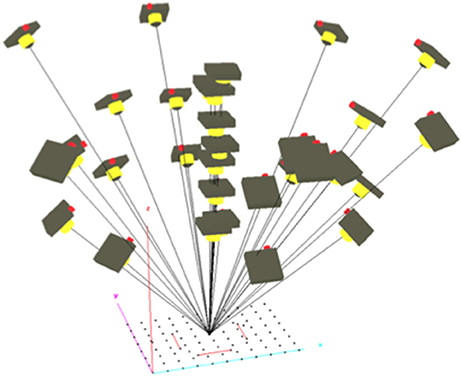
Figure 3. Image network used for camera calibration displayed in Australis subsequently to bundle block adjustment.
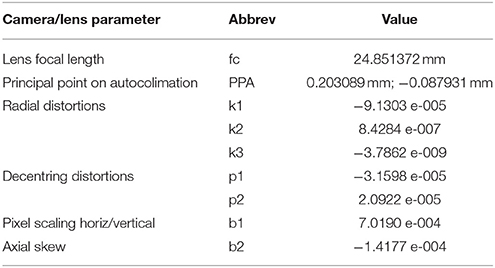
Table 2. Calibration characteristics of our DJI X5 camera and Olympus 25 mm f1.8 lens according to the 10-parameter model employed in Australis (Fraser, 1997).
The calibration yielded a hyperfocal length 0.6% shorter than the specified focal length. The lens exhibited moderate barrel distortion only, with maximum radial distortion of −56 μm and marginal decentering distortion of 4 μm at 11 mm radius (corner of the Micro4/3 sensor). If uncorrected, the combination of uncertainties on focal length and lens distortion would introduce a 1% error in the size estimate.
Graphical User Interface
We programmed a Graphical User Interface (GUI) in MATLAB to incorporate the measured camera calibration parameters, LIDAR ranges and tilt data into the image measurement process. Using an Excel file listing best images, the GUI opens an image, applies the appropriate LIDAR measurement and camera calibration data, and prompts the user to indicate the total length of the animal (whale in our case) by creating a series of points (mouse clicks) from the tip of the jaw, along the spine, to the fluke notch. To allow for some imprecision, the software fits a smooth curve to these points. The software then offers options to measure other features (see Figure 4). The user is required to input data on image quality, and can add notes. These data are written to an Excel-formatted results file, and the software prompts for the next whale. The software also allows measurement of any other image of interest, via manually inputting a LIDAR measurement. The MATLAB code is available in the Supplementary Material, so that others can adapt it for their specific needs.
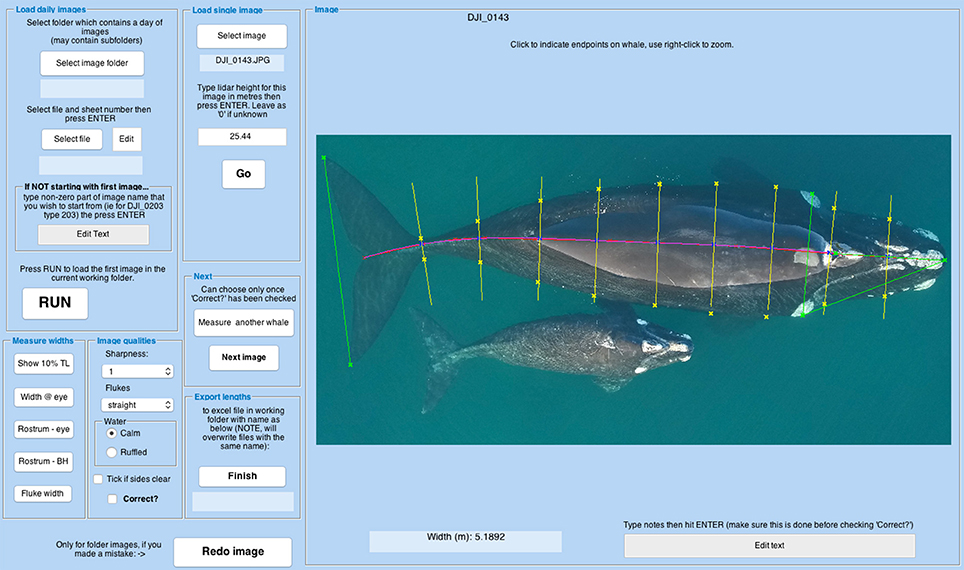
Figure 4. Screenshot of the GUI measurement screen. The purple line is a curve fitted to user-defined points along the spine to measure total length. Yellow lines indicate where the user should click on the whale's outline to measure body width at 10% intervals of total length. Green lines represent measurements from eye to eye, rostrum to eye rostrum to blowholes and fluke width.
Accuracy and Repeatability of Photogrammetric Measurements
To measure accuracy of photogrammetric measurements, we took 65 photographs of a 2.716 m floating reference target, from 16 to 30 m altitude, the usual range within which we photograph whales, at the end of whale-measuring flights. On each occasion the target was photographed in the center of the field of view, and in each of the corners. Measurements showed positive bias when the target was photographed in the bottom left corner and slight negative bias when photographed in the top right corner (ANOVA, p = 0.015), suggesting that the UAV's gimbal may not have been exactly vertical. Overall, mean error was 1% (2.7 cm, SD = 4.9 cm). We made no attempt to correct for this small error in measurements of whales.
Repeatability of measurements was assessed from 10 photographically identified southern right whales (Eubaleana australis) for which we had at least seven different measurement-grade images each (Table 3). Images had to be sharp, with the tip of the rostrum and fluke notch clearly visible, and the tail flukes apparently flat (i.e., not drooped).
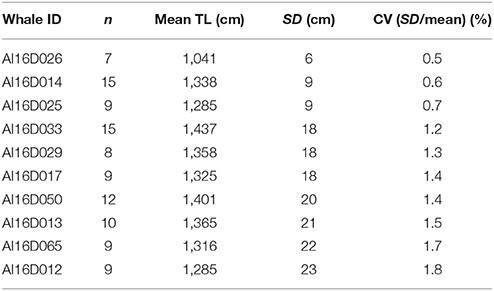
Table 3. Measurements of total length (TL) of photographically identified right whales.
The mean CV of total length measurements was 1.2%, surprisingly precise considering that whales are inherently flexible, there is inevitably some imprecision in tracing the spine, and that rippling of the water surface and refraction can compromise pointing accuracy. This CV implies a 95% confidence interval from a single image of a 14 m whale of 13.66–14.33 m. There was no evidence of a relationship between CV and whale size.
Deployment
Good weather made it possible to fly the I1P on 12 days over 22 days in Port Ross (50° 32′S, 166° 14′E), a harbor at the Northern end of the Auckland Islands (26 July−17 August 2016). Seven flights were made from a 6.6 m rigid-hulled inflatable, landing on a 1.6 × 1.6 m platform. This proved challenging in practice, so the remaining 129 flights were flown from the aft deck of the Otago University research vessel Polaris II. More recently, we have added “handles” to our UAVs (Figure 2), and shifted to hand-catching as our standard practice; this makes flying from small boats much more practical. Flights were generally 10–12 min in duration. To allow a generous safety margin, our protocol was to land with at least 40% of battery capacity remaining. Flights were made in winds of up to 20 knots, generally over smooth water in the lee of a shore. All appropriate permissions, including a research permit from New Zealand's Department of Conservation, were in place. We saw no evidence of any reaction by the whales to the UAV.
Before safe flight, most UAVs must calibrate their Inertial Measurement Unit, and compass. Despite launching from moving vessels, the I1P calibrated its IMU successfully on all but one occasion, when the vessel was rolling. We occasionally had difficulty calibrating the I1P's compass. This may have been to do with a local magnetic anomaly (strong enough to be marked on the nautical chart of Port Ross), or to the substantial steel gantry on the aft deck of Polaris II. Relatively close proximity (<2 m) to this was unavoidable. On the few occasions when reattempting the calibration or moving the UAV a meter or so was not effective, we successfully calibrated the I1P's compass on the wheelhouse roof, away from magnetic materials. The Polaris II is a wooden vessel.
We did notice an unexpected feature of the I1P's image timestamps. These are synchronized from the tablet running “GO,” the camera control software. In remote areas, away from access to a Network Time Protocol server, the tablet clock is likely to drift. We measured and corrected for this using GPS timestamps of LIDAR data gathered during videoed take-offs or landings. Time drift on our iPad Air was 9 s over the 17 days on which we flew. In future remote trips we will daily photograph the time screen of a handheld GPS with the iPad.
We also took along an APH-22 hexacopter equipped with an Olympus E-PM2 and 25 mm f1.8 lens (Durban et al., 2015) and two Swellpro Splashdrones equipped with Canon D30 waterproof point-and-shoot cameras programmed to take images every 2 s (Christiansen et al., 2016). The APH-22 flew well and collected data for 2 days, but crashed into the water when the velcro strap holding its battery in place failed. This incident was in contrast to the usual reliability of this aircraft (e.g., Durban et al., 2015). One of the Splashdrones flew briefly, and crashed into the water. Thereafter neither could calibrate its flight controller, and hence did not fly. The local magnetic anomaly may have been the cause of this problem.
Discussion
The purpose of this contribution is to describe modifications we have made to an off-the-shelf UAV to make it suitable for low-altitude aerial photogrammetry and provide sufficient information for others to be able to replicate it. These modifications could be applied to a wide variety of mid-size UAVs. Excluding our development time, the cost in New Zealand of our I1P-based system, including 25 mm lens, iPad Air, 6 TB48 batteries and charger was approximately US$5,300. The parts to build our GPS/LIDAR datalogging system total approximately $US340. If you wish to use the GUI described above, you may need to buy MATLAB. The APH-22 hexacopter sells as a complete system for $US20,000. In the field, the I1P appeared to fly at least as well as the APH-22 hexacopter, and was much easier to use (R.W. Wallace, APH-22 pilot, pers. comm).
Durban et al. (2015), whose APH-22 hexacopter estimates altitude from logged measurements of air pressure, report similar mean accuracy in measurements of fixed targets (mean errors; theirs = 0.7%, ours = 1.0%), but much worse precision (their CV = 4.5%; our CV = 1.8%). Their approach, and that of Christiansen et al. (2016), makes no allowance for any lens/camera distortions. Six individual blue whales they measured 4–7 times showed ranges of measurements within 5% of the mean for each individual (Durban et al., 2016). This is a smaller sample (of whales and repeat measurements) than we present above (Table 3), but suggests similar precision in actual use. This may be because precision is driven more by the flexibility of whales than by errors in the photogrammetric process. Dawson et al. (1995) reached a very similar conclusion comparing different boat-based methods of measuring sperm whales.
The largest contributor to photogrammetric error in our system is LIDAR inaccuracy. Ranges measured from stable road bridges showed occasional outliers. With the whale data, we minimized outliers by applying a 5 s median filter to the LIDAR measurements, centered on the time when the photograph was taken. This is a reasonable because while photographing a whale, we seldom change throttle settings (therefore altitude). The consistency of measurements of known whales shows this was effective. The LIDAR can be programmed to apply a median filter to raw measurements; enabling this feature increased the precision of altitude measurements by more than an order of magnitude.
This system was designed for measuring whales, but could be applied to measuring any large animal swimming at the surface (e.g., sharks, dolphins) or hauled out on a beach (e.g., pinnipeds), or to measuring the spacing between individuals. It could also be used to measure habitat areas at small scales (e.g., coral patch reefs). The calculations assume that the object to be measured is essentially on a flat plane whose range from the camera is measured by the lidar. Without knowing exactly where the lidar was measuring to, the system would not be suitable for measurements of terrestrial animals on uneven ground.
Ethics Statement
The research was conducted under permit 50094-MAR from Department of Conservation New Zealand.
Author Contributions
SD developed the central ideas, conducted all fieldwork, analyzed the data and led the writing process. MB designed and programmed the datalogger. EL developed the measurement software. PS conducted the photogrammetric calibration. All authors contributed critically to the drafts and gave final approval for publication.
Conflict of Interest Statement
The authors declare that the research was conducted in the absence of any commercial or financial relationships that could be construed as a potential conflict of interest.
Acknowledgments
This research was principally funded by the New Zealand Antarctic Research institute, with additional support from Otago University and NZ Whale and Dolphin Trust. SD is especially grateful to Colin Gans for UAV advice. Mike Paulin helped with our prototype LIDAR-datalogger. We thank the crew and expedition members on board Polaris II for the 2016 Winter season. Richard Greasley (Lacklands NZ ltd) facilitated a discounted Inspire 1 Pro. Alastair Neaves, Mike Denham and Ray McLennan advised on measuring LIDAR accuracy. We thank Chris Fitzpatrick for administrative assistance.
Supplementary Material
The Supplementary Material for this article can be found online at: https://github.com/EvaLeunissen/Whalength
References
Christiansen, F., Dujon, A. M., Sprogis, K. R., Arnould, J. P. Y., and Bejder, L. (2016). Non-invasive unmanned aerial vehicle provides estimates of the energetic cost of reproduction in humpback whales. Ecosphere 7:e01468. doi: 10.1002/ecs2.1468
Dawson, S., Chessum, C. J., Hunt, P., and Slooten, E. (1995). An inexpensive, stereo-photographic technique to measure sperm whales from small boats. Rep. Int. Whal. Commn. 45, 431–436.
Décamps, T., Herrel, A., Ballesta, L., Holon, F., Rauby, T., Gentil, Y., et al. (2016). The third dimension: a novel set-up for filming coelacanths in their natural environment. Methods Ecol. Evol. 8, 322–328. doi: 10.1111/2041-210X.12671
Durban, J. W., Fearnbach, H., Barrett-Lennard, L. G., Perryman, W. L., and Leroi, D. J. (2015). Photogrammetry of killer whales using a small hexacopter launched at sea 1. J. Unmanned Veh. Syst. 3, 131–135. doi: 10.1139/juvs-2015-0020
Durban, J. W., Moore, M. J., Chiang, G., Hickmott, L. S., Bocconcelli, A., Howes, G., et al. (2016). Photogrammetry of blue whales with an unmanned hexacopter. Mar. Mammal Sci. 32, 1510–1515. doi: 10.1111/mms.12328
Durban, J. W., and Parsons, K. M. (2006). Laser-metrics of free ranging killer whales. Mar. Mammal Sci. 22, 735–743. doi: 10.1111/j.1748-7692.2006.00068.x
Fraser, C. S. (1997). Digital camera self-calibration. ISPRS J. Photogramm. Remote Sens. 52, 149–159. doi: 10.1016/S0924-2716(97)00005-1
Goyer, G. G., and Watson, R. (1963). The laser and its application to meteorology. Bull. Am. Meterol. Soc. 44, 564–575.
Klimley, A. P., and Brown, S. T. (1983). Stereophotography for the field biologist: measurement of lengths and three-dimensional positions of free-swimming sharks. Mar. Biol. 74, 175–185. doi: 10.1007/BF00413921
Linchant, J., Lisein, J., Semeki, J., Lejeune, P., and Vermeulen, C. (2015). Are unmanned aircraft systems (UASs) the future of wildlife monitoring? A review of accomplishments and challenges. Mammal Rev. 45, 239–252. doi: 10.1111/mam.12046
Mikhail, E. M., Bethel, J. S., and McGlone, J. C. (2001). Introduction to Modern Photogrammetry. New York, NY: John Wiley & Sons.
Ratnaswamy, M. J., and Winn, H. E. (1993). Photogrammetric estimates of allometry and calf production in fin whales, Balaenoptera physalus. J. Mammal. 74, 323–330. doi: 10.2307/1382387
Rowe, L. E., and Dawson, S. M. (2008). Laser photogrammetry to determine dorsal fin size in a population of bottlenose dolphins from Doubtful Sound, New Zealand. Aust. J. Zool. 56, 239–248. doi: 10.1071/ZO08051
Rüther, H. (1982). Wildlife stereo photogrammetry at close range. Int. Arch. Photogramm. 24, 422–432.
Schwarz, B. (2010). LIDAR: mapping the world in 3D. Nat. Photon. 4, 429–430. doi: 10.1038/nphoton.2010.148
Keywords: aerial, photogrammetry, UAV, LIDAR, whale
Citation: Dawson SM, Bowman MH, Leunissen E and Sirguey P (2017) Inexpensive Aerial Photogrammetry for Studies of Whales and Large Marine Animals. Front. Mar. Sci. 4:366. doi: 10.3389/fmars.2017.00366
Received: 28 July 2017; Accepted: 31 October 2017;
Published: 15 November 2017.
Edited by:
Alastair Martin Mitri Baylis, South Atlantic Environmental Research Institute, Falkland IslandsReviewed by:
Daniel Paul Costa, University of California, Santa Cruz, United StatesDavid Peel, Commonwealth Scientific and Industrial Research Organisation (CSIRO), Australia
Copyright © 2017 Dawson, Bowman, Leunissen and Sirguey. This is an open-access article distributed under the terms of the Creative Commons Attribution License (CC BY). The use, distribution or reproduction in other forums is permitted, provided the original author(s) or licensor are credited and that the original publication in this journal is cited, in accordance with accepted academic practice. No use, distribution or reproduction is permitted which does not comply with these terms.
*Correspondence: Stephen M. Dawson, steve.dawson@otago.ac.nz