Route Fidelity during Marine Megafauna Migration
 Travis W. Horton1*
  Nan Hauser2
  Alexandre N. Zerbini3,4,5 Malcolm P. Francis6 Michael L. Domeier7 Artur Andriolo5,8 Daniel P. Costa9 Patrick W. Robinson9 Clinton A. J. Duffy10 Nicole Nasby-Lucas7
  Richard N. Holdaway11 Phillip J. Clapham3
- 1Department of Geological Sciences, University of Canterbury, Christchurch, New Zealand
- 2Center for Cetacean Research and Conservation, Avarua, Cook Islands
- 3National Marine Mammal Laboratory, Alaska Fisheries Science Center, National Marine Fisheries Service, NOAA, Seattle, WA, United States
- 4Cascadia Research Collective, Olympia, WA, United States
- 5Instituto Aqualie, Juiz de Fora, Brazil
- 6National Institute of Water and Atmospheric Research, Wellington, New Zealand
- 7Marine Conservation Science Institute, Fallbrook, CA, United States
- 8Laboratório de Ecologia Comportamental e Bioacústica, ICB, Universidade Federal de Juiz de Fora, Juiz de Fora, Brazil
- 9Ecology and Evolutionary Biology, University of California, Santa Cruz, Santa Cruz, CA, United States
- 10Department of Conservation, Auckland, New Zealand
- 11Palaecol Research Ltd., Christchurch, New Zealand
The conservation and protection of marine megafauna require robust knowledge of where and when animals are located. Yet, our ability to predict animal distributions in space and time remains limited due to difficulties associated with studying elusive animals with large home ranges. The widespread deployment of satellite telemetry technology creates unprecedented opportunities to remotely monitor animal movements and to analyse the spatial and temporal trajectories of these movements from a variety of geophysical perspectives. Reproducible patterns in movement trajectories can help elucidate the potential mechanisms by which marine megafauna navigate across vast expanses of open-ocean. Here, we present an empirical analysis of humpback whale (Megaptera novaeangliae), great white shark (Carcharodon carcharias), and northern elephant seal (Mirounga angustirostris) satellite telemetry-derived route fidelity movements in magnetic and gravitational coordinates. Our analyses demonstrate that: (1) humpback whales, great white sharks and northern elephant seals are capable of performing route fidelity movements across millions of square kilometers of open ocean with a spatial accuracy of better than 150 km despite temporal separations as long as 7 years between individual movements; (2) route fidelity movements include significant (p < 0.05) periodicities that are comparable in duration to the lunar cycles and semi-cycles; (3) latitude and bedrock-dependent gravitational cues are stronger predictors of route fidelity movements than spherical magnetic coordinate cues when analyzed with respect to the temporally dependent moon illumination cycle. We further show that both route fidelity and non-route fidelity movement trajectories, for all three species, describe overlapping in-phase or antiphase sinusoids when individual movements are normalized to the gravitational acceleration present at migratory departure sites. Although these empirical results provide an inductive basis for the development of testable hypotheses and future research questions, they cannot be taken as evidence for causal relations between marine megafauna movement decisions and geophysical cues. Experiments on model organisms with known sensitivities to gravity and magnetism, complemented by further empirical observation of free-ranging animals, are required to fully explore how animals use discrete, or potentially integrated, geophysical cues for orientation and navigation purposes.
Introduction
During some of the most spectacular yet least understood events in nature, millions of animals migrate between widely separated habitats without getting lost. In fact, animals from at least three different phyla are able to relocate previously inhabited sites, including chordates, arthropods, and molluscs (Switzer, 1993). With respect to marine megafauna, humpback whales (Megaptera novaeangliae), great white sharks (Carcharodon carcharias), and northern elephant seals (Mirounga angustirostris) maintain inter-annual site fidelity to specific seasonal habitats (Oliver et al., 1998; Wedekin et al., 2010; Anderson et al., 2011) despite undertaking long-distance migrations that span thousands of kilometers of open ocean (Le Boeuf et al., 2000; Nasby-Lucas and Domeier, 2012; Garrigue et al., 2015). Direct observation of the same whales, sharks, and seals in the same areas, year after year, demonstrates that all three species have well-developed navigational abilities that enable high levels of spatiotemporal movement accuracy and precision. Despite our awareness of these remarkable movements, a mechanistic understanding of how marine megafauna navigate remains elusive.
One of the main reasons why we do not yet understand the mechanics of marine megafauna navigation is the fact that we have not yet identified the coordinate space in which navigation occurs. Several fundamental questions remain unanswered for most migratory species, including: What exogenous cues are used for orientation purposes? What reference frame(s) and reference datum(a) are applied during the transduction and neurological processing of these cues? To what extent are endogenous cues integrated with exogenous cues during navigation?
In this study, we explore these knowledge gaps through empirical analyses of humpback whale, great white shark, and northern elephant seal route fidelity movements from both magnetic and gravitational geophysical perspectives. We focus our analyses on magnetic inclination and vertical gravitational acceleration cues (see Nomenclature for a glossary of terms) as experimental studies have suggested both can serve as exogenous sources of orientation information during animal movement (Wiltschko and Wiltschko, 1972; Larkin and Keeton, 1978; Keeton, 1979; Kanevskyi et al., 1985; Light et al., 1993; Lohmann and Lohmann, 1994; DeVries et al., 2004; Putman et al., 2011; Blaser et al., 2013, 2014). By focussing our analyses on route fidelity movements, our research is directly relevant to positional orientation during migration, one of the greatest unknowns in animal navigation science (Gould, 2004). By considering a diverse suite of species and scientific disciplines, our research represents a direct response to growing calls for more integrative research on animal migration and navigation (Bowlin et al., 2010; Hays et al., 2016).
Humpback whales, great white sharks and northern elephant seals are ideally suited to empirical analysis of animal movement due to the fact that telemetry datasets for all three species include remarkable examples of asynchronous migratory route fidelity. Route fidelity is similar to site fidelity in that both refer to the repeated utilization of migratory destinations at distinctly different times. In contrast to site fidelity, route fidelity refers to the repeated utilization of well-defined migration routes by either the same individual during multiple independent migrations (i.e., intra-individual route fidelity) or different individuals migrating separately (i.e., inter-individual route fidelity). In this study, we present and analyse 22 humpback whale, great white shark, and northern elephant seal route fidelity movements, including multiple examples of intra- and inter-individual route fidelity. Our dataset includes humpback whales in the South Atlantic and South Pacific Oceans, great white sharks in the North and South Pacific Oceans and northern elephant seals in the North Pacific Ocean.
Materials and Methods
Satellite Telemetry
Humpback whales were tracked using published methods (Garrigue et al., 2015). In brief, a carbon-fiber pole (Heide-Jørgensen et al., 2003) or a modified pneumatic line-thrower (Heide-Jørgensen et al., 2001) pressurized to ~10 bar with compressed air was used to implant transdermal location-only SPOT radio-frequency platform transmitting terminal (PTT) satellite tags (Wildlife Computers, Redmond, WA, U.S.A.) into the upper flank of each whale near the base of the dorsal fin. Transmitters were duty cycled to maximize battery life as described in Zerbini et al. (2006) and Hauser et al. (2010). In all references to PTT tag numbers in the current study, the two digits to the right of the decimal point correspond with the abbreviated Julian calendar year in which the satellite-monitored movement was initiated.
Great white sharks were tracked using similar technology deployed by different methods (Domeier et al., 2012; Francis et al., 2012). In brief, SPOT5 PTT tags were affixed using 3–4 small plastic or stainless steel bolts in the apex of the dorsal fin of each temporarily restrained individual. Unlike marine mammals, great white sharks do not have to surface to breathe. Thus, position data from this species are much more sporadic than they are for whales and seals. Location estimates for white sharks were received only when animals spent enough time at the surface, with the dorsal fin above the waterline, allowing the ARGOS (Argos, CLS Group) satellite array to receive three or more consecutive transmissions from the tag. Surface swimming behavior varied among individual sharks, resulting in varying resolution migration data for each shark.
Northern elephant seals were also tracked using PTT satellite tags (Robinson et al., 2012) which were attached to the head of each seal during onshore residence in Año Nuevo State Park (ca. 37.11°N; 122.33°W), California, U.S.A. Elephant seal locations were estimated using the ARGOS satellite system based on transmissions received when the PTT was out of the water.
Route fidelity movements were identified from larger satellite telemetry datasets by visual inspection of PTT track maps using GIS software. Movement tracks, or portions of tracks, that visually overlapped for extended periods (i.e., coincident animal location symbols or track lines for multiple days in geographic coordinates) when viewed at a scale of 1:10,000,000 were identified as route fidelity movements. At this scale, an 8 point map symbol is approximately 10 km wide. The three South Atlantic humpback whale route fidelity movements were identified from inspection of a total of 12 long-distance migration tracks (i.e., 25%). The four South Pacific humpback whale route fidelity movements were identified from inspection of a total of 13 intra-tropical movement tracks (i.e., 31%). The two South Pacific great white sharks demonstrating both intra- and inter-individual route fidelity were identified from inspection of long-distance PTT tracks of three different sharks (i.e., 67%). The intra-individual route fidelity movements of two North Pacific great white sharks were identified from inspection of the PTT tracks of 11 individual sharks (i.e., 18%). The four northern elephant seal tracks were identified from inspection of a total of 74 long-distance migration tracks (i.e., 5%).
Raw animal location estimates downloaded from the ARGOS system were processed using a 20 km/h velocity filter and combined to determine single average daily locations for each individual. Transmissions were not received by the ARGOS system from all PTT tags on all days. Average daily locations were only determined for those calendar dates on which velocity-filtered locations were received. Gaps in the tracking datasets were not filled by interpolation due to the fact that we do not know the coordinate space in which navigation was performed (Horton et al., 2014). All animal tracking research reported here was carried out in accordance with animal ethics consents given to the authors by their home institutions and/or relevant government agency.
Astronomical and Geophysical Variables
We determined multiple astronomical, magnetic, and gravitational cues present at the whale, shark and seal locations recorded by the PTT animal tracking devices (see Nomenclature for a glossary of terms). Astronomical cues, including moon illumination, were calculated using published astronomical algorithms (Meeus, 1991). Moon illumination is a unitless time-dependent quantity ranging between 0 (i.e., new moon) and 1 (i.e., full moon) across the average 29.53-day-long synodic (i.e., moon illumination) cycle. We used it as a direct proxy for time to facilitate comparative analyses of multiple asynchronous individual telemetry tracks in a single panel.
With respect to magnetic cues, we determined main field plus rock anomaly field magnetic coordinates, including magnetic inclination, field intensity and declination, for all animal locations using the Enhanced Magnetic Model (Maus, 2010). Of the seven different magnetic variables used to define the position of Earth's magnetic field from a geocentric perspective in both spherical (F, I, D) and Cartesian (X, Y, Z, H) coordinate spaces (for definitions see Nomenclature; Horton et al., 2014), magnetic inclination (I) is the most widely associated with animal orientation and navigation (e.g., Wiltschko and Wiltschko, 1972; Light et al., 1993). Extensive experimental research has demonstrated that the movement behaviors of diverse species change in response to changes in magnetic inclination. These results have been variably interpreted as evidence for utilization of magnetic inclination as: (1) a navigational compass that facilitates directional orientation (Wiltschko and Wiltschko, 1972), or, (2) part of a metaphorical bi-coordinate “magnetic map” that facilitates positional orientation (Putman et al., 2011). Regardless of how magnetic inclination is used during animal navigation and orientation, compelling experimental evidence demonstrates that it is part of the system by which many migratory species find and follow specific movement trajectories.
Thus, a key question emerges: Are route fidelity movements compatible with orientation relative to magnetic inclination? We explored this question by plotting magnetic inclination vs. moon illumination for the route fidelity movements reported above. Considering the fact that these highly directional movements were performed at distinctly different times in distinctly different locations, strong correlations and systematic non-random patterns in the data would be suggestive of a potential spatiotemporal orientation behavior informed by cues associated with magnetic inclination.
With respect to gravity, we determined local gravitational accelerations associated with both latitude and bed-rock density using the International Gravity Formula (Götze, 2014) and the International Gravimetric Bureau's 2 × 2 arc-min (i.e., ~3.7 × ~3.7 km) World Gravity Map (Balmino et al., 2012), respectively. Latitude (gL) and bed-rock (gB) vertical gravitational accelerations are reported in Gals (i.e., cm sec−2).
Of the multiple factors that determine gravity (i.e., g) at a given place and time, latitude has the largest effect. At 20° north or south latitude, the theoretical gL is 978.637 Gal. In contrast, gL is 981.070 Gal at 50° north or south latitude, equating to a 2.433 Gal range in gL over this 30° range. Importantly, gL is a trigonometric function of latitude with the most rapidly changing gL values occurring in the middle latitudes and the most gradually changing gL values occurring near the geographic equator and poles. For example, an animal that migrates from the equator to 30° south or north latitude would experience a change in gL of 1.292 Gal, roughly half the range in gL experienced by migrating between 20° and 50° latitude. To facilitate understanding, a 30,000 kg humpback whale requires 900 N (i.e., 202 lbs) less buoyancy force to remain effortlessly afloat in a tropical habitat, where gL is ~979 Gal, relative to a high-latitude habitat, where gL is ~982 Gal.
The shape and density of Earth also affects local g. However, the difference in geologically imparted Bouguer gravity anomalies from one location to the next is on the order of 10 to 100 mGal, roughly 1 to 10% as large as the latitudinal effects on g across the geographic range of the tracks we report. Since both latitudinal and geological effects on g are temporally independent, we additively combined these two gravitational variables into a single spatially dependent coordinate, gL+gB, that is determined solely by an animal's location.
The whales, sharks, and seals we studied experienced a wide range of gravitational conditions during their individual migrations. Latitude dependent gravity values (gL) ranged between 978.287 Gal (i.e., cm/sec2) and 981.737 Gal. Local bedrock-dependent gravity values (gB) ranged between +0.025 Gal and +0.587 Gal. Using these spatially dependent gravitational variables, we constructed bivariate plots of all three species' movements through gravitational coordinates, or g-space. We define g-space as the bicoordinate system that includes the sum of gL and gB as the spatially dependent variable and moon illumination as the temporally dependent variable.
As an animal moves, its gL value will change as its latitudinal position changes, its gB value will change as the density of the Earth's crust over which it is swimming changes, and the magnitude of the tidal gravity vector will change in unison with lunar phase. In contrast, for an animal that stops its migratory movement and begins residence in a single area, only moon illumination would continue to change, and the gL and gB values it experiences would remain constant. Pure east-west movements would experience changing gB values and moon illuminations while the latitudinal component (gL) remains constant.
Data Analysis Methods
The satellite telemetry, astronomical, and geophysical data generated by our research were analyzed using a variety of statistical tools. Piecewise linear regression breakpoint analysis (Muggeo, 2008) performed on latitude/longitude time-series plots was used to estimate the date on which open ocean migration was initiated at the individual scale. Latitude time-series plots were used on all individuals with the exception of the North Pacific great white sharks, where longitude time-series were used due to the predominantly meridional nature of these tracks. Spectral analysis using the Lomb-Scargle algorithm (Scargle, 1982; Press et al., 1992; Hammer et al., 2001) was used to determine significant (α = 0.05) periodicities present in latitude time-series plots at the individual scale. Sinusoidal regression (Press et al., 1992; Hammer et al., 2001) was performed on geophysical (i.e., magnetic and gravitational) cue vs. moon illumination plots in order to determine the proportion of data variance explained (i.e., coefficient of determination; R2) by a sine-function model of the data.
Results
Route Fidelity Movements
Inspection of the humpback whale, great white shark, and northern elephant seal tracking datasets revealed multiple examples of migratory route fidelity (Table 1). Migration tracks exhibiting route fidelity were followed by: humpback whales tagged off the coasts of Brazil and Rarotonga, Cook Islands; great white sharks tagged off southern New Zealand and Guadalupe Island, Mexico; northern elephant seals tagged in Año Nuevo State Park, California, U.S.A. Our satellite tracking results demonstrate that these diverse marine megafauna demonstrated a remarkable ability to find and follow near-identical paths despite the fact that none of these individuals was ever within 100 km of the same geographic location at the same Julian calendar date and time.
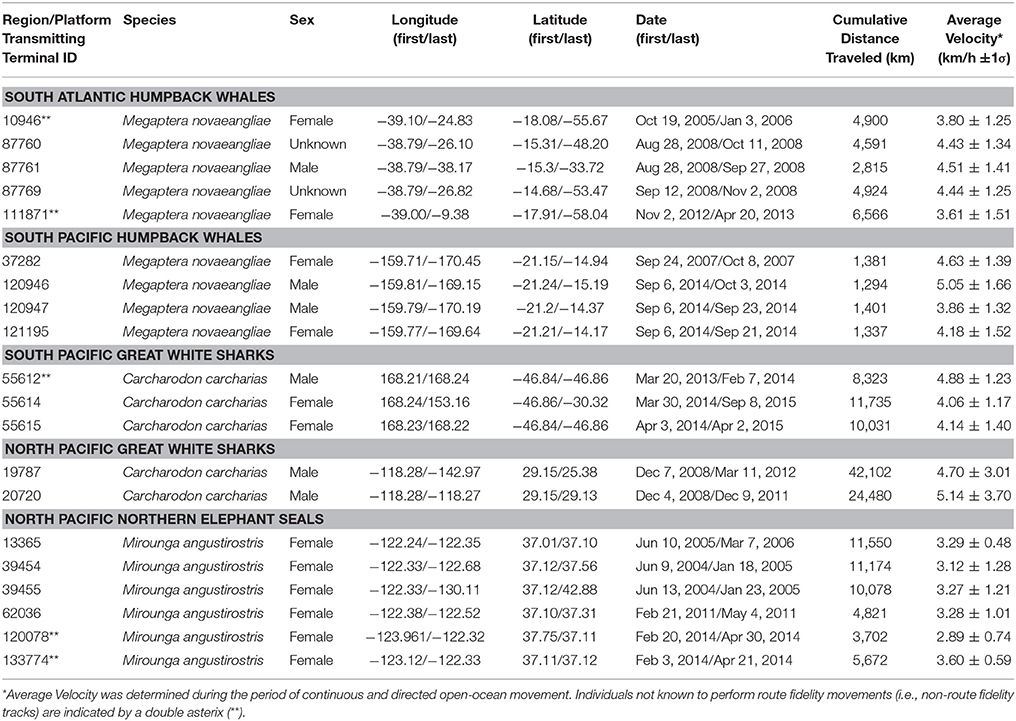
Table 1. Platform transmitting terminal (PTT) tag deployment information.
South Atlantic Humpback Whale Route Fidelity Movements
Three humpback whales tagged off Brazil (PTT identification numbers: 87760.08; 87761.08; 87769.08) swam near-identical south then southeast directed asynchronous migration paths away from Abrolhos Bank off the eastern coast of Brazil (ca. −39°W; −19.8°S; Figure 1A; Zerbini et al., 2006) and toward higher-latitude feeding grounds in the South Atlantic Ocean (ca. −50 to −60°S; Figure 1A; Zerbini et al., 2011). All three whales followed approximately the same ~1,550 km southerly path away from Abrolhos Bank, during the first 12 (PTT 88760.08), 15 (PTT 87769.08), and 16 (PTT 87761.08) days of their temporally distinct migrations (Figure 1A). These three whales migrated through a migratory corridor that was at most ~100 km wide despite swimming across a vast expanse of open-ocean at different times. Average swimming speeds during these south-directed movements ranged between 4.3 and 5.0 km/h (±1.1 to 1.4 km/h, ±SD).
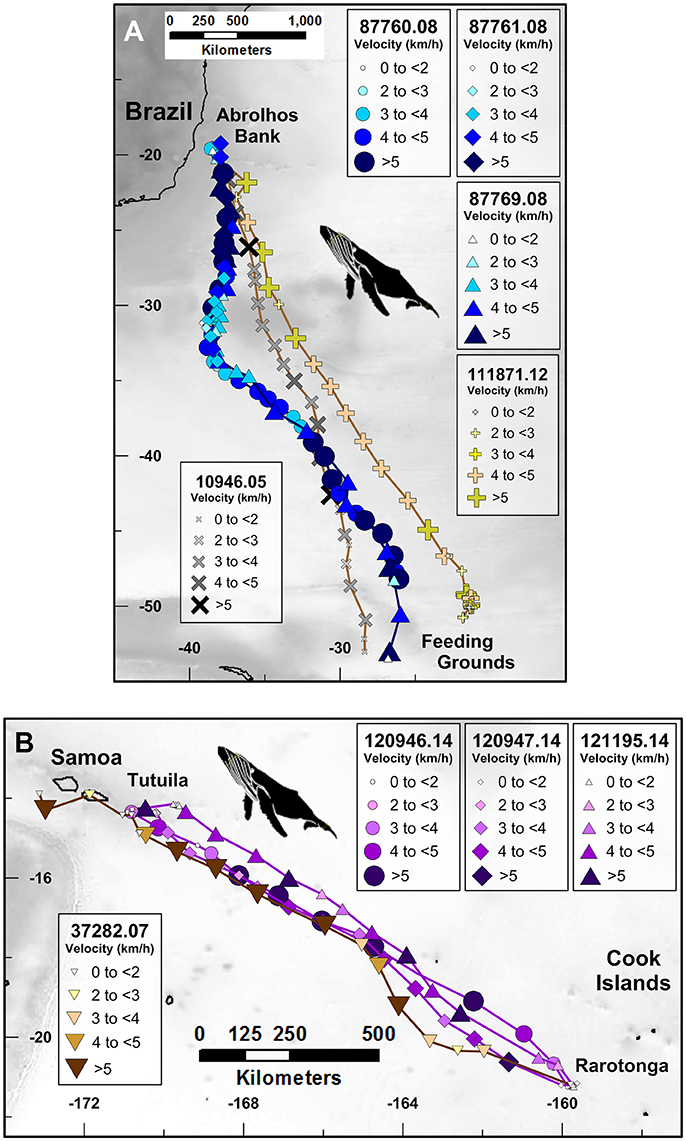
Figure 1. Route fidelity and non-route fidelity movements of satellite-monitored humpback whales, including: (A) humpback whales in the South Atlantic Ocean, (B) humpback whales in the South Pacific Ocean. Symbol sizes and color hue correspond with average daily track velocity (km/h) as shown in the legends. Unique platform transmitting terminal (PTT) tag numbers to the left of the PTT number decimal point correspond with individual whales and are represented by symbol shape; digits to the right of PTT number decimal point correspond with the abbreviated year in which the whale was tagged and are represented by symbol color family (i.e., blue, yellow, purple, etc.). Multiplication (PTT 10946.05) and addition (PTT 111871.12) symbols in (A) correspond with long-distance non-route fidelity migrations.
Following these initial movements, two of the whales (PTT 87760.08 and PTT 87769.08) turned to a southeast heading until both tags stopped transmitting another 17 and 24 days later, respectively (N.B. PTT 87761.08 stopped transmitting ca. −38°W; −34°S). During these southeast-directed movements, 88760.08 and 87769.08 swam an additional 1,991 and 2,581 km, respectively, through a <85 km wide open-ocean corridor despite migrating ~15 days apart (Figure 1A). The average swimming speeds during these southeast-directed movements were 4.8 and 4.4 km/h (±0.9 and ±1.5 km/h, ±SD) for whales 87760.08 and 87769.08, respectively. For comparison, we include two additional migration tracks of humpback whales that migrated through the same corridor, but along distinctly different geographic coordinate trajectories, in 2005 (PTT 10946.05, Figure 1A) and 2012 (PTT 111871.12, Figure 1A).
South Pacific Humpback Whale Route Fidelity Movements
Four humpback whales tagged off Rarotonga, Cook Islands (PTT identification numbers: 37282.07; 120946.14; 120947.14; 121195.14) swam similar asynchronous northwest directed migration paths away from Rarotonga, in the southern Cook Islands (ca. −159°W; −21°S; Figure 1B), to Tutuila, American Samoa (ca. −171°W; −14°S; Figure 1B). All four of these route fidelity movements began in mid-September, albeit 7 years apart (one in 2007, three in 2014). All four whales followed similar ~1,300 km long northwest directed paths to Tutuila, American Samoa, during the first 12 to 14 days of their intra-tropical movements despite migrating at distinctly different times (Figure 1B). The Rarotonga-Tutuila migratory corridor used by these whales was at most 150 km wide in the area ~300–400 km northwest of Rarotonga and 50–100 km wide elsewhere (Figure 1B). The open-ocean swimming speeds for the four intra-tropical movements ranged between 3.9 and 5.0 km/h.
South Pacific Great White Shark Route Fidelity Movements
Two great white sharks departed the waters off southwest New Zealand in early to mid-July, 2014 and 2015 (PTT 55614), and early to mid-September, 2014 (PTT 55615). Although the two sharks followed distinctly different paths between New Zealand and the southeast Great Barrier Reef, Australia, shark 55614 followed a near-identical route between New Zealand and Australia in both 2014 and 2015 (Figure 2A). Additionally, sharks 55614 and 55615 both followed a similar return migration path from coastal waters off Byron Bay, Australia, to coastal waters off southwest New Zealand (Figure 2A) in late November, 2014 (PTT 55615), and early December, 2014 (PTT 55614).
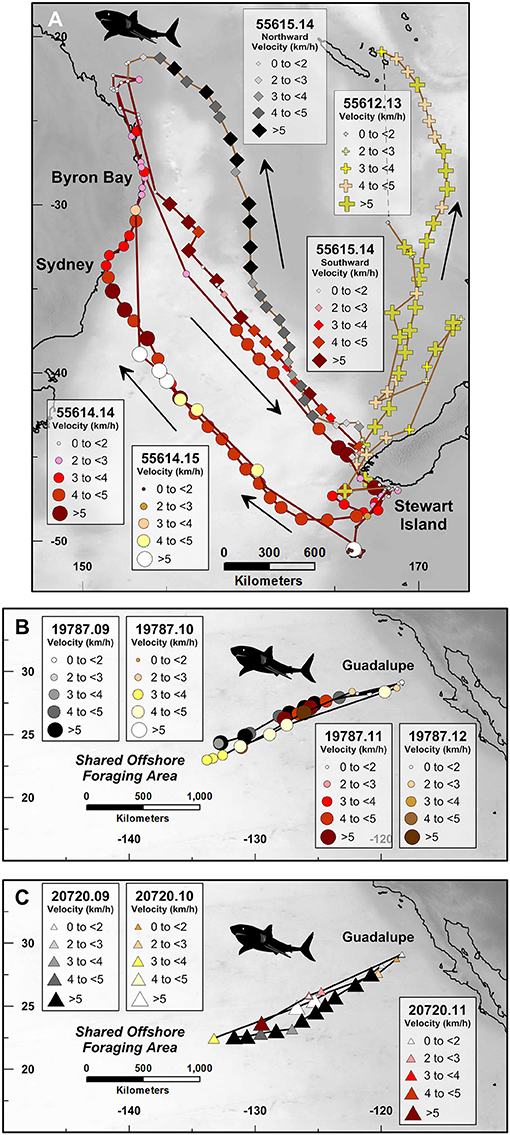
Figure 2. Route fidelity and non-route fidelity movements of satellite-monitored great white sharks, including: (A) great white sharks in the South Pacific Ocean, (B,C) great white sharks in the North Pacific Ocean. Symbol sizes and color hue correspond with average daily track velocity (km/h) as shown in the legends. Unique platform transmitting terminal (PTT) tag numbers to the left of the PTT number decimal point correspond with individual sharks and are represented by symbol shape; digits to the right of PTT number decimal point correspond with the abbreviated year in which the whale was tagged and are represented by symbol color family (i.e., red, yellow, brown, etc.). Addition (PTT 55612.13) and black/gray diamond (PTT 55615.14) symbols in (A) correspond with long-distance non-route fidelity migrations.
The satellite tracking results acquired for these two sharks include examples of both intra-individual (i.e., PTT 55614, New Zealand to Australia in 2014 and 2015) and inter-individual (i.e., PTT 55614 and PTT 55615, Australia to New Zealand in 2014) route fidelity. Like both the South Atlantic and South Pacific humpback whale datasets, satellite tracking demonstrates that these two sharks can find and follow <150 km wide migratory corridors during temporally separated open-ocean movements that are well in excess of 1,000 km distance during multiple weeks of continuous swimming. For comparison, we include a third great white shark (PTT 55612) that performed a round-trip migration between Stewart Island, New Zealand, and the Loyalty Islands, New Caledonia (ca. 167°E; −21°S; Figure 2A), during 2013.
North Pacific Great White Shark Route Fidelity Movements
Two great white sharks tagged off Guadalupe Island, Baja, Mexico (PTT identification numbers: 19787; 20720) swam similar to near-identical asynchronous west-southwest directed migration paths away from Guadalupe (ca. −118°E; 29°N) to the central northeast Pacific shared offshore foraging area, or SOFA (ca. −134°W; 23°N; Figures 2B,C; Domeier et al., 2012). These movements were repeated each year from 2009 to 2012, by shark 19787 (Figure 2B), and 2009 to 2011, by shark 20720 (Figure 2C). The tracking data indicate that shark 19787 consistently departed Guadalupe several weeks earlier than shark 20720. Specifically, shark 19787 departed Guadalupe between:
(1) December 22, 2008 and January 17, 2009
(2) January 23 and January 24, 2010
(3) November 29, 2010 and February 5, 2011
(4) December 20, 2011 and January 15, 2012
Whereas, shark 20720 departed Guadalupe between:
(1) March 16 and March 23, 2009
(2) March 16 and April 3, 2010
(3) March 21, April 3, 2011
Piecewise linear regression breakpoint analysis of longitude vs. time profiles for these seven separate migrations suggests that they likely began on, or about, January 15, 2009, January 24, 2010, February 4, 2011 and January 9, 2012 for shark 19787, and March 22, 2009, April 1, 2010 and March 18, 2011 for shark 20720.
Despite the relatively low temporal resolution of the Mexico great white shark dataset, these data reinforce the observation that great white sharks are capable of migrating through well-defined <150 km wide migratory corridors with a high degree of inter-annual route fidelity (Figures 2B,C). Four years in a row, shark 19787 followed the same west/southwest-directed path from Guadalupe to the SOFA (Figure 2B). Shark 20720 followed a similar but consistently more southerly path than 19787 every year between 2009 and 2011 (Figure 2C).
North Pacific Northern Elephant Seal Route Fidelity Movements
Four northern elephant seals tagged at Año Nuevo State Park, California, U.S.A. (PTT identification numbers: 39454.04, 13365.04, 39455.05; 62036.11) swam similar to near-identical asynchronous northwest directed migrations between the central California coast and the central North Pacific Ocean/Gulf of Alaska (Figure 3). In contrast to previous research documenting intra-individual route fidelity in male northern elephant seal tracks (Le Boeuf et al., 2000), the seal tracks we analyzed demonstrate inter-individual route fidelity achieved by three females and one male. These seals departed the California coast at Año Nuevo State Park between June 9, 2004 and February 21, 2011 (Table 1). Despite migrating across a >6 year period, these four seals followed the same ~150 km wide migration route during their individual 30–38 day, and 2,500–4,000 km long, northwest-directed migrations (Figure 3).
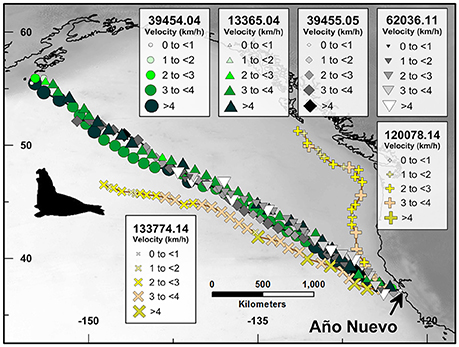
Figure 3. Route fidelity and non-route fidelity movements of satellite-monitored northern elephant seals. Symbol sizes and color hue correspond with average daily track velocity (km/h) as shown in the legends. Unique platform transmitting terminal (PTT) tag numbers to the left of the PTT number decimal point correspond with individual seals and are represented by symbol shape; digits to the right of PTT number decimal point correspond with the abbreviated year in which the whale was tagged and are represented by symbol color family (i.e., green, yellow, black, etc.). Yellow multiplication (PTT 133774.14) and addition (PTT 120078.14) symbols correspond with long-distance non-route fidelity migrations.
Like the humpback whale and great white shark datasets we analyzed, satellite tracking demonstrates that these four seals were able to find and follow a well-defined migratory corridor during asynchronous long-distance open-ocean movements spanning several weeks of continuous swimming. Although we focus our analysis on the initial route fidelity stage of these elephant seal migrations, these same seals dispersed across ~3 million km2 of the North Pacific Ocean during subsequent non-route fidelity stages of their individual migrations. For comparison, we include two additional migration tracks of northern elephant seals that followed distinctly different geographic coordinate trajectories in 2014 (PTT 120078.14 and 133774.14, Figure 3).
Timing of Route Fidelity Movements
Satellite-monitored PTT tracking of humpback whales, great white sharks, and northern elephant seals in the Atlantic and Pacific reveals that all three species have navigational systems capable of reproducing near-identical movements across vast expanses of featureless ocean (Figures 1–3). At a minimum, these remarkable examples of navigational reproducibility require both precise and accurate spatial orientation. The fact that all three of the sharks that were tracked for more than 1 year (i.e., PTT identification numbers: 55614, 19787, 20720) also showed a migratory fidelity to specific times of the year further suggests there is a temporal component to open-ocean navigation and migration.
Indeed, one of the distinctive features of the route fidelity movements we report is the fact that they occurred at different times. The asynchrony of these movements is important: little navigational information can be gained from analysis of two or more marine migrants that are swimming together as the coordinate space trajectories followed by these animals would be indistinguishable from any geophysical or environmental perspective. Thus, it is the combined effects of the movement asychrony and the temporal dependence of orientation cues available from the environment that make route fidelity movements potentially novel indicators of navigational behavior. We focused our temporal analysis of the route fidelity movements described above on whether or not a systematic temporal pacing was present.
Spectral analysis using the Lomb-Scargle periodogram algorithm (Scargle, 1982) performed on individual route fidelity latitude-time datasets demonstrates that significant (p < 0.05) periodicities are present in all of the route fidelity movements with 15 or more average daily PTT locations. The fact that significant periodicities were not detected in the route fidelity tracks with <15 locations in total does not necessarily mean that these movements lacked temporal pacing. Rather, the relatively small number of PTT locations in these spatially and temporally shorter tracks may simply preclude periodicity detection using the Lomb-Scargle algorithm.
Significant periodicities were detected in three South Atlantic humpback whale, two South Pacific white shark and four North Pacific elephant seal route fidelity movements (Figure 4). These nine tracks represent the nine longest distance and duration annual movements in our dataset. None of the shorter duration intra-tropical Rarotonga humpback whale tracks, nor any of the Guadalupe Island white shark tracks, included a detectable significant periodicity. Spectral analysis of the nine longest duration tracks detected significant periodicities with average peak powers of 15 days (SD = 3 days; n = 3; Figure 4) and 27 days (SD = 2 days; n = 7; Figure 4). These significant periodicities are not unlike the period (range = 29.3–29.8 days) and semi-period (range = 14.6–14.9 days) of the lunar illumination cycle (i.e., synodic cycle). Periodicities in these ranges are not entirely unexpected given the growing number of studies demonstrating that lunar illumination is strongly correlated with a variety of organismal behaviors including animal movement (e.g., Larkin and Keeton, 1978; Grau et al., 1981; Baird et al., 2003; Tsukamoto et al., 2003; DeVries et al., 2004; Fraser, 2006; Pinet et al., 2011; Erisman et al., 2012; Schmidt et al., 2012; Sudo et al., 2014).
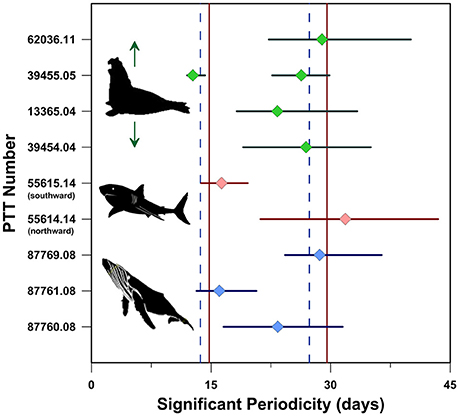
Figure 4. Significant (p < 0.05) periodicities in long-distance route fidelity tracks revealed by spectral analysis. Colored diamonds correspond with the highest power (i.e., peak) periodicity and horizontal bars correspond with the range in significant (p < 0.05) periodicities detected using the Lomb-Scargle algorithm (Scargle, 1982). Red vertical lines correspond with the 29.53 and 14.76 day-long moon illumination (i.e., synodic) cycle and semi-cycle, respectively. Dashed blue vertical lines correspond with the 27.32 and 13.66 day-long moon declination (i.e., sidereal) cycle and semi-cycle, respectively, and are shown for reference.
The tracks we studied further demonstrate that synodic periods are also present in the time gaps separating individual movements (Figure S1). For example, the three 2008 South Atlantic whales tracks that individually include significant semi-synodic periodicities (Figure 4), also demonstrate an inter-track semi-synodic separation that is maintained throughout the southward migrations of these whales (Figure S1A). This ~15 day separation persists despite a reduction in movement velocity between ~30°S and ~40°S latitude in all three tracks (Figure 1A). Two other South Atlantic humpbacks that followed distinctly different geographic coordinate paths (i.e., non-route fidelity movements; Figure 1A) across the same southeast-directed migratory corridor in 2005 (PTT 10946.05) and 2012 (PTT 111871.12) performed their migrations 36 and 52 lunar synodic cycles before and after the 2008 whales, respectively (Figure S1A).
Despite the fact that no significant periodicities were detected within any of the individual Rarotonga humpback whale route fidelity movements, these four intra-tropical movements occurred approximately 0.5, 86.0, or 86.5, synodic cycles apart (Figure S1A). Similar time gaps, ranging between 0.5 and 70.5 synodic cycles, separate both the route fidelity and non-route fidelity movements of the white sharks and elephant seals we tracked (Figures S1B–D) suggesting there is a strong temporal component to marine megafauna movement.
Time-series analyses of the humpback whale, great white shark, and northern elephant seal movements we report demonstrate that these movements include significant and systematic temporal periodicities that are similar in duration to the synodic and semi-synodic cycles. However, the synodic cycle is just one of the many quasi-monthly lunar cycles (i.e., sidereal, anomalistic, tropical, etc.) modulated by the relative position of the moon. The empirical results we report demonstrate that humpback whales, great white sharks and northern elephant seals are capable of performing long distance movements that include both spatial and temporal fidelity to well-defined migratory trajectories.
Movements in Magnetic Coordinates
Our analyses demonstrate that magnetic inclination is a strong predictor of route fidelity movements (Table 2), consistent with the hypothesis that magnetic inclination informs navigation. At the population level, route fidelity movements appear as overlapping in-phase or antiphase sinusoids when magnetic inclination values are plotted against moon illumination (Figure 5). These unexpected systematic and symmetrical correlations require temporal pacing: even individuals that followed the same track at the same speed would not be expected to show this pattern unless their movements were initiated at similar, or antithetical, times in the synodic cycle. The systematic nature of the movement trajectories shown in Figure 5 is reinforced by the fact that the overlapping in-phase/antiphase pattern persists despite temporal separations between individual tracks as long as 7 years. Although these magnetic inclination vs. moon illumination trajectories are highly unexpected, they are consistent with the synodic and semi-synodic periodicities revealed by spectral analysis.
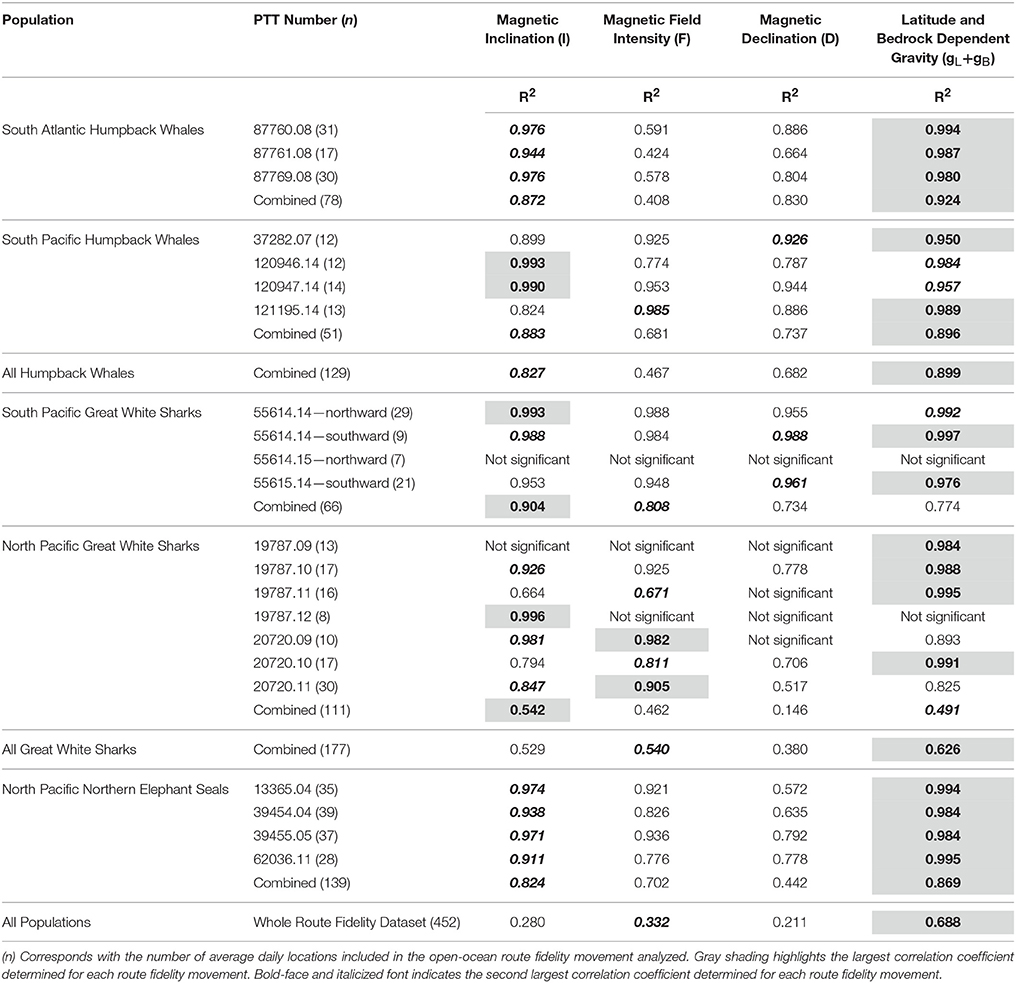
Table 2. Significant (p < 0.05) sinusoidal regression correlation coefficients for route fidelity movements in geophysical coordinates relative to moon illumination.
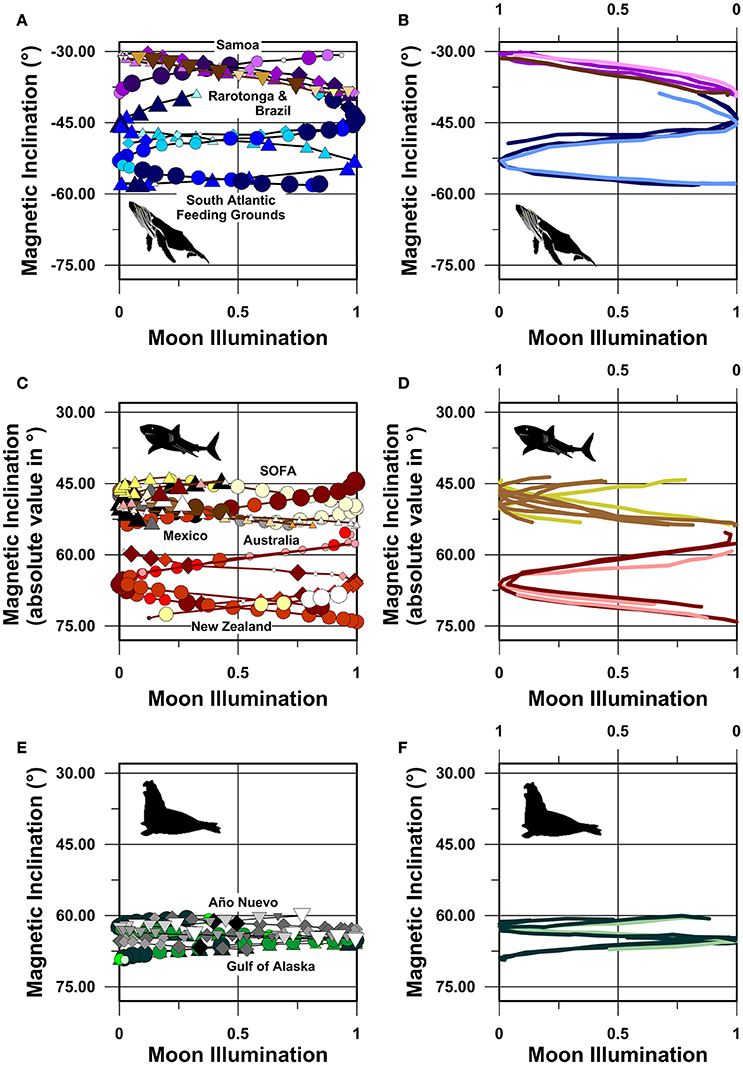
Figure 5. Magnetic inclination vs. moon illumination plots. (A,B) Humpback whales in the South Atlantic and South Pacific Oceans, (C,D) great white sharks in the South Pacific and North Pacific Oceans, (E,F) northern elephant seals in the North Pacific Ocean. Symbols as in Figures 1–3. In (B,D,F), average daily location symbols have been removed, and the tracks of PTT numbers 87769.08, 120946.14, 55614.15, 55615.15, 19787.10, 19787.11, and 39455.05 are plotted against the upper reverse moon illumination axis. These seven tracks are thus mirrored across the 0.5 (i.e., 50%) moon illumination value. (B,D,F) are included in order to show the symmetrical in-phase or antiphase distribution of the data with respect to the synodic cycle. These 7 mirror-image tracks are plotted as lighter colored lines. All other tracks (n = 15) are plotted against the lower moon illumination axis and are shown as darker colored lines. Magnetic inclination values in (C,D) are plotted as absolute values due to the fact that the two white shark populations reside in opposite magnetic hemispheres. Magnetic inclination axis values span the same range in all panels to facilitate comparisons between the three species.
Perhaps even more surprising, however, is the finding that the route fidelity movements of individual species appear to overlap despite extreme geographic separations between the different populations studied. For example, both the South Atlantic and South Pacific humpback whale route fidelity tracks, and both the South Pacific and North Pacific great white shark route fidelity tracks, describe near continuous magnetic inclination vs. moon illumination trajectories (Figures 5A–D). Six of the seven humpback whale movements we report departed coastal breeding grounds, in areas with magnetic inclination values ca. −38 to −39°, within a few days of full or new moon (Figure 5A). Similarly, most of the South Pacific and North Pacific great white sharks arrived at, or departed from, coastal locations in Australia or Mexico, in areas with magnetic inclination values ca. ±53 to ±55°, within a few days of full or new moon.
Sinusoidal regression with respect to the moon illumination cycle reveals that magnetic inclination is the strongest magnetic spherical coordinate predictor of individual and population-level route fidelity movements (Table 2). However, these same movements also exhibit significant sinusoidal correlations with respect to both magnetic field intensity and magnetic declination in the majority of tracks analyzed (Table 2). Thus, it is not possible to conclusively rule out potential roles for any of the spherical magnetic coordinates in whale, shark or seal navigation based on these analyses alone.
However, magnetic inclination explains a higher proportion of the sinusoidal regression model variance at the individual track level (median = 96%; average = 93%; range = 83–99%; SD = 4.2%; n = 19) than magnetic field intensity (median = 92%; average = 84%; range = 42–99%; SD = 16.4%; n = 19) or magnetic declination (median = 79%; average = 80%; range = 52–99%; SD = 14.2%; n = 17). In contrast, when all of the route fidelity tracks from all populations of all species are combined, magnetic field intensity is the strongest magnetic coordinate predictor, explaining 33% of the model variance (Table 2), followed by magnetic inclination (28%) and magnetic declination (21%).
Movements in Gravitational Coordinates
G-space plots of marine megafauna route-fidelity migrations reveal that these long-distance open-ocean movements describe highly symmetrical trajectories (Figure 6) not unlike the magnetic inclination trajectories reported above. Several aspects of these results are notable.
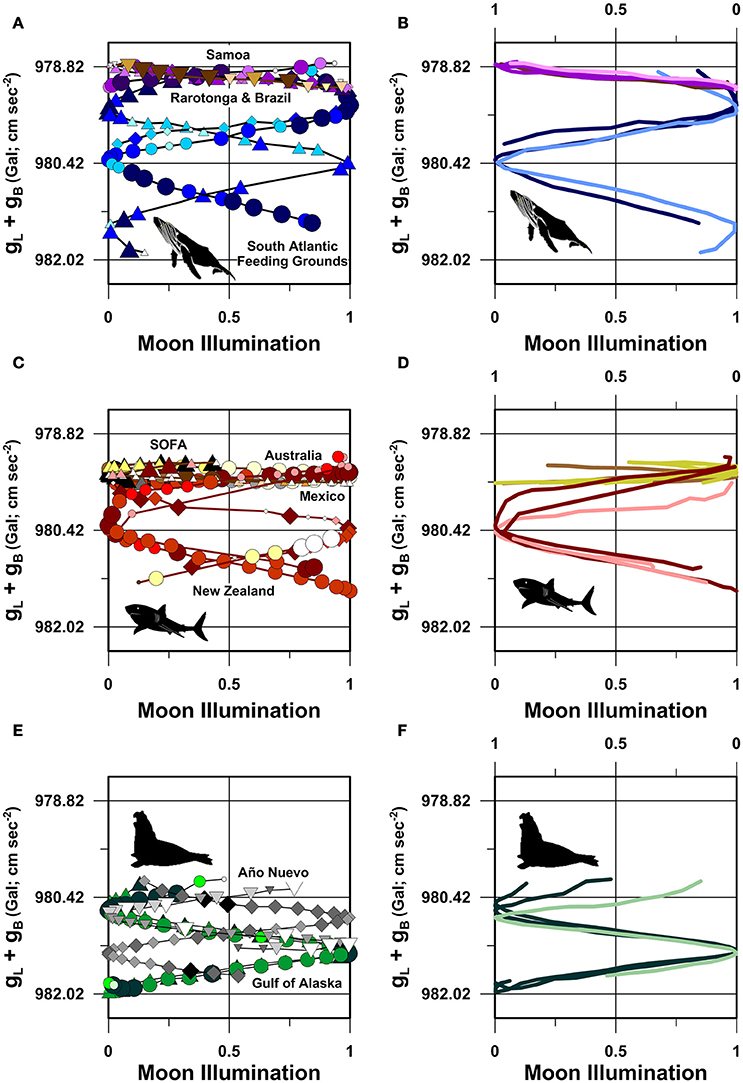
Figure 6. Latitude and bedrock dependent gravity vs. moon illumination “g-space” plots. (A,B) Humpback whales in the South Atlantic and South Pacific Oceans, (C,D) great white sharks in the South Pacific and North Pacific Oceans, (E,F) northern elephant seals in the North Pacific Ocean. Symbols as in Figures 1-3. In (B,D,F), average daily location symbols have been removed, and in (B,F) the same tracks are plotted against the upper reverse moon illumination axis as in Figures 5B,F. In (D), PTT numbers 19787.09, 19787.12, 20720.09, 20720.10, and 20720.11 are plotted against the upper reverse moon illumination axis and PTT numbers 19787.10 and 19787.11 are plotted against the lower moon illumination axis. All mirror-image tracks plotted against the upper moon illumination axis are displayed as lighter color lines. gL+gB corresponds with the sum of the latitude (gL) and bedrock (gB) dependent vertical gravitational accelerations at each individual location (see Nomenclature).
First, all three South Atlantic humpback whales departed the southeast corner of Abrolhos Bank (ca. gL+gB = 978.7 to 978.8 Gal) at antithetical positions of the synodic cycle, 2–3 days prior to full or new moon (Figure 6A). These whales maintain this symmetry, about a quarter moon (i.e., 0.5 or 50% moon illumination) mirror plane, throughout their migrations toward higher-latitude feeding grounds (Figure 6B). For example, 88760.08 and 87769.08 both pass the gravitational half-way point in their migrations (ca. gL+gB = 980.42 Gal; −33.1°W; −37.4°S) when the moon is either full or new (Figure 6A). This spatiotemporal symmetry is a direct consequence of the fact that all three whales systematically reduced their swimming speeds by ~1.5–2.0 km/h as they approached the gravitational half-way point of their southward migrations (Figure 6A).
Second, similar symmetrical g-space trajectories are present in the four South Pacific humpback whale route fidelity tracks (Figure 6A). Despite migrating at distinctly different calendar dates across a 7 year period, all four whales departed Rarotonga, Cook Islands (ca. −159.8°W; −21.2°S) at antithetical positions of the moon illumination cycle within hours of full or new moon. All four whales arrived off the southeast coast of Tutuila, American Samoa (ca. −170.8°W; −14.4°S), near the subsequent full or new moon (Figure 6A). As recognized in the South Atlantic dataset, these movements are symmetrical across the gravitational half-way point (ca. 979.01 Gal; −167°W; −16.3°S in geographic coordinates; Figure 6B). This symmetry exists despite each whale: (1) following slightly different routes during the first week of their movements to Tutuila (Figure 1B); and (2) swimming at different speeds during different stages of their movements (Figure 1B).
Third, although the great white shark tracks we analyzed predominantly demonstrate intra-individual route fidelity, these tracks have many of the same characteristics as the humpback whale movements when plotted in gravitational coordinates (Figure 6C). For example, during its near-identical 2014 and 2015 northward migrations to Australia, white shark 55614 departed southwest New Zealand within 24 h of the July, 2014, full moon and the August, 2015, new moon. During these geographically coincident northward migrations, 55614 passed the gL+gB midpoint value of 980.42 Gal within 24 h of both the July, 2014, new moon and August, 2015, full moon (Figure 6D), at a geographic position located ~350 km southeast of Sydney, Australia. During its intervening 2014 southward migration, 55614 passed the same 980.42 Gal gravitational midpoint within 24 h of the December, 2014, new moon (Figure 6C) at a geographic position located ~500 km east of where it passed the same g-space midpoint during its northward passage (Figure 2A).
Despite following distinctly different northward and southward geographic coordinate routes during its seasonal migrations between New Zealand and Australia (Figure 2A), the g-space trajectories of white shark 55614's movements are all but indistinguishable from the g-space trajectories followed by three South Atlantic humpback whales (Figure 6A) and at least one other south Pacific white shark (PTT 55615; Figures 6C,D). Our analyses further show that South Pacific white sharks 55614 and 55615 followed diametrically opposed g-space trajectories during their 2014 return migrations from Australia despite performing these migrations approximately 15 days apart (Figures 6C,D, Figure S1C).
Fourth, the seven examples of intra-individual route fidelity performed by the two North Pacific great white sharks tagged off Guadalupe Island provide further empirical evidence of the observed pattern of symmetrically distributed route fidelity movements in gravitational coordinates (Figure 6C). For example, every year between 2009 and 2012, white shark 19787 swam a near-identical route from Guadalupe Island to the SOFA (Figure 2B), passing the gL+gB midpoint (ca. 979.47 Gal) of its migration route near the: (1) January, 2009, new moon; (2) January, 2010, full moon; (3) February, 2011, full moon; (4) January, 2012, new moon (Figures 6C,D). Similarly, great white shark 20720 passed the same gL+gB midpoint (ca. 979.47 Gal) within 48 h of both the March new moon and the April new moon during its 2009 and 2011 migrations to the SOFA, respectively (Figures 6C,D).
Fifth, g-Space plots of the near-identical routes followed by four North Pacific northern elephant seals further reinforce the movement patterns described above. All four seals followed g-space trajectories that were highly symmetrical across the gL+gB gravitational mid-point between Año Nuevo and the Aleutian Trench (ca. 981.1 Gal; Figure 6E) despite departing the coast at Año Nuevo State Park at distinctly different positions in the moon illumination cycle. These same g-space trajectories are also highly symmetrical across a mirror plane projected through the 50% moon illumination position in the synodic cycle (Figure 6F), not unlike the pattern present in both the humpback whale and white shark trajectories. These mirror-image g-space trajectories are present due to the fact that all four seals passed the latitude and bed-rock dependent 981.1 Gal position within 6-h of a quarter-moon (Figures 6E,F) despite these movements being separated by as much as 7 years in time.
As part of our analysis of the recurrent pattern of symmetrical g-space trajectories observed in all three species, we tested the gravitational datasets for significant correlations using sinusoidal regression. Like we found for the spherical magnetic coordinate movement trajectories, sinusoidal regression of the gravitational trajectories demonstrates that latitude and bedrock dependent gravity is a strong predictor of the individual route fidelity movements (median = 98%; average = 97%; range = 83–99%; SD = 4.1%; n = 20; Table 2). The highly symmetrical in-phase or antiphase g-space trajectories we report reinforce the strong inter-annual pacing of route fidelity movements with respect to the moon illumination cycle (Figure 6).
Our results demonstrate that the spatially dependent gravitational cue, gL+gB, is a stronger predictor than spherical magnetic coordinates at the individual animal, population, species and inter-species levels (Table 2). This unexpected finding is supported by the facts that: (1) gravity is the strongest predictor of 15 of the 22 route fidelity movements we analyzed, whereas magnetic inclination is only the strongest predictor for 4 of the individual movements (Table 2); (2) gravity is the strongest route fidelity movement predictor for 3 of the 5 marine megafauna populations we studied (Table 2); (3) gravity is the strongest predictor of the route fidelity movements of all three species (Table 2); (4) gravity cues explain 69% of the sinusoidal regression model variance when all of the route fidelity data are concatenated, whereas magnetic inclination only explains 28% of the variance (Table 2; Figure 7).
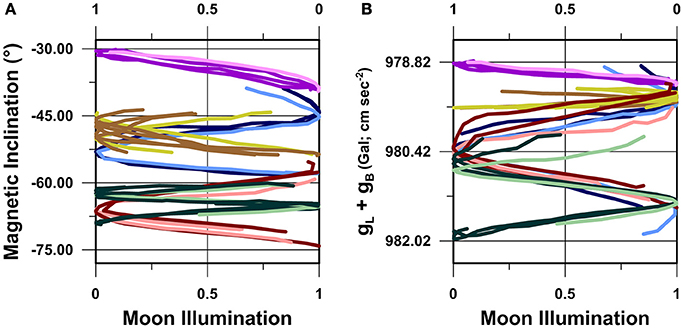
Figure 7. Cross-taxa compilation of route fidelity movement trajectories in (A) magnetic inclination vs. moon illumination, and (B) gL+gB vs. moon illumination, bivariate spatiotemporal coordinate spaces. Lines in (A) colored as in Figure 5. Lines in (B) colored as in Figure 6.
Discussion
Geophysical Navigation
None of the significant correlations we report demonstrate causality between geophysical orientation cues available from the environment and navigational decisions. Such causal relations can only be established by experimental testing under controlled conditions. However, the strong and systematically patterned correlations we report can be used as an empirical data-based platform from which hypotheses can be proposed.
For example, magnetic coordinate projections of an animal's repeated utilization of a well-defined geographic coordinate migration route will describe distinctly different magnetic coordinate trajectories due to changes in Earth's main magnetic field through time. Yet, the opposite scenario is also true. The geographic coordinate paths followed between migratory destinations might instead systematically shift through time in response to magnetic secular variation in situations where magnetic cues are the primary source of orientation information. Thus, the extent to which an individual migrant uses magnetic cues for navigational purposes can be further explored through multi-annual tracking of long-lived individuals. For large and elusive species that are difficult to study under controlled conditions, long-term repeat tracking represents an important opportunity to better understand their navigation at sea.
The widespread deployment of PTT tags on animal migrants facilitates longitudinal studies, and long-term tracking studies are viable for some species (e.g., Berthold et al., 2004; Alerstam et al., 2006). Based on the empirical results presented in the current study, we hypothesize that the magnetic coordinate trajectories followed by individual migrants over multiple migratory cycles will describe overlapping and symmetrically distributed paths when plotted against the moon illumination cycle despite changes in the raw geocentric magnetic coordinate values caused by secular variation of the magnetic field. If true, this hypothesis would provide evidence in support of temporally modulated navigation with respect to Earth's magnetic field. Given the relatively small changes in magnetic field conditions from 1 year to the next, tracking studies that span a decade or more will produce the strongest results.
With respect to gravity, the possibility that animal navigation is informed by cues derived from Earth's spatially and temporally dynamic gravitational field was suggested at least 40 years ago (Larkin and Keeton, 1978). However, the possibility that animal orientation is informed by gravitational cues remains largely untested. The empirical results we present suggest further experiments, like those performed by Blaser et al. (2013, 2014), Fisahn et al. (2015), and Cresci et al. (2017) will improve our understanding of the role, if any, gravity plays in animal orientation. We particularly encourage experimental tests on model organisms (e.g., zebrafish, Danio rerio; honey bees, Apis mellifera; eels, Anguilla spp.) that are sensitive to both magnetic (Kirschvink, 1981; Tesch et al., 1992; Osipova et al., 2016) and gravitational cues (Korall and Martin, 1987; Moorman and Shorr, 2008; Cresci et al., 2017). Integrated analysis of telemetry datasets will further help identify the ways in which geophysical cues are used for navigational purposes.
Long-distance inter-hemispheric migrants are also attractive targets for future studies. The presence or absence of symmetrical magnetic or gravitational coordinate movement trajectories across either of the spatially distinct magnetic or geographic equators has the potential to provide significant insight into how navigation is performed. The variable separation between the magnetic and gravitational equators at different longitudes presents additional opportunities to determine if emergent patterns in magnetic or gravitational trajectories are reproducible between tracks of related species that separately migrate across the Pacific and Atlantic Oceans.
Tests for non-random and reproducibly patterned movement trajectories, such as the symmetrical geometry of the g-space trajectories we report, can also be more deeply explored for a variety of geophysical and astronomical orientation cues in migratory domains with distinctly different cue distributions. For example, animals that migrate through middle latitude positions from higher or lower latitude habitats are particularly attractive due to the eccentric and anomalous geometries of magnetic, gravitational and astronomical cues through both space and time. Specific targets for future research in this area might include comparisons between populations that migrate across the South Atlantic magnetic anomaly vs. other ocean basins (Figures S3–S8).
Our analyses suggest that gravity might play an important role in long-distance animal navigation, either in concert with magnetic cues or in isolation. Confirming and elucidating this role requires integrated experimental testing and animal tracking. We hypothesize that spatially dependent gravity cues, when plotted against temporally dependent gravity cues, such as tidal gravity, will describe reproducible movement trajectories at the individual level. We further hypothesize that similarly reproducible movement trajectories will be less pronounced, if not absent, when the same individual's movements are analyzed with respect to other geophysical and astronomical cue/coordinate systems.
Route Fidelity vs. Non-route Fidelity
Although this study specifically addresses route fidelity movements, it is important to consider whether or not non-route fidelity movements describe geophysical coordinate trajectories that are similar to the route fidelity movement trajectories we report.
Perhaps one of the most unexpected results animal tracking studies have revealed is the extreme diversity in movement trajectories followed by animal migrants when plotted in geographic coordinates (e.g., Block et al., 2011). Few individuals follow the same path. Our research reinforces this observation: of the animals we tracked, we found only 13% (i.e., 15 out of 113 individuals) achieve intra- or inter-individual route fidelity.
However, our dataset may underestimate the prevalence of route fidelity due to the fact that the vast majority of the individuals we tagged were tracked for only one migratory cycle or less. It is also possible that our use of two-dimensional geographic coordinate space projections, when classifying movements as either route fidelity or non-route fidelity, is a flawed approach. Perhaps geographically distinct individual movements become more alike when they are viewed from a different perspective? In an effort to explore this possibility, we compared route-fidelity to non-route fidelity movement projections in geophysical coordinates.
Non-route fidelity humpback whale geophysical coordinate trajectories (Figures S2A,B) have a similar overall sinusoidal shape and pattern as the route fidelity tracks from the same population (Figures 6A,B, 7A,B). These similarities include multiple segments of both magnetic and gravitational coordinate non-route fidelity movement trajectories that overlap the route fidelity movements for extended periods (Figures S2A,B). However, there are also periods, spanning several days of animal movement, during which the non-route fidelity geophysical coordinate trajectories do not overlap the route fidelity trajectories (Figures S2A,B).
The non-route fidelity great white shark trajectories show a similarly ambiguous pattern. These tracks describe largely coincident magnetic and gravitational trajectories during the first-half of the northward movements away from New Zealand for both sharks, yet, distinctly different trajectories in the second-half of the northward movements (Figures S2C,D). Similar variations are also apparent during the southward movement of 55612.13 (Figures S2C,D).
Similarly equivocal patterns are also present in the non-route fidelity northern elephant seal trajectories. In this case, neither of the non-route fidelity tracks overlap the magnetic coordinate route fidelity trajectories (Figure S2E). However, in marked contrast to the magnetic trajectories, both of the non-route fidelity tracks extensively overlap with the gravitational route fidelity trajectories (Figure S2F).
The varying degrees of similarity between non-route fidelity geophysical coordinate trajectories and route fidelity trajectories suggests that the navigational system(s) being utilized are calibrated at the individual level.
To explore this possibility, we normalized both magnetic inclination and gL+gB values to the values present in core areas inhabited by each individual immediately prior to the onset of long-distance movement. For the northern elephant seals, magnetic inclination and gL+gB values were normalized to the values present at Año Nuevo State Park, California, U.S.A. For the South Pacific great white sharks and the South Atlantic humpback whales, magnetic inclination and gL+gB values were normalized to the values present at each individual's last known continental shelf location prior to the onset of open-ocean migration. The South Pacific humpback whale and North Pacific great white shark tracks were not included in this analysis due to uncertainties regarding departure site locations for these individuals.
When compared to site-normalized route fidelity migrations, the site-normalized non-route fidelity geophysical coordinate movement trajectories exhibit several distinctive features (Figures 8–10). First, site-normalized non-route fidelity magnetic inclination trajectories generally do not overlap with route fidelity magnetic inclination trajectories. Second, site-normalized magnetic inclination trajectories exhibit limited symmetry across the 50% moon illumination mirror plane (Figures 8A, 9A, 10A). Third, both site-normalized route fidelity and site-normalized non-route fidelity gravitational coordinate trajectories predominantly plot as either overlapping in-phase or anitphase sinusoids for all three species (Figures 8B, 9B, 10B). Fourth, in comparison to the magnetic inclination trajectories, site-normalized gravitational trajectories exhibit a more pronounced symmetry across both the gL+gB midpoint values in the migratory domain utilized by each species and the 50% moon illumination mirror plane (Figures 8B, 9B, 10B).
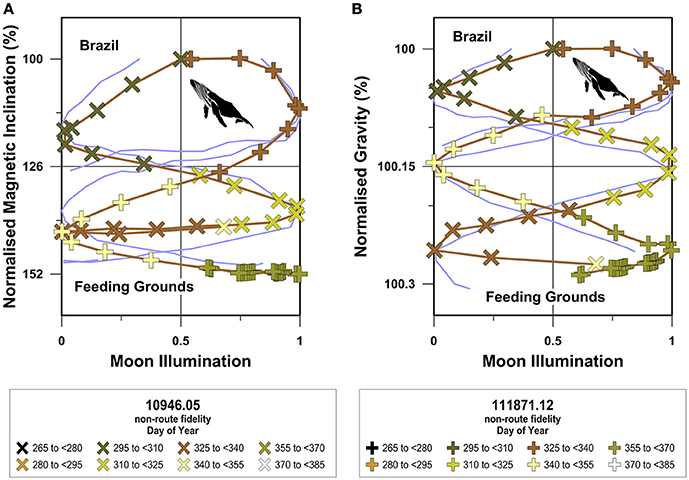
Figure 8. Site-normalized South Atlantic humpback whale magnetic inclination and gravitational trajectories. In this figure geocentric magnetic inclination and latitude and bedrock dependent gL+gB values have been normalized to the values present at the locations inhabited immediately prior to the onset of long-distance open-ocean migration at the individual level. Site-normalized magnetic inclination (A) and gravitational acceleration (B) values are displayed as percentages and are plotted against the moon illumination cycle as in Figures 5–7. Route fidelity movements are shown as light blue lines and non-route fidelity movements are symbolized as indicated in the figure legends. Non-route fidelity track symbol colors correspond with day of the year and exceed 365 days when the tracked movement spanned Julian calendar years.
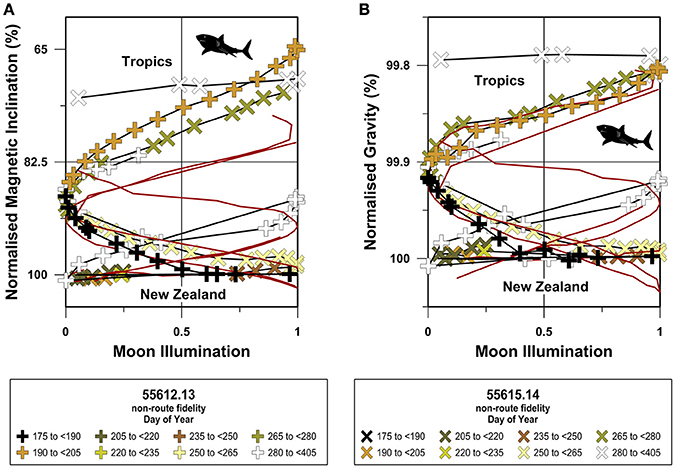
Figure 9. Site-normalized South Pacific great white shark magnetic inclination and gravitational trajectories. In this figure geocentric magnetic inclination and latitude and bedrock dependent gL+gB values have been normalized to the values present at the locations inhabited immediately prior to the onset of long-distance open-ocean migration at the individual level. Site-normalized magnetic inclination (A) and gravitational acceleration (B) values are displayed as percentages and are plotted against the moon illumination cycle as in Figures 5–7. Route fidelity movements are shown as dark red lines and non-route fidelity movements are symbolized as indicated in the figure legends. Non-route fidelity track symbol colors correspond with day of the year and exceed 365 days when the tracked movement spanned Julian calendar years.
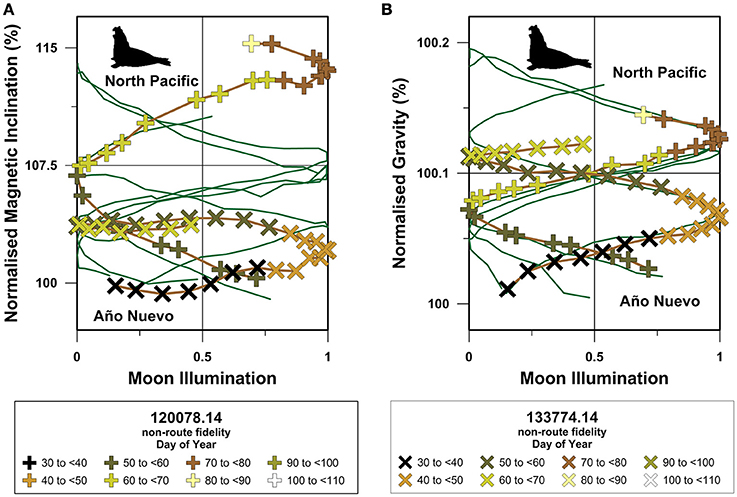
Figure 10. Site-normalized North Pacific northern elephant seal magnetic inclination and gravitational trajectories. In this figure geocentric magnetic inclination and latitude and bedrock dependent gL+gB values have been normalized to the values present at the locations inhabited immediately prior to the onset of long-distance open-ocean migration at the individual level. Site-normalized magnetic inclination (A) and gravitational acceleration (B) values are displayed as percentages and are plotted against the moon illumination cycle as in Figures 5–7. Route fidelity movements are shown as dark green lines and non-route fidelity movements are symbolized as indicated in the figure legends. Non-route fidelity track symbol colors correspond with day of the year and exceed 365 days when the tracked movement spanned Julian calendar years.
The systematic nature of the highly symmetrical site-normalized trajectories shown in Figures 8–10 suggest there is a temporally modulated triggering and/or pacing to long-distance migratory movement behavior. Considering the high specific gravity and extreme crystallographic symmetry of magnetic biominerals, we hypothesize that exogenous magnetic and gravitational cues are integrated components of a spatiotemporal orientation system that is calibrated at the individual level.
Future Directions
Knowledge gaps in our understanding of how animals navigate limit our ability to assess and anticipate the sensitivity of migrating animals to perturbations resulting from environmental change, anthropogenic activities, and predator-prey distribution (Hays et al., 2016). Empirical approaches, such as animal telemetry, can be used to develop and assess data-based models of animal movement, with the strongest models creating opportunities to inform conservation and management decision making with respect to both space and time. At a fundamental level, telemetry studies remain uniquely powerful ways to inform marine conservation through data-based demonstrations of when and where marine megafauna are located across vast expanses of open-ocean (Shillinger et al., 2008; Gredzens et al., 2014; Maxwell et al., 2016; Dawson et al., 2017). Technological advances in animal telemetry, combined with advances in remote sensing (e.g., Figures S3–S8), have created unprecedented opportunities to retrospectively extract and analyse the geophysical and oceanographic conditions experienced by individual migrants during long-distance migration. Integrated analysis of the data produced by satellite telemetry and remote sensing tools strengthens our understanding of movement behavior at the individual scale.
The data and analyses we report provide a platform for future research that specifically targets both the spatial and temporal aspects of long-distance animal migration. The recently proposed “chord and clock” model of animal navigation (Horton et al., 2014) explicitly includes exogenous temporal cues, consistent with the highly correlated movements we report here. The integrated spatiotemporal perspective that defines the “chord and clock” model provides a novel parallel to the widely accepted, yet purely spatial, positional and directional orientation frameworks proposed by Griffin (i.e., Type III “true” navigation; Griffin, 1952) and Kramer (i.e., “map and compass” navigation; Kramer, 1961).
Future research on the biogeophysics of animal navigation will facilitate the development of a mechanistic understanding of how animals find their way. Given the speed at which oceanic environments are currently changing, technologically-driven data-based tests of the observation that geophysical cues are strong predictors of the open-ocean movements of diverse marine megafauna are urgently required.
Ethics Statement
All animal tracking research reported here was carried out in accordance with animal ethics consents given to the authors by their home institutions and/or relevant government agency. Northern elephant seal tracking was performed in accordance with approvals granted by the University of California at Santa Cruz Institutional Animal Care and Use Committee and under National Marine Fisheries Service permits #786-1463 and #87-143. Humpback whale tracking was performed in accordance with approvals granted by the Brazilian Environmental Agency (IBAMA), permit #009/02/CMA/IBAMA and process #02001.000085/02-27 and by the Cook Islands Government, Office of the Prime Minister, to Cook Islands Whale Research. Great white shark tracking was performed in accordance with approvals granted by Secretaria de Medio Ambiente y Recursos Naturales (SEMARNAT), Comision Nacional de Areas Naturales Protegidas (CONANP), and the New Zealand Department of Conservation.
Author Contributions
TH and RH conceived of the study. TH designed the current study, performed the magnetic, gravitational and astronomical analyses, prepared all of the figures and wrote the manuscript. NH, AZ, MF, MD, AA, DC, PR, CD, NN-L, and PC provided the humpback whale, great white shark and northern elephant seal PTT tracking data used in the current study. All authors contributed to the revision of the initial manuscript.
Conflict of Interest Statement
The authors declare that the research was conducted in the absence of any commercial or financial relationships that could be construed as a potential conflict of interest.
Acknowledgments
Shell Brasil funded humpback whale tagging in Brazil. Great white shark tracking in New Zealand was funded by: New Zealand Ministry of Business, Innovation and Employment; New Zealand National Institute of Water and Atmospheric Research; New Zealand Department of Conservation. Northern elephant seal tracking was funded in part by U.S. Office of Naval Research grant N00014-08-1-1195 to DC and conducted under NMFS Permit 14636.
Supplementary Material
The Supplementary Material for this article can be found online at: https://www.frontiersin.org/articles/10.3389/fmars.2017.00422/full#supplementary-material
References
Alerstam, T., Hake, M., and Kjellén, N. (2006). Temporal and spatial patterns of repeated migratory journeys by ospreys. Anim. Behav. 71, 555–566. doi: 10.1016/j.anbehav.2005.05.016
Anderson, S. D., Chapple, T. K., Jorgensen, S. J., Klimley, A. P., and Block, B. A. (2011). Long-term individual identification and site fidelity of white sharks, Carcharodon carcharias, off California using dorsal fins. Mar. Biol. 158, 1233–1237. doi: 10.1007/s00227-011-1643-5
Baird, I. G., Flaherty, M. S., and Phylavanh, B. (2003). Rhythms of the river: lunar phases and migrations of small carps (Cyprinidae) in the Mekong River. Nat. Hist. Bull. Siam Soc. 51, 5–36.
Balmino, G., Vales, N., Bonvalot, S., and Briais, A. (2012). Spherical harmonic modelling to ultra-high degree of Bouguer and isostatic anomalies. J. Geodesy 86, 499–520. doi: 10.1007/s00190-011-0533-4
Berthold, P., Kaatz, M., and Querner, U. (2004). Long-term satellite tracking of white stork (Ciconia ciconia) migration: constancy versus variability. J. Ornithol. 145, 356–359. doi: 10.1007/s10336-004-0049-2
Blaser, N., Guskov, S. I., Entin, V. A., Wolfer, D. P., Kanevskyi, V. A., and Lipp, H. P. (2014). Gravity anomalies without geomagnetic disturbances interfere with pigeon homing–a GPS tracking study. J. Exp. Biol. 217, 4057–4067. doi: 10.1242/jeb.108670
Blaser, N., Guskov, S. I., Meskenaite, V., Kanevskyi, V. A., and Lipp, H. P. (2013). Altered orientation and flight paths of pigeons reared on gravity anomalies: a GPS tracking study. PLoS ONE 8:e77102. doi: 10.1371/journal.pone.0077102
Block, B. A., Jonsen, I. D., Jorgensen, S. J., Winship, A. J., Shaffer, S. A., Bograd, S. J., et al. (2011). Tracking apex marine predator movements in a dynamic ocean. Nature 475, 86–90. doi: 10.1038/nature10082
Bowlin, M. S., Bisson, I. A., Shamoun-Baranes, J., Reichard, J. D., Sapir, N., Marra, P. P., et al. (2010). Grand challenges in migration biology. Integr. Comp. Biol. 50, 261–279. doi: 10.1093/icb/icq013
Cresci, A., Paris, C. B., Durif, C. M., Shema, S., Bjelland, R. M., Skiftesvik, A. B., et al. (2017). Glass eels (Anguilla anguilla) have a magnetic compass linked to the tidal cycle. Sci. Adv. 3:e1602007. doi: 10.1126/sciadv.1602007
Dawson, T. M., Formia, A., Agamboué, P. D., Asseko, G. M., Boussamba, F., Cardiec, F., et al. (2017). Informing marine protected area designation and management for nesting olive ridley sea turtles using satellite tracking. Front. Mar. Sci. 4:312. doi: 10.3389/fmars.2017.00312
DeVries, P., Goetz, F., Fresh, K., and Seiler, D. (2004). Evidence of a lunar gravitation cue on timing of estuarine entry by Pacific salmon smolts. Trans. Am. Fish. Soc. 133, 1379–1395. doi: 10.1577/T03-173.1
Domeier, M. L., Nasby-Lucas, N., and Palacios, D. M. (2012). “The Northeastern Pacific white shark shared offshore foraging area (SOFA): a first examination and description from ship observations and remote sensing,” in Global Perspectives on the Biology And Life History of the White Shark, eds M. L. Domeier (Boca Raton, FL: CRC Press), 147–158.
Erisman, B., Aburto-Oropeza, O., Gonzalez-Abraham, C., Mascare-as-Osorio, I., Moreno-Báez, M., and Hastings, P. A. (2012). Spatio-temporal dynamics of a fish spawning aggregation and its fishery in the Gulf of California. Sci. Rep. 2:284. doi: 10.1038/srep00284
Fisahn, J., Klingelé, E., and Barlow, P. (2015). Lunar gravity affects leaf movement of Arabidopsis thaliana in the international space station. Planta 241, 1509–1518. doi: 10.1007/s00425-015-2280-x
Francis, M. P., Duffy, C. A., Bonfil, R., and Manning, M. J. (2012). “The third dimension: vertical habitat use by white sharks, Carcharodon carcharias, in New Zealand and in oceanic and tropical waters of the Southwest Pacific ocean,” in Global Perspectives on the Biology and Life History of the White Shark, eds M. L. Domeier (Boca Raton, FL: CRC Press), 319–342.
Fraser, P. J. (2006). Depth, navigation and orientation in crabs: angular acceleration, gravity and hydrostatic pressure sensing during path integration. Mar. Freshw. Behav. Physiol. 39, 87–97. doi: 10.1080/10236240600708439
Garrigue, C., Clapham, P. J., Geyer, Y., Kennedy, A. S., and Zerbini, A. N. (2015). Satellite tracking reveals novel migratory patterns and the importance of seamounts for endangered South Pacific humpback whales. R. Soc. Open Sci. 2:150489. doi: 10.1098/rsos.150489
Grau, E. G., Dickhoff, W. W., Nishioka, R. S., Bern, H. A., and Folmar, L. C. (1981). Lunar phasing of the thyroxine surge preparatory to seaward migration of salmonid fish. Science 211, 607–609. doi: 10.1126/science.7455703
Gredzens, C., Marsh, H., Fuentes, M. M., Limpus, C. J., Shimada, T., and Hamann, M. (2014). Satellite tracking of sympatric marine megafauna can inform the biological basis for species co-management. PLoS ONE 9:e98944. doi: 10.1371/journal.pone.0098944
Griffin, D. R. (1952). Bird navigation. Biol. Rev. Camb. Philos. Soc. 27, 359–400. doi: 10.1111/j.1469-185X.1952.tb01509.x
Götze, H.-J. (2014). “International gravity formula,” in Encyclopedia of Solid Earth Geophysics, ed H. K. Gupta (Dordrecht: Springer), 611–612.
Hammer, Ø., Harper, D. A. T., and Ryan, P. D. (2001). PAST: paleontological statistics software package for education and data analysis. Palaeontologia Electronica 4:9.
Hauser, N., Zerbini, A. N., Geyer, Y., Heide-Jørgensen, M. P., and Clapham, P. (2010). Movements of satellite-monitored humpback whales, Megaptera novaeangliae, from the Cook Islands. Mar. Mam. Sci. 26, 679–685. doi: 10.1111/j.1748-7692.2009.00363.x
Hays, G. C., Perreira, L. C., Sequeira, A. M. M., Meekan, M. G., Duarte, C. M., Bailey, H., et al. (2016). Key questions in marine megafauna movement ecology. Trends Ecol. Evol. 31, 463–475. doi: 10.1016/j.tree.2016.02.015
Heide-Jørgensen, M. P., Laidre, K. L., Wigg, Ø., Jensen, M. V., Dueck, L., Schmidt, H. C., et al. (2003). From Greenland to Canada in ten days: tracks of bowhead whales, Balaena mysticetus, across Baffin Bay. Arctic 56, 21–31. doi: 10.14430/arctic599
Heide-Jørgensen, M. P., Nordoey, E. S., Øien, N., Folkow, L. P., Klei- vane, L., Blix, A. S., et al. (2001). Satellite tracking of minke whales (Balaenoptera acutorostrata) off the coast of northern Norway. J. Cetacean Res. Manag. 3, 175–178.
Horton, T. W., Bierregaard, R. O., Zawar-Reza, P., Holdaway, R. N., and Sagar, P. (2014). Juvenile osprey navigation during trans-oceanic migration. PLoS ONE 9:e114557. doi: 10.1371/journal.pone.0114557
Kanevskyi, V. A., Sitnik, K. M., Sheliag-Sosonko, J. P., Melnikov, D. I., Dima, A. G., Busely, B. I., et al. (1985). The use of biotelemetry in remote sensing of geophysical parameters. Rep. Acad. Sci. U.S.S.R. 282, 291–294.
Keeton, W. T. (1979). Avian orientation and navigation. Annu. Rev. Physiol. 41, 353–366. doi: 10.1146/annurev.ph.41.030179.002033
Kirschvink, J. L. (1981). The horizontal magnetic dance of the honeybee is compatible with a single-domain ferromagnetic magnetoreceptor. Biosystems 14, 193–203. doi: 10.1016/0303-2647(81)90068-X
Korall, H., and Martin, H. (1987). Responses of bristle field sensilla in Apis mellifica to geomagnetic and astrophysical fields. J. Comp. Physiol. A. 161, 1–22. doi: 10.1007/BF00609451
Kramer, G. (1961). “Long-distance orientation,” in Biology and Comparative Physiology of Birds, eds A. J. Marshall (London: Academic Press), 341–371.
Larkin, T., and Keeton, W. T. (1978). “An apparent lunar rhythm in the day-to-day variations in initial bearings of homing pigeons,” in Animal Migration, Navigation, and Homing, eds K. Schmidt Koenig (Berlin; Heidelberg: Springer-Verlag), 92–106.
Le Boeuf, B. J., Crocker, D. E., Costa, D. P., Blackwell, S. B., Webb, P. M., and Houser, D. S. (2000). Foraging ecology of northern elephant seals. Ecol. Monogr. 70, 353–382. doi: 10.1890/0012-9615(2000)070[0353:FEONES]2.0.CO;2
Light, P. H., Salmon, M. I., and Lohmann, K. J. (1993). Geomagnetic orientation of loggerhead sea turtles: evidence for an inclination compass. J. Exp. Biol. 182, 1–10.
Lohmann, K., and Lohmann, C. (1994). Detection of magnetic inclination angle by sea turtles: a possible mechanism for determining latitude. J. Exp. Biol. 194, 23–32.
Maus, S. (2010). An ellipsoidal harmonic representation of Earth's lithospheric magnetic field to degree and order 72. Geochem. Geophys. Geosyst. 11, 1–12. doi: 10.1029/2010GC003026
Maxwell, S. M., Conners, M. G., Sisson, N. B., and Dawson, T. M. (2016). Potential benefits and shortcomings of marine protected areas for small seabirds revealed using miniature tags. Front. Mar. Sci. 3:264. doi: 10.3389/fmars.2016.00264
Moorman, S. J., and Shorr, A. Z. (2008). The primary cilium as a gravitational force transducer and a regulator of transcriptional noise. Dev. Dynam. 237, 1955–1959. doi: 10.1002/dvdy.21493
Muggeo, V. M. R. (2008). Segmented: an R package to fit regression models with broken-line relationships. R News 8, 20–25.
Nasby-Lucas, N., and Domeier, M. L. (2012). “Use of photo identification to describe a white shark aggregation at Guadalupe Island, Mexico,” in Global Perspectives on the Biology and Life History of The White Shark, eds M. L. Domeier (Boca Raton, FL: CRC Press), 381–392.
Oliver, G. W., Morris, P. A., Thorson, P. H., and Le Boeuf, B. J. (1998). Homing behavior of juvenile northern elephant seals. Mar. Mamm. Sci. 14, 245–256. doi: 10.1111/j.1748-7692.1998.tb00714.x
Osipova, E. A., Pavlova, V. V., Nepomnyashchikh, V. A., and Krylov, V. V. (2016). Influence of magnetic field on zebrafish activity and orientation in a plus maze. Behav. Process. 122, 80–86. doi: 10.1016/j.beproc.2015.11.009
Pinet, P., Jaeger, A., Cordier, E., Potin, G., and Le Corre, M. (2011). Celestial moderation of tropical seabird behavior. PLoS ONE 6:e27663. doi: 10.1371/journal.pone.0027663
Press, W. H. S. A., Teukolsky, W. T., Vetterling, and Flannery, B. P. (1992). Numerical Recipes in C. New York, NY: Cambridge University Press.
Putman, N. F., Endres, C. S., Lohmann, C. M., and Lohmann, K. J. (2011). Longitude perception and bicoordinate magnetic maps in sea turtles. Curr. Biol. 21, 463–466. doi: 10.1016/j.cub.2011.01.057
Robinson, P. W., Costa, D. P., Crocker, D. E., Gallo-Reynoso, J. P., Champagne, C. D., Fowler, M. A., et al. (2012). Foraging behavior and success of a mesopelagic predator in the northeast Pacific Ocean: insights from a data-rich species, the northern elephant seal. PLoS ONE 7:e36728. doi: 10.1371/journal.pone.0036728
Scargle, J. D. (1982). Studies in astronomical time series analysis II: statistical aspects of spectral analysis of unevenly spaced data. Astrophys. J. 263, 835–853. doi: 10.1086/160554
Schmidt, A. J., Bemvenuti, C. E., and Diele, K. (2012). Effects of geophysical cycles on the rhythm of mass mate searching of a harvested mangrove crab. Anim. Behav. 84, 333–340. doi: 10.1016/j.anbehav.2012.04.023
Shillinger, G. L., Palacios, D. M., Bailey, H., Bograd, S. J., Swithenbank, A. M., Gaspar, P., et al. (2008). Persistent leatherback turtle migrations present opportunities for conservation. PLoS Biol. 6:e171. doi: 10.1371/journal.pbio.0060171
Switzer, P. V. (1993). Site fidelity in predictable and unpredictable habitats. Evol. Ecol. 7, 533–555.doi: 10.1007/BF01237820
Sudo, R., Yamada, Y., Manabe, R., and Tsukamoto, K. (2014). Effect of lunar periodicity on the locomotor activity of silver-stage Japanese eel, Anguilla japonica. J. Ethol. 32, 111–115. doi: 10.1007/s10164-014-0394-4
Tesch, F. -W., Wendt, T., and Karlsson, L. (1992). Influence of geomagnetism on the activity and orientation of the eel, Anguilla anguilla (L.), as evident from laboratory experiments. Ecol. Freshw. Fish 1, 52–60. doi: 10.1111/j.1600-0633.1992.tb00007.x
Tsukamoto, K., Otake, T., Mochioka, N., Lee, T. W., Fricke, H., Inagaki, T., et al. (2003). Seamounts, new moon and eel spawning: the search for the spawning site of the Japanese eel. Environ. Biol. Fishes 66, 221–229. doi: 10.1023/A:1023926705906
Wedekin, L. L., Neves, M. C., Marcondes, M. C., Baracho, C., Rossi-Santos, M. R., Engel, M. H., et al. (2010). Site fidelity and movements of humpback whales (Megaptera novaeangliae) on the Brazilian breeding ground, southwestern Atlantic. Mar. Mamm. Sci. 26, 787–802. doi: 10.1111/j.1748-7692.2010.00387.x
Wiltschko, W., and Wiltschko, R. (1972). Magnetic compass of European robins. Science 176, 62–64. doi: 10.1126/science.176.4030.62
Zerbini, A. N., Andriolo, A., Heide-Jørgensen, M. P., Pizzorno, J. L., Maia, Y. G., VanBlaricom, G. R., et al. (2006). Satellite-monitored movements of humpback whales Megaptera novaeangliae in the Southwest Atlantic Ocean. Mar. Ecol. Prog. Ser. 313, 295–304. doi: 10.3354/meps313295
Zerbini, A. N., Andriolo, A. R., Heide-Jørgensen, M. P., Moreira, S. C., Pizzorno, J. L., Maia, Y. G., et al. (2011). Migration and summer destinations of humpback whales (Megaptera novaeangliae) in the western South Atlantic Ocean. J. Cetacean Res. Manag. 3, 113–118.
Nomenclature
Anomalistic month—the period required for the moon to return to perigee following the preceding perigee (average = 29.6 days)
Apogee (lunar)—the point in its orbit at which the moon is farthest from Earth
Bouguer gravity anomaly (spherical)—location dependent difference in gravitational acceleration between normal gravity and observed gravity caused by variations in the shape and density of Earth (for a more explicit definition, see Balmino et al., 2012)
D (magnetic declination)—location dependent angle in the horizontal plane between Earth's magnetic field and geographic north expressed positive to the east
Declination (lunar)—angle between the moon and the celestial equator
F (magnetic field)—location dependent magnetic field flux density (informally: intensity) of Earth's magnetic field expressed, in Standard International Units, as nanotesla (nT); radial distance coordinate {ρ} in spherical coordinate space {ρ, θ, φ} descriptions of Earth's magnetic field
Gal—unit of gravitational acceleration (1 Gal is equivalent to 1 cm s−2)
gB—spherical Bouguer gravity anomaly
gL—latitude-dependent gravitational acceleration
H (magnetic)—horizontal component of Earth's magnetic field (F)
I (magnetic inclination)—location dependent angle in the vertical plane between Earth's magnetic field and the horizontal (expressed positive downwards)
Perigee—the point in its orbit at which the moon is closest to Earth
PTT—platform transmitting terminal
Sidereal month—the period required for the moon to complete one full orbit relative to a fixed star's position (average = 27.3 days)
SPOT—smart position or temperature transmitting tag
Synodic—the period required for the moon to complete one full illumination/phase cycle (average = 29.5 days)
Tropical month—the period required for the moon to complete one full orbit relative to the ecliptic (average = 27.3 days)
X (magnetic)—geographic north-south component of Earth's magnetic field (F) in the horizontal plane
Y (magnetic)—geographic east-west component of Earth's magnetic field (F) in the horizontal plane
Z (magnetic)—vertical component of Earth's magnetic field (F)
Keywords: navigation, gravity, moon, humpback whale, great white shark, elephant seal, tracking, g-space
Citation: Horton TW, Hauser N, Zerbini AN, Francis MP, Domeier ML, Andriolo A, Costa DP, Robinson PW, Duffy CAJ, Nasby-Lucas N, Holdaway RN and Clapham PJ (2017) Route Fidelity during Marine Megafauna Migration. Front. Mar. Sci. 4:422. doi: 10.3389/fmars.2017.00422
Received: 25 September 2017; Accepted: 11 December 2017;
Published: 21 December 2017.
Edited by:
Lars Bejder, Murdoch University, AustraliaReviewed by:
Phil Bouchet, Centre for Marine Futures, School of Animal Biology, University of Western Australia, AustraliaNuno Queiroz, University of Porto, Portugal
Copyright © 2017 Horton, Hauser, Zerbini, Francis, Domeier, Andriolo, Costa, Robinson, Duffy, Nasby-Lucas, Holdaway and Clapham. This is an open-access article distributed under the terms of the Creative Commons Attribution License (CC BY). The use, distribution or reproduction in other forums is permitted, provided the original author(s) or licensor are credited and that the original publication in this journal is cited, in accordance with accepted academic practice. No use, distribution or reproduction is permitted which does not comply with these terms.
*Correspondence: Travis W. Horton, travis.horton@canterbury.ac.nz