Thermal Imaging and Biometrical Thermography of Humpback Whales
 Travis W. Horton1*
  Alice Oline2
  Nan Hauser3 Tasnuva Ming Khan4
  Amelie Laute3 Alyssa Stoller3 Katherine Tison3 Peyman Zawar-Reza5
- 1Department of Geological Sciences, University of Canterbury, Christchurch, New Zealand
- 2Environment Program, Colorado College, Colorado Springs, CO, United States
- 3Center for Cetacean Research and Conservation, Rarotonga, Cook Islands
- 4Cornell University, Ithaca, NY, United States
- 5Department of Geography, University of Canterbury, Christchurch, New Zealand
Determining species' distributions through time and space remains a primary challenge in cetacean science and conservation. For example, many whales migrate thousands of kilometers every year between remote seasonal habitats along migratory corridors that cross major shipping lanes and intensively harvested fisheries, creating a dynamic spatial and temporal context that conservation decisions must take into account. Technological advances enabling automated whale detection have the potential to dramatically improve our knowledge of when and where whales are located, presenting opportunities to help minimize adverse human-whale interactions. Using thermographic data we show that near-horizontal (i.e., high zenith angle) infrared images of humpback whale (Megaptera novaeangliae) blows, dorsal fins, flukes and rostrums record similar magnitude brightness temperature anomalies relative to the adjacent ocean surface. Our results demonstrate that these anomalies are similar in both low latitude and high latitude environments despite a ~16°C difference in ocean surface temperature between study areas. We show that these similarities occur in both environments due to emissivity effects associated with oblique target imaging, rather than differences in cetacean thermoregulation. The consistent and reproducible brightness temperature anomalies we report provide important quantitative constraints that will help facilitate the development of transient temperature anomaly detection algorithms in diverse marine environments. Thermographic videography coupled with laser range finding further enables calculation of whale blow velocity, demonstrating that biometrical measurements are possible for near-horizontal datasets that otherwise suffer from emissivity effects. The thermographic research we present creates a platform for the delivery of three important contributions to cetacean conservation: (1) non-invasive species-level identifications based on whale blow shapes and velocities recorded by infrared videography; (2) reduced ship-strike rates through automated thermographic cetacean detection systems deployed in high traffic areas; (3) monitoring the spatial and temporal distributions of endangered animals in remote habitats.
Introduction
Since the International Whaling Commission (IWC) banned commercial whaling in 1986, many baleen whale species have shown signs of recovery (Thomas et al., 2016). However, all species listed as Least Concern under the International Union for Conservation of Nature and Natural Resources (IUCN) Red List of Threatened Species framework also include threatened subpopulations classified as Vulnerable, Endangered, or Critically Endangered (Thomas et al., 2016). The conservation status, recovery and health of whale populations is very much site and context specific: modern human threats to whales, including ship strikes and entanglement in fishing gear, are not evenly distributed with respect to both space and time (Thomas et al., 2016).
Despite the spatially and temporally dynamic challenges associated with cetacean conservation and protection in the post-whaling era, progress has been made. For example, revisions to shipping lane positions, vessel traffic management plans and mandatory maximum vessel speeds along the eastern coast of North America correlate with significant reductions in North Atlantic right whale (Eubalaena glacialis) deaths due to ship strikes (Laist et al., 2014; Thomas et al., 2016). However, the risks associated with ship strikes remain high elsewhere. Necropsies performed on stranded whales demonstrate that at least one humpback whale (Megaptera novaeangliae), one fin whale (Balaenoptera physalus), and two blue whales (Balaenoptera musculus) are killed by ship strikes off the California coast every year (Redfern et al., 2013). Similar analyses suggest that, on average, one Bryde's whale (Balaenoptera edeni) is killed every year by ship strikes in New Zealand's Hauraki Gulf (Constantine et al., 2015). True cetacean mortality rates due to human activities at sea are almost certainly higher (Kraus, 1990), however, and the annual loss of even a single individual can be significant for smaller populations of long-lived species with low recruitment rates (Laist et al., 2001).
In an effort to reduce the risks ships pose to large whales, the IWC has developed a 3-year (2017–2020) Strategic Plan that seeks to increase the development and use of whale avoidance technologies (Cates et al., 2017). Acoustic and infrared automated cetacean detection systems are attractive and emerging tools for enhanced cetacean conservation (Zitterbart et al., 2013; Nowacek et al., 2016). The ability to detect whale blows, as far away as 5 km using around-the-clock 360° infrared scanners outfitted with rigorous detection algorithms (Zitterbart et al., 2013), will benefit many, including marine mammal observers onboard large vessels and land-based scientists studying whale movement behavior (e.g., Perryman et al., 1999) and human-whale interactions along rapidly changing coastlines (e.g., Graber, 2011). Infrared thermography can also facilitate the non-invasive collection and monitoring of fundamental biometrical information, including thermal physiology, injury diagnoses and population surveys (McCafferty, 2007).
Infrared cetacean detection systems also create opportunities for conservation biologists and cetacean ecologists to document the spatial and temporal distribution of animals utilizing remote or inaccessible environments. For example, the Oceania subpopulation of humpback whales, the only migratory humpback whales in danger of going extinct (Childerhouse et al., 2008), seasonally inhabit ~10 million km2 of the tropical South Pacific Ocean. Yet, only a handful of scientists, spread across an area of ocean the size of China, actively study these whales. Automated detection systems have the potential to dramatically improve our knowledge of when and where these endangered whales are utilizing highly understudied breeding/calving ground habitats.
However, thermal imaging also has several important limitations. Infrared imaging systems are not inexpensive, particularly so for current high sensitivity models with cryogenically cooled detectors or large focal lengths capable of long-range applications. Infrared detectors also require a direct line of site to the target, yet they can also lose functionality through interaction with sea-spray. The data streams generated by infrared imaging systems are large, creating challenges with data handling, analysis and signal processing. Thermal cameras are also highly inaccurate when imaging scenes from near-horizontal positions due to emissivity effects (Masuda et al., 1988; Cuyler et al., 1992; see Nomenclature).
The effects of emissivity on the brightness temperatures recorded by a thermal imaging device are extremely relevant to cetacean thermography. For example, as a whale exhales, its breath pushes sea water present in the near-surface water column, or nasal depression, or both, into the overlying atmosphere. From observation points at or near sea-level, this spouting of water droplets immediately and drastically changes the angle at which the whale's blow is being measured by the thermal camera. For example, a 2 m high whale blow will be measured perpendicularly (i.e., measured at a 0° zenith angle) from an observation point located 100 m distant and 2 m above sea level. In contrast, the adjacent flat ocean's surface will be measured sub-horizontally at an 89° zenith angle. Similar to blows, emergent dorsal fins, flukes or rostrums will also be measured at a relatively low zenith angles in relation to the adjacent ocean's surface. These rapid changes in the angle at which the object is being imaged will have large effects on the surface brightness temperatures estimated by the thermal imaging device due to the effect zenith angle of observed radiation has on sea water emissivity (Masuda et al., 1988).
The research we present was driven by three primary objectives, all aligned to the IWC's strategic goal of developing large whale avoidance technologies. We sought to: (1) quantify infrared image brightness temperature and brightness temperature anomaly (BTA) values for humpback whale blows, dorsal fins, flukes, and rostrums in both tropical breeding/calving ground and sub-polar feeding ground habitats; (2) calculate humpback whale blow height and blow velocity through coupling of infrared videography with laser-range finding; (3) evaluate the effects of emissivity on thermal imaging data collected from high zenith angle (i.e., oblique to target) positions. Achievement of these objectives creates a platform from which a variety of cetacean conservation tools can be further developed and delivered.
Methods
Thermal images of humpback whale surfacing features were collected using a Forward Looking Infrared camera (FLIR A615, FLIR Systems, Inc.,) and analyzed using FLIR Tools+ software (FLIR Systems, Inc.,). The FLIR A615 we used had a focal length of 24.6 mm, 25° × 19° field of view, F-number of 1.0, infrared resolution of 480 × 640 pixels and a detector pixel pitch of 0.017 mm pixel−1. The camera's detector comprised an uncooled Vanadium Oxide (VoX) long–wavelength (i.e., 7.5–14 μm) microbolometer (see Nomenclature) with a thermal sensitivity of <0.05°C. Infrared images were captured every 0.04 s (i.e., 25 Hz) but frame rates as high as 200 Hz can be achieved with the A615's high-speed windowing option. The A615 was powered by a small 12-volt battery externally strapped to the camera's casing. The A615 was also connected to a FZ-G1 ToughPad tablet computer (Panasonic Corporation) via a high-speed USB cable. A GoPro Hero4 camera (GoPro, Inc.,) was affixed to the top of the A615 for contemporaneous visible wavelength image collection. This study was carried out in accordance with the recommendations of the Cook Islands Government. The protocol was approved by the Office of the Prime Minister, Cook Islands Government.
In Rarotonga, infrared and visible wavelength images were collected either ~2 m above the ocean surface while onboard a Cook Islands Whale Research vessel, or from shore-based positions ~5–10 m above sea level on the island's northwest coast (Figure 1). In Sitka Sound, all images were recorded ~4 m above the ocean surface while onboard a commercial whale watching cruise arranged by the Sitka Sound Science Center as part of the annual Sitka Whale Fest (e.g., Figures 1D,E). Despite these variable imaging heights, our entire dataset was collected at >85° zenith angles (i.e., <5° off horizontal) due to the range in distances at which whales were imaged. A Nikon Forestry Pro laser rangefinder was used to determine whale distances whenever possible. All measurements were made during Beaufort wind force scale numbers 2–4 and similarly ranked World Meteorological Organization (WMO) Sea State codes.
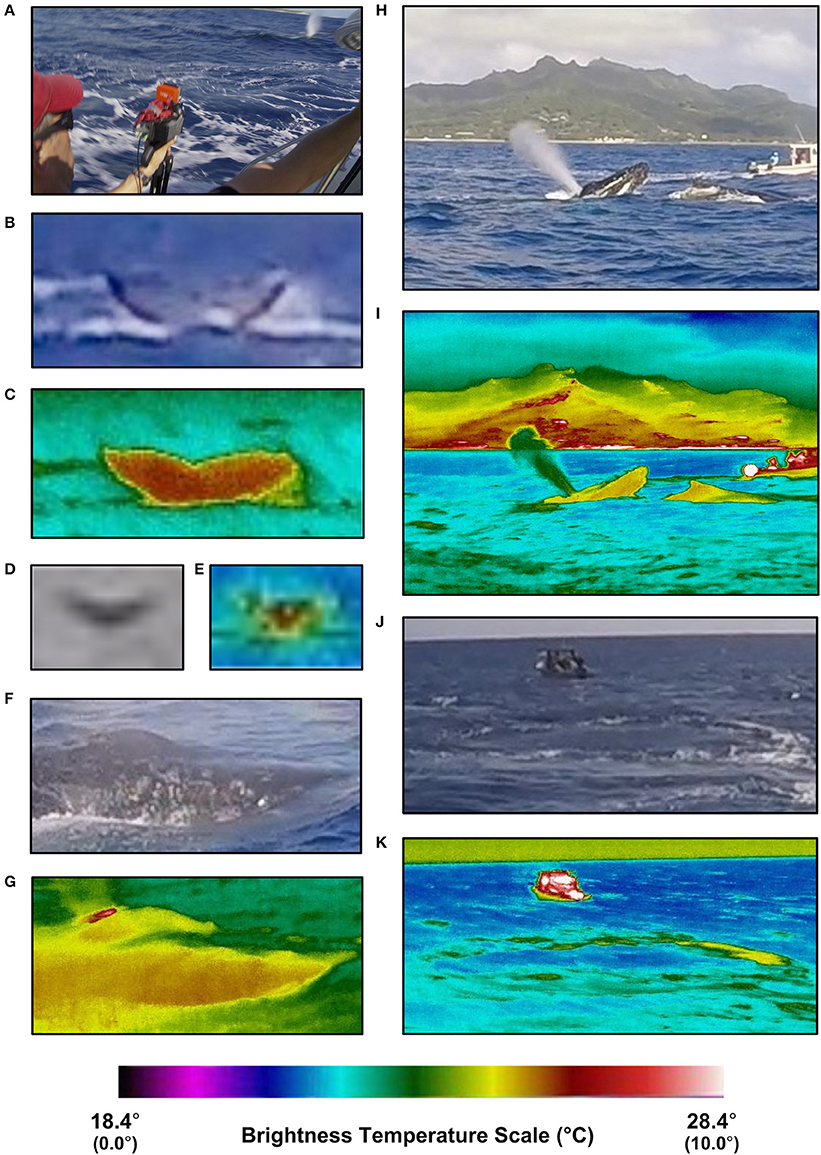
Figure 1. Visible and infrared spectrum images of various humpback whale surfacing features. Visible and thermal camera set-up (A); visible (B) and infrared (C) images of a fluke at 100 m distance in tropical waters; visible (D) and infrared (E) images of a fluke at ~350 m distance in sub-polar waters; visible (F) and infrared (G) images of a nostril and adjacent rostrum at ~10 m distance in tropical waters; visible (H) and infrared (I) images of a blow, rostrum and dorsal fin at 40 m distance in tropical waters; visible (J) and infrared (K) images of a footprint at ~30 m distance and 50 s following fluke in tropical waters. Temperature scale numbers in parentheses (i.e., 0°–10°C) correspond with sub-polar thermal image brightness temperatures shown in (E).
Brightness temperatures were extracted from individual thermal images using the line measurement tool available in FLIR Tools+. Two lines for temperature data extraction were drawn across each image: the first line was drawn vertically through the background scene immediately adjacent to the targeted whale feature (i.e., blow, dorsal fin, fluke, rostrum, Figure 1), and the second line was drawn vertically such that it passed through the maximum brightness temperature included within the targeted whale feature. Thermal benchmarks included within each image, such as the steep thermal gradient across the ocean–atmosphere boundary, were used to align the pixels included in each line's thermal profile (Figure 2). Once aligned, the brightness temperatures recorded by each line were subtracted from each other in order to calculate BTA-values at the individual pixel scale for each whale feature analyzed (Figure 2).
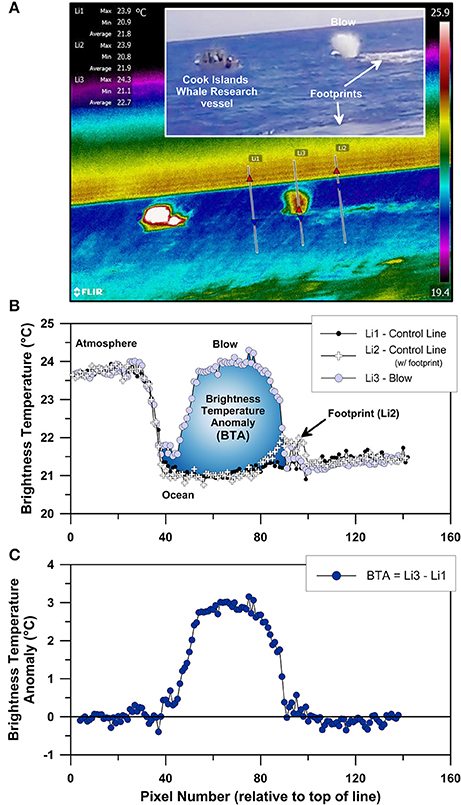
Figure 2. FLIR Tools+ thermographic image of Rarotonga blow #63 (i.e., RB63) recorded at a distance of 87 m using a FLIR A615 infrared camera (A), including two brightness temperature extraction control lines (Li1 and Li2 in A) drawn adjacent to the targeted blow for brightness temperature extraction along the third line (Li3 in A). (B) displays the raw brightness temperature profiles recorded by the A615 camera for all three lines shown in (A), and (C) displays the brightness temperature anomaly of the blow (Li3) relative to background brightness temperatures (Li1). Inset panel in (A) shows a portion of the same scene as recorded by a visible wavelength GoPro Hero4 camera attached to the top of the A615 thermal camera. Prominent features of both the infrared and visible wavelength images are labeled for reference.
Because the A615's pixel pitch and focal length were known, independent measurement of whale distances by laser range-finding allowed us to estimate blow height from thermal image pixel measurements by combining the optical lens equation,
with the magnification equation,
and the camera's pixel pitch,
Equation (1) can be rearranged to,
Equation (2) can be arranged to,
and equation (3) can be rearranged to,
Substituting equations (4) and (6) into equation (5) gives,
which simplifies to,
Blow heights were estimated using Equation (8) every 0.04 s following blow initiation. Image pixel heights were measured using FLIR Tools+ and blow distances were measured by laser range-finding as described above.
Results
In total, we determined BTA profiles for 174 humpback whale blows, 20 dorsal fins, 9 flukes, and 20 rostrums. An equivalent number of whale features were analyzed from each of the two study areas, with the exception of flukes, for which 6 were imaged in Alaska and only 3 were imaged in Rarotonga. Of the 87 blows analyzed in each study area, 32 Rarotonga blows and 16 Alaska blows were imaged at distances <150 m. Of these, only 10 blows from each study area were recorded in the 100–150 m range.
Average BTA profiles demonstrate that humpback whale blows, dorsal fins, flukes and rostrums appear as thermal anomalies of similar magnitude relative to adjacent ocean water (Figure 3). For example, 100–150 m distant blows in Rarotonga and Alaska appear as 20–30 pixel-wide thermal anomalies that are ~3°C warmer than the adjacent ocean (Figure 3A). Similarly, dorsal fins and flukes in both areas exhibited maximum BTA values ca. 3–4°C (Figures 3B,C), whereas rostrums from both populations were ~2–3°C warmer than the adjacent ocean (Figure 3D). Ocean water temperatures were measured by perpendicular thermography and satellite observations in both study areas. These measurements indicate surface ocean water temperature was ~24°C in Rarotonga, and ~8°C in Sitka Sound, Alaska, at the time thermal images were recorded.
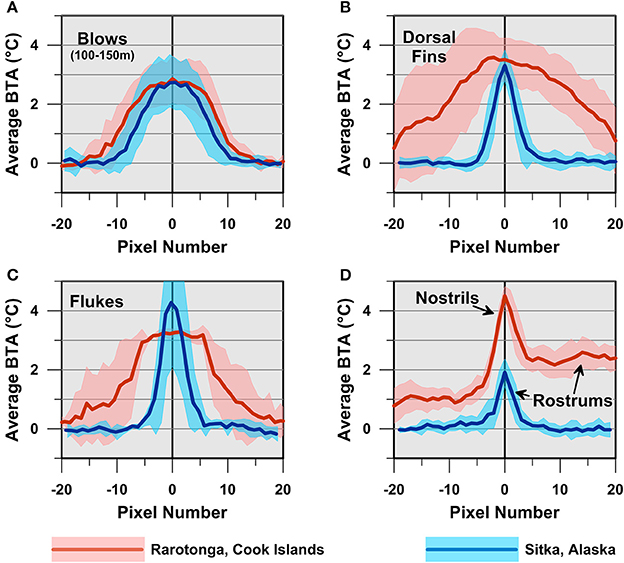
Figure 3. Thermographic profiles of emergent humpback whale blows and body parts in both tropical (Rarotonga, Cook Islands) and sub-polar (Sitka Sound, Alaska, U.S.A.) waters. Each plot presents the average brightness temperature difference relative to background ocean water brightness temperatures for blows (A), dorsal fins (B), flukes (C), nostrils and rostrums (D). Only rostrums were imaged in Alaska, whereas both nostrils and adjacent rostrums were imaged in Rarotonga. Ten individual profiles from each of the study areas were used to construct the average brightness temperature anomaly (BTA) profiles shown, with the exception of flukes, where only 6 fluke profiles were recorded in Alaska and 3 fluke profiles in Rarotonga. Shaded regions correspond with ± 1 SD brightness temperature variation. Individual profiles were aligned such that the image pixel with the largest brightness temperature difference relative to seawater was assigned pixel number zero. Negative pixel numbers correspond with pixels that are skyward of the maximum brightness temperature difference pixel. Positive pixel numbers correspond with pixels that are seaward of the maximum brightness temperature difference pixel. The parabolic shape of each average profile reflects the fact that the individual datasets used to determine the average profiles shown were imaged at different distances with correspondingly different image pixel widths/lengths. For example, because the Rarotonga rostrums were imaged at closer range than the Sitka rostrums, the Rarotonga rostrums span a much larger number of pixels and include positive thermal anomalies across the nostrils that were not captured in any of the Sitka images (D).
The shapes of the average dorsal fin, fluke and rostrum BTA profiles differ because these features were recorded across a large range of distances in each study area. Because the Rarotonga whales were generally imaged at closer ranges, the dorsal fin, fluke and rostrum BTA profiles are spread across a larger number of image pixels than the Sitka BTA profiles (Figures 3B,D). In other words, the Rarotonga whale features fill a larger portion of the 640 × 480 pixel thermal images because these images were recorded at closer distances. Despite these distance-related differences in BTA profile shape between the study areas, the maximum BTA values for humpback whale blows, dorsal fins, flukes and rostrums (indicated by arrows in Figure 3D) we recorded are not significantly different (p >> 0.05, two-tailed t-test, Figure 3).
Laser range-finding enabled quantification of the relationship between the pixel-length of individual blows and blow distance for the FLIR A615. As expected, blow pixel-lengths are larger for images recorded at closer range, and blow pixel-length decreases with blow distance according to an inverse power relationship (Figure 4). Although blows imaged at <200 m range were easily recognizable with the A615 (Figures 4A,B,D), a blow imaged at ~400 m range appeared as an 8 pixel tall ~0.4° C BTA (Figure 4E). Higher sensitivity cooled detector thermal imaging devices and/or devices with longer focal lengths would no doubt extend the range at which whale blows might be detectable (e.g., Zitterbart et al., 2013). However, these larger systems are currently much more expensive and less maneuverable than the FLIR A615 we used here.
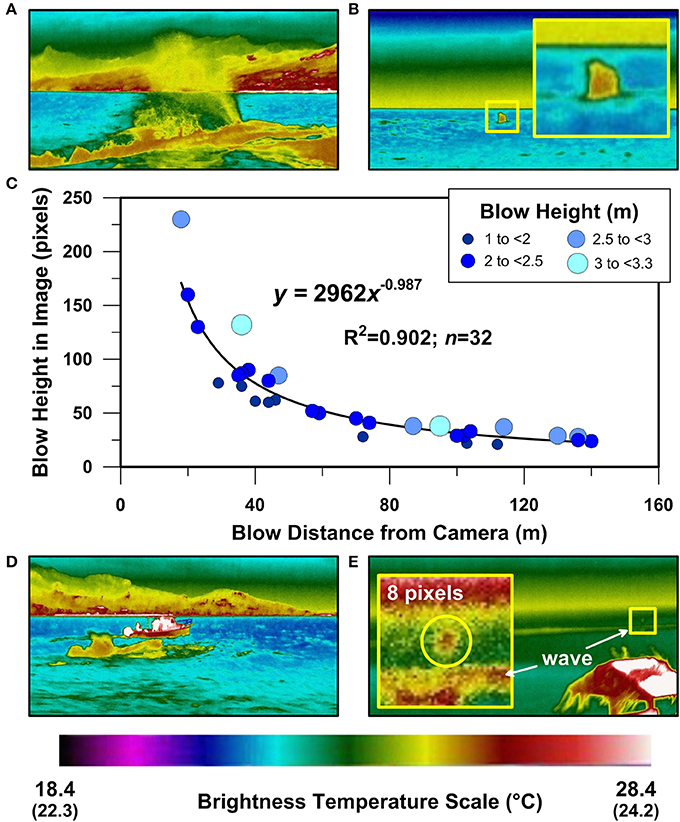
Figure 4. Rarotonga humpback whale blow thermography at different distances. Infrared thermographic images of humpback whale blows 0.4 s after blow initiation for whales at 18 m (A), 136 m (B), 44 m (D), ~400 m (E). (C) displays the relationship between blow pixel length as determined from individual thermographic images and blow distance as measured using a laser rangefinder in the field. Each blow has been symbolized according to its estimated blow height at 0.4 s after blow initiation as indicated in the legend. Inset panel in (B) displays a magnified perspective of a humpback whale blow imaged from a distance of 137 m. Inset panel in (E) displays a magnified perspective of an 8 pixel high blow imaged at dusk from a distance of ~400 m at Tuoro/Black Rock on the northwest coast of Rarotonga. Temperature scale numbers in parentheses (i.e., 22.3°–24.2°C) correspond with the thermal image brightness temperatures shown in the magnified inset panel in (E).
Regardless of the device used or its imaging range, whale blow heights will also vary in response to a number of uncontrollable factors, including: wind shear, the volume of sea water in the nasal depression at exhalation, and the whale's position relative to the ocean surface at which exhalation is initiated. In an effort to partially overcome these complicating factors, we calculated blow heights 0.4 s after blow initiation, the minimum observed period for a blow to achieve its maximum height, for 32 humpback whale blows across an 18–140 m range in distances (mean = 71 ± 38 m, ± SD, Figure 4). The pixel height (range = 24–230 pixels, mean = 63 pixels ± 46 pixels, ± SD, Figure 4) of each imaged and laser ranged blow was measured using FLIR Tools+. Estimated blow heights at 0.4 s ranged between 1.0 and 3.3 m (mean = 2.2 ± 0.5 m, ± SD, n = 32). In addition to wind, water volume, and whale position, blow heights are also likely to vary with the volume of air being expelled in a specific exhalation. Although untested, focal follows incorporating thermal imaging techniques have the potential to reveal the breathing behaviors of individual whales of different size, maturity, sex and physiological condition.
Utilization of the 25 frames per second videography option enabled us to also estimate humpback whale blow velocity (Figure 5). All blows analyzed reached maximum blow height in <1.2 s and the maximum blow height measured was 4.7 m at 0.8 s following blow initiation equating to a 21 km h−1 velocity for this blow (Figures 5G,J,K). Notably, some blows were unambiguously initiated while the nostrils/blowholes were still submerged. Blows of this type exhibited a relatively slow initial acceleration (e.g., Figures 5G–I) as the exhaled air pushed into the overlying water column. Individual blows exhibited maximum blow velocities that ranged between 40 and 55 km h−1 (mean = 13–23 km h−1 ± 12–18 km h−1, ±SD). Maximum blow heights ranged between 2.7 and 4.7 m and occurred 0.76–1.16 s following blow initiation. At 0.4 s following exhalation initiation, the humpback whale blows we recorded were 1.4–3.3 m tall. It is important to acknowledge that these estimates are derived from the thermal anomalies associated with water droplets that are blasted out of the ocean's surface or nasal depression by exhaled air. Thus, the velocities we calculated must be considered minimum estimates of the true gaseous exhalation velocities achieved by humpback whales.
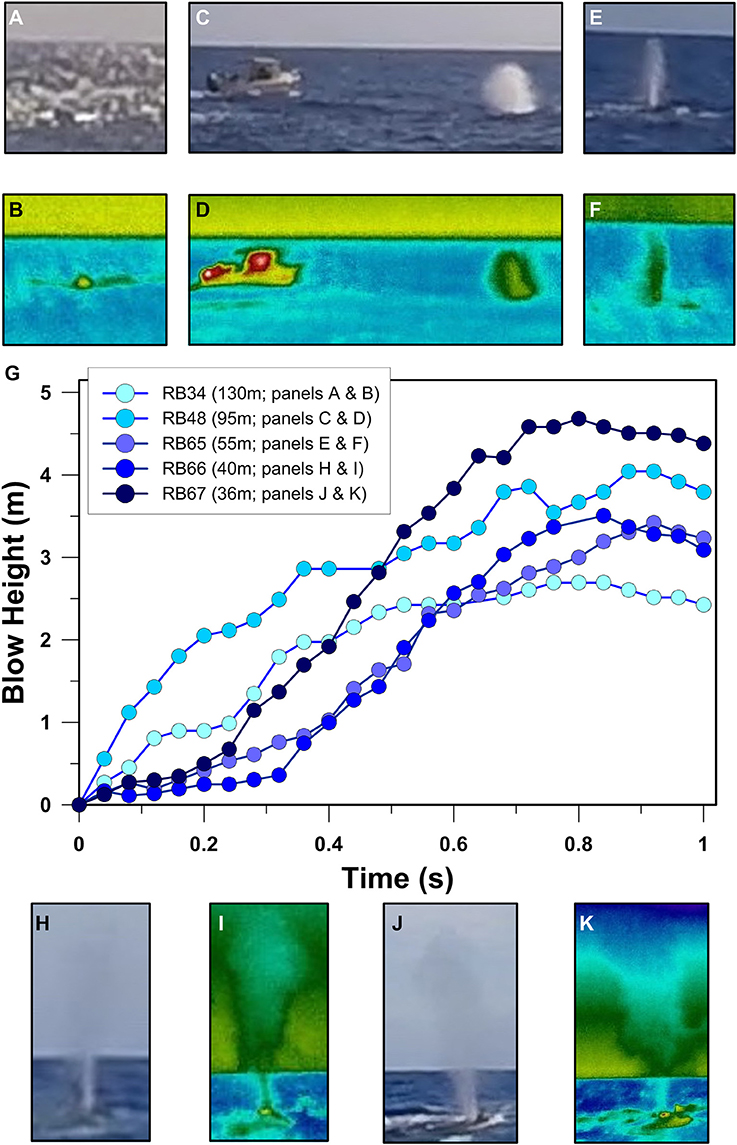
Figure 5. Humpback whale blow evolution through time. Visible (A) and infrared (B) images of whale blow RB34 0.16 s after blow initiation at a distance of 130 m. Visible (C)and infrared (D) images of whale blow RB48 0.36 s after blow initiation at a distance of 95 m. Visible (E) and infrared (F) images of whale blow RB65 0.48 s after blow initiation at a distance of 55 m. Visible (H) and infrared (I) images of whale blow RB66 0.64 s after blow initiation at a distance of 40 m. Visible (J) and infrared (K) images of whale blow RB67 0.80 s after blow initiation at a distance of 36 m. (G) displays blow height vs. time (i.e., velocity profiles) for the blows indicated in the legend.
Our results demonstrate that humpback whale blows, dorsal fins, flukes and rostrums present as similar magnitude brightness temperature anomalies (BTA) in both tropical (Rarotonga, Cook Islands) and sub-polar (Sitka Sound, Alaska, U.S.A.) environments despite an ~16°C difference in ocean surface temperature between the two study areas. This occurs due to emissivity effects associated with the oblique near-horizontal imaging angles used in the current study. Thus, absolute temperatures determined from oblique (i.e., sub-parallel to target) measurement angles do not represent accurate quantifications of whale blow or skin temperatures. Our results also demonstrate how to calculate blow heights and blow velocities by combining target BTA pixel size with target distance as measured by a laser range finder. Although blow acceleration varied both within and between individual blows, our results indicate that humpback whale blows have average instantaneous velocities of ~4.6 m s−1.
Discussion
The infrared radiation emitted by a surface is a function of both the surface's temperature and its spectral emissivity (see Nomenclature). Thermal imaging systems estimate surface temperatures by assigning emissivity values to the imaged scene. However, sea surface emissivity, the ratio of the energy radiated from the ocean's surface relative to a blackbody, further depends on the ocean's surface roughness, refractive index, and the zenith angle from which the surface is being observed (Masuda et al., 1988). Thus, quantitative analyses and accurate interpretations of thermographic datasets collected at sea depend on a large number of variables.
Of these variables, the angle from which the surface is being observed has the largest effect on emissivity and, as a consequence, thermographic temperature estimates (Masuda et al., 1988). For example, the emissivity of perfectly planar sea water at a 0° zenith angle (i.e., perpendicular to the sea surface) is ~0.98 (Masuda et al., 1988). At a 60° zenith angle this same surface will have an emissivity of ~0.92 and at 85° (i.e., 5° above the horizontal) the emissivity drops to ~0.36 (Masuda et al., 1988). Using human targets included in our thermographic image dataset, we found that a decrease in surface emissivity of 0.98–0.36 resulted in a 12.2°C increase in the human skin surface temperature reported by the camera. Similar tests on 25°C ocean water revealed that a similar magnitude change in emissivity resulted in a 3.5°C change in sea surface temperature at ~100 m distance. As suggested by Cuyler et al. (1992), our findings confirm it is inappropriate to assume relatively high emissivity values (i.e., >0.95) in thermographic cetacean research when imaging is performed at high zenith angles.
Thus, the data we report suffers from extreme emissivity effects due to the fact that our thermal images were collected at sub-horizontal observation angles (i.e., zenith angles of ~85°–89°). However, the A615 infrared camera we used includes a high sensitivity microbolometer (<0.05°C); thus, the brightness temperature measurements we report can be considered precise but not accurate. Although the loss of thermographic accuracy due to emissivity effects associated with oblique-angle imaging is problematic for biometrical estimates of cetacean thermoregulation, it is a benefit to cetacean detection.
Brightness temperature anomalies of ~2–4°C, like those we report for humpback whale blows, dorsal fins, flukes and rostrums (Figure 3), are the consequence of rapid changes in emissivity as the whale feature emerges from the ocean's surface and immediately changes the observation point zenith angle. However, the higher BTA values we report for humpback whale nostrils (ca. 4.5°C, Figure 3D) likely reflect a more accurate approximation of humpback whale skin temperatures due to the closer range at which nostrils were imaged (i.e., at lower zenith angle) and the observed ~2°C difference between nostril/blowhole temperatures and adjacent (wet) rostrums (Figure 2D). The potential utility of thermographic imaging of cetacean nostrils/blowholes for biometrical research purposes should be more deeply explored using aerial drones mounted with high resolution and high frame-rate thermal imaging systems.
One of the primary challenges in cetacean ecology and conservation is determining when and where whales are located. Although our results do not include accurate determinations of whale surface temperatures, they conclusively demonstrate that whale blows and emergent body parts appear as similar magnitude thermal anomalies, ca. 2–4°C, relative to surface waters in both tropical and sub-polar environments at distance ranging between 100 and 150 m. These thermal anomalies are largely due to emissivity effects associated with thermographic imaging from sub-horizontal positions. Thus, our findings represent an important quantification of the magnitude of the thermal signal from which thermographic cetacean detection algorithms can be developed and refined.
Quantitative constraints on the magnitude, size and duration of whale-derived thermal anomalies can also be used to help restrict the number of false positives and false negatives produced by automated cetacean detection systems that use transient thermal contrast algorithms based on average brightness temperatures (e.g., Zitterbart et al., 2013). Improving automated detection systems in this way should assist applications in windy conditions or large swells, when ocean surface roughness has the potential to produce thermal anomalies of similar magnitude as whale blows due to emissivity effects (e.g., Figure 4E). Differentiating cetacean induced anomalies from non-cetacean induced anomalies will also benefit from quantifications of thermal anomaly shapes and their evolution through time. For example, our results demonstrate that the water spouts produced by humpback whale exhalations move at ~4.6 m s−1 and accelerate at ~100–300 m s−2. Such biometrical measurements not only provide additional quantifications for the development of automated cetacean detection systems, but also create a platform for species-level identifications using measurable differences in blow geometry and velocity.
Author Contributions
TH and PZ-R conceived of the study. All authors contributed to the fieldwork and infrared imaging in Rarotonga, Cook Islands. TH performed the fieldwork and infrared imaging in Sitka Sound, Alaska, U.S.A. TH and AO performed all of the thermographic image processing and analysis. TH and AO wrote the initial manuscript and all authors contributed to the revision of the manuscript.
Conflict of Interest Statement
The authors declare that the research was conducted in the absence of any commercial or financial relationships that could be construed as a potential conflict of interest.
Acknowledgments
This research was supported by the Center for Cetacean Research and Conservation, Cook Islands Whale Research and the Frontiers Abroad programme through generous provision of research vessel access, and travel and accommodation costs. All authors thank the local fishermen, especially the great people at Akura Fishing Charters, for their kind assistance in helping us locate humpback whales offshore of Rarotonga. TH thanks the Sitka Sound Science Center for its kind invitation to present at the 20th Sitka Whale Fest: Whales Through Time and providing an opportunity to record thermal images of the beautiful whales residing in Sitka Sound, Alaska.
References
Cates, K., DeMaster, D. P., Brownell, R. L. J.r., Silber, G., Gende, S., Leaper, R., et al. (2017). Strategic Plan to Mitigate the Impacts of Ship Strikes on Cetacean Populations: 2017-2020. International Whaling Commission. Available online at: https://iwc.int/private/downloads/dr1UJzeCuNpAWs9Xf9caBw/IWC_Strategic_Plan_on_Ship_Strikes_Working_Group_FINAL.pdf
Childerhouse, S., Jackson, J., Baker, C. S., Gales, N., Clapham, P. J., and Brownell, R. L. Jr. (2008). Megaptera novaeangliae (Oceania subpopulation). The IUCN Red List of Threatened Species 2008: e.T132832A3463914.
Constantine, R., Johnson, M., Riekkola, L., Jervis, S., Kozmian-Ledward, L., Dennis, T., et al. (2015). Mitigation of vessel-strike mortality of endangered Bryde's whales in the Hauraki Gulf, New Zealand. Biol. Conserv. 186, 149–157. doi: 10.1016/j.biocon.2015.03.008
Cuyler, L. C., Wiulsrød, R., and Øritsland, N. A. (1992). Thermal infrared radiation from free living whales. Mar. Mamm. Sci. 8, 120–134. doi: 10.1111/j.1748-7692.1992.tb00371.x
Graber, J. (2011). Land-Based Infrared Imagery for Marine Mammal Detection, master's thesis, Seattle, WA: University of Washington.
Kraus, S. D. (1990). Rates and potential causes of mortality in North Atlantic right whales (Eubalaena glacialis). Mar. Mamm. Sci. 6, 278–291. doi: 10.1111/j.1748-7692.1990.tb00358.x
Laist, D. W., Knowlton, A. R., and Pendleton, D. (2014). Effectiveness of mandatory vessel speed limits for protecting North Atlantic right whales. Endang. Species Res. 23, 133–147. doi: 10.3354/esr00586
Laist, D. W., Knowlton, A. R., Mead, J. G., Collet, A. S., and Podesta, M. (2001). Collisions between ships and whales. Mar. Mamm. Sci. 17, 35–75. doi: 10.1111/j.1748-7692.2001.tb00980.x
Masuda, K., Takashima, T., and Takayama, Y. (1988). Emissivity of pure and sea waters for the model sea surface in the infrared window regions. Remote Sens. Environ. 24, 313–329. doi: 10.1016/0034-4257(88)90032-6
McCafferty, D. J. (2007). The value of infrared thermography for research on mammals: previous applications and future directions. Mammal Rev. 37, 207–223. doi: 10.1111/j.1365-2907.2007.00111.x
Nowacek, D. P., Christiansen, F., Bejder, L., Goldbogen, J. A., and Friedlaender, A. S. (2016). Studying cetacean behaviour: new technological approaches and conservation applications. Animal Behav. 120, 235–244. doi: 10.1016/j.anbehav.2016.07.019
Ostrower, D. (2006). Optical thermal imaging – replacing microbolometer technology and achieving universal deployment. III-Vs Rev. 19, 24–27. doi: 10.1016/S0961-1290(06)71764-1
Perryman, W. L., Donahue, M. A., Laake, J. L., and Martin, T. E. (1999). Diel variation in migration rates of eastern Pacific gray whales measured with thermal imaging sensors. Mar. Mamm. Sci. 15, 426–445. doi: 10.1111/j.1748-7692.1999.tb00811.x
Redfern, J. V., McKenna, M. F., Moore, T. J., Calambokidis, J., Deangelis, M. L., Becker, E. A., et al. (2013). Assessing the risk of ships striking large whales in marine spatial planning. Conserv. Biol. 27, 292–302. doi: 10.1111/cobi.12029
Thomas, P. O., Reeves, R. R., and Brownell, R. L. J.r. (2016). Status of the world's baleen whales. Mar. Mamm. Sci. 32, 682–734. doi: 10.1111/mms.12281
Zitterbart, D. P., Kindermann, L., Burkhardt, E., and Boebel, O. (2013). Automatic round-the-clock detection of whales for mitigation from underwater noise impacts. PLoS ONE 8:e71217. doi: 10.1371/journal.pone.0071217
Nomenclature
Brightness temperature–temperature measured by the thermal imaging device.
Brightness temperature anomaly (BTA)–difference between the brightness temperature of the targeted object and the brightness temperature of the background scene.
Emissivity (spectral) – the ratio of the energy radiated from a surface to the energy radiated from a blackbody at the same temperature, wavelength and environmental conditions.
Microbolometer – the detector in a thermal imaging device (for further details see: Ostrower, 2006).
Keywords: humpback whale, infrared, biometrical thermography, emissivity, blow velocity
Citation: Horton TW, Oline A, Hauser N, Khan TM, Laute A, Stoller A, Tison K and Zawar-Reza P (2017) Thermal Imaging and Biometrical Thermography of Humpback Whales. Front. Mar. Sci. 4:424. doi: 10.3389/fmars.2017.00424
Received: 28 September 2017; Accepted: 12 December 2017;
Published: 21 December 2017.
Edited by:
Lars Bejder, Murdoch University, AustraliaReviewed by:
Nuno Queiroz, University of Porto, PortugalPhil Bouchet, Centre for Marine Futures, School of Animal Biology, University of Western Australia, Australia
Copyright © 2017 Horton, Oline, Hauser, Khan, Laute, Stoller, Tison and Zawar-Reza. This is an open-access article distributed under the terms of the Creative Commons Attribution License (CC BY). The use, distribution or reproduction in other forums is permitted, provided the original author(s) or licensor are credited and that the original publication in this journal is cited, in accordance with accepted academic practice. No use, distribution or reproduction is permitted which does not comply with these terms.
*Correspondence: Travis W. Horton, travis.horton@canterbury.ac.nz