Formation of Chromophoric Dissolved Organic Matter by Bacterial Degradation of Phytoplankton-Derived Aggregates
 Joanna D. Kinsey
 Gabrielle Corradino1
  Kai Ziervogel
 Astrid Schnetzer
 Christopher L. Osburn
- 1Department of Marine, Earth, and Atmospheric Sciences, North Carolina State University, Raleigh, NC, United States
- 2Ocean Process Analysis Laboratory, Institute for the Study of Earth, Oceans, and Space, University of New Hampshire, Durham, NH, United States
Organic matter produced and released by phytoplankton during growth is processed by heterotrophic bacterial communities that transform dissolved organic matter into biomass and recycle inorganic nutrients, fueling microbial food web interactions. Bacterial transformation of phytoplankton-derived organic matter also plays a poorly known role in the formation of chromophoric dissolved organic matter (CDOM) which is ubiquitous in the ocean. Despite the importance of organic matter cycling, growth of phytoplankton and activities of heterotrophic bacterial communities are rarely measured in concert. To investigate CDOM formation mediated by microbial processing of phytoplankton-derived aggregates, we conducted growth experiments with non-axenic monocultures of three diatoms (Skeletonema grethae, Leptocylindrus hargravesii, Coscinodiscus sp.) and one haptophyte (Phaeocystis globosa). Phytoplankton biomass, carbon concentrations, CDOM and base-extracted particulate organic matter (BEPOM) fluorescence, along with bacterial abundance and hydrolytic enzyme activities (α-glucosidase, β-glucosidase, leucine-aminopeptidase) were measured during exponential growth and stationary phase (~3–6 weeks) and following 6 weeks of degradation. Incubations were performed in rotating glass bottles to keep cells suspended, promoting cell coagulation and, thus, formation of macroscopic aggregates (marine snow), more similar to surface ocean processes. Maximum carbon concentrations, enzyme activities, and BEPOM fluorescence occurred during stationary phase. Net DOC concentrations (0.19–0.46 mg C L−1) increased on the same order as open ocean concentrations. CDOM fluorescence was dominated by protein-like signals that increased throughout growth and degradation becoming increasingly humic-like, implying the production of more complex molecules from planktonic-precursors mediated by microbial processing. Our experimental results suggest that at least a portion of open-ocean CDOM is produced by autochthonous processes and aggregation likely facilitates microbial reprocessing of organic matter into refractory DOM.
Introduction
Oceanic primary production (PP) contributes between 35 and 65 petagrams (Pg) of carbon annually to global net PP (Field et al., 1998; del Giorgio and Duarte, 2002; Carr et al., 2006; Chavez et al., 2011), mainly through autochthonous production by photosynthetic phytoplankton. Phytoplankton release 2–50% of photosynthetically fixed carbon as dissolved organic matter (DOM) through active exudation and passive leakage (Thornton, 2014), contributing to the largest reservoir of reduced carbon on earth (662 Pg C) (Hansell et al., 2009). Additional phytoplanktonic DOM is released through viral infection, sloppy feeding by predators such as zooplankton, and cell death, with zooplankton contributing their own DOM through excretion of organic matter and fecal pellets (Urban-Rich et al., 2006; Steinberg et al., 2008; Saba et al., 2011). A significant, yet poorly characterized, portion of primary production is exported out of the euphotic zone and into the twilight zone (Siegel et al., 2016). The vertical export has been estimated to range from 5 to more than 12 Pg C y−1 (e.g., Boyd and Trull, 2007; Henson et al., 2011) spanning annual anthropogenic CO2 emissions (~7.0 Pg C y−1) (Siegenthaler and Sarmiento, 1993). Sinking aggregates (or marine snow) are an amalgam of intact phytoplankton cells, detritus, fecal pellets, silica and/or carbonate frustules (that provide ballast) and transparent exopolymeric material (TEP) (Alldredge and Silver, 1988). These aggregates exhibit a wide variability with respect to chemical composition (Wakeham and Lee, 1989, 1993; Minor et al., 2003) and may result in significant export of organic matter to depth (e.g., Hansell et al., 2009; Carlson et al., 2010) and contribution to refractory DOM (RDOM) formation (Lechtenfeld et al., 2015).
DOM is a complex mixture of organic compounds that play an important role in marine biogeochemical cycling. The optically active fraction, chromophoric DOM (CDOM), is essential in both physical and biological processes, controlling light attenuation and photochemical reactions in the surface ocean, impacting the depth of primary production and screening out harmful ultraviolet light (e.g., Arrigo and Brown, 1996; Blough and Del Vecchio, 2002; Mopper et al., 2015). A small fraction of DOM fluoresces, allowing for the identification of DOM sources using excitation-emission matrices (EEMs). Two types of fluorescence are typically described, amino acid-like compounds and humic-like compounds (Coble, 2007), and have been attributed to autochthonous (e.g., primary production) and allochthonous (e.g., terrestrial) production, respectively (Coble, 1996; Yamashita and Tanoue, 2003). Fluorescence of base-extracted particulate organic matter (BEPOM), has been established as a relatively new technique that allows for the optical properties and sources of intracellular fluorophores in POM to be determined (Brym et al., 2014). This work has suggested strong discrete fluorophores including amino acids in estuarine and coastal ocean POM, while studies investigating CDOM production from phytoplankton have confirmed strong amino acid-like fluorescence in axenic cultures with additional fluorescence in the region of humic-like fluorescence for some species (Romera-Castillo et al., 2010; Fukuzaki et al., 2014). Additionally, humic-like fluorescence has been found to increase in degradation studies (Rochelle-Newall and Fisher, 2002; Stedmon and Markager, 2005; Biers et al., 2007; Shimotori et al., 2009; Romera-Castillo et al., 2011) and with apparent oxygen utilization (AOU), especially in the Pacific and Southern oceans (Chen and Bada, 1992; Yamashita et al., 2007; Yamashita and Tanoue, 2008; Jørgensen et al., 2011; Catalá et al., 2015). This suggests a linkage to microbial oxidation and organic matter degradation (Hayase and Shinozuka, 1995; Yamashita et al., 2007; Jørgensen et al., 2011) and may be especially important as an indicator for biogeochemical cycling since DOM serves as a substrate for heterotrophic microbial remineralization of carbon and other trace elements. Microbes utilize extracellular enzymes to catalyze high-molecular weight DOM into smaller compounds that can be transported across cell membranes of bacteria (Arnosti, 2011) or through osmotic uptake by fungi and labyrinthulomycetes (Bochdansky et al., 2017). The carbon is then incorporated into biomass, respired to CO2, or excreted as dissolved organic carbon (DOC) in the form of metabolically transformed products (Arnosti, 2011).
Given the potential importance of heterotrophic bacterial processing of organic matter for both biogeochemical cycling and contribution to deep-sea fluorescence, we aimed to investigate the role of microbes in the formation of open-ocean CDOM from phytoplankton-derived POM to better understand sources of open-ocean fluorescence. Our study builds upon previous culture studies that investigated CDOM production by incorporating fluorescence of base-extracted POM and hydrolytic enzyme activities in addition to traditional CDOM fluorescence measurements. Roller bottle incubations were used to form planktonic aggregates of four monocultures, sampling at initial, exponential, and stationary growth phases, and after 6 weeks of degradation in the dark. Bacterial abundance and two classes of hydrolytic extracellular enzymes indicative of carbohydrate and peptide hydrolysis (glucosidase and leucine-aminopeptidase, respectively) were measured in conjunction with carbon concentrations and CDOM and BEPOM fluorescence. We demonstrate that the production of CDOM fluorescence is directly related to microbial processing of phytoplankton-derived material.
Materials and Methods
Phytoplankton Growth Experiments and Sample Collection
Growth experiments were conducted with four phytoplankton taxa commonly found in coastal waters. Three strains were obtained from the NCMA Bigelow collection (https://ncma.bigelow.org/) including diatoms Skeletonema grethae (CCMP2801, isolated May 2004 off North Carolina) and Leptocylindrus hargravesii (CCMP1856, isolated Feb 1997 in the Gulf of Mexico), and one haptophyte Phaeocystis globosa (CCMP2754, isolated Aug 2003 in the Atlantic Bight). The fourth was a coastal non-axenic isolate of Coscinodiscus sp. (COS1, isolated April 2015 off North Carolina). Two growth experiments were conducted, one with Skeletonema, Leptocylindrus, and Phaeocystis spp. grown in parallel and the other with only Coscinodiscus sp. All cultures were grown in optically clear 0.2 μm-filtered artificial seawater (ASW) prepared with baked (550°C, 6 h) or ultrapure salts to minimize background CDOM fluorescence. A total of twelve 1.9 L borosilicate bottles per organism were inoculated with an initial concentration of ~21,000–66,000 cells mL−1 with the exception of the much slower growing Coscinodiscus sp. with ~5 cells mL−1. All inoculated bottles, along with control bottles of ASW containing no phytoplankton, were amended with f/20 growth media (one-tenth of f/2 media, Guillard and Ryther, 1962). Inoculated bottles and controls were grown on a Wheaton roller culture apparatus rotating at ~1 rpm (Shanks and Edmondson, 1989). Cultures were maintained at 18°C and a 12:12 L:D cycle at ~90 μEinstein m−2 s−1 under cool white fluorescent light in a culture incubator (Percival Scientific, Iowa).
Growth was monitored every other day by in vivo fluorescence and cell counts until particles formed. This information guided more comprehensive sampling for additional chemical and biological parameters (see further detail below) during each growth phase. Skeletonema sp., Leptocylindrus sp., and Phaeocystis sp. were grown for 3–4 weeks under the above conditions, sampling at the beginning of the experiment (T0), during exponential growth (T1), and early stationary phase (particle formation; T2). Immediately after sampling for T2, the remaining culture and control bottles were placed in the dark for 6 weeks to promote bacterial degradation of particles (T3). The Coscinodiscus sp. experiment lasted 6 weeks with no degradation phase and was sampled at the beginning of the experiment (T0), twice during exponential growth [early-exponential and late-exponential (T1)], and early stationary phase (particle formation; T2). Changes in cell densities were used to calculate specific growth rates of phytoplankton during exponential phases (Brand et al., 1981). Cell counts (mL−1) were conducted using an Olympus BX53 compound microscope after preservation with acid Lugol's solution (5%) with settling volumes depending on growth phase (Utermöhl, 1958).
At each time point, three culture bottles of each organism and one control bottle (0.2 μm filtered ASW with f/20 nutrients) were sacrificed. Sample aliquots were gently vacuum filtered through pre-combusted (450°C, minimum 6 h) 0.7 μm (nominal mesh size) glass fiber filters. Filters were stored at −20°C until analyzed for particulate organic carbon (POC), POC/PON, and base-extracted POM (BEPOM) fluorescence followed by base-extracted POC (BEPOC). Filtrate was collected in polycarbonate bottles for absorbance and fluorescence and analyzed within 24 h or in pre-combusted borosilicate vials, acidified with 85% phosphoric acid (H3PO4) to pH 2, and stored at 4°C for dissolved organic carbon (DOC) analysis.
Optical Measurements
POM filters were base-extracted (BEPOM) in 10 mL of 0.1 M sodium hydroxide (NaOH) for 24 h at 4°C in the dark. After 24 h, extracts were neutralized with concentrated hydrochloric acid, then filtered using a 0.2 μm porosity Sterivex-GP polyethersulfone filter (EMD) (Brym et al., 2014). The filtrate was analyzed for absorbance and fluorescence in the same manner as CDOM.
Absorbance of CDOM and BEPOM was measured from 200 to 800 nm in a 1 or 10 cm quartz cell (Starna Cells, Inc.) on a Varian 300 UV spectrophotometer with ultrapure water as the reference blank for DOM samples and neutralized 0.1 M NaOH solution as the reference blank for BEPOM samples. Blank-corrected absorbance values were converted to Napierian absorption coefficients (αλ) (Osburn et al., 2012).
CDOM and BEPOM fluorescence were measured using a Varian Eclipse spectrophotometer with excitation (Ex) from 240 to 450 nm at 5 nm intervals and emission (Em) from 300 to 600 nm every 2 nm. Samples were run with slit widths set at 5 nm for both Ex and Em modes, an integration time of 0.0125 s, scan rate of 2,400 nm m−1, and at either 800 or 950 V, depending on sample response. Fluorescence measurements were corrected for excitation energy and emission detector response using correction factors supplied by the manufacturer and any inner-filter effects were corrected following Tucker et al. (1992). Final BEPOM fluorescence values were corrected for dilution and filtration volumes and both BEPOM and CDOM values were calibrated in quinine sulfate equivalents (QSE, where 1 QSE = 1 ppb quinine sulfate) (Lawaetz and Stedmon, 2009). Fluorescence results were concatenated into excitation-emission matrices (EEMs) for visualization as contour plots. The humification index (HIX) was determined by dividing the emission intensity in the 435–480 nm region by the intensity in the 300–345 nm region (Ohno, 2002).
Carbon Concentrations and POC/PON
DOC and BEPOC (from BEPOM samples) concentrations were measured on an OI Analytical 1030D TOC analyzer in combustion mode (Lalonde et al., 2014). Prior to analysis all acidified samples were sparged with ultrahigh purity argon. DOC concentrations were blank corrected using 18.2 MΩ ultrapure Milli-Q (Millipore) water and calibrated with caffeine standards (0–5 mg C L−1) and Hansell deep sea reference (DSR) water. BEPOC concentrations were blank-corrected against ultrapure water and caffeine standards ranging from 0 to 20 mg C L−1. Final BEPOC concentrations were corrected for extraction volume and initial filtration volume. Filters for POC concentrations and POC/PON ratios were dried overnight at 60°C followed by flash combustion to CO2 and N2 using a Thermo Flash 1112 elemental analyzer with acetanilide as a standard and corrected for volume filtered.
Bacteria Abundance
Bacterial cells were enumerated by flow cytometry (Gasol and Del Giorgio, 2000). At each sampling point 1 mL of experimental or control water was fixed with 0.1% glutaraldehyde (final concentration) for 10 min at room temperature in the dark, and stored at −80°C. Prior to analysis, thawed samples were pipetted through a cell strainer (Flowmi, 70 μm porosity) and stained with SYBR Green I for 15 min on ice in the dark. Counts were performed with a FACSCalibur flow cytometer (Becton-Dickinson) using fluorescent microspheres (Molecular Probes) of 1 μm in diameter as internal size standard. Cells were enumerated according to their right angle scatter and green fluorescence using the FloJo 7.6.1 software. This method quantifies free bacteria and does not account for bacteria attached to the aggregate particles.
Hydrolytic Enzyme Activity
Hydrolytic enzyme activities were determined using L-leucine-4-methylcoumarinyl-7-amide (MCA) hydrochloride, 4-methylumbelliferyl α-D-glucopyranoside, and 4-methylumbelliferone (MUF) β-D-glucopyranoside (Sigma-Aldrich) as substrate proxies for leucine-aminopeptidase, α-glucosidase, and β-glucosidase activities, respectively (Hoppe, 1983). For each bottle and substrate proxy, 196 μL of unfiltered experimental or control water was added in duplicate to a pure-grade black 96-well plate (Brand Life Sciences) containing a single substrate proxy at saturation levels (final concentration 200 μM). Fluorescence (excitation 370 nm, emission 440 nm) was measured in a Tecan Infinite 200 Pro microplate reader immediately following the addition of the substrate and several more times over 7–20 h. The well plates were incubated in the dark at ~20°C. MCA and MUF standard solutions prepared in ASW were used to determine hydrolysis rates. Killed controls (boiled sample water) and ultrapure water samples showed little change over the incubations.
Statistical Analysis
All statistical analyses were performed using SigmaPlot Version 12.5 (Systat Software Inc.). Results were not normally distributed thus non-parametric Spearman correlation coefficients (r) were computed to examine relationships between all variables. An α-value of ≤0.05 was used for all statistical analyses.
Results
Phytoplankton Growth
Exponential growth (T1) was reached within 15–23 days in all experiments. Specific growth rates (μ) for each of the strains were 0.25 d−1 for Skeletonema sp., 0.21 d−1 for Leptocylindrus sp., 0.17 d−1 for Phaeocystis sp., and 0.11 d−1 for Coscinodiscus sp. Macroscopic particles formed within 3–8 days of the onset of exponential growth. Particle characteristics varied for each organism, from lightly aggregated particles for Skeletonema sp., to small well suspended particles for Leptocylindrus and Phaeocystis spp. Coscinodiscus sp. aggregates started out stringy and suspended becoming rounded, dense aggregates over time.
Fluorescence Characteristics
BEPOM samples for genera Skeletonema, Leptocylindrus, and Phaeocystis during exponential growth (T1) were dominated by low-intensity fluorescence (<0.15 QSE) in the region of 275/340 (excitation/emission, peak T) with additional diffuse secondary emission occurring in the regions of 260/400–460 (peak A) and 320–360/420–460 (peak C) (Figures 1, 2, Table 1). BEPOM peaks A and C became more distinct and shifted to longer wavelengths over the duration of the experiment (Figure 3). Peak A red-shifted in emission wavelengths to 260/440–500 (peak A*) and peak C red-shifted in both excitation and emission to 350–400/450–500 (peak C*), resulting in a three-peak pattern with peak T over growth and degradation. For example, BEPOM peak A emission fluorescence in Skeletonema sp. occurred at 400–410 nm for exponential and stationary growth phases but shifted to longer wavelengths (~490 nm) after 6 weeks of degradation (Figure 3). Coscinodiscus sp. showed only faint secondary emission during both exponential growth samplings, but still followed the three-peak pattern observed in the other cultures. By stationary phase (T2), Coscinodiscus sp. had minimal secondary emission in the region of peaks C and C*. Maximum fluorescence for all fluorescent peaks occurred during stationary phase (T2) with a sharp decrease (ca. 70%) over the 6 weeks of degradation (T3, Figures 1, 2).
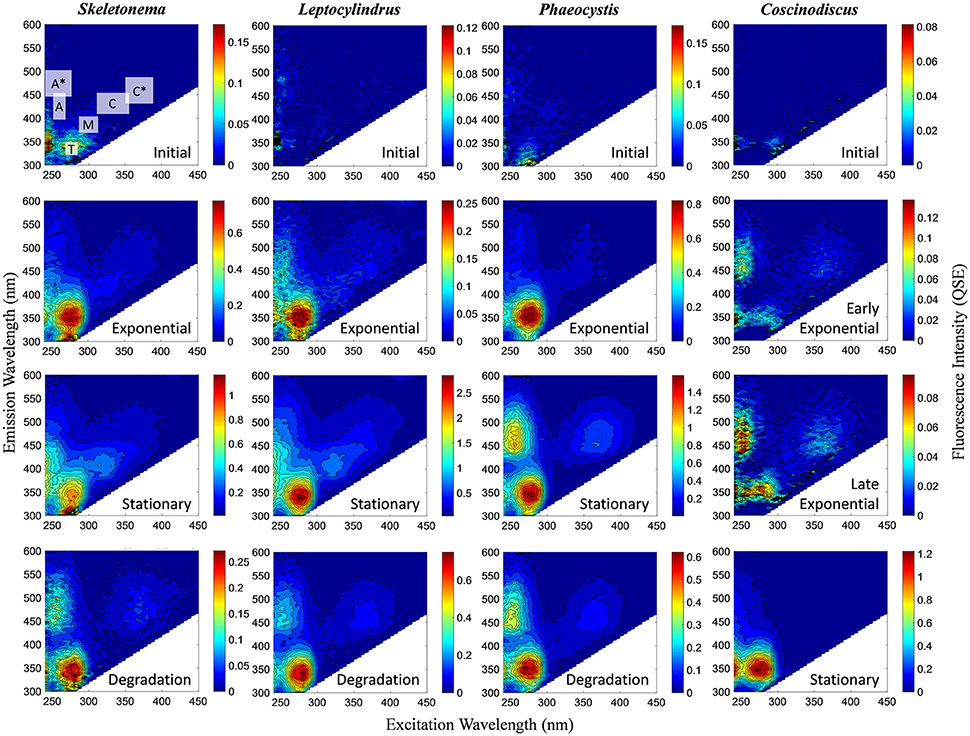
Figure 1. Representative excitation-emission matrices (EEMs) of BEPOM fluorescence for genera Skeletonema, Leptocylindrus, and Phaeocystis at initial, exponential, stationary, and degradation phases and for Coscinodiscus sp. at initial, early exponential, late exponential, and stationary growth phases. Color bars are presented in quinine sulfate equivalence (QSE) where 1 QSE = 1 ppb quinine sulfate equivalents. Note different scales for color bars for each EEM. Major peak regions of EEMs are indicated in the initial time point for Skeletonema sp.
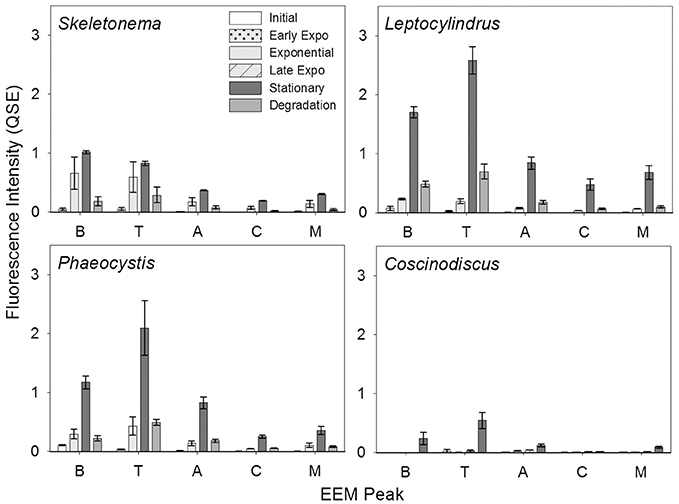
Figure 2. BEPOM fluorescence intensity of Coble EEM peaks over growth and degradation for genera Skeletonema (n = 3), Leptocylindrus (n = 2–4), Phaeocystis (n = 3), and Coscinodiscus (n = 3–4). Note the different growth stages for Coscinodiscus sp. All data are presented as mean ± standard error.
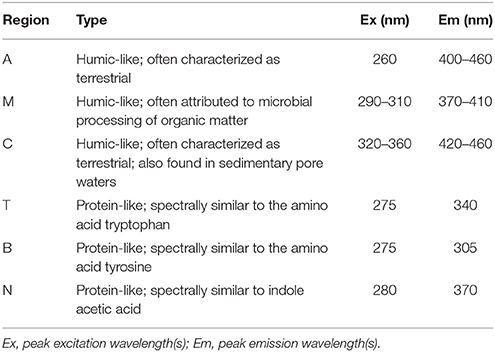
Table 1. Central regions of EEM fluorescence attributed to different sources of organic matter, modified from Coble (2007) by Stedmon and Nelson (2015).
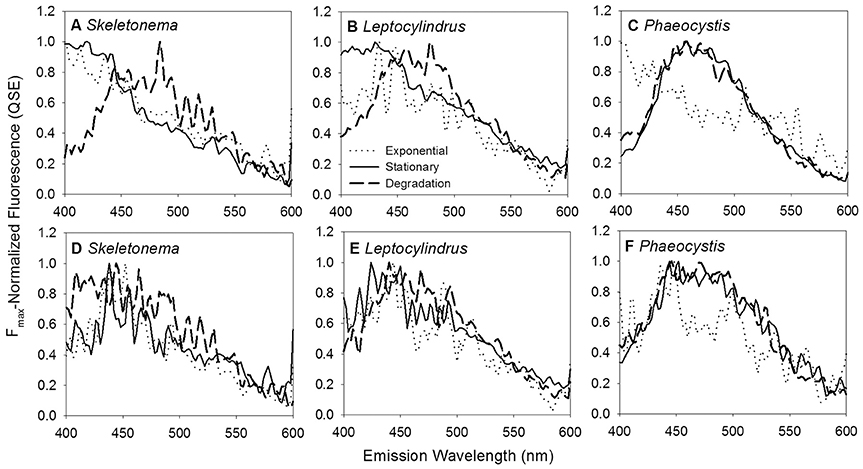
Figure 3. BEPOM (A–C) and CDOM (D–F) Fmax-normalized emission spectra at 250 nm excitation for genera Skeletonema, Leptocylindrus, and Phaeocystis at exponential (dotted line), stationary (solid line), and degradation (dashed line) growth phases.
In contrast to the distinct fluorophores in the BEPOM samples, CDOM samples from exponential growth (T1) had low (< 0.3 QSU), unstructured fluorescence with slightly enhanced fluorescence in the region of peak T and B (275/305), most commonly associated with protein-like fluorescence (Figures 4, 5, Table 1). Higher overall fluorescence intensities occurred during stationary (T2) and degradation (T3) phases and demonstrated a three-peak pattern similar to the BEPOM samples, though CDOM maximum fluorescence intensities were about half of BEPOM maximum fluorescence intensities. While CDOM shared the three-peak features observed in the BEPOM, the three peaks were much broader and less distinct in CDOM than in BEPOM and increased in fluorescence throughout growth and degradation for all areas of fluorescence (Figures 4, 5). Overall, CDOM fluorescence patterns were similar between all the phytoplankton species, with peaks A and T being the most prominent. CDOM peaks A and C were significantly correlated with BEPOM peaks A and C for many of the cultures, and all were significantly correlated when degradation (T3) time points were excluded (Table 2).
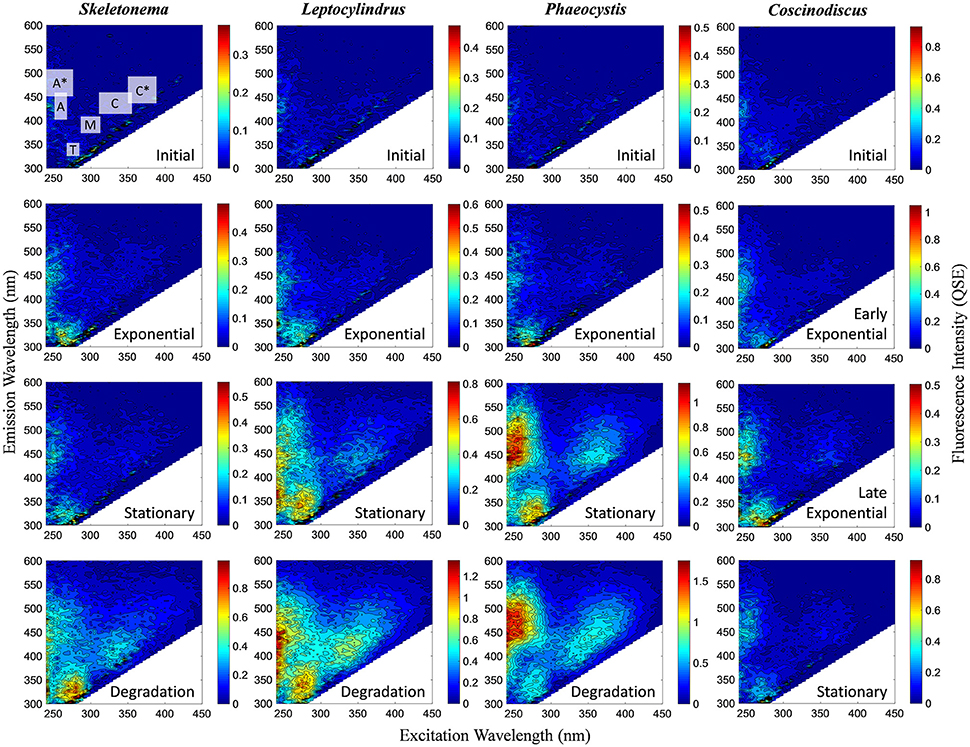
Figure 4. Representative excitation-emission matrices (EEMs) of CDOM fluorescence for genera Skeletonema, Leptocylindrus, and Phaeocystis at initial, exponential, stationary, and degradation phases and for Coscinodiscus sp. at initial, early exponential, late exponential, and stationary growth phases. Color bars are presented in quinine sulfate equivalence (QSE) where 1 QSE = 1 ppb quinine sulfate equivalents. Note different scales for color bars for each EEM. Major peak regions of EEMs are indicated in the initial time point for Skeletonema sp.
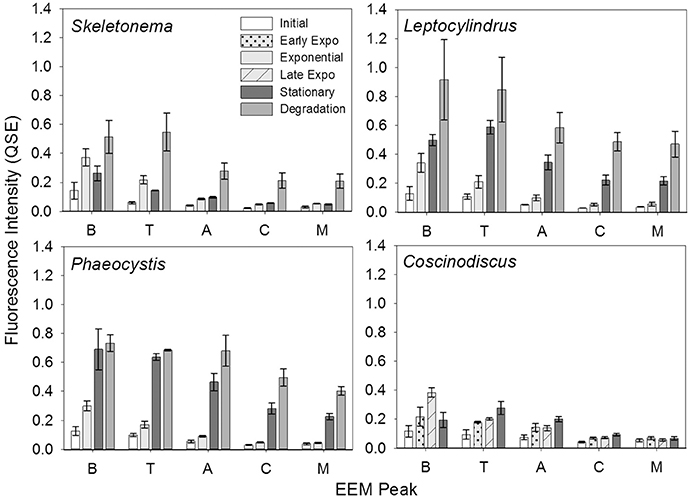
Figure 5. CDOM fluorescence intensity of Coble EEM peaks over growth and degradation for genera Skeletonema (n = 3), Leptocylindrus (n = 2–4), Phaeocystis (n = 3), and Coscinodiscus (n = 3–4). Note the different growth stages for Coscinodiscus sp. All data are presented as mean ± standard error.
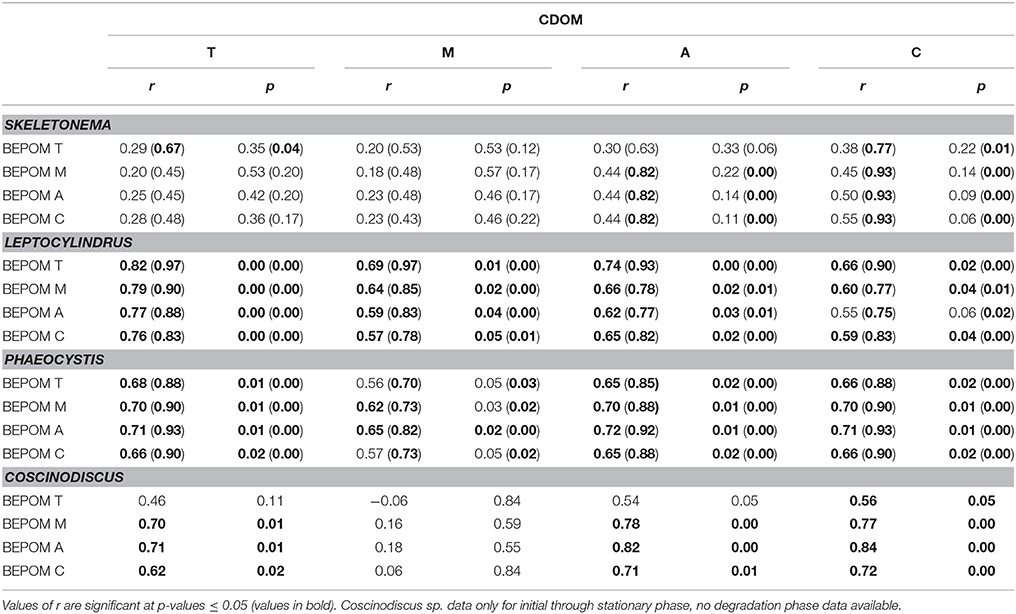
Table 2. Spearman correlation coefficient (r) between select CDOM fluorescence peaks and select BEPOM fluorescence peaks (T, M, A, and C) for all data (n = 12) and excluding degradation phase data in parenthesis (n = 9).
The humification index (HIX) is a florescence index of the degree of organic matter degradation, with higher values characteristic of higher molecular weight, aromatic compounds (Huguet et al., 2009). CDOM HIX values increased over the duration of the experiment for all of the cultures, whereas BEPOM HIX values were more variable with no clear trend among the cultures (Figure 6).
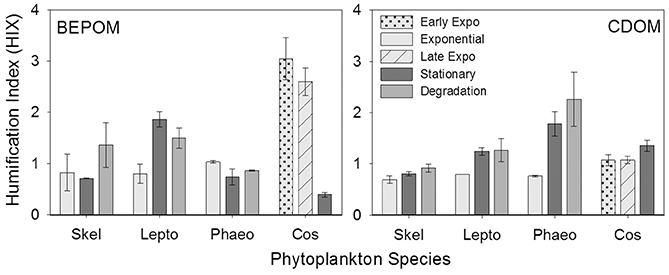
Figure 6. Humification index (HIX) for BEPOM and CDOM for genera Skeletonema (Skel, n = 3), Leptocylindrus (Lepto, n = 2–4), Phaeocystis (Phaeo, n = 3), and Coscinodiscus (Cos, n = 3–4). Note the different growth stages for Coscinodiscus. All data are presented as mean ± standard error. Ratios from the initial time point were excluded due to low fluorescence at this stage.
Carbon Concentrations and POC/PON
Carbon concentrations were similar between all three carbon pools (particulate, base-extracted, and dissolved) for all four cultures (Figure 7, Table 3). In general all carbon concentrations increased through stationary phase and decreased over the 6 weeks of degradation. The exception to this was Phaeocystis sp. DOC concentrations that leveled off between stationary and degradation phases, and for Coscinodiscus sp. which did not include a degradation stage. The largest increase occurred in the particulate pool with POC increasing between initial (T0) and stationary phase (T2) by 1.56 mg C L−1 for genera Skeletonema and 5.08 mg C L−1 for Leptocylindrus. For base-extracted POC, Phaeocystis sp. had the smallest increase (0.33 mg C L−1) compared to Leptocylindrus sp. (1.33 mg C L−1) over the experiment. DOC concentrations had a similar range, with Coscinodiscus sp. increasing by 0.29 mg C L−1 and Leptocylindrus sp. increasing by 1.14 mg C L−1 between initial (T0) and stationary phase (T2).
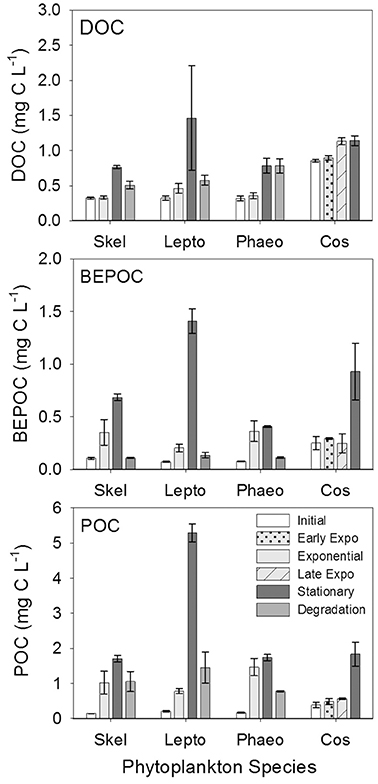
Figure 7. Dissolved (DOC), base-extracted particulate (BEPOC), and particulate (POC) organic carbon concentrations for genera Skeletonema (Skel, n = 3), Leptocylindrus (Lepto, n = 2–4), Phaeocystis (Phaeo, n = 3), and Coscinodiscus (Cos, n = 3–4). Samples were collected at initial, exponential, stationary, and after 6 weeks of degradation, except for Coscinodiscus sp. which had time points collected at initial, early exponential, late exponential, and stationary phases of growth. All data are presented as mean ± standard error.
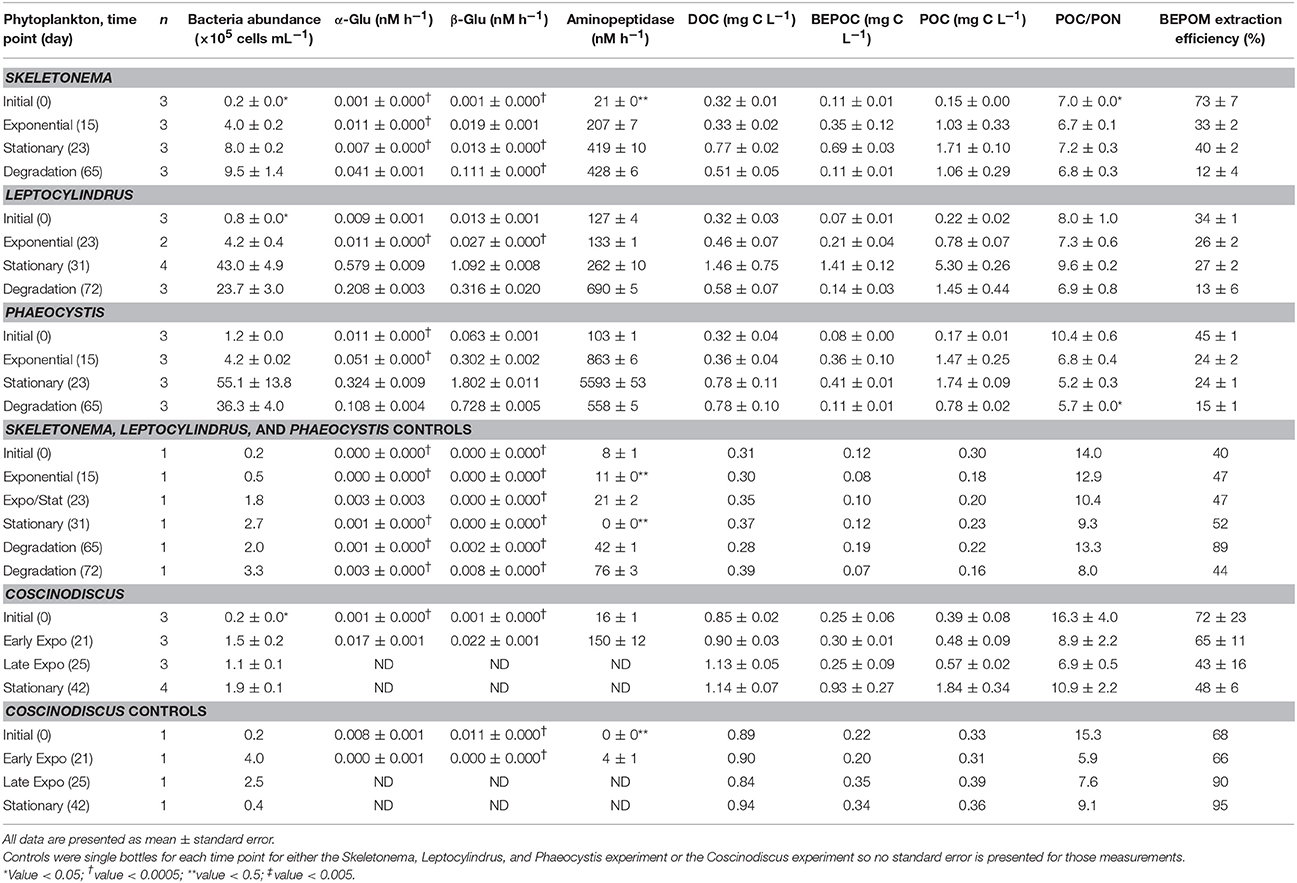
Table 3. Bacteria abundance, hydrolytic enzyme activities (α-glucosidase, β-glucosidase, and aminopeptidase), dissolved (DOC), base-extracted (BEPOC), and particulate (POC) organic carbon concentrations, particulate organic carbon to nitrogen ratios (POC/PON), and BEPOM extraction efficiencies for the four phytoplankton cultures and associated controls.
Base-extraction efficiencies (BEPOC concentration divided by POC concentration times 100) varied between 4 and 88%, with Leptocylindrus sp. having a slightly narrower range (4–36%) (Table 3). These extraction efficiencies were consistent with those reported in Brym et al. (2014). Greater extraction efficiencies occurred earlier in growth (e.g., exponential phase 21–78%) and decreased with the duration of the experiment with the lowest extraction efficiencies occurring after 6 weeks of degradation (4–24%, T3). Overall BEPOC concentration was correlated to POC concentration (r = 0.75, p < 0.001).
POC/PON ratios ranged from 5.2 to 10.9 for time points between exponential (T1) and degradation growth phases (T3) (Table 3). Higher POC/PON ratios occurred for Leptocylindrus sp. (6.9–9.6) and Coscinodiscus sp. (6.9–10.9), while Skeletonema sp. (6.7–7.2) and Phaeocystis sp. (5.2–6.8) had slightly lower POC/PON ratios; however, these differences were not significant.
Bacterial Abundance and Activities
Bacterial Cell Counts
The greatest increase in bacterial cell numbers occurred for genera Phaeocystis and Leptocylindrus, which had maximum bacterial cell numbers during stationary phase of growth (T2), reaching 5.5 ± 2.4 × 10⁶ cells mL−1 and 4.3 ± 1.0 × 10⁶ cells mL−1, respectively (Figure 8, Table 3). By the end of the 6 weeks of degradation (T3), bacterial cell numbers decreased by nearly half to 3.6 ± 0.7 × 10⁶ cells mL−1 and 2.4 ± 0.5 × 10⁶ cells mL−1, respectively. Bacterial cell numbers in the Skeletonema culture increased throughout the growth experiment, but only increased from 0.02 × 10⁶ at the initial sampling (T0) to 1.0 × 10⁶ during degradation (T3). The Coscinodiscus culture had the lowest overall bacterial cell numbers, only reaching 0.2 × 10⁶ cells mL−1 during stationary growth (T2).
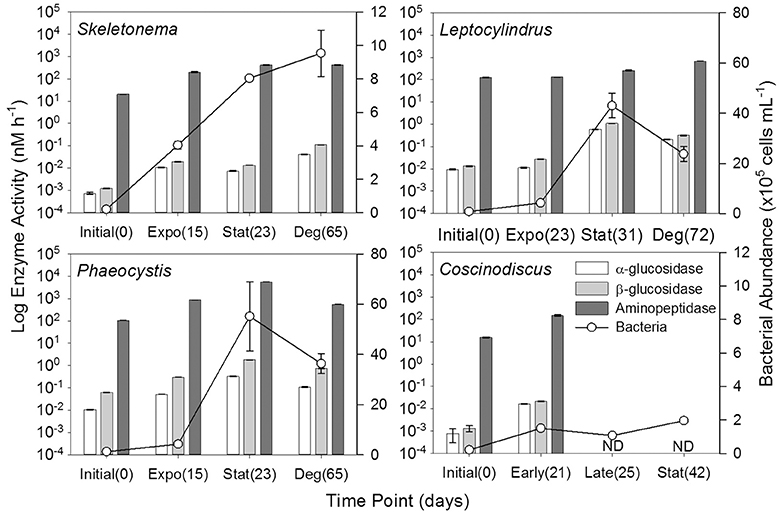
Figure 8. Hydrolytic enzyme activities (α-glucosidase, β-glucosidase, and aminopeptidase) and bacterial abundance for genera Skeletonema (n = 3), Leptocylindrus (n = 2–4), Phaeocystis (n = 3), and Coscinodiscus (n = 3–4). Samples were collected at initial, exponential (Expo), stationary (Stat), and after 6 weeks of degradation (Deg), except for Coscinodiscus sp. which had time points collected at initial and early exponential (Early); no enzyme activity data (ND) were available for late exponential (Late) and stationary. The number of days following inoculation are given in parentheses. All data are presented as mean ± standard error.
Hydrolytic Enzyme Activities
Aminopeptidase enzyme activities were typically three to five orders of magnitude higher than either glucosidase activities, with the Phaeocystis culture having the highest activities during stationary phase (T2, Figure 8, Table 3). Activities of β-glucosidase were typically a factor of two greater than α-glucosidase activities, except for Phaeocystis sp. which had β-glucosidase activities a factor of six to seven higher than α-glucosidase. Due to sampling constraints, no data was available for late-exponential (second T1) or stationary (T2) phases for Coscinodiscus spp.
Enzyme activities were highly correlated to fluorescent components, especially for glucosidase activities with genera Leptocylindrus and Phaeocystis and for aminopeptidase with Skeletonema sp. (Table 4). α- and β-glucosidase activities were also correlated to all carbon concentrations for genera Leptocylindrus and Phaeocystis.
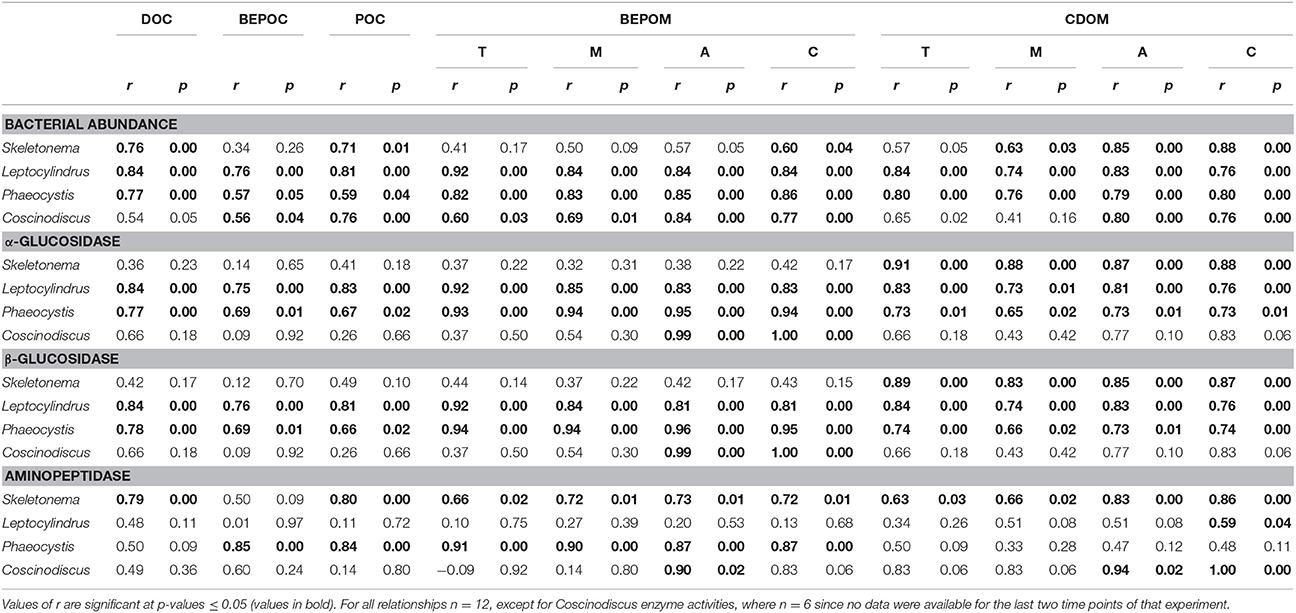
Table 4. Spearman correlation coefficient (r) between bacterial abundance or enzyme activity and DOC, BEPOC, POC and select BEPOM and CDOM fluorescence peaks (T, M, A, and C).
Discussion
Formation of CDOM by Marine Plankton in Culture
Previous laboratory experiments have relied on high nutrients (e.g., Rochelle-Newall and Fisher, 2002; Romera-Castillo et al., 2010) or additions of carbon substrates (e.g., Gruber et al., 2006; Goto et al., 2017) to observe CDOM formation by phytoplankton and/or bacteria. In our experiments, we produced CDOM fluorescence and phytoplankton densities on the same magnitude as open ocean waters using moderate nutrient additions and rotating bottles to keep cells in suspension. Using this approach, our maximum CDOM fluorescence for all cultures was low and ranged between 0.5 and 2 QSE (Figure 4), comparable to fluorescence intensities in several oceanic regions (0.5–6 QSE) (Nelson and Gauglitz, 2016; Netburn et al., in press). Additionally, trans-oceanic Pacific and Atlantic CDOM fluorescence ranged between 0.1 and 1 QSE for humic-like components and 0.1 to 11 QSE for protein-like components when data was modeled by parallel factor analysis (PARAFAC) (Murphy et al., 2008). Together, our results and previously published data, demonstrate that fluorescence intensities produced in culture experiments are similar to oceanic fluorescence intensities, even allowing for instrument variability. The low fluorescence intensities produced further suggest future culture experiments should use media with minimal background fluorescence to observe the low CDOM production by plankton.
Base-extraction of chromophoric and fluorophoric material from marine particles is a relatively new way to analyze POM and allowed for direct comparison between the two organic matter pools. The available field studies have been conducted in estuaries and coastal waters, but show remarkable consistency in BEPOM fluorescence. Overall fluorescence was low, typically less than 0.25 QSE, with maximum fluorescence corresponding to chlorophyll maxima and decreasing with depth (Brym et al., 2014; Ziervogel et al., 2016; Netburn et al., in press). For our cultures, maximum BEPOM fluorescence ranged between 0.4 and 3 QSE during stationary phase and decreased to 0.1–0.9 QSE during degradation (Figure 1). The elevated BEPOM fluorescence in cultures relative to natural samples was likely the result of measuring the cultures at the peak of phytoplankton biomass in a controlled environment compared to natural phytoplankton blooms that have more complex growth dynamics and influenced by other processes such as aggregation, grazing, and hydrodynamics.
Spectral Properties of Phytoplankton-Derived CDOM and BEPOM
All four monocultures produced a three-peak pattern that was dominated by discrete BEPOM fluorophores, suggestive of distinct compounds such as aromatic amino acids (Figure 1). This three-peak pattern has been described previously in natural BEPOM samples of estuarine (Brym et al., 2014) and oceanic (Ziervogel et al., 2016; Netburn et al., in press) origin. The prominence of the protein-like peak strongly resembles tryptophan, which has been shown to be dominant during phytoplankton growth (Stedmon and Markager, 2005; Murphy et al., 2008; Jørgensen et al., 2011). Distinct fluorescence in the region of peaks A and C have been attributed to fluorophores present in derivatives of benzoic acids (including phenols) and flavins, respectively (Wolfbeis, 1985; Wünsch et al., 2015). Other possibilities include siderophores (Fukuzaki et al., 2014). More generally, peaks A and C have previously been attributed to, and are abundant in, terrestrially-derived humic substances. Given our algal growth medium lacked material of terrestrial origin, as it was prepared with artificial seawater with f/20 nutrients, the observed formation and subsequent red-shift of peaks A and C were likely the result of microbially-transformed planktonic material rather than terrestrially-derived fluorescence.
CDOM fluorescence showed similar peak regions to BEPOM, but were generally broader and unstructured in emission and increased through growth and degradation phases (Figure 4). We interpret these findings to suggest that degradation processes occurred on the algal-derived material once in the dissolved phase. In previous studies, CDOM generated in phytoplankton and bacterial cultures showed similar fluorescence patterns to those presented here. Culture work on diatoms, dinoflagellates, and prasinophytes illustrated CDOM production by phytoplankton at intensities observed in the ocean (Romera-Castillo et al., 2010). Fukuzaki et al. (2014) presented EEM spectra measured on DOM from axenic diatoms, dinoflagellates, chlorophytes, cryptophytes, haptophytes, and raphidophytes monocultures. Though the dominant fluorophores differed between individual species, the ubiquitous fluorescence patterns produced overall by a range of genera further supports planktonic-sources of open ocean CDOM. However, these studies were only able to suggest that CDOM was formed contemporaneously with plankton growth as no fluorescence measurements on POM material were performed (Romera-Castillo et al., 2010; Fukuzaki et al., 2014). Additionally, these previous studies as well as our own still show elevated fluorescence in the regions of peaks A, C, and T, unlike open-ocean fluorescence which is low overall with maximum fluorescence in the area of peak A (Jørgensen et al., 2011). This suggests longer degradation experiments than performed in the present study and others (e.g., Gruber et al., 2006; Fukuzaki et al., 2014) are required to fully transform the protein and humic-like fluorescence into the low CDOM fluorescence observed in the ocean.
Results from our phytoplankton growth experiments, viewed through BEPOM to represent the particle phase, in addition to CDOM, strongly indicate that the unstructured CDOM fluorescence signal was a direct product of the microbial loop operating on planktonic biomass. Correlations between CDOM and BEPOM fluorescence peaks A and C (Table 2) were strongest when samples from degradation time points were excluded, due to the continual increase in CDOM fluorescence and concurrent decrease in BEPOM fluorescence (Figures 4, 5, Tables 1, 2). The overall increase in CDOM fluorescence and humification index (Figure 6), along with general decreases in all three carbon pools (Figure 7) and high microbial activities (Figure 8) between stationary and degradation time points, suggest microbial alteration of the DOM pool resulted in its compositional alteration to more fluorescent components. CDOM fluorescence increased in all peak regions throughout growth and degradation, including peaks A and C that have previously been described as humic-like substances arising from terrestrial material (Coble, 2007; Stedmon and Nelson, 2015). However, with no terrestrial material in our culture experiments, the humic-like fluorescence has to be a direct product of autochthonous production and microbial transformation. Similar processes occurring in the open-ocean water column would explain the global observations of elevated fluorescence and correlations with AOU in the deep ocean (Chen and Bada, 1992; Yamashita et al., 2007; Yamashita and Tanoue, 2008; Jørgensen et al., 2011; Catalá et al., 2015) that has been linked to the remineralization of organic matter and formation of RDOM (Yamashita et al., 2007; Jiao et al., 2010; Hansell, 2013; Lechtenfeld et al., 2015).
One advantage of incorporating BEPOM measurements into field sampling would be to observe subtle fluorescence shifts that are more distinct than in the dissolve phase and indicate microbial transformation of autochthonous material (Figure 3). A few previous studies have observed red-shifts in peaks A and C in CDOM, but these signals could easily be misinterpreted as terrestrial humic-like material or overshadowed by strong terrestrial influence, especially in coastal and freshwater systems. Murphy et al. (2008) hypothesized degradation of their coastal and open-ocean CDOM samples resulted in a PARAFAC component (C3) with excitation maxima at 260 and 370 nm and an emission maxima at 490 nm, similar to the locations of our red-shifted peaks A and C. Additionally, a similar PARAFAC component (C2, Ex 240 and 370 nm, Em 480) was determined from a meridional transect in the Atlantic Ocean by Kowalczuk et al. (2013), with its intensities doubling below the mixed layer. Burdige et al. (2004) also observed red-shifts in humic-like fluorescence of peaks A (239/429) and M (328/422) to longer wavelengths, resulting in peaks A' (248/461) and C (360/460) in sediment pore waters, and attributed the red-shift to diagenetic transformations of the original fluorophores. The red-shift in natural samples were all explained as a result of microbial degradation processes and most were at locations in the open ocean, far removed from terrigenous inputs of DOM. Thus, these studies support our interpretation that the appearance of red-shifted peaks in our plankton experiments were due to microbial degradation and that structurally complex substances were formed from planktonic precursors. The structural complexity may arise as a direct result of marine snow formation and microbial processing. Aggregation during particle formation could bring aromatic aldehydes and ketones in close proximity with hydroxylated benzoic acid derivatives through the microbial reprocessing into more complex molecules such as RDOM (Lechtenfeld et al., 2015). The presence of these molecules in the same moiety could facilitate charge transfer interactions between electron acceptors and donors, which has been suggested for lignin derivatives (Del Vecchio and Blough, 2004; Baluha et al., 2013; Sharpless and Blough, 2014). While the biochemical pathways and ecological ramifications of the planktonic CDOM phenomenon remain elusive, we can be certain that not all oceanic CDOM is terrestrially-derived and plankton are important sources of RDOM to the deep ocean.
Organic Matter Remineralization
Positive correlations between bacterial cell numbers and the different carbon pools (Table 4) suggest a close link between bacterial growth and activities in our experiments, with the microbes actively transforming organic matter compounds, such as carbohydrates, to shape the CDOM and BEPOM pools. Furthermore, decreases in BEPOM fluorescence (ca. 70%), BEPOM extraction efficiencies, and BEPOC concentrations during the 6 weeks of degradation suggest that substantial amounts of base-extractable POM components were degraded or solubilized to the dissolved phase by bacteria. This solubilized material was then rapidly removed from the dissolved phase, likely though organic matter remineralization to CO2, resulting in net increases in DOC concentrations ranging between 0.19 and 0.46 mg C L−1, regardless of the maximum carbon concentrations produced in each culture (Figure 7). This net DOC production was on the same order of magnitude as RDOC concentrations observed in the deep ocean (0.41–0.96 mg C L−1) (Hansell et al., 2009).
Strong correlations between bulk glucosidase activities and organic matter fluorescence indicate that either carbohydrate hydrolysis products were a major source of CDOM likely resulting from POM sources, or that bacterial formation of CDOM is an energetically demanding process. Goto et al. (2017) demonstrated that a strain of Alteromonas grown solely on glucose produced humic-like CDOM fluorescence with emission properties similar to what we measured in our cultures. In contrast, amino acids and other nitrogen compounds apparently played a minor role in the formation of the pool of fluorescing organic matter as indicated by fewer correlations between aminopeptidase activities and organic matter parameters (Table 4). Rather, intermediate reactions, such as the reaction of aldehydes with organic amines may incorporate N into structures that can produce charge transfer, thus creating “humic-like” CDOM fluorescence on these purely planktonic precursors (Kieber et al., 1997; Brandes et al., 2004; Del Vecchio and Blough, 2004). Furthermore, the overall high rates of aminopeptidase (Figure 8, Table 3) indicate rapid turnover of nitrogen compounds and recycling of nutrients throughout the phytoplankton growth experiments. The coupling of BEPOM analysis of fluorescence along with measurements of enzyme activities has clearly opened a new dimension of observation of processes by which CDOM in the ocean may be formed by plankton.
Conclusions
Overall, our study demonstrates that phytoplankton-derived organic matter directly results in the formation of unstructured “humic-like” CDOM fluorescence, facilitated by aggregation and microbial processing of precursor POM biomolecules containing discrete, yet unidentified, fluorophores. We have demonstrated the ability to measure fluorescence from the cellular biomass of POM, extracted into dilute base, but without the need to use resin extraction techniques to concentrate the signal, which may alter the composition (and optical properties) of CDOM. The overall trends in growth and production of fluorescent CDOM follows global ocean observations in fluorescence patterns and intensity, as well as, net production of DOC. Furthermore, the significant correlations between BEPOM and CDOM fluorescence, especially peaks A and C, challenges the paradigm that humic-like fluorescence in the open ocean is the result of terrestrially-derived material (Andrew et al., 2013; Jørgensen et al., 2014). Finally, hydrolytic enzymatic rates suggest that the bacterial community actively transforms organic matter with significant turnover of carbon and nitrogen, making bacterially-mediated production of RDOM from planktonic biomass a key pathway in global element cycles (e.g., Jiao et al., 2010; Lechtenfeld et al., 2015; Moran et al., 2016).
Author Contributions
All authors contributed to the design of the study and data interpretation. JK and GC performed the incubation experiment. JK, GC, and KZ ran sample analyses. JK wrote the initial draft of the manuscript and all authors contributed to its revision.
Funding
Financial support for this work was provided by the National Science Foundation Chemical Oceanography award 1459406.
Conflict of Interest Statement
The authors declare that the research was conducted in the absence of any commercial or financial relationships that could be construed as a potential conflict of interest.
Acknowledgments
The authors thank Daniel Wiltsie, Mackenzie Fiss, and Alexandra Gizzi for their assistance in sample collection and analyses.
References
Alldredge, A. L., and Silver, M. W. (1988). Characteristics, dynamics and significance of marine snow. Prog. Oceanogr. 20, 41–82. doi: 10.1016/0079-6611(88)90053-5
Andrew, A. A., Del Vecchio, R., Subramaniam, A., and Blough, N. V. (2013). Chromophoric dissolved organic matter (CDOM) in the equatorial atlantic ocean: optical properties and their relationship to CDOM structure and source. Mar. Chem. 148, 33–43. doi: 10.1016/j.marchem.2012.11.001
Arnosti, C. (2011). Microbial extracellular enzymes and the marine carbon cycle. Ann. Rev. Mar. Sci. 3, 401–425. doi: 10.1146/annurev-marine-120709-142731
Arrigo, K. R., and Brown, C. W. (1996). Impact of chromophoric dissolved organic matter on UV inhibition of primary productivity in the sea. Mar. Ecol. Prog. Ser. 140, 207–216. doi: 10.3354/meps140207
Baluha, D. R., Blough, N. V., and Del Vecchio, R. (2013). Selective mass labeling for linking the optical properties of chromophoric dissolved organic matter to structure and composition via ultrahigh resolution electrospray ionization mass spectrometry. Environ. Sci. Technol. 47, 9891–9897. doi: 10.1021/es402400j
Biers, E. J., Zepp, R. G., and Moran, M. A. (2007). The role of nitrogen in chromophoric and fluorescent dissolved organic matter formation. Mar. Chem. 103, 46–60. doi: 10.1016/j.marchem.2006.06.003
Blough, N. V., and Del Vecchio, R. (2002). “Chromophoric DOM in the coastal environment,” in Biogeochemistry of Marine Dissolved Organic Matter, eds D. A. Hansell and C. A. Carlson (San Diego, CA: Academic Press), 509–546.
Bochdansky, A. B., Clouse, M. A., and Herndl, G. J. (2017). Eukaryotic microbes, principally fungi and labyrinthulomycetes, dominate biomass on bathypelagic marine snow. ISME J. 11, 362–373. doi: 10.1038/ismej.2016.113
Boyd, P. W., and Trull, T. W. (2007). Understanding the export of biogenic particles in oceanic waters, Is there a consensus. Prog. Oceanogr. 72, 276–312. doi: 10.1016/j.pocean.2006.10.007
Brand, L. E., Guillard, R. R. L., and Murphy, L. S. (1981). A method for the rapid and precise determination of acclimated phytoplankton reproduction rates. J. Plankton Res. 3, 193–201. doi: 10.1093/plankt/3.2.193
Brandes, J. A., Lee, C., Wakeham, S., Peterson, M., Jacobson, C., Wirick, S., et al. (2004). Examining marine particulate organic matter at sub-micron scales using scanning transmission X-ray microscopy and carbon X-ray absorption near edge structure spectroscopy. Mar. Chem. 92, 107–121. doi: 10.1016/j.marchem.2004.06.020
Brym, A., Paerl, H. W., Montgomery, M. T., Handsel, L. T., Ziervogel, K., and Osburn, C. L. (2014). Optical and chemical characterization of base-extracted particulate organic matter in coastal marine environments. Mar. Chem. 162, 96–113. doi: 10.1016/j.marchem.2014.03.006
Burdige, D. J., Kline, S. W., and Chen, W. (2004). Fluorescent dissolved organic matter in marine sediment pore waters. Mar. Chem. 89, 289–311. doi: 10.1016/j.marchem.2004.02.015
Carlson, C. A., Hansell, D. A., Nelson, N. B., Siegel, D. A., Smethie, W. M., Khatiwala, S., et al. (2010). Dissolved organic carbon export and subsequent remineralization in the mesopelagic and bathypelagic relms of the North Atlantic basin. Deep-Sea Res. II 57, 1433–1445. doi: 10.1016/j.dsr2.2010.02.013
Carr, M.-E., Friedrichs, M. A. M., Schmeltz, M., Aita, M. N., Antoine, D., Arrigo, K. R., et al. (2006). A comparison of global estimates of marine primary production from ocean color. Deep-Sea Res. II 53, 741–770. doi: 10.1016/j.dsr2.2006.01.028
Catalá, T. S., Reche, I., Fuentes-Lema, A., Romera-Castillo, C., Nieto-Cid, M., Ortega-Retuerta, E., et al. (2015). Turnover time of fluorescent dissolved organic matter in the dark global ocean. Nat. Comm. 6:5986. doi: 10.1038/ncomms6986
Chavez, F. P., Messié, M., and Pennington, J. T. (2011). Marine primary production in relation to climate variability and change. Ann. Rev. Mar. Sci. 3, 227–260. doi: 10.1146/annurev.marine.010908.163917
Chen, R. F., and Bada, J. L. (1992). The fluorescence of dissolved organic matter in seawater. Mar. Chem. 37, 191–221. doi: 10.1016/0304-4203(92)90078-O
Coble, P. G. (1996). Characterization of marine and terrestrial DOM in seawater using excitation-emission matrix spectroscopy. Mar. Chem. 51, 325–346.
Coble, P. G. (2007). Marine optical biogeochemistry: the chemistry of ocean color. Chem. Rev. 107, 402–418. doi: 10.1021/cr050350+
del Giorgio, P. A., and Duarte, C. M. (2002). Respiration in the open ocean. Nature 420, 379–384. doi: 10.1038/nature01165
Del Vecchio, R., and Blough, N. V. (2004). On the origin of the optical properties of humic substances. Environ. Sci. Technol. 38, 3885–3891. doi: 10.1021/es049912h
Field, C. B., Behrenfeld, M. J., Randerson, J. T., and Falkowski, P. (1998). Primary production of the biosphere: integrating terrestrial and oceanic components. Science 281, 237–240.
Fukuzaki, K., Imai, I., Fukushima, K., Ishii, K.-I., Sawayama, S., and Yoshioka, T. (2014). Fluorescent characteristics of dissolved organic matter produced by bloom-forming coastal phytoplankton. J. Plank. Res. 36, 685–694. doi: 10.1093/plankt/fbu015
Gasol, J. M., and Del Giorgio, P. A. (2000). Using flow cytometry for counting natural planktonic bacteria and understanding the structure of planktonic bacterial communities. Sci. Mar. 64, 197–224. doi: 10.3989/scimar.2000.64n2197
Goto, S., Tada, Y., Suzuki, K., and Yamashita, Y. (2017). Production and reutilization of fluorescent dissolved organic matter by a marine bacterial strain, Alteromonas macleodii. Front. Microbiol. 8:507. doi: 10.3389/fmicb.2017.00507
Gruber, D. F., Simjouw, J.-P., Seitzinger, S. P., and Taghon, G. L. (2006). Dynamics and characterization of RDOM produced by a pure bacterial culture in an experimental predator-prey system. Appl. Environ. Microbiol. 72, 4184–4191. doi: 10.1128/AEM.02882-05
Guillard, R. R., and Ryther, J. H. (1962). Studies of marine planktonic diatoms. I. Cyclotella nana Hustedt and Detonula confervacea (cleve) Gran. Can. J. Microbiol. 8, 229–239.
Hansell, D. A. (2013). Recalcitrant dissolved organic carbon fractions. Annu. Rev. Mar. Sci. 5, 421–445. doi: 10.1146/annurev-marine-120710-100757
Hansell, D. A., Carlson, C. A., Repeta, D. J., and Schlitzer, R. (2009). Dissolved organic matter in the ocean: a controversy stimulates new insights. Oceanography 22, 202–211. doi: 10.5670/oceanog.2009.109
Hayase, K., and Shinozuka, N. (1995). Vertical distribution of fluorescent organic matter along with AOU and nutrients in the equatorial Central Pacific. Mar. Chem. 48, 283–290. doi: 10.1016/0304-4203(94)00051-E
Henson, S. A., Sanders, R., Madsen, E., Morris, P. J., Moigne, F. L., and Quartly, G. D. (2011). A reduced estimate of the strength of the ocean's biological carbon pump. Geophy. Res. Lett. 38:L04606. doi: 10.1029/2011GL046735
Hoppe, H.-G. (1983). Significance of exoenzymatic activities in the ecology of brackish water: measurements by means of methylumbelliferyl-substrates. Mar. Ecol. Progr. Ser. 11, 299–308. doi: 10.3354/meps011299
Huguet, A., Vacher, L., Relexans, S., Saubusse, S., Froidefond, J. M., and Parlanti, E. (2009). Properties of fluorescent dissolved organic matter in the gironde estuary. Org. Geochem. 40, 706–719. doi: 10.1016/j.orggeochem.2009.03.002
Jiao, N., Herndl, G. J., Hansell, D. A., Benner, R., Kattner, G., Wilhelm, S. W., et al. (2010). Microbial production of recalcitrant dissolved organic matter: Long-term carbon storage in the global ocean. Nat. Rev. Microbiol. 8, 593–599. doi: 10.1038/nrmicro2386
Jørgensen, L., Stedmon, C. A., Granskog, M. A., and Middelboe, M. (2014). Tracing the long-term microbial production of recalcitrant fluorescent dissolved organic matter in seawater. Geophys. Res. Lett. 41, 2481–2488. doi: 10.1002/2014GL059428
Jørgensen, L., Stedmon, C. A., Kragh, T., Markager, S., Middelboe, M., and Søndergaard, M. (2011). Global trends in the fluorescence characteristics and distribution of marine dissolved organic matter. Mar. Chem. 126, 139–148. doi: 10.1016/j.marchem.2011.05.002
Kieber, R. J., Hydro, L. H., and Seaton, P. J. (1997). Photooxidation of triglycerides and fatty acids in seawater: implication toward the formation of marine humic substances. Limnol. Oceanogr. 42, 1454–1462. doi: 10.4319/lo.1997.42.6.1454
Kowalczuk, P., Tilstone, G. H., Zabłocka, M., Röttgers, R., and Thomas, R. (2013). Composition of dissolved organic matter along an Atlantic meridional Transect from fluorescence spectroscopy and parallel factor analysis. Mar. Chem. 157, 170–184. doi: 10.1016/j.marchem.2013.10.004
Lalonde, K., Middlestead, P., and Gélinas, Y. (2014). Automation of 13C/12C ratio measurement for freshwater and seawater DOC using high temperature combustion. Limnol. Oceanogr. Methods 12, 816–829. doi: 10.4319/lom.2014.12.816
Lawaetz, A. J., and Stedmon, C. A. (2009). Fluorescence intensity calibration using the raman scatter peak of water. Appl. Spectrosc. 63, 936–940. doi: 10.1366/000370209788964548
Lechtenfeld, O. J., Hertkorn, N., Shen, Y., Witt, M., and Benner, R. (2015). Marine sequestration of carbon in bacterial metabolites. Nat. Commun. 6:6711. doi: 10.1038/ncomms7711
Minor, E. C., Wakeham, S. G., and Lee, C. (2003). Changes in the molecular-level characteristics of sinking marine particles with water column depth. Geochim. Cosmochim. Ac. 67, 4277–4288. doi: 10.1016/S0016-7037(00)00263-1
Mopper, K., Kieber, D. J., and Stubbins, A. (2015). “Marine photochemistry of organic matter: processes and impacts,” in Biogeochemistry of Marine Dissolved Organic Matter, eds D. A. Hansell and C. A. Carlson (San Diego, CA: Academic Press), 390–450.
Moran, M. A., Kujawinski, E. B., Stubbins, A., Fatland, R., Aluwihare, L. I., Buchan, A., et al. (2016). Deciphering ocean carbon in a changing world. Proc. Natl. Acad. Sci. U.S.A. 113, 3143–3151. doi: 10.1073/pnas.1514645113
Murphy, K. R., Stedmon, C. A., Waite, T. D., and Ruiz, G. M. (2008). Distinguishing between terrestrial and autochthonous organic matter sources in marine environments using fluorescence spectroscopy. Mar. Chem. 108, 40–58. doi: 10.1016/j.marchem.2007.10.003
Nelson, N. B., and Gauglitz, J. M. (2016). Optical signatures of dissolved organic matter transformation in the global ocean. Front. Mar. Sci. 2:118. doi: 10.3389/fmars.2015.00118
Netburn, A. N., Kinsey, J. D., Bush, S., Djurhuus, A., Fernandez, J., Hoffman, C. L., et al. (in press). First HOV Alvin study of the pelagic environment at Hydrographer Canyon (NW Atlantic). Deep Sea Res. II. doi: 10.1016/j.dsr2.2017.10.001
Ohno, T. (2002). Fluorescence inner-filtering correction for determining the humification index of dissolved organic matter. Environ. Sci. Tech. 36, 742–746. doi: 10.1021/es0155276
Osburn, C. L., Handsel, L. T., Mikan, M. P., Paerl, H. W., and Montgomery, M. T. (2012). Fluorescence tracking of dissolved and particulate organic matter in a river-dominated estuary. Environ. Sci. Technol. 46, 8628–8636. doi: 10.1021/es3007723
Rochelle-Newall, E. J., and Fisher, T. R. (2002). Production of chromophoric dissolved organic matter fluorescence in marine and estuarine environments: an investigation into the role of phytoplankton. Mar. Chem. 77, 7–21. doi: 10.1016/S0304-4203(01)00072-X
Romera-Castillo, C., Sarmento, H., Álvarez-Salgado, X. A., Gasol, J. M., and Marrasé, C. (2010). Production of chromophoric dissolved organic matter by marine phytoplankton. Limnol. Oceanogr. 55, 446–454. doi: 10.4319/lo.2010.55.3.1466
Romera-Castillo, C., Sarmento, H., Alvarez-Salgado, X. A., Gasol, J. M., and Marrasé, C. (2011). Net production and consumption of fluorescent colored dissolved organic matter by natural bacterial assemblages growing on marine phytoplankton exudates. Appl. Environ. Microbiol. 77, 7490–7498. doi: 10.1128/AEM.00200-11
Saba, G. K., Steinberg, D. K., and Bronk, D. A. (2011). The relative importance of sloppy feeding, excretion, and fecal pellet leaching in the release of dissolved carbon and nitrogen by Acartia tonsa copepods. J. Exp. Mar. Bio. Ecol. 404, 47–56. doi: 10.1016/j.jembe.2011.04.013
Shanks, A. L., and Edmondson, E. W. (1989). Laboratory-made artificial marine snow: a biological model of the real thing. Mar. Biol. 101, 463–470. doi: 10.1007/BF00541648
Sharpless, C. M., and Blough, N. V. (2014). The importance of charge-transfer interactions in determining CDOM optical and phtoochemical properties. Environ. Sci. Proc. Impacts 16, 654–671. doi: 10.1039/c3em00573a
Shimotori, K., Omori, Y., and Hama, T. (2009). Bacterial production of marine humic-like fluorescent dissolved organic matter and its biogeochemical importance. Aquat. Microb. Ecol. 58, 55–66. doi: 10.3354/ame01350
Siegel, D. A., Buesseler, K. O., Behrenfeld, M. J., Benitez-Nelson, C. R., Boss, E., Brzezinski, M. A., et al. (2016). Prediction of the export and fate of global ocean net primary production: the EXPORTS science plan. Front. Mar. Sci. 3:22. doi: 10.3389/fmars.2016.00022
Siegenthaler, U., and Sarmiento, J. L. (1993). Atmospheric carbon dioxide and the ocean. Nature 365, 119–125.
Stedmon, C. A., and Markager, S. (2005). Tracing the production and degradation of autochthonous fractions of dissolved organic matter by fluorescence analysis. Limnol. Oceanogr. 50, 1415–1426. doi: 10.4319/lo.2005.50.5.1415
Stedmon, C. A., and Nelson, N. B. (2015). “The optical properties of DOM in the ocean,” in Biogeochemistry of Marine Dissolved Organic Matter, eds Dennis A. Hansell and Craig A. Carlson (San Diego, CA: Academic Press), 481–508.
Steinberg, D. K., Mooy, B. A. V., Buesseler, K. O., Boyd, P. W., Kobari, T., and Karl, D. M. (2008). Bacterial vs. zooplankton control of sinking particle flux in the ocean's twilight zone. Limnol. Oceanogr. 53, 1327–1338. doi: 10.4319/lo.2008.53.4.1327
Thornton, D. C. O. (2014). Dissolved organic matter (DOM) release by phytoplankton in the contemporary and future ocean. Eur. J. Phycol. 49, 20–46. doi: 10.1080/09670262.2013.875596
Tucker, S. A., Amszi, V. L., and Acree, W. E. (1992). Primary and secondary inner filtering: effect of K2Cr2O7 on fluorescence emission intensities of quinine sulfate. J. Chem. Educ. 69, A8–A12. doi: 10.1021/ed069pA8
Urban-Rich, J., McCarty, J. T., Fernández, D., and Acua, J. L. (2006). Larvaceans and copepods excrete fluorescent dissolved organic matter (FDOM). J. Exp. Mar. Bio. Ecol. 332, 96–105. doi: 10.1016/j.jembe.2005.11.023
Utermöhl, H. (1958). Zur Vervollkommung der quantitativen Phytoplankton Methodik. Mitt. Iinternat. Verin. Limnol. 9, 1–38.
Wakeham, S. G., and Lee, C. (1989). Organic geochemistry of particulate matter in the ocean: the role of particles in oceanic sedimentary cycles. Org. Geochem. 14, 83–96. doi: 10.1016/0146-6380(89)90022-3
Wakeham, S. G., and Lee, C. (1993). “Production, transport, and alteration of particulate organic matter in the marine water column,” in Organic Geochemistry, eds M. H. Engel and S. A. Macko (Boston, MA: Springer), 145–169. doi: 10.1007/978-1-4615-2890-6_6
Wolfbeis, O. S. (1985). “The fluorescence of organic natural products,” in Molecular Luminescence Spectroscopy – Methods and Applications; Part 1, ed S. G. Schulman (New York, NY: John Wiley and Sons), 167–370.
Wünsch, U. J., Murphy, K. R., and Stedmon, C. A. (2015). Fluorescence quantum yields of natural organic matter and organic compounds: implications for the fluorescence-based interpretation of organic matter composition. Front. Mar. Sci. 2:98. doi: 10.3389/fmars.2015.00098
Yamashita, Y., and Tanoue, E. (2003). Chemical characterization of protein-like fluorophores in DOM in relation to aromatic amino acids. Mar. Chem. 82, 255–271. doi: 10.1016/S0304-4203(03)00073-2
Yamashita, Y., and Tanoue, E. (2008). Production of bio-refractory fluorescent dissolved organic matter in the ocean interior. Nat. Geosci. 1, 579–582. doi: 10.1038/ngeo279
Yamashita, Y., Tsujasaki, A., Nishida, T., and Tanoue, E. (2007). Vertical and horizontal distribution of fluorescent dissolved organic matter in the Southern Ocean. Mar. Chem. 106, 498–509. doi: 10.1016/j.marchem.2007.05.004
Keywords: excitation-emission matrix (EEM), base-extracted particulate organic matter (BEPOM), marine snow, aggregates, hydrolytic enzyme activities, phytoplankton, fluorescence
Citation: Kinsey JD, Corradino G, Ziervogel K, Schnetzer A and Osburn CL (2018) Formation of Chromophoric Dissolved Organic Matter by Bacterial Degradation of Phytoplankton-Derived Aggregates. Front. Mar. Sci. 4:430. doi: 10.3389/fmars.2017.00430
Received: 07 July 2017; Accepted: 14 December 2017;
Published: 04 January 2018.
Edited by:
Judith Piontek, GEOMAR Helmholtz Centre for Ocean Research Kiel (HZ), GermanyReviewed by:
Teresa S. Catalá, University of Oldenburg, GermanyYumiko Obayashi, Ehime University, Japan
Copyright © 2018 Kinsey, Corradino, Ziervogel, Schnetzer and Osburn. This is an open-access article distributed under the terms of the Creative Commons Attribution License (CC BY). The use, distribution or reproduction in other forums is permitted, provided the original author(s) or licensor are credited and that the original publication in this journal is cited, in accordance with accepted academic practice. No use, distribution or reproduction is permitted which does not comply with these terms.
*Correspondence: Joanna D. Kinsey, jdkinsey@ncsu.edu