A Conceptual Model for Projecting Coccolithophorid Growth, Calcification and Photosynthetic Carbon Fixation Rates in Response to Global Ocean Change
 Natasha A. Gafar
 Bradley D. Eyre
 Kai G. Schulz
- Centre for Coastal Biogeochemistry, School of Environment Science and Engineering, Southern Cross University, Lismore, NSW, Australia
Temperature, light and carbonate chemistry all influence the growth, calcification and photosynthetic rates of coccolithophores to a similar degree. There have been multiple attempts to project the responses of coccolithophores to changes in carbonate chemistry, but the interaction with light and temperature remains elusive. Here we devise a simple conceptual model to derive a fit equation for coccolithophorid growth, photosynthetic and calcification rates in response to simultaneous changes in carbonate chemistry, temperature and light conditions. The fit equation is able to account for up to 88% of the variability in measured metabolic rates. Equation projections indicate that temperature, light and carbonate chemistry all have different modulating effects on both optimal growth conditions and the sensitivity of responses to extreme environmental conditions. Calculations suggest that a single extreme environmental condition (CO2, temperature, light) will reduce maximum rates regardless of how optimal the other environmental conditions may be. Thus, while the response of coccolithophores to ocean change depends on multiple variables, the one which is least optimal will have the most impact on overall rates. Finally, responses to ocean change are usually reported in terms of cellular rates. However, changes in cellular rates can be a poor predictor for assessing changes in production at the community level. We therefore introduce a new metric, the calcium carbonate production potential (CCPP), which combines the independent effects of changes in growth rate and cellular calcium carbonate content to assess how environmental changes will impact coccolith production. Direct comparison of CO2 impacts on cellular CaCO3 production rates and CCPP shows that while the former is still at 45% of its pre-industrial capacity at 1,000 μatm, the latter is reduced to 10%.
1. Introduction
Coccolithophores are an abundant, ubiquitous component of marine phytoplankton assemblages (McIntyre and Bé, 1967; Charalampopoulou, 2011; Okada and Honjo, unpublished manuscript). As a functional group, coccolithophores have been influencing the Earth's biogeochemical element cycling for over 200 million years (Ridgwell, 2005; de Vargas et al., 2007). These organisms can contribute up to 20% of the total carbon production (calcification plus photosynthesis) in some ecosystems (Poulton et al., 2007, 2010), and up to 50% to the calcium carbonate (CaCO3) content found in Holocene marine sediments (Broecker and Clark, 2009). Furthermore, several coccolithophore species also form extensive, dense blooms that cover up to 10,000 km2 (Holligan et al., 1993a,b). Mass production of coccoliths by coccolithophores feeds-back to the marine carbon cycle by decreasing surface alkalinity and dissolved inorganic carbon in a 2:1 ratio, thus shifting carbonate chemistry toward CO2 (Holligan et al., 1993a; Westbroek et al., 1993). Mass production of coccoliths may also enhance carbon sequestration in deep ocean waters by acting as ballast for organic carbon particles (Beaufort and Heussner, 1999; Armstrong et al., 2002). Finally it is hypothesized that DMSP production by coccolithophore blooms, in particular Emiliania huxleyi, may influence the Earth's albedo (Holligan et al., 1993a). As such, changes in coccolithophore abundance and productivity have the potential to significantly impact both the marine and global carbon cycles (Zondervan et al., 2001; Riebesell et al., 2009).
Since the Industrial Revolution in the late Eighteenth century, human activities started to significantly perturb the natural carbon cycle. Burning of fossil fuels, as well as wide scale deforestation have contributed to an increase in atmospheric partial pressures of carbon dioxide (pCO2) from a pre-industrial level of ~280 μatm to the current level of ~400 μatm (IPCC, 2013a). Atmospheric CO2 levels are projected to reach up to 985 μatm (RCP8.5 scenario) by the end of the century (Caldeira and Wickett, 2005; Orr et al., 2005; IPCC, 2013a). Under these conditions, ocean surface temperatures are projected to increase by as much as 4.8°C (IPCC's RCP8.5 scenario) (IPCC, 2013b). This increase in CO2 and temperature is expected to have significant effects on ocean mixing and stratification which in-turn will impact nutrient and light availability (Bopp et al., 2001; Rost and Riebesell, 2004; Sarmiento et al., 2004). In addition, rising atmospheric CO2 levels are also bound to significantly change the ocean's carbonate chemistry.
An increased uptake of atmospheric CO2 in the surface ocean will result in increased dissolved CO2, bicarbonate () and hydrogen ions (H+)/decreased pH but also in decreased carbonate ion concentrations () (Doney et al., 2009; Schulz et al., 2009). These changes, often termed ocean acidification, are likely to have significant effects on coccolithophore physiology (growth, calcification and photosynthesis), which has important implications for coccolithophore related global biogeochemical processes (e.g., oceanic CO2 uptake and sequestration) (Bopp et al., 2001; Sarmiento et al., 2004).
Previous studies (i.e., Bach et al., 2011; Sett et al., 2014; Bach et al., 2015), have established a unifying frame work where coccolithophore responses to carbonate chemistry can be described as a balance between the fertilizing effects of substrate (CO2 and ) availability (Bach et al., 2011) and the inhibiting effects of hydrogen ions (H+) (Bach et al., 2011, 2013). At one end of the scale, process-based numerical models describing intra-cellular inorganic carbon fluxes in response to changes in seawater carbonate chemistry and the resulting effects on coccolithophorid metabolic rates have been developed using this framework (Holtz et al., 2015a,b). On the other side of the complexity spectrum, there are simple fit equations based on this conceptual framework describing metabolic rates as being balanced by substrate availability, and inhibition by rising H+ (Bach et al., 2011, 2015).
The downside of current equations however is that, unlike some numerical models, they lack the ability to describe responses to the interactive effects of other environmental variables, in particular temperature and light. For example at the same CO2 level, calcification can vary from 10 to 54 pg C d−1 depending on light (50–800 μmol photons m−2s−1) and from 15 to 30 pg C d−1 depending on temperature (15–25°C) (Figure 1). The influence of temperature and light on metabolic rates are as large as or even larger than the influence of CO2. A single analytical fit equation to fit measured response rates at various temperature, light and carbonate chemistry conditions would be useful to assess species specific sensitivities, optima and tipping points under future environmental conditions. Furthermore, comparing different species would allow exploration of the effects of ocean change on future coccolithophore community composition.
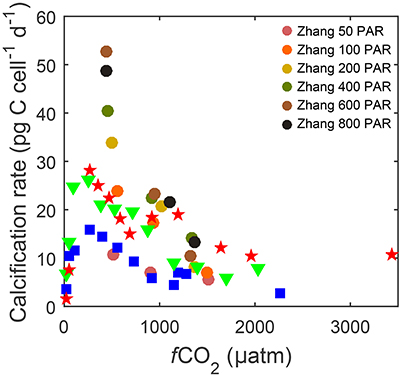
Figure 1. Calcification rates for Gephyrocapsa oceanica strain RCC1303 over a wide range of fCO2 levels. Data describing responses to CO2 under different temperatures [15 (□), 20 (▽) and 25°C (⋆)] and 150 μmol photons m−2s−1 were taken from Sett et al. (2014), while data describing responses under different photosynthetically active radiation (PAR) levels (50–800 μmol photons m−2s−1 ○) at ~500, ~1,000, and ~1,500 μatm fCO2 and 20°C were taken from Zhang et al. (2015).
Here we develop a simple conceptual model for predicting coccolithophorid growth, photosynthesis and calcification in response to changes in temperature, light and carbonate chemistry. The majority of work on these effects comes from two species, Emiliania huxleyi and Gephyrocapsa oceanica. E. huxleyi has decoupled and coupled carbonate chemistry system data as well as temperature response data available for a single strain (i.e., Bach et al., 2011, 2013; Sett et al., 2014). However, there is no light response data for this same strain. Meanwhile for a single G. oceanica strain, temperature, light and coupled carbonate chemistry response data are available, but no decoupled data exists (Sett et al., 2014; Zhang et al., 2015). Decoupled carbonate chemistry data (changing CO2 at constant pH) has been used to develop the concept of substrate stimulation and proton inhibition (Bach et al., 2011, 2013). However, it is not necessary to describe responses to ongoing ocean change in a coupled system. Hence it was decided that G. oceanica would be used as it had light, temperature and carbonate chemistry data available for the same strain. The resulting analytical equation was used to fit measured metabolic rates of the G. oceanica strain, to assess the interactive effects of temperature, light and carbonate chemistry on growth, calcification and photosynthesis. The equation was also used to test two additional concepts. In the first it was used to assess if comparable responses would be obtained from two, widely used, carbonate chemistry manipulation methods. In one method, total alkalinity (TA) was kept constant in the other dissolved inorganic carbon (DIC) was kept constant. In the second the equation was used to assess how changes in cellular calcification rates impact calcium carbonate production on the community level.
2. Methods
2.1. Data Collection
Published studies by Sett et al. (2014) and Zhang et al. (2015) on the effects of changes in carbonate chemistry on a single strain of Gephyrocapsa oceanica RCC1303 were used to compile a uniform dataset containing: Specific growth rates μ (day−1), particulate organic and inorganic carbon (POC and PIC) quotas (pg C cell−1) and production rates (pg C day−1), fCO2 (μatm), [CO2] (μmol kg−1), [] (μmol kg−1), [] (μmol kg−1), pHT (on the total scale), total alkalinity/TA (μmol kg−1), dissolved inorganic carbon/DIC (μmol kg−1), photosynthetic active radiation/PAR (μmol photons m−2s−1) and temperature (°C). Growth rates for all studies were based on specific growth rate μ (d−1).
where Ct and C0 are cell concentrations at the end and beginning of the experiment during exponential growth, respectively, and d is the duration of incubation in days. Calcification and photosynthetic rates were obtained by multiplying growth rates with cellular quotas of particulate inorganic or particulate organic carbon, respectively. Two studies were chosen as they utilized the same strain (RCC1303) and provided light (six levels) and temperature (3 levels) interactions over a broad carbonate chemistry range (in total 54 data points). Two additional studies by Zondervan et al. (2001) and Rickaby et al. (2010) on two other G. oceanica strains PC7/1 and Pz3.1 were not included. Data were not included as they were providing no additional light, temperature or CO2 coverage, but would increase unexplained variance due to strain-specific responses (compare Langer et al., 2009).
2.2. Carbonate Chemistry Standardization
Carbonate chemistry was standardized using CO2SYS (Lewis et al., 1998) and the stoichiometric equilibrium constants K1 and K2 for carbonic acid determined by Lueker et al. (2000), KS for sulphuric acid determined by Dickson et al. (1990) and KB for boric acid following Uppström (1974). Calculated pH is reported on the total scale. As input parameters temperature, salinity, phosphate concentrations and original (quality controlled) carbonate chemistry measurements (dissolved inorganic carbon/DIC and total alkalinity/TA) of the original studies were used. Any replicate values within a single treatment level were averaged prior to re-calculations (See Table S1 for the final corrected and standardized dataset).
2.3. Previous Efforts to Fit Coccolithophorid Performance
The first efforts to fit measured changes in coccolithophorid metabolic rates in response to changes in carbonate chemistry (Bach et al., 2011) were a modified Michaelis-Menten equation augmented by a negative sensitivity constant (s), with physiological rates solely a function of CO2 fugacity (fCO2)
where V denotes growth or organic and inorganic carbon fixation rates, X (pg C cell−1 day−1 or day−1) and Y (μmol kg−1) the theoretical maximum rate of the Michaelis-Menten term and the fCO2 at which maximum rates are half-saturated, respectively, and s (μmol−1 kg) a negative linear term to account for the observed negative effects of increasing fCO2.
This analytical equation was later modified and improved for fitting calcification rates in Bach et al. (2015). Although also a modified Michaelis-Menten equation, hydrogen ions (H+), rather than fCO2, had been identified as the actual inhibiting factor influencing biological rates. Additionally, the substrate analog of fCO2 was replaced with bicarbonate () which is considered the primary substrate for calcification and photosynthesis (Rokitta and Rost, 2012; Kottmeier et al., 2014, 2016a). Therefore, rather than depending solely upon fCO2, metabolic rates were now dependent upon the concentration of bicarbonate ions (), with the addition of two negative terms to account for the limiting and inhibiting effects of relatively low CO2 and high hydrogen ion (H+) concentrations, respectively
where a (dimensionless) and b (mol kg−1) represent stimulation of metabolic rates by increasing [], c (kg mol−1) parameterizes the indirect effects of CO2 limitation on rates, and d (kg mol−1) describes the linear negative effect of increasing [H+]. The exponential term in the above equation represents a minimum requirement for CO2, with strong influence on observed rates at relatively low concentrations and negligible influence above a certain threshold. In the above analytical equations the fitting coefficients (X, Y, a, b, c, and d) will change depending on the temperature and light conditions. Considering that temperature and light have been observed to effect physiological responses to a similar degree as changing carbonate chemistry (Figure 1), developing fit equations able to account for the combined effects of temperature, light and carbonate chemistry would be necessary to project responses to future ocean conditions.
2.4. Development of a Conceptual Model of the Interactive Effects of Carbonate Chemistry, Temperature, and Light on Coccolithophorid Performance
The starting point for development of the conceptual model was Megard et al. (1984) and their equation on the response of photosynthesis to irradiance. Their pigment traps (T) were assumed to capture the light ultimately driving photosynthesis (compare Figure 2A). The traps have three states: a reactive state (T') able to capture light (I) at a rate Ik+1T′, an activated state (T*) able to catalyze photosynthesis to produce oxygen at a rate k+2T*, and an inhibited state (T**) encountered when excess light is absorbed by an activated trap which occurs at a rate Ik+3T*. The trap is assumed to revert from the inhibited state at a constant rate k−3T**. The activated state (T*) can also revert back to the reactive state (T′) by a number of processes (i.e., fluorescence or heat) at a constant rate k−1T*. Using this physiological concept, they were able to reproduce both the limiting and inhibiting effects of light on photosynthesis.
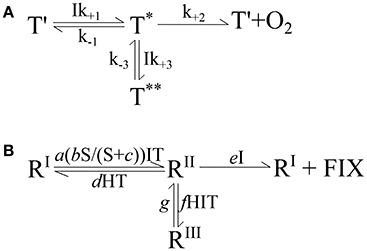
Figure 2. (A) The conceptual model developed by Megard et al. (1984) to describe the response of photosynthesis to irradiance. See section 2.4 for details. (B) Expanded conceptual model describing the effects of carbonate chemistry, i.e., substrate and proton concentrations (S, H), temperature (T), and light intensity (I) on calcification, photosynthetic and growth rates. See text in section 2.4.4 for details. R denotes a reaction system essential to the cellular process, RI is the reactive state, RII is the activated state, RIII is the inhibited state, FIX is fixed carbon or growth (μ) in general and a-g are forward and reverse reaction rate constants.
In the following paragraphs we expand this simple conceptual model to include observed effects of changes in temperature and carbonate chemistry (i.e., substrate and inhibitor availability). We also expand the conceptual model to predict calcification and growth rates as well as photosynthetic rates.
2.4.1. Effects of Light on Cellular Processes
Photosynthesis, calcification and growth rates depend on light availability. photosynthetic rates increase with light availability up to a saturating point after which they begin to decline due to the damaging effects of light inhibition (Powles, 1984; Larsen, 2012). Similarly the rate of coccolithophore calcification has been observed to significantly increase with irradiance from low (<50 μmol photons m−2s−1) to saturating intensities (>150 μmol photons m−2s−1) (Nimer and Merrett, 1993; Feng et al., 2008), as well as growth rates between 50 and 800 μmol photons m−2s−1 (Zhang et al., 2015). In this experimental light range, inhibition of growth and calcification rates by high light is not as pronounced as for photosynthetic rates, but would eventually occur with increasing light intensity. Thus, it can be concluded that the effects of light for all rates largely follow the non-linear stimulation-inhibition concept of Megard.
2.4.2. Effects of Temperature on Cellular Processes
Increasing temperature, accelerates coccolithophore metabolic rates up to an optimum level (i.e., Eppley, 1972; Helm et al., 2007). Beyond this level, with temperatures continuing to increase, metabolic rates start decreasing down to a point where metabolism can completely shut down (reviewed in Pörtner and Farrell, 2008; Larsen, 2012). This simple stimulation-inhibition observation of temperature is similar to that of light. As such, the effects of temperature are also captured by Megard's conceptual model.
2.4.3. Effects of Carbonate Chemistry on Cellular Processes
In an ocean acidification scenario (increasing CO2 and decreasing pH) all rates increase to an optimum before declining again as conditions become more unfavorable (Bach et al., 2011, 2013). In a decoupled system (increasing CO2 and constant pH) rates increase and then level off in a Michaelis-Menten fashion (Bach et al., 2011, 2013). These effects can be understood as stimulation by substrate (CO2 + ) and inhibition by H+. How this will be incorporated into a conceptual model together with light and temperature will be discussed in the following sections.
2.4.4. Using a Single Conceptual Model for Growth, Calcification, and Photosynthesis
Both photosynthesis and calcification work in a similar way in that both are driven by substrate and enzyme/template interactions (i.e., RuBisCO with CO2 in photosynthesis, and Ca2+ and with with an organic template and polysaccharides in calcification) (Paasche, 2001; Farazdaghi, 2011). Although technically a substrate, Ca2+ can practically be considered non-limiting as its concentrations in seawater are typically orders of magnitude higher than that of dissolved inorganic carbon. In fact Ca2+ has only been observed to limit calcification at un-naturally low concentrations (Herfort et al., 2004; Trimborn et al., 2007; von Dassow et al., 2012), so its availability is unlikely to affect reaction kinetics. As such, the same reaction system-substrate concept can be used for either calcification, photosynthesis or growth rates in general, the latter depending on photosynthetic performance.
An important assumption made for the conceptual model at this point is that the concentrations of the relevant carbonate chemistry species (H+, , CO2) inside the relevant cell compartments (i.e., chloroplast for photosynthesis and coccolith production vesicle for calcification) scale with bulk seawater concentrations outside the cell. That means that decreasing seawater concentrations result in a respective decrease inside the cell and vice-versa (i.e., Coleman and Colman, 1981). Evidence for a connection of the inorganic carbon pool in seawater and inside phytoplankton cells stems from conceptual models relating supply and demand to observed stable carbon isotope fractionation (e.g., Sharkey and Berry, 1985; Laws et al., 1995; Burkhardt et al., 1999; Keller and Morel, 1999). While a multitude of studies have shown that phytoplankton species actively take up both CO2 and (e.g., Burkhardt et al., 2001; Rost et al., 2003), the internal pools are significantly influenced by passive diffusion of CO2 into and out of the cell which theoretically scales linearly with extracellular CO2 concentrations (e.g., Schulz et al., 2007 and references therein). Concerning proton concentrations, there is experimental evidence that bulk seawater pH can influence internal concentrations in a linear fashion (Suffrian et al., 2011), probably mediated by voltage-gated H+ channels (Taylor et al., 2011). Hence, and given the fact that there are no direct measurements on the exact magnitude of external in relation to internal changes, a linear relationship was assumed.
The next step was to decide how to implement the effects of light, temperature and carbonate chemistry within the conceptual model (See Figure 2B). The effects of light and temperature are very simple with both a stimulating and an inhibiting effect on rates. Both light and temperature could be said to affect all reaction steps. However, it was found that applying temperature and light dependency to all reactions resulted in canceling out of terms and that the best compromise for light and temperature fits required a separation of temperature and light on at least one reaction step in the model. To implement the effects of carbonate chemistry into the model, CO2 and were combined and defined as substrate (S). While, the proportion of CO2 and utilized by growth, photosynthesis and calcification strongly depends upon carbonate chemistry conditions, for the sake of keeping the concept simple, it was assumed that all rates depended upon the combination of CO2 and and had no preference for one or the other (Kottmeier et al., 2014). It should be noted that, owing to its higher concentrations, this assumption gives more weight to changes in . The stimulating effects of substrate availability on rates can then be described as a Michaelis-Menten saturation curve (Bach et al., 2011). The inhibiting effects of rising H+ are slightly more complicated in that they are balanced, to a degree, by the positive effects of rising substrate concentrations (Bach et al., 2011). Because of this, two terms were required to provide an effective representation of H+ effects across the whole CO2 range. As carbonate chemistry is dependant on temperature, all reactions with carbonate chemistry dependencies also had temperature dependencies. Finally, it was found that applying temperature, light and carbonate chemistry dependencies to both forward and reverse reactions for inhibition resulted in a canceling out of terms and, as such, an insensitivity of inhibition to environmental conditions. Because of this, it was decided that the reverse reaction for inhibition would be assumed to be independent of environmental conditions.
In this conceptual model, the transition of the reactive (RI) to activated (RII) state follows a Michaelis-Menten substrate (S) kinetic, stimulated by light (I) and temperature (T), at a rate a(bS/(S+c))ITRI. The activated state (RII) may transition back to the reactive state (RI), depending on the proton concentration (H) and temperature, at a rate dHTRII. Furthermore the activated state can also transition to an inhibited state (RIII) by light, temperature and proton concentrations at a rate fHITRII. The reversal back to the activated state (RII) is at a rate gRIII, insensitive to environmental conditions (similar to Megard et al., 1984). Finally, the activated state can catalyze a reaction (photosynthesis, calcification, or growth in general) producing fixed carbon (FIX), and transition back to the reactive state (RI) in a single step at a rate eIRII, depending upon light.
With the sum of states in this reaction system being constant, i.e., (R) = RI + RII + RIII, the change in each of these three states with time can be expressed by the following three differential equations:
This set of differential equations was solved analytically for steady state conditions, i.e., assuming no change in each of the rates with with time, giving:
where, k2 = dc/ab, k3 = d/ab, k4 = ce/ab, k5 = e/ab, and k6 = f/g. The specific metabolic rate of photosynthesis, calcification or growth based on this equation is MR = e × RII and the theoretical maximum rate of photosynthesis, calcification or growth, k1 = e × R, would occur if the reaction system would be solely in its active state, i.e., where R = RII. Based on this, metabolic rates (MR) of photosynthesis, calcification and growth are
2.4.5. Simplified Equations
Equation (Equation 8) can fit responses to changes in temperature, light and carbonate chemistry at the same time. For situations where only one environmental variable (temperature, light, carbonate chemistry) is variable, with the other two remaining constant, the model can be simplified to:
for describing carbonate chemistry (S, H) responses at constant light intensity and temperature,
for light (I) responses at constant carbonate chemistry and temperature, and
for temperature responses (T) at constant carbonate chemistry and light intensity, with s, i and t denoting respective fit parameters (Table 1).
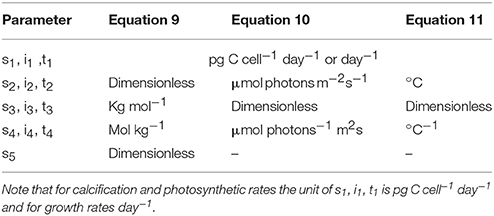
Table 1. Units for the fit coefficients of Equations (9–11).
2.5. Fitting Procedure
Equation (8) was fitted to measured Gephyrocapsa oceanica metabolic rates from Sett et al. (2014) and Zhang et al. (2015) using a non-linear regression procedure with the MATLAB function nlinfit, at corresponding , CO2, and H+ (total scale) concentrations, light availability (I) and incubation temperature (T) as input parameters. Given the order of magnitude differences in fit coefficients, starting conditions were scaled by suitable multipliers for fitting purposes. Data were not weighted and were assumed to have equal uncertainties.
2.6. Temperature and Light Transformation
To reduce skew and allow for rate inhibition below and beyond certain temperature and light conditions, both temperature and light data were transformed. To reduce skew in the light data, a square root transform was applied, where PFD = photon flux density of PAR (photosynthetic active radiation). G. oceanica will grow across a relatively broad range of temperatures with cultures failing to grow at and below 9°C and above 30°C (Rhodes et al., 1995; Buitenhuis et al., 2008; Larsen, 2012). Upper and lower limits for growth were included with the general transform of T = (Tt − 9) × (33 − Tt), where Tt is the temperature of each treatment. In order to accurately express the sharp onset of temperature inhibition in this species, the transform was further modified with a square root transform to give . The temperature transform was compared with the Norberg thermal optimum envelope model (Norberg, 2004)
with optimum (envelope) temperature set to Z = 21, the thermal window to w = 12 and using a scaling factor a = 0.31 to account for the fact that individual species do have maximum rates below the orginial Eppley curve. The shape of both fits was in good agreement [data not shown, but the reader is referred to Figure 2B in Norberg (2004)].
2.7. Equation Fit and Working Limits
The ability of the fit to describe the data in terms of carbonate chemistry, temperature and light was then examined. This initial evaluation focused on assessing if physiological features such as limitation and inhibition were present, as well as how much variability the equation explained. Following these tests, the limits of Equation (8) and its fit coefficients (Table 2) in terms of projecting responses outside of the current data range were tested. In the first test all rates were calculated at seven distinct light intensities (10, 50, 100, 200, 800, 1,000, 2,000 μmol photons m−2s−1) over a DIC range of 1,200–3,000 μmol kg−1 at constant TA of 2,350 μmol kg−1 (fCO2 down to 2 μatm and up to 5,000 μatm) and a temperature range of 9–33°C. In the second test rates were calculated at seven distinct temperatures (10, 12, 16, 20, 24, 28, 32°C) over a DIC range of 1,200–3,000 μmol kg−1 at constant TA of 2,350 μmol kg−1 (fCO2 down to 2 μatm and up to 5,000 μatm) and light intensities of 10–2,500 μmol photons m−2s−1. In the final test rates were calculated at six distinct fCO2 levels (50, 200, 400, 1,000, 2,000, 3,000 μatm) over a temperature range of 9–33°C and light intensities between 10 and 2,500 μmol photons m−2s−1. The results of all tests were visualized using contour plots. These plots were then used to define environmental working limits for equation 8 and its fit coefficients (Table 2).
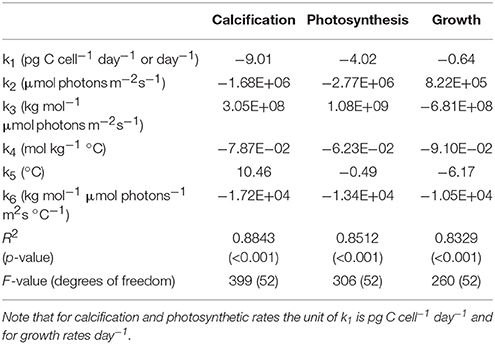
Table 2. Fit coefficients (k1, k2, k3, k4, k5, k6), R2, p-values, F-values and degrees of freedom obtained from fit Equation (8) for calcification (pg C cell−1 d−1), photosynthesis (pg C cell−1 d−1) and growth rate (d−1) fits to all data of Sett et al. (2014) and Zhang et al. (2015).
2.8. Interaction of Temperature, Light and Carbonate Chemistry in Modulating Physiological Rates
Optimum CO2, light and temperature conditions, maximum rates (Vmax) and CO2, temperature and light conditions at which rates are half-saturated or half-inhibited ( sat and inhib respectively) were calculated and assessed for photosynthetic, calcification and growth rates using Equation (8) and the individual fit coefficients (Table 2).
2.9. Coupled and Decoupled Carbonate Systems
In experimentally decoupled carbonate systems DIC concentrations increase while [H+] remains constant (Bach et al., 2013). This results in a saturation curve response with no H+ inhibition. In coupled systems DIC and H+ concentrations increase together resulting in an optimum curve response (Sett et al., 2014). The fit equation was designed to fit responses to both coupled and decoupled carbonate chemistry. However, no decoupled data currently exists for G. oceanica. In order to test if Equation (8) could describe responses for coupled and decoupled carbonate chemistry we fitted the equation to data on coupled and decoupled E. huxleyi experiments as in Bach et al. (2015). All data was first standardized following procedures described in section 2.2. The resulting fit coefficients were used to create a contour plot describing the effect of coupled (constant TA) and decoupled (varying TA) carbonate chemistry on projected calcification rates of E. huxleyi.
2.10. TA vs. DIC Manipulation
The two main forms of carbonate chemistry manipulation in experimental incubations are changing DIC at constant TA (DIC manipulation = CO2 gas bubbling, combined additions of Na2CO3 and acid, or additions of CO2 enriched seawater), and changing TA at constant DIC (TA manipulation = acid/base addition) in a closed system. These two approaches typically produce relatively comparable changes in carbonate chemistry. To examine potential effects of the two manipulation methods on measured metabolic rates, two scenarios were devised at constant light of 150 μmol photons m−2s−1 and a temperature of 20°C. In one TA was set to a constant concentration of 2,350 μmol kg−1 and DIC was varied to produce a CO2 range of 50–3,000 μatm. In the other DIC was set to a constant concentration of 2,069 μmol kg−1 and TA was varied to produce a CO2 range of 50–3,000 μatm. That way both scenarios have exactly the same carbonate chemistry at 400 μatm (TA = 2,350 μmol kg−1 and DIC = 2,082 μmol kg−1) (Figure 3). Calculated H+, and CO2 (using K1 and K2 from Lueker et al., 2000) of both scenarios were then used to project physiological rates using Equation (8) (at a constant light of 150 μmol photons m−2s−1 and temperature of 20°C) and fit coefficients in Table 2.
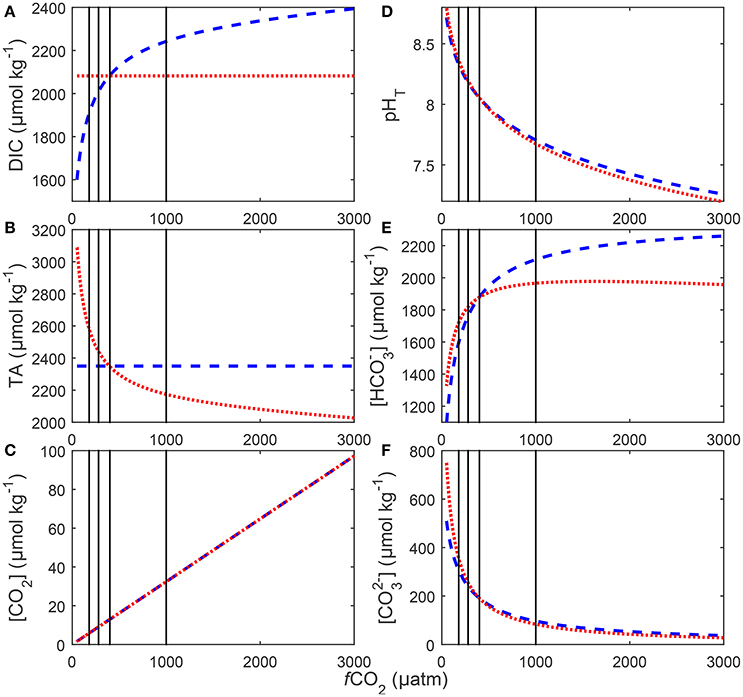
Figure 3. Redistributions in seawater carbonate chemistry in response to changes in DIC at a constant TA (blue), and to changes in TA at a constant DIC (red). Shown changes are (A) DIC, (B) TA, (C) [CO2], (D) pH on the total scale, (E) [] and (F) []. Carbonate chemistry for each scenario was calculated at a temperature of 20°C and salinity a of 35 using stoichiometric equilibrium constants for carbonic acid determined by Lueker et al. (2000). Black lines indicate atmospheric CO2 concentrations representing glacial (~180 μatm), pre-industrial (~280 μatm), current (~400 μatm) and projected values for the year 2100 (~1,000 μatm).
2.11. CaCO3 Production Potential
The response of coccolithophores to ocean change is typically measured using cellular production rates. However, in unicellular, asexually dividing organisms cellular production rates are affected by cellular quotas and cellular division rates. As such the same metabolic rate can be observed for different combinations of cellular quotas and growth rates. For instance, the same cellular calcification rate of 18 pg C cell−1 day−1 would be observed for a cell with a growth rate of 0.9 d−1 and a CaCO3 quota of 20 pg C cell−1, and a growth rate of 1 d−1 and a CaCO3 quota of 18 pg C cell−1. To examine how these cellular differences translate to the community level we extrapolated changes in the above communities over seven days, assessing their production potential. Using a known starting cell count and assuming constant exponential growth, the cellular standing stock can be calculated for each community for each day. The corresponding CaCO3 production of these communities for each day can then be calculated by multiplying daily cellular standing stocks with cellular CaCO3 quotas. The CaCO3 production potential (CCPP) is then the amount of CaCO3 produced within a week of growth. Finally, the cellular CO2 response (pg C cell−1) can be directly compared to those on the community level (pg C produced after 7 days) by normalizing each of them to respective values at, for instance, pre-industrial levels of 280 μatm.
3. Results
3.1. Equation Fit and Working Limits
Equation (8) with its coefficients was able to explain up to 88% of the variability in measured metabolic rates (compare Table 2) across a relatively broad range of carbonate chemistry (25–3,500 μatm), light (50–800 μmol photons m−2s−1) and temperature (15–25°C) conditions. Furthermore, it was able to capture known physiological features like the limitation, stimulation and inhibition of rates by different light (Figure 4) and temperature conditions (data not shown). Equation (8) was also able to describe the effects of substrate limitation and stimulation and hydrogen ion (H+) inhibition on metabolic rates (Figure 5).
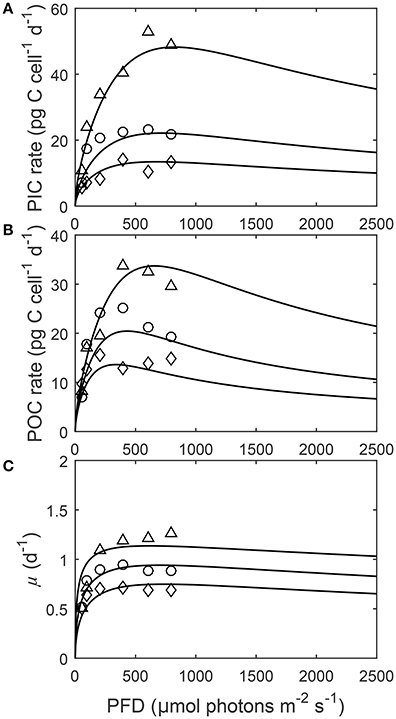
Figure 4. (A) Particulate inorganic carbon (PIC) and (B) particulate organic carbon (POC) production, and (C) growth rates in response to changes in light intensity at three different fCO2 levels at a constant temperature (20°C). Symbols denote measured data by Zhang et al. (2015) at fCO2 levels of ~500 (△), ~1,000 (○), and ~1,500 (◇) μatm and lines represent calculated rates using Equation (8) and fit coefficients in Table 2.
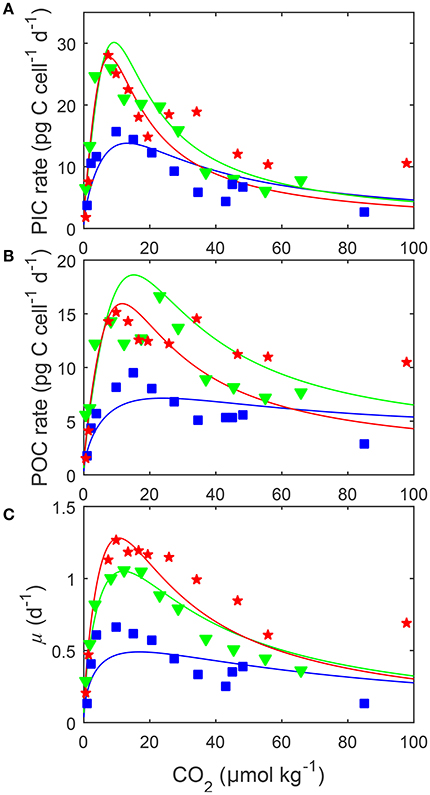
Figure 5. (A) Particulate inorganic carbon (PIC) and (B) particulate organic carbon (POC) production, and (C) growth rates (solid lines) in response to changes in carbonate chemistry, i.e., variable DIC at constant TA, at three different temperatures. Data points denote responses to CO2 under different temperatures [15 (blue □), 20 (green ▽) and 25°C (red ⋆)] and constant light of 150 μmol photons m−2s−1 and were taken from Sett et al. (2014). Solid lines represent calculated rates using Equation (8) and fit coefficients from Table 2. Note that rates were plotted vs. CO2 concentration rather than fugacity as, for the same CO2 availability, temperature changes the latter.
Projecting Equation (8) beyond the range of the input data (i.e., 15< T(°C) >25, 20< fCO2(μatm) >3,500, 50< I(PAR) >800), some limitations became evident at more extreme environmental conditions especially when in combination. While there were reasonable projections for most temperature, fCO2 and light conditions (Figure 6A), both light and CO2 inhibition were no longer observed for photosynthesis or growth rates at temperatures below 12°C and for calcification rates below 11°C (Figure 6C). Similarly, at fCO2 levels above 2,000 μatm for calcification and photosynthesis and above 3,000 μatm for growth, rates were slightly overestimated at combined high temperature-light conditions owing to the appearance of a second temperature optimum (Figure 6B). In addition, estimates for growth rates did not display light limitation at fCO2 levels below 100 μatm. As a result, photosynthetic rates were overestimated at low fCO2 levels. In summary, the working range for the equation is limited to temperatures above 12°C for photosynthetic and growth rates and 11°C for calcification rates, fCO2 levels below 2,000 μatm for calcification and photosynthetic rates, and fCO2 levels of 100–3,000 μatm for growth rates.
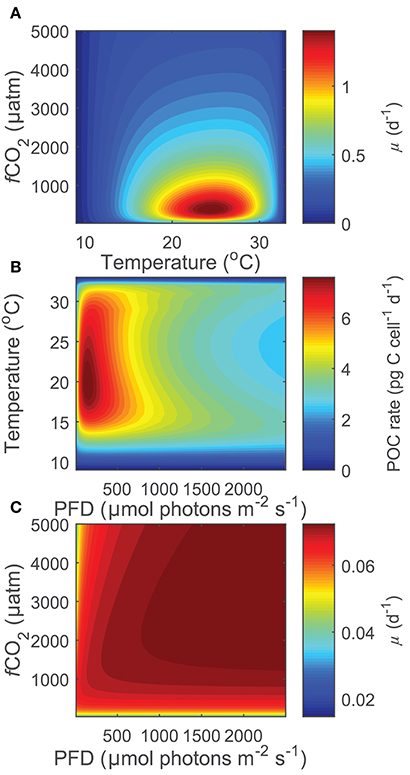
Figure 6. (A) Projected growth rates of Gephyrocapsa oceanica across a wide range of CO2 and temperature conditions at a constant light of 200 μmol photons m−2s−1. Note that rates decrease toward extreme temperatures and fCO2 levels, indicating that the stimulating and inhibiting effects of these two variables are well captured. (B) Projected photosynthetic rates of Gephyrocapsa oceanica across a wide range of temperature and light conditions at a constant fCO2 of 3,000 μatm. Note that rates are slightly overestimated at high temperatures under mid to high light intensities owing to the appearance of a second small temperature optima. (C) Projected growth rates of Gephyrocapsa oceanica across a wide range of CO2 and light conditions at a constant temperature of 10°C. Note that the inhibiting effects of light and fCO2 are not present.
3.2. Interaction of Temperature, Light and Carbonate Chemistry in Modulating Physiological Rates
3.2.1. Light Responses
Depending upon the fCO2 level, increasing light from 50 to 800 μmol photons m−2s−1 increased calcification rates 230%, photosynthetic rates 240% and growth rates 21% (Figure 4). The effect of fCO2 on metabolic rates was strongest between 500 and 800 μmol photons m−2s−1 and decreased with decreasing light availability (Figure 4). Increasing fCO2 lowered light requirements for photosynthesis and calcification but increased light requirements for growth (Figure 4, Table 3). Optimum light levels were lowest for photosynthesis (338–657 μmol photons m−2s−1), moderate for growth (614–735 μmol photons m−2s−1), and highest for calcification (674–825 μmol photons m−2s−1) (Figure 4, Table 3).
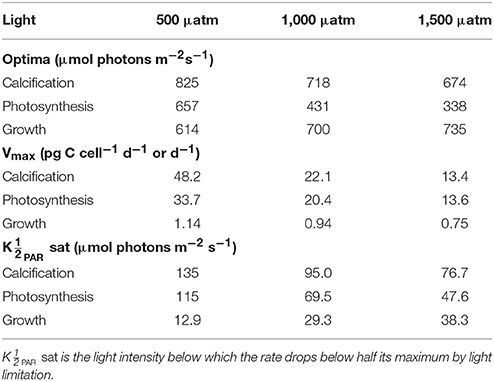
Table 3. Calculated optimum light intensities, maximum rates (Vmax) and light values at constant temperature (20°C) and carbonate chemistry (500, 1,000, and 1,500 μatm) using Equation (8) and fit coefficients from Table 2.
Growth had the lowest light requirements to exceed half maximum rates ( PAR sat) at 12.9–38.3 μmol photons m−2s−1, with photosynthesis requiring 47.6–115.2 μmol photons m−2 s−1, and calcification requiring 76.7–134.7 μmol photons m−2s−1 (Figure 4, Table 3). Light requirements to exceed half maximum rates ( PAR sat) decreased with increasing fCO2 for calcification and photosynthesis but increased with increasing fCO2 for growth (Table 3). Light inhibition for this species was not pronounced within the measured data range of 50–800 μmol photons m−2s−1. As a result, rates calculated by the fit did not decrease below half of maximum ( PAR inhib) within our working light range of 0–2,500 μmol photons m−2s−1.
3.2.2. Temperature Responses
Depending on the CO2 level, increasing temperature from 15 to 25°C more than doubled all metabolic rates (Figure 5). The effect of temperature on metabolic rates was highest in the optimal CO2 range between 5 and 30 μmol kg−1 and decreased toward more extreme CO2 concentrations (Figure 5). Photosynthesis and calcification had maximum rates of 19.0 and 28.4 (pg C d−1) at temperatures of approximately 23.0°C while growth rates had maximum rates of 1.31 (d−1) at temperatures of approximately 24.5°C (Table 4). Temperatures at which rates were half saturated ( Temp sat) and half inhibited ( Temp inhib) were between 15–17°C and 29–31°C, respectively, for all rates (Table 4).
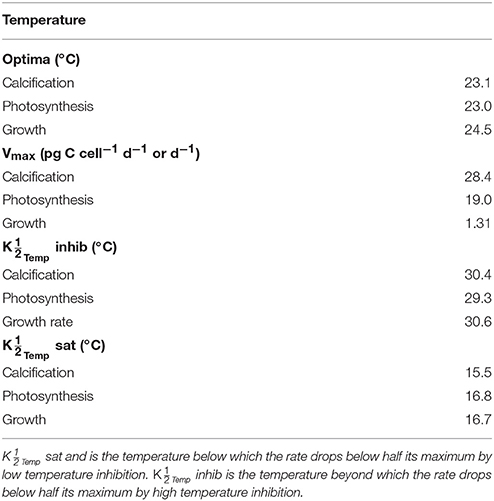
Table 4. Calculated optimum temperatures, maximum rates (Vmax) and temperature values at constant carbonate chemistry (400 μatm) and light (150 μmol photons m−2s−1) using Equation (8) and fit coefficients from Table 2.
3.2.3. Effects of Carbonate Chemistry on Cellular Processes
By including terms for carbonate chemistry (i.e., S and H) Equation (8) was able to describe the limitation and stimulation of metabolic rates at sub-saturating substrate concentrations, as well as the inhibition of rates by increasing H+ concentrations (Figure 5). By including terms for temperature, Equation (8) was also able to describe how the effects of limitation, stimulation and inhibition were modulated by temperature (Figure 5). Optimum CO2 concentrations required for growth, photosynthesis and calcification showed a slight tendency toward lower CO2 at higher temperatures (Table 5, Figure 5). Optimum CO2 concentrations also varied slightly between the different processes with optimum calcification observed at 10.0 ± 2.8 μmol kg−1, optimum photosynthesis at 16.9 ± 6.4 μmol kg−1, and optimum growth rates at 13.1 ± 3.3 μmol kg−1 (Table 5). The CO2 concentrations at which rates were half saturated ( CO2 sat) displayed very little change with varying temperature (Table 5). The CO2 concentration at which rates were half-inhibited by increasing H+ levels ( CO2 inhib) were highest at lower temperatures, indicative of a lower sensitivity (Table 5, Figure 5). Inhibition by increasing H+ concentrations also varied between the processes with CO2 inhib observed at lower CO2 concentrations for calcification, than for photosynthetic or growth rates (Table 5).
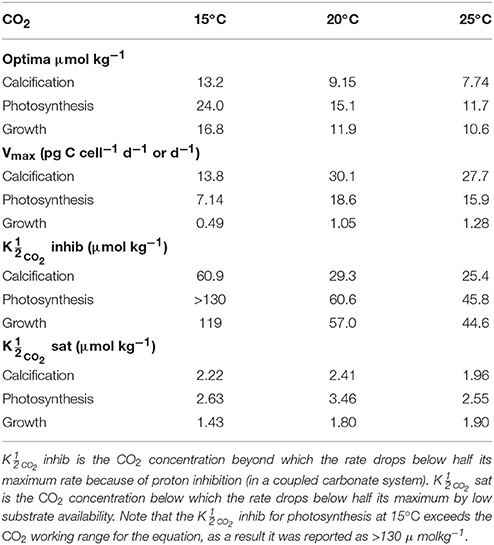
Table 5. Calculated optimum CO2 concentrations, maximum rates (Vmax) and CO2 values at 15, 20, and 25°C, 150 μmol photons m−2s−1 and variable CO2 using Equation (8) and fit coefficients from Table 2.
3.3. Coupled and Decoupled Carbonate Systems
Fitting Equation (8) to cellular calcification rates of E. huxleyi (Bach et al., 2013) demonstrates the ability of the conceptual model to capture both coupled (as in the case for the G. oceanica data sets by Sett et al., 2014; Zhang et al., 2015) and decoupled (Bach et al., 2013) carbonate chemistry conditions. For the case of an ocean acidification scenario, i.e., coupled carbonate chemistry conditions at increasing fCO2 and constant TA, rates are calculated to be low at low fCO2 -low [H+] conditions, optimal at intermediate fCO2 -low [H+] conditions, and low again at high fCO2 -high [H+] conditions (Figure 7, TA constant line). In the decoupled carbonate chemistry scenario, i.e., increasing fCO2 at constant [H+], rates are calculated to be low at low fCO2 conditions, to increase to an optimal point under intermediate fCO2 conditions, and to remain stable with further increases in fCO2 (Figure 7, pH constant line). In both cases the calculated pattern of response agreed with the measured response of calcification rates to coupled and decoupled carbonate chemistry manipulations (Figure 7).
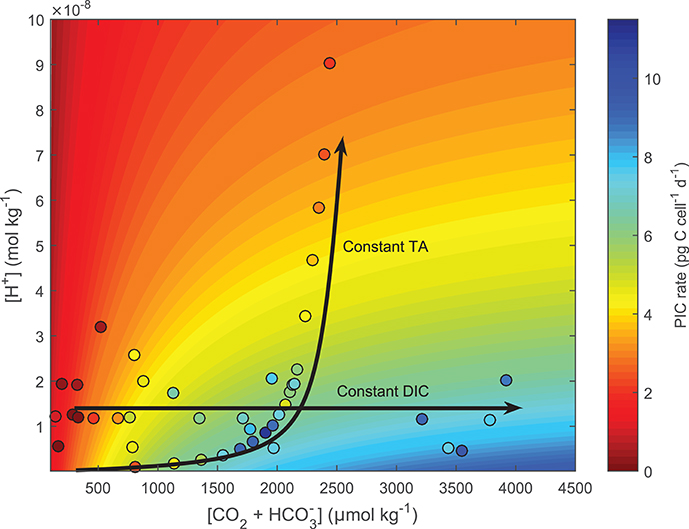
Figure 7. Test of the ability of Equation (8) to fit responses to coupled and decoupled carbonate chemistry systems using E. huxleyi. Contour lines were produced using Equation (8) and fit coefficients derived from E. huxleyi data presented in Bach et al. (2015) (see section 2.9 for details). Colors indicate projected (contour lines) and measured (dots) calcification rates. Lines highlight carbonate chemistry conditions for coupled (constant TA) and decoupled (constant pH) systems.
3.4. DIC vs. TA Manipulation
Calculated physiological rates at constant DIC were consistently lower than at constant TA at fCO2 levels above 500 μatm (Figure 8). Within this range, rates decreased to a similar magnitude with rising fCO2 in both manipulations. As a result a relatively constant offset of overall rates was maintained between the manipulation methods above 500 μatm (Figure 8). Below 500 μatm both methods displayed an optimum curve response to rising fCO2. However, optima were shifted toward lower CO2 levels in the constant DIC manipulations versus the constant TA ones (Figure 8). Calcification and photosynthesis displayed significantly higher Vmax and growth a slightly higher Vmax in the DIC constant treatment relative to the TA constant one (Figure 8).
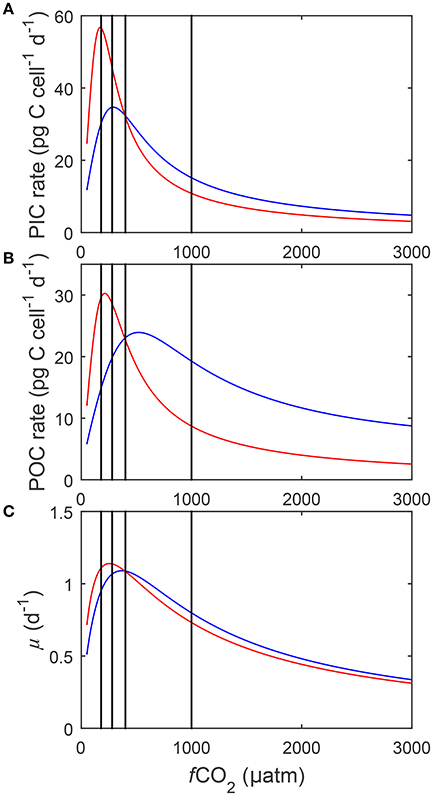
Figure 8. Calculated (A) particulate inorganic carbon (PIC) and (B) particulate organic carbon (POC) production, and (C) growth rates (solid lines) in response to changes in DIC at a constant TA (blue), and to changes in TA at a constant DIC (red) at 20°C and 150 μmol photons m−2s−1 (See Figure 3). Black lines indicate atmospheric CO2 levels representing glacial (~180 μatm), pre-industrial (~280 μatm), current (~400 μatm) and projected values for the year 2100 (~1,000 μatm). Rates were calculated using Equation (8) and fit coefficients in Table 2.
There were no significant differences in [CO2], pH, and [] calculated between the two manipulation methods (compare Figure 3). Concentrations in were slightly higher in the TA constant manipulation below 400 μatm and significantly higher in the DIC constant manipulation above 400 μatm (Figure 3).
3.5. CaCO3 Production Potential (CCPP)
A single cell dividing at a rate μ = 1 d−1 will grow to a community of 1,097 cells within one week. In comparison a single cell dividing at a rate μ = 0.9 d−1 will only grow to a community of 545 cells in a week (Figure 9A). At the same cellular calcification rate of 18 pg PIC cell−1 day−1, the community dividing at μ = 1 d−1 has a CaCO3 production potential (CCPP) of 19.7 ng PIC while the one growing at 0.9 d−1 has a CCPP of 10.9 ng PIC during a week of growth (Figure 9B). To directly compare responses of cellular calcification rates and the CaCO3 production potential (CCPP) of a community to rising fCO2, both measures were normalized to respective values at 280 μatm. For instance, an increase to 1,000 μatm drops cellular calcification rates to about 45% of the rate observed at 280 μatm (Figure 9C) while CCPP of a community would be reduced to 10%.
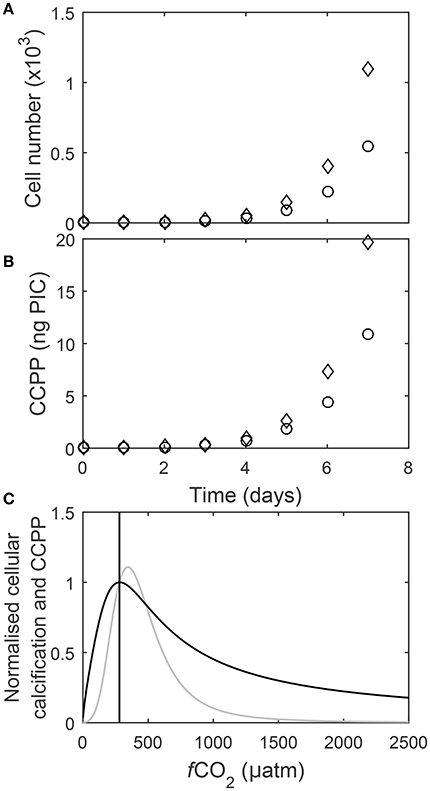
Figure 9. (A) Cell numbers and (B) corresponding CaCO3 production for two calcifying coccolithophore communities, one with a growth rate of 1 d−1 and cellular PIC quota of 18 pg C cell−1 d−1 (◇) and the other with a growth rate of 0.9 d−1 and cellular PIC quota of 20 pg C cell−1 d−1 (○), over seven days assuming a starting cell count of one. Note that for the same cellular calcification rate community CaCO3 production potential after seven days of growth (CCPP) is almost half (~10 ng) for the community with a growth rate of 0.9 d−1 in comparison to the one growing at 1.0 d−1 (~20 ng). (C) Cellular calcification rates (black) and CCPP (gray) after seven days of growth normalized to corresponding values at 280 μatm (line) in response to rising fCO2 at 20°C and 150 μmol photons m−2s−1 (Equation 8 and fit coefficients in Table 2).
4. Discussion
4.1. Equation Fit and Working Limits
Previously, analytical equations would have to run a separate fit for carbonate chemistry effects under each temperature and light condition (i.e., Sett et al., 2014; Zhang et al., 2015). By accounting for combined changes in light, temperature and carbonate chemistry fit Equation (8) was able to explain up to 88% of variability in measured rates. Rates were stimulated by increasing light intensities up to saturating light, beyond this point rates decreased slightly as light became inhibiting (Figure 4). The stimulating effects of light depended upon fCO2, with light having weaker stimulating effects on rates at higher fCO2 levels (Figure 4). Rates were also stimulated by temperature with rates increasing from limiting low temperatures up to an optimum, beyond this point rates decreased as temperatures became inhibiting (Table 4). The magnitude of stimulation by temperature depended upon CO2, with the greatest stimulation by temperature observed in the optimal CO2 range between 5 and 30 μmol kg−1 (Figure 5). Increasing substrate availability at low CO2 resulted in rapid increases in metabolic rates, while increasing H+ at high CO2 resulted in the inhibition and decrease of metabolic rates (Figure 5).
In an attempt to estimate the significance of the observation that individual metabolic rates appear to have different CO2 requirements for optimum rates, and sensitivities concerning half saturation and inhibition (e.g., compare Table 5), a single fit to a combined data-set of normalized (to individual maxima) rates for growth, calcification and photosynthesis was applied. The fact that this single fit explained at best less than half of the variation in the data in comparison to the individual ones suggests that metabolic rates should be treated separately as having specific sensitivities and requirements.
Combinations of extreme environmental values outside the existing experimental data ranges (15< T(°C) <25, 20< fCO2(μatm) <3,500, 50< I(μmol photons m−2 s−1) <800), resulted in a decreased ability of the equation to project physiological responses. Temperatures below 11–12°C resulted in a loss of light and CO2 inhibition, while fCO2 levels above 2,000–3,000 μatm resulted in a slight overestimation of rates at combined high light-temperature. Growth rates at low light intensities and fCO2 levels below 100 μatm lacked light limitation. Acknowledging these limitations, the working range for the current fit is restricted to temperatures above 11°C and fCO2 levels below 2,000 μatm for calcification, above 12°C and fCO2 levels below 3,000 μatm for photosynthetic rates, and above 12°C and between 100 and 3,000 μatm for growth rates. These limitations are most likely the result of model projections well outside the original data range at combinations of high/low temperature, light and CO2. However, within the data range of environmental input parameters, Equation (8) allows calculation and projection of metabolic rates outside the limited experimental combinations of light, temperature and carbonate chemistry.
4.2. Interaction of Light, Temperature and Carbonate Chemistry in Modulating Physiological Rates
Light, temperature and carbonate chemistry have long been considered important factors in influencing metabolic rates (Bopp et al., 2001; Sarmiento et al., 2004; Feng et al., 2008). Metabolic rates in G. oceanica double as temperature increases from 15°C to 25°C, increases fivefold as light increases from 50 to 800 μmol photons m−2s−1, and vary fivefold over a CO2 range of 25–3,500 μatm (Sett et al., 2014; Zhang et al., 2015). Similar effects of temperature, light and CO2 have been observed for another coccolithophore, Emiliania huxleyi, where metabolic rates double as temperature increases from 10°C to 20°C (Sett et al., 2014), vary threefold over a CO2 range of 20–6,000 μatm (Sett et al., 2014), and increases fivefold over a light range of 15–150 μmol photons m−2s−1 (Rost et al., 2002). Based on this information, changes in light and temperature over an environmentally relevant range are able to influence metabolic rates at least as much as broad range carbonate chemistry. In fact when the effects of light and temperature were not included in our fit, (i.e., Equation 9) only 48% of the variability in measured metabolic rates was explained. This supports the notion that some of the discrepancies observed in the response of coccolithophores to ocean acidification are a result of differences in culturing conditions (including temperature, light) between different studies (Hoppe et al., 2011; Raven and Crawfurd, 2012; Rokitta and Rost, 2012; Sett et al., 2014).
Strain may also be contributing to the above mentioned discrepancies. Significant differences have been observed between different strains of the same species when cultured under the same conditions (See Langer et al., 2009; Diner et al., 2015). As such, strain may also be an important factor to be considered. More detailed information on the sensitivity and response of different strains to changing carbonate chemistry, temperature and light would be required before further efforts to account for these strain-specific differences could be made.
4.2.1. Light Responses
Calcification in Gephyrocapsa oceanica required higher light intensities, to reach maximum rates, than photosynthesis for the same fCO2 level (Figure 4, Table 3). In contrast, E. huxleyi appears to saturate at much lower light intensities and shows either no difference in light saturation between processes (Rost et al., 2002), or a higher light requirement for photosynthesis than calcification (van Bleijswijk et al., 1994) depending upon the strain examined. This could reflect a difference in light sensitivity of different metabolic processes between the two species.
Among the three rates, growth had the most rapid increase in rates from low to saturating light, the lowest light requirement to bring rates up to half of their maximum ( PAR sat in Table 3), and the least change in rates from saturating to high light intensities (Figure 4C). As cell division is critical for the survival of a coccolithophore population it appears reasonable to invest into growth over calcification and photosynthesis under sub-optimal light conditions.
Energy requirements for optimal rates declined with increasing fCO2 for calcification and photosynthesis but increased with increasing fCO2 for growth (Table 3). These results partly agree with the extrapolations made in Zhang et al. (2015), where light requirements for all optimum rates, decreased with increasing fCO2. This indicates that as fCO2 levels increase (at least up to 1,500 μatm), less energy is required for carbon production but more is required for maintaining cellular division. Energy requirements for both growth and calcification cover a similar range between 500 and 1,500 fCO2. For photosynthesis however, light requirements for maximum rates are halved at 1,500 μatm in comparison to 500 μatm. It may be that increased fCO2, through increased substrate availability, reduces the need for CO2 concentrating mechanisms (CCMs) (Jin et al., 2013). As CCMs require energy to function, a reduction in their activity would result in a lower energy demand (Barcelos e Ramos et al., 2010), and therefore a lower light requirement for photosynthesis, and to a lesser degree calcification (Jin et al., 2013). The dependence of light responses on fCO2 could have important implications for coccolithophores under future ocean conditions where both fCO2 and light availability is expected to change. As energy requirements for cellular processes decrease, more energy may diverted into resisting the negative effects of increasing fCO2/[H+]. For example more energy may be put into removal of excess H+ from the cell (Barcelos e Ramos et al., 2010).
As fCO2 levels rise and pH becomes more unfavorable, overall lower maximum rates are observed for the same light intensities (Figure 4). This effect, was stronger for calcification and photosynthetic rates than for growth rates (Figure 4, Table 3). Furthermore, rates vary much less with light at higher fCO2 than at lower fCO2 (Figure 4). This may indicate that at unfavorable CO2/pH conditions coccolithophores sacrifice optimal carbon production in order to maintain steady growth rates which are essential for survival.
4.2.2. Temperature Responses
Temperature was observed to influence calcification, photosynthetic and growth rate responses of G. oceanica. Sensitivity of all rates was similar with optima at 23–25°C, half-saturation ( Temp sat) at 15–17°C and half-inhibition ( Temp inhib) at 29–31°C (Table 4). However, this finding should be considered with caution as rate measurements for only three temperatures were available.
Based on the fit, it would appear that temperature does not significantly influence responses to changing carbonate chemistry. At least until temperatures begin to approach the physiological limits for the species. CO2 requirements for both optimal and half-saturation of rates tended to decrease with increasing temperatures (Table 5). However, these changes were generally small (<12 μmol kg−1) most likely not significant in terms of cell physiology (Table 5). This indicates that between 15 and 25°C CO2 requirements, at least from limiting to optimal CO2, are practically insensitive to temperature. In contrast, CO2 concentrations at which rates were half-inhibited by H+ ( CO2 inhib) were influenced by temperature, with higher CO2/H+ concentrations required to inhibit rates at 15°C than between 20 and 25°C (Table 5, Figure 5). The influence of temperature on metabolic rates also varied with temperature, with greater stimulation of rates observed at 20 and 25°C than at 15°C (Table 5, Figure 5). As 15°C is closer to the lower temperature limit for this strain, rates are likely being more strongly dictated by temperature than by changing CO2 in this treatment. In particular, optimum rates appear much less sensitive to CO2 changes, possibly because cultures can not take full advantage of ideal carbonate chemistry conditions when exposed to more unfavorable temperatures. This, combined with the results observed for light, where rates were lower and varied less with light at higher fCO2 than at lower fCO2, indicates that if one of the major factors for growth (i.e., CO2, temperature, light) becomes unfavorable, then rates will be depressed regardless of how optimal the other conditions might be. In other words, it becomes the dominant factor affecting rates. Furthermore, the limiting effects of extreme temperature and CO2 conditions do not appear to be able to be compensated for by improvements in the non-limiting factors.
In terms of temperature-CO2 response, our results (Figure 5) are similar to the fit observations produced by the original equation in Sett et al. (2014). Like Sett et al. (2014) we observed only small shifts in optimum CO2 concentrations with increasing temperature (<12 μmol kg−1) for all rates. So temperature appears to not significantly influence CO2 optima for this species. A point of difference between the equations is that Sett's observed no influence of temperature on inhibition ( CO2 inhib) whereas ours (Equation 8) observed an increase in H+ inhibition with temperature (Table 5). However, our equation gives a non-linear rate change at high CO2, whereas the one in Sett had a relatively linear rate change. So it is likely that this discrepancy is a result of the different fitting capabilities of the two model equations.
4.2.3. Effects of Carbonate Chemistry on Cellular Processes
For a given temperature the CO2 requirement for optimum rates is lowest for calcification and highest for photosynthesis (Figure 5). Additionally, calcification rates are more quickly inhibited toward higher pH than either growth or photosynthetic rates (Table 5, Figure 5). Differences in sensitivity to limitation ( CO2 sat) between the three processes was small (<1 μmol kg−1) and are therefore unlikely to be of physiological significance (Table 5).
Together these results indicate that calcification has a much higher sensitivity to [H+] ( CO2 inhib) than either growth rates or photosynthesis. Similar results have been observed for Emiliania huxleyi, i.e., higher [H+] sensitivities than those for photosynthesis or growth (Bach et al., 2011; Sett et al., 2014). Experiments with Coccolithus pelagicus also found a higher sensitivity of calcification to [H+] (Bach et al., 2015). This suggests that in coccolithophores, calcification is the most sensitive process to elevated [H+]/lowered pH. The sensitivity of calcification to elevated [H+] could be explained by a combination of internal acidification potentially reducing [] in the coccolith production vesicle (CPV) (Bach et al., 2013), and H+ inhibition of transport into the cell (Kottmeier et al., 2016a). In contrast, the sensitivity of other process to [H+] may be less direct. For example high [H+] can decrease uptake and increase CO2 uptake (Kottmeier et al., 2016b). Hence calcification, which is thought more dependent on [], could be expected to decrease while photosynthesis, which can utilize [] and [CO2] more equally, would likely be less impacted. As such it may be that the difference in sensitivity between calcification and photosynthesis is the result of slightly different substrate dependencies.
The results also indicate that calcification has a slightly lower requirement for substrate (CO2 and ), in terms of both optimum and CO2 sat, than either growth rates or photosynthesis. Similar results have been observed for Emiliania huxleyi, with lower optimum [CO2] than those for photosynthesis or growth (Bach et al., 2011; Sett et al., 2014). An alternate explanation is that the higher sensitivity of calcification to [H+] is shifting its substrate optima down to lower CO2/H+ concentrations. This is supported by experiments on E.huxleyi, in which the CO2 optimum for calcification was higher under decoupled carbonate chemistry conditions (increasing CO2 and constant H+) than under coupled carbonate chemistry conditions (increasing CO2 and H+) (Bach et al., 2011, 2013). This again supports the notion that, calcification is the most sensitive process to elevated [H+].
4.3. Coupled and Decoupled Carbonate Systems
To test whether our conceptual model (Equation 8) could correctly fit responses to decoupled carbonate chemistry if data was available, it was applied to a combination of decoupled and coupled data of E. huxleyi used in Bach et al. (2015) at constant light and temperature. For coupled carbonate systems (Constant TA) rates showed an optimum curve response (See constant TA line in Figure 7), while the decoupled carbonate chemistry system showed a Michaelis-Menten response curve (See constant pH line in Figure 7). The mechanisms behind these responses are as follows. In both the coupled and decoupled carbonate chemistry system, low CO2 (substrate) concentrations limit rates (Bach et al., 2011). As a result increased availability of CO2 (substrate) stimulates rates in both scenarios (Figure 7). This stimulating effect decreases as CO2 (substrate) concentrations approach saturating concentrations. It is at this point the two systems begin to diverge. In the coupled carbonate chemistry system as [CO2] further increase so do the concentrations of inhibiting H+ (Bach et al., 2011, 2013). There comes a point where the inhibiting effect of rising [H+] overcomes the stimulating effect of CO2 resulting in a decrease in rates (See constant TA line in Figure 7). Meanwhile in the decoupled carbonate chemistry system, H+ does not change with rising CO2 so rates remain constant with rising CO2 once CO2 saturation is achieved (See constant pH line in Figure 7) (Bach et al., 2011, 2013). Measured calcification rate responses for E. huxleyi under coupled and decoupled carbonate chemistry conditions (See datapoints Figure 7), agree with the projections indicating that the fit equation is able to provide good estimates for both coupled and decoupled carbonate systems.
4.4. DIC vs. TA Manipulation
Higher maximum rates and lower fCO2 optima were calculated for all processes in the constant DIC compared to the constant TA manipulation (Figure 8). This difference in absolute rates seems to be connected to the optimal CO2 level of each process, i.e., the further away it is from 400 μatm (the point at which both manipulation methods were set to result in exactly the same carbonate chemistry), the more pronounced the difference in calculated rates. Below 400 μatm the only substantial difference in carbonate chemistry speciation between the manipulation methods is in the concentration of (Figure 3). The difference in concentration between the methods was greatest at the lowest fCO2 concentrations and decreased as fCO2 levels approached 400 μatm. The optimum of calcification, being at the lowest fCO2 (Figure 8), coincided with the largest difference in [] between the two methods resulting in the most substantial difference in calculated rates (Figure 3). The optimum for photosynthesis, being slightly higher, occurred at a lower difference which resulted in a lower difference in calculated rates. Finally the optimum for growth occurred at the highest fCO2 levels where there was comparatively little difference in [] between the methods resulting in little differences in calculated rates. As such it is likely that the differences in overall rate and fCO2 optimum are being driven by differences in [].
Physiological rates at constant DIC were consistently lower than at constant TA at fCO2 levels above 500 μatm (Figure 8). Above 500 μatm the only substantial difference in carbonate chemistry between the manipulation methods was again in the concentration of which was consistently higher in the constant TA manipulation (Figure 3). Higher [] has been shown to be able to compensate for the inhibiting effects of unfavorable H+ (Bach et al., 2013). As such the TA manipulation, with higher [] at the same fCO2 when above 400 μatm, would be expected to have higher overall rates.
A significant impact of differing concentrations on measured metabolic rates in constant DIC versus constant TA manipulations have previously been estimated to occur below 80 and higher than 700 μatm (Schulz et al., 2009). Here, however, it was found that the further the optimum CO2 of a process is away from 400 μatm (the point at which both manipulation methods were set to result in exactly the same carbonate chemistry), the larger the differences can become. This will be difficult to detect experimentally, however, when not employing a larger fCO2 treatment range with relatively high resolution, although certain evidence appears to exist for Emiliania huxleyi (Hoppe et al., 2011). It is reiterated though that overall response patterns to fCO2 are not affected by the carbonate chemistry manipulation method chosen.
4.5. Community Calcification Potential
Potential impacts of ocean acidification on coccolithophorid calcification is typically assessed by comparing changes in cellular calcification rates and PIC:POC ratios. Calcification rates however, depend on both cellular growth rates and CaCO3 quotas which usually change independently. In two communities with identical cellular calcification rates, the one with the higher growth rate will produce twice the cellular standing stock and 1.8 times the CaCO3 as the community with the lower growth rate (Figures 9A,B). This exercise illustrates that when assessing potential impacts on communities, growth rates are key. This is supported by the recent finding that the ability of coccolithophores to form blooms can be severely impacted toward higher CO2 levels (Riebesell et al., 2017).
To assess the impact of increasing fCO2 on calcification of coccolithophorids on the community level it appears crucial to explicitly factor in cellular growth rates and use a measure like the CaCO3 community production potential (CCPP), for instance for a growth period of seven days. A direct comparison between CCPP and cellular calcification rates in response to increasing fCO2 is then obtained by normalizing them to respective values for, for instance, pre-industrial levels of 280 μatm. Normalized CCPP had a slightly higher fCO2 optimum (at about 345 μatm) than normalized cellular calcification rates (at about 282 μatm) (Figure 9C). Furthermore, normalized CCPP exceeded pre-industrial carbon production over a range of ~280–500 μatm (Figure 9C). However, normalized CCPP decreases much more rapidly above and below this optimum fCO2 than normalized cellular calcification rates (Figure 9C). For example at 750 μatm normalized CCPP is only ~28% compared to pre-industrial levels, while normalized cellular calcification is ~60%. Furthermore, while cellular calcification rates at 1,000 μatm are still about half of those at pre-industrial CO2 levels, CaCO3 community production potential is only about a tenth in comparison to pre-industrial times. Finally, the differences in response between cellular calcification and CCPP become even more pronounced if longer growth periods (i.e., longer than the 7 days chosen here) are considered. This indicates that CaCO3 production by coccolithophores on the global scale could be much more impacted by the end of this century than suggested when comparing changes in cellular calcification rates. The reason for these differences is that CCPP factors in the impacts of growth rates on cell densities in an exponentially growing community whereas cellular calcification rates do not. In fact, CCPP and cellular calcification rates would be identical if changes were due to changes in CaCO3 quotas only with no effect on growth rates. As this is clearly not the case, cellular calcification rates can be a poor measure of CaCO3 production capacity at the community level. For future projections it will also be important to factor in other environmental variables as well as species competition and interaction which appears to be a major factor controlling phytoplankton standing stocks in large parts of the ocean (Behrenfeld, 2014).
5. Conclusions
Future global change is expected to impact ocean carbonate chemistry, temperature and light conditions at the same time (IPCC, 2013a). Changes in temperature, carbonate chemistry and light have all been observed to significantly influence growth, calcification and photosynthetic rates of coccolithophores (Bach et al., 2011; Sett et al., 2014; Zhang et al., 2015). The conceptual model and its resulting fit equation developed in this study is able to account for the effects of temperature and light inhibition and limitation, as well as the balance of stimulating (CO2 and ) and inhibiting (H+) effects of changing carbonate chemistry. Therefore, it combines the functionality of previous analytical equations (i.e., Bach et al., 2015) in fitting carbonate chemistry responses with the ability to account for the effects of simultaneous changes in temperature and light conditions. As such this equation represents a step forward in our ability to describe coccolithophore responses to changes in multiple environmental variables. Given the fundamentals of stimulation and inhibition by environmental factors, these equations should also be applicable to other autotrophic organisms for growth and photosynthesis.
Calculations suggest that a single unfavorable growth condition (CO2, temperature, light, nutrients) will control absolute rates and result in decreased sensitivity to changes in other environmental variables. Calculations also suggest that growth, calcification and photosynthesis may have very different sensitivities to [H+], substrate and light availability. Of the three rates calcification was found to be most sensitive to the effects of increasing H+, to have the highest light requirement and the lowest substrate requirement. Finally calculations suggest that cellular calcification rates alone underestimate the sensitivity of coccolithophore production on the community level to changes in fCO2. Therefore we introduce a new metric, CaCO3 production potential (CCPP), which factors in the impact of growth rates on cell densities in an exponentially growing community.
Author Contributions
KS, NG, and BE: Conceived and designed the experiments; NG, Performed the experiments; NG and KS: Analyzed the data; NG, KS, and BE: Wrote the paper.
Conflict of Interest Statement
The authors declare that the research was conducted in the absence of any commercial or financial relationships that could be construed as a potential conflict of interest.
Acknowledgments
This study was funded by the Australian Research Council (ARC) FT120100384 awarded to KS and DP150102092 awarded to BE and KS.
Supplementary Material
The Supplementary Material for this article can be found online at: https://www.frontiersin.org/articles/10.3389/fmars.2017.00433/full#supplementary-material
References
Armstrong, R. A., Lee, C., Hedges, J. I., Honjo, S., and Wakeham, S. G. (2002). A new, mechanistic model for organic carbon fluxes in the ocean based on the quantitative association of POC with ballast minerals. Deep Sea Res. II Top. Stud. Oceanogr. 49, 219–236. doi: 10.1016/S0967-0645(01)00101-1
Bach, L. T., MacKinder, L. C. M., Schulz, K. G., Wheeler, G., Schroeder, D. C., Brownlee, C., et al. (2013). Dissecting the impact of CO2 and pH on the mechanisms of photosynthesis and calcification in the coccolithophore Emiliania huxleyi. New Phytol. 199, 121–134. doi: 10.1111/nph.12225
Bach, L. T., Riebesell, U., Gutowska, M. A., Federwisch, L., and Schulz, K. G. (2015). A unifying concept of coccolithophore sensitivity to changing carbonate chemistry embedded in an ecological framework. Progr. Oceanogr. 135, 125–138. doi: 10.1016/j.pocean.2015.04.012
Bach, L. T., Riebesell, U., and Schulz, K. G. (2011). Distinguishing between the effects of ocean acidification and ocean carbonation in the coccolithophore Emiliania huxleyi. Limnol. Oceanogr. 56, 2040–2050. doi: 10.4319/lo.2011.56.6.2040
Barcelos e Ramos, J., Müller, M. N., and Riebesell, U. (2010). Short-term response of the coccolithophore Emiliania huxleyi to an abrupt change in seawater carbon dioxide concentrations. Biogeosciences 7, 177–186. doi: 10.5194/bg-7-177-2010
Beaufort, L., and Heussner, S. (1999). Coccolithophorids on the continental slope of the Bay of Biscay–production, transport and contribution to mass fluxes. Deep Sea Res. II 46, 2147–2174. doi: 10.1016/S0967-0645(99)00058-2
Behrenfeld, M. J. (2014). Climate-mediated dance of the plankton. Nat. Clim. Change 4, 880–887. doi: 10.1038/nclimate2349
Bopp, L., Monfray, P., Aumont, O., Dufresne, J.-L., Le Treut, H., Madec, G., et al. (2001). Potential impact of climate change on marine export production. Glob. Biogeochem. Cycles 15, 81–99. doi: 10.1029/1999GB001256
Broecker, W., and Clark, E. (2009). Ratio of coccolith CaCO3 to foraminifera CaCO3 in late Holocene deep sea sediments. Paleoceanography 24:PA3205. doi: 10.1029/2009PA001731
Buitenhuis, E. T., Pangerc, T., Franklin, D. J., Le Quèrè, C., and Malin, G. (2008). Growth rates of six coccolithophorid strains as a function of temperature. Limnol. Oceanogr. 53, 1181–1185. doi: 10.4319/lo.2008.53.3.1181
Burkhardt, S., Amoroso, G., Riebesell, U., and Sltemeyer, D. (2001). Co2 and HCO3 uptake in marine diatoms acclimated to different co2 concentrations. Limnol. Oceanogr. 46, 1378–1391. doi: 10.4319/lo.2001.46.6.1378
Burkhardt, S., Riebesell, U., and Zondervan, I. (1999). Effects of growth rate, CO2 concentration, and cell size on the stable carbon isotope fractionation in marine phytoplankton. Geochim. Cosmochimica Acta 63, 3729–3741. doi: 10.1016/S0016-7037(99)00217-3
Caldeira, K., and Wickett, M. E. (2005). Ocean model predictions of chemistry changes from carbon dioxide emissions to the atmosphere and ocean. J. Geophys. Res. 110:C09S04. doi: 10.1029/2004JC002671
Charalampopoulou, A. (2011). Coccolithophores in High Latitude and Polar Regions: Relationships between Community Composition, Calcification and Environmental Factors. Southampton: Doctor of Philosophy, School of Ocean and Earth Science.
Coleman, J. R., and Colman, B. (1981). Inorganic carbon accumulation and photosynthesis in a blue-green alga as a function of external pH. Plant Physiol. 67, 917–921. doi: 10.1104/pp.67.5.917
de Vargas, C., Aubry, M. P., Probert, I., Young, J., Falkowski, P., and Knoll, A. H. (2007). “Origin and evolution of coccolithophores: from coastal hunters to oceanic farmers,” in Evolution of Aquatic Photoautotrophs, book section 12, eds P. Falkowski and A. H. Knoll (New York, NY: Elsevier Academic Press), 251–281.
Dickson, A. G., Wesolowski, D. J., Palmer, D. A., and Mesmer, R. E. (1990). Dissociation constant of bisulfate ion in aqueous sodium chloride solutions to 250°C. J. Phys. Chem. 94, 7978–7985. doi: 10.1021/j100383a042
Diner, R. E., Benner, I., Passow, U., Komada, T., Carpenter, E. J., and Stillman, J. H. (2015). Negative effects of ocean acidification on calcification vary within the coccolithophore genus Calcidiscus. Mar. Biol. 162, 1287–1305. doi: 10.1007/s00227-015-2669-x
Doney, S. C., Fabry, V. J., Feely, R. A., and Kleypas, J. A. (2009). Ocean acidification: the other CO2 problem. Annu. Rev. Mar. Sci. 1, 169–192. doi: 10.1146/annurev.marine.010908.163834
Farazdaghi, H. (2011). The single-process biochemical reaction of Rubisco: a unified theory and model with the effects of irradiance, CO2 and rate-limiting step on the kinetics of C3 and C4 photosynthesis from gas exchange. Biosystems 103, 265–284. doi: 10.1016/j.biosystems.2010.11.004
Feng, Y., Warner, M. E., Zhang, Y., Sun, J., Fu, F.-X., Rose, J. M., et al. (2008). Interactive effects of increased pCO2, temperature and irradiance on the marine coccolithophore Emiliania huxleyi (Prymnesiophyceae). Eur. J. Phycol. 43, 87–98. doi: 10.1080/09670260701664674
Helm, D., Cook, S., Cubillos, J., McMinn, A., and Hallegraeff, G. M. (2007). Growth, Photosynthesis and Temperature Tolerance of Eight Southern Ocean Strains of the Coccolithophorid Emiliania huxleyi. Thesis, Institute of Antarctic and Southern Ocean Studies.
Herfort, L., Loste, E., Meldrum, F., and Thake, B. (2004). Structural and physiological effects of calcium and magnesium in Emiliania huxleyi (Lohmann) Hay and Mohler. J. Struct. Biol. 148, 307–314. doi: 10.1016/j.jsb.2004.07.005
Holligan, P. M., Fernàndez, E., Aiken, J., Balch, W. M., Boyd, P., Burkill, P. H., et al. (1993a). A biogeochemical study of the coccolithophore, Emiliania huxleyi, in the North Atlantic. Glob. Biogeochem. Cycles 7, 879–900.
Holligan, P. M., Groom, S. B., and Harbour, D. S. (1993b). What controls the distribution of the coccolithophore, Emiliania huxleyi, in the North Sea? Fish. Oceanogr. 2, 175–183.
Holtz, L.-M., Wolf-Gladrow, D., and Thoms, S. (2015a). Numerical cell model investigating cellular carbon fluxes in Emiliania huxleyi. J. Theor. Biol. 364, 305–315. doi: 10.1016/j.jtbi.2014.08.040
Holtz, L.-M., Wolf-Gladrow, D., and Thoms, S. (2015b). Simulating the effects of light intensity and carbonate system composition on particulate organic and inorganic carbon production in Emiliania huxleyi. J. Theor. Biol. 372, 192–204. doi: 10.1016/j.jtbi.2015.02.024
Hoppe, C. J. M., Langer, G., and Rost, B. (2011). Emiliania huxleyi shows identical responses to elevated pCO2 in TA and DIC manipulations. J. Exp. Mar. Biol. Ecol. 406, 54–62. doi: 10.1016/j.jembe.2011.06.008
IPCC (2013a). Climate Change 2013: The Physical Science Basis. Contribution of Working Group I to the Fifth Assessment Report of the Intergovernmental Panel on Climate Change. Cambridge, New York, NY: Cambridge University Press.
IPCC (2013b). “Summary for policy makers,” in Climate Change 2013: The Physical Science Basis. Contribution of Working Group I to the Fifth Assessment Report of the Intergovernmental Panel on Climate Change, eds T. F. Stocker, D. Qin, G.-K. Plattner, M. Tignor, S. K. Allen, J. Boschung, A. Nauels, Y. Xia, V. Bex, and P. M. Midgley (Cambridge; New York, NY: Cambridge University Press), 1–27.
Jin, P., Gao, K., and Beardall, J. (2013). Evolutionary responses of a coccolithophorid Gephyrocapsa oceanica to ocean acidification. Evolution 67, 1869–1878. doi: 10.1111/evo.12112
Keller, K., and Morel, F. M. (1999). A model of carbon isotopic fractionation and active carbon uptake in phytoplankton. Mar. Ecol. Prog. Ser. 182, 295–298. doi: 10.3354/meps182295
Kottmeier, D. M., Rokitta, S. D., and Rost, B. (2016a). Acidification, not carbonation, is the major regulator of carbon fluxes in the coccolithophore Emiliania huxleyi. New Phytol. 211, 126–137. doi: 10.1111/nph.13885
Kottmeier, D. M., Rokitta, S. D., and Rost, B. (2016b). H+-driven increase in CO2 uptake and decrease in uptake explain coccolithophores' acclimation responses to ocean acidification. Limnol. Oceanogr. 61, 2045–2057. doi: 10.1002/lno.10352
Kottmeier, D. M., Rokitta, S. D., Tortell, P. D., and Rost, B. (2014). Strong shift from to CO2 uptake in Emiliania huxleyi with acidification: new approach unravels acclimation versus short-term pH effects. Photosynthesis Res. 121, 265–275. doi: 10.1007/s11120-014-9984-9
Langer, G., Nehrke, G., Probert, I., Ly, J., and Ziveri, P. (2009). Strain-specific responses of Emiliania huxleyi to changing seawater carbonate chemistry. Biogeosci. Discuss. 6, 4361–4383. doi: 10.5194/bgd-6-4361-2009
Larsen, S. H. (2012). Dimethylsulphoniopropionate (DMSP) Production of Gephyrocapsa oceanica in Response to Environmental Forcing. Melbourne, VIC: Doctor of philosophy, School of Biological Sciences.
Laws, E. A., Popp, B. N., Bidigare, R. R., Kennicutt, M. C., and Macko, S. A. (1995). Dependence of phytoplankton carbon isotopic composition on growth rate and [CO2] aq: theoretical considerations and experimental results. Geochim. Cosmochimica Acta 59, 1131–1138. doi: 10.1016/0016-7037(95)00030-4
Lewis, E., Wallace, D., and Allison, L. J. (1998). Program Developed for CO2 System Calculations. Oak Ridge, TN: Carbon Dioxide Information Analysis Center, Managed by Lockheed Martin Energy Research Corporation for the US Department of Energy Tennessee.
Lueker, T. J., Dickson, A. G., and Keeling, C. D. (2000). Ocean pCO2 calculated from dissolved inorganic carbon, alkalinity, and equations for K1 and K2: validation based on laboratory measurements of CO2 in gas and seawater at equilibrium. Mar. Chem. 70, 105–119. doi: 10.1016/S0304-4203(00)00022-0
McIntyre, A., and Bé, A. W. H. (1967). Modern Coccolithophoridae of Atlantic Ocean -I. Placoliths and cyrtoliths. Deep Sea Res. Oceanogr. Abstracts 14, 561–597. doi: 10.1016/0011-7471(67)90065-4
Megard, R. O., Tonkyn, D. W., and Senft, W. H. (1984). Kinetics of oxygenic photosynthesis in planktonic algae. J. Plank. Res. 6, 325–337. doi: 10.1093/plankt/6.2.325
Nimer, N. A., and Merrett, M. J. (1993). Calcification rate in Emiliania huxleyi Lohmann in response to light, nitrate and availability of inorganic carbon. New Phytol. 123, 673–677. doi: 10.1111/j.1469-8137.1993.tb03776.x
Norberg, J. (2004). Biodiversity and ecosystem functioning: a complex adaptive systems approach. Limnol. Oceanogr. 49, 1269–1277. doi: 10.4319/lo.2004.49.4_part_2.1269
Orr, J. C., Fabry, V. J., Aumont, O., Bopp, L., Doney, S. C., Feely, R. A., et al. (2005). Anthropogenic ocean acidification over the twenty-first century and its impact on calcifying organisms. Nature 437, 681–686. doi: 10.1038/nature04095
Paasche, E. (2001). A review of the coccolithophorid Emiliania huxleyi (Prymnesiophyceae), with particular reference to growth, coccolith formation, and calcification-photosynthesis interactions. Phycologia 40, 503–529. doi: 10.2216/i0031-8884-40-6-503.1
Pörtner, H. O., and Farrell, A. P. (2008). Physiology and climate change. Science 322, 690–692. doi: 10.1126/science.1163156
Poulton, A. J., Adey, T. R., Balch, W. M., and Holligan, P. M. (2007). Relating coccolithophore calcification rates to phytoplankton community dynamics: regional differences and implications for carbon export. Deep Sea Res. II Top. Stud. Oceanogr. 54, 538–557. doi: 10.1016/j.dsr2.2006.12.003
Poulton, A. J., Charalampopoulou, A., Young, J. R., Tarran, G. A., Lucas, M. I., and Quartly, G. D. (2010). Coccolithophore dynamics in non-bloom conditions during late summer in the central Iceland Basin (July-August 2007). Limnol. Oceanogr. 55, 1601–1613. doi: 10.4319/lo.2010.55.4.1601
Powles, S. B. (1984). Photoinhibition of photosynthesis induced by visible light. Annu. Rev. Plant Physiol. 35, 15–44. doi: 10.1146/annurev.pp.35.060184.000311
Raven, J. A., and Crawfurd, K. (2012). Environmental controls on coccolithophore calcification. Mar. Ecol. Prog. Ser. 470, 137–166. doi: 10.3354/meps09993
Rhodes, L. L., Peake, B. M., MacKenzie, A. L., and Marwick, S. (1995). Coccolithophores Gephyrocapsa oceanica and Emiliania huxleyi (Prymnesiophyceae = Haptophyceae) in New Zealand's coastal waters: characteristics of blooms and growth in laboratory culture. New Zeal. J. Mar. Freshw. Res. 29, 345–357. doi: 10.1080/00288330.1995.9516669
Rickaby, R. E. M., Henderiks, J., and Young, J. N. (2010). Perturbing phytoplankton: response and isotopic fractionation with changing carbonate chemistry in two coccolithophore species. Clim. Past 6, 771–785. doi: 10.5194/cp-6-771-2010
Ridgwell, A. (2005). A Mid Mesozoic Revolution in the regulation of ocean chemistry. Mar. Geol. 217, 339–357. doi: 10.1016/j.margeo.2004.10.036
Riebesell, U., Bach, L. T., Bellerby, R. G., Monsalve, J. R. B., Boxhammer, T., Czerny, J., et al. (2017). Competitive fitness of a predominant pelagic calcifier impaired by ocean acidification. Nat. Geosci. 10, 19–23. doi: 10.1038/ngeo2854
Riebesell, U., Körtzinger, A., and Oschlies, A. (2009). Sensitivities of marine carbon fluxes to ocean change. Proc. Natl. Acad. Sci. U.S.A. 106, 20602–20609. doi: 10.1073/pnas.0813291106
Rokitta, S. D., and Rost, B. (2012). Effects of CO2 and their modulation by light in the life-cycle stages of the coccolithophore Emiliania huxleyi. Limnol. Oceanogr. 57, 607–618. doi: 10.4319/lo.2012.57.2.0607
Rost, B., and Riebesell, U. (2004). “Coccolithophores and the biological pump: responses to environmental changes,” in Coccolithophores: From Molecular Processes to Global Impacts, book section 5, eds H. R. Thierstein and J. R. Young (Berlin; Heidelberg: Springer), 99–125.
Rost, B., Riebesell, U., Burkhardt, S., and Sültemeyer, D. (2003). Carbon acquisition of bloom-forming marine phytoplankton. Limnol. Oceanogr. 48, 55–67. doi: 10.4319/lo.2003.48.1.0055
Rost, B., Zondervan, I., and Riebesell, U. (2002). Light-dependent carbon isotope fractionation in the coccolithophorid Emiliania huxleyi. Limnol. Oceanogr. 47, 120–128. doi: 10.4319/lo.2002.47.1.0120
Sarmiento, J. L., Slater, R., Barber, R., Bopp, L., Doney, S. C., Hirst, A., et al. (2004). Response of ocean ecosystems to climate warming. Glob. Biogeochem. Cycles 18:GB3003. doi: 10.1029/2003GB002134
Schulz, K. G., Barcelos e Ramos, J., Zeebe, R. E., and Riebesell, U. (2009). CO2 perturbation experiments: similarities and differences between dissolved inorganic carbon and total alkalinity manipulations. Biogeosci. Discuss. 6, 2145–2153. doi: 10.5194/bg-6-2145-2009
Schulz, K. G., Rost, B., Burkhardt, S., Riebesell, U., Thoms, S., and Wolf-Gladrow, D. (2007). The effect of iron availability on the regulation of inorganic carbon acquisition in the coccolithophore Emiliania huxleyi and the significance of cellular compartmentation for stable carbon isotope fractionation. Geochim. Cosmochimica Acta 71, 5301–5312. doi: 10.1016/j.gca.2007.09.012
Sett, S., Bach, L. T., Schulz, K. G., Koch-Klavsen, S., Lebrato, M., and Riebesell, U. (2014). Temperature modulates coccolithophorid sensitivity of growth, photosynthesis and calcification to increasing seawater pCO2. PLoS ONE 9:e88308. doi: 10.1371/journal.pone.0088308
Sharkey, T. D., and Berry, J. A. (1985). “Carbon isotope fractionation of algae as influenced by an inducible CO2 concentrating mechanism,” in Inorganic Carbon Uptake by Aquatic Photosynthetic Organisms: Proceedings of an International Workshop on Bicarbonate Use in Photosynthesis, August 18–22, 1984, Commemorating the Seventy-fifty Anniversary of the University of California, Davis, 1909–1984, eds W. J. Lucas and J. A. Berry (Davis, CA: American Society of Plant Physiologists), 389–401.
Suffrian, K., Schulz, K. G., Gutowska, M. A., Riebesell, U., and Bleich, M. (2011). Cellular pH measurements in Emiliania huxleyi reveal pronounced membrane proton permeability. New Phytol. 190, 595–608. doi: 10.1111/j.1469-8137.2010.03633.x
Taylor, A. R., Chrachri, A., Wheeler, G., Goddard, H., and Brownlee, C. (2011). A voltage-gated H+ channel underlying pH homeostasis in calcifying coccolithophores. PLoS Biol. 9:e1001085. doi: 10.1371/journal.pbio.1001085
Trimborn, S., Langer, G., and Rost, B. (2007). Effect of varying calcium concentrations and light intensities on calcification and photosynthesis in Emiliania huxleyi. Limnol. Oceanogr. 52, 2285–2293. doi: 10.4319/lo.2007.52.5.2285
Uppström, L. R. (1974). The boron/chlorinity ratio of deep-sea water from the Pacific Ocean. Deep Sea Res. Oceanogr. Abstracts 21, 161–162. doi: 10.1016/0011-7471(74)90074-6
van Bleijswijk, J. D. L., Kempers, R. S., and Velhuis, M. J. (1994). Cell and growth characteristics of types A and B of Emiliania huxleyi (Prymnesiophyceae) as determined by flow cytometry and chemical analysis. J. Phycol. 30, 230–241. doi: 10.1111/j.0022-3646.1994.00230.x
von Dassow, P., van den Engh, G., Iglesias-Rodriguez, D., and Gittins, J. R. (2012). Calcification state of coccolithophores can be assessed by light scatter depolarization measurements with flow cytometry. J. Plank. Res. 34, 1011–1027. doi: 10.1093/plankt/fbs061
Westbroek, P., Brown, C. W., van Bleijswijk, J., Brownlee, C., Brummer, G. J., Conte, M., et al. (1993). A model system approach to biological climate forcing. The example of Emiliania huxleyi. Glob. Planet. Change 8, 27–46. doi: 10.1016/0921-8181(93)90061-R
Zhang, Y., Bach, L. T., Schulz, K. G., and Riebesell, U. (2015). The modulating influence of light intensity on the response of the coccolithophore Gephyrocapsa oceanica to ocean acidification. Limnol. Oceanogr. 60, 2145–2157. doi: 10.1002/lno.10161
Keywords: growth rate, photosynthesis, calcification, Gephyrocapsa oceanica, climate change, carbonate chemistry, temperature, light
Citation: Gafar NA, Eyre BD and Schulz KG (2018) A Conceptual Model for Projecting Coccolithophorid Growth, Calcification and Photosynthetic Carbon Fixation Rates in Response to Global Ocean Change. Front. Mar. Sci. 4:433. doi: 10.3389/fmars.2017.00433
Received: 25 October 2017; Accepted: 14 December 2017;
Published: 04 January 2018.
Edited by:
Agostino Merico, Leibniz Centre for Tropical Marine Research (LG), GermanyReviewed by:
Peng Jin, King Abdullah University of Science and Technology, Saudi ArabiaTom Trull, Antarctic Climate & Ecosystem Cooperative Research Centre, Australia
Copyright © 2018 Gafar, Eyre and Schulz. This is an open-access article distributed under the terms of the Creative Commons Attribution License (CC BY). The use, distribution or reproduction in other forums is permitted, provided the original author(s) or licensor are credited and that the original publication in this journal is cited, in accordance with accepted academic practice. No use, distribution or reproduction is permitted which does not comply with these terms.
*Correspondence: Natasha A. Gafar, n.gafar.10@student.scu.edu.au