Modeling Net Growth of Phaeocystis antarctica Based on Physiological and Optical Responses to Light and Temperature Co-limitation
 Tiffany A. Moisan
 B. Greg Mitchell
- 1Wallops Flight Facility, Goddard Space Flight Center (NASA), Wallops Island, VA, United States
- 2Scripps Institution of Oceanography, University of California, San Diego, La Jolla, CA, United States
Temperature and light are fundamental environmental variables which regulate phytoplankton growth rates when nutrients are in excess. For polar coastal oceans that are undergoing changes in sea ice cover and warming, light, and temperature are particularly important for bloom dynamics. Using colonial Phaeocystis antarctica cultures grown at steady-state, we assessed the combined effect of these two environmental controls on net growth rate (μn), chlorophyll-specific absorption of light ( (λ)), and quantum yields for growth (ϕμ). Specific net growth rates (μn) varied from 0.04 to 0.34 day−1 within a matrix of light and temperature ranging from 14 to 542 μmol quanta m−2 s−1 and −1.5 to 4°C. Values of (λ) varied significantly with light but only slightly with temperature. Values of ϕμ ranged from 0.003 to 0.09 mol C (mol quanta absorbed)−1 with highest values at low light and 4°C. For excess irradiances or low temperatures where growth rate is inhibited, quantum yields were low. The low ϕμ values are attributed both to increased absorption by photoprotective pigments compared to photosynthetic pigments and thermodynamic control of dark reaction enzymes. The systematic changes in photophysiological properties of P. antarctica in relation to temperature and light were used to develop a series of nested light- and temperature-dependent models for μn, (λ), and ϕμ. A model for (300–700 nm) was developed that takes into account the systematic changes in (λ) due to pigment packaging effects and cellular concentrations of chlorophylls and photoprotective pigments. Also, a model for ϕμ was developed based on a cumulative one-hit Poisson probability function. These model parameterizations for absorption and quantum yield are combined into an overall model of net growth that can be applied easily to P. antarctica bloom dynamics using remote sensing data for temperature, light, and chlorophyll a. Furthermore, modeling based on the biophysical variables (λ), and ϕμ that are shown to regulate the growth rate provides a more fundamental mechanistic approach compared to other modeling methods that do not explicitly resolve photon flux into the cell or the quantum yield.
Introduction
The colonial prymnesiophyte Phaeocystis can dominate coastal, ice edge, and open ocean blooms in polar and temperate waters with significant implications for carbon export (Smith et al., 1991; DiTullio et al., 2000; van Leeuwe et al., 2007; Pavlov et al., 2017). The importance of light, temperature, and nutrients in governing phytoplankton growth and bloom formation has motivated research on metabolic and cellular characteristics of phytoplankton in response to environmental stressors. Singly, the light-, temperature-, and nutrient- dependence of phytoplankton growth has been well-characterized for a variety of species under a wide range of experimentally controlled laboratory conditions providing the basis for generalized models of phytoplankton growth for temperature, nutrients, and light limitation. Nutrient-limited growth has been described as a function of cell quota which is determined by Michaelis-Menten uptake kinetics (Droop, 1983). These kinetic models have been modified to account for multiple nutrients by invoking Leibig's Law of the minimum (Falkowski and Raven, 2007). Temperature-dependent growth has been modeled with the Arrhenius equation (Li, 1980) and maximal growth has been based on empirical derivations determined from cultures (Eppley, 1972). Light-dependent growth has been modeled as a variety of different formulations which allows growth to increase with irradiance, saturate, and decrease at high irradiances (Goldman and Carpenter, 1974; Laws and Bannister, 1980; Moisan et al., 2002). While nutrient limitation is generally modeled on the basis of the “limiting” nutrient, phytoplankton must also acclimate to large variations in light and temperature (Behrenfeld et al., 2002; Ciotti et al., 2002). Often these regulate growth in an interactive co-limitation matrix (Sosik and Mitchell, 1994; Sunda and Huntsman, 1997, 2011) however there is lacking a mechanistic framework for modeling phytoplankton growth rate based on the biophysical variables of cellular absorption and quantum yield under simultaneous co-limitation.
Blooms of Phaeocystis sp. have been reported in diverse oceanic provinces for temperature ranging from less than 0°C to greater than 35°C and for both shallow and deep mixed layers (Gieskes et al., 2007; Gypens et al., 2007). Data sets required to specify physiological parameters for growth at various environmental conditions are relatively rare. A review of Chl:C ratios in polar and temperate microalgae at different acclimation states is found in Lacour et al. (2017)Various mathematical descriptions for modeling phytoplankton growth that include multiple limitations establish the foundations for our approach (Shuter, 1979; Laws and Bannister, 1980; Rhee and Gotham, 1981a,b; Geider et al., 1998; Behrenfeld et al., 2002; Edwards et al., 2016). These concepts have been extended to the estimates of primary production and growth rates from satellites (Behrenfeld et al., 2005; Arteaga et al., 2014, 2016). Growth rates regulated by irradiance, temperature, and nutrients have been modeled using different approaches based on algal metabolism (Laws and Bannister, 1980), elemental ratios of chlorophyll or carbon (Geider et al., 1998; Graff et al., 2016), or cell carbon quota (Zonneveld et al., 1997). Some of these models have limited ecological applicability because they require parameters that are not easily measured in natural systems. We model steady-state growth based on the mechanistic biophysical parameters of chl-a specific spectral absorption and photosynthetic quantum yeield ( (λ) and ϕμ,) which are directly regulated by light, temperature, and nutrients (Kiefer and Mitchell, 1983; Sakshaug et al., 1989; Cullen, 1990; Moisan and Mitchell, 1999). For brevity, all symbols are defined in Table 1. For steady-state growth, (λ) and ϕμ vary in response to temperature, light, and nutrient regulation of growth (Mitchell and Kiefer, 1988; Nelson and Prézelin, 1990; Sosik and Mitchell, 1991, 1995; Moisan and Mitchell, 1999; Westberry et al., 2008). Combining estimates of phytoplankton absorption (Kishino et al., 1985) with rates of carbon fixation allows for validation of models based on (λ) and ϕμ for natural communities (Cleveland et al., 1989; Smith et al., 1989; Marra et al., 1995; Sosik and Mitchell, 1995; Sosik, 1996). Thus, the model we describe here to predict (λ) and ϕμ for light and temperature co-limitation can easily be applied and validated for natural communities in polar regions using routine methods and is most applicable when blooms dominated by Phaeocystis are forming and nutrients are in excess. The model is most likely not as robust during pre-bloom situations with a mixed community assemblage and for post bloom conditions when nutrients are exhausted.
Table 1. Symbols used throughout the text.
Modeling growth rates of phytoplankton over large geographical scales will require parameterizations that take into account the taxonomic diversity of the phytoplankton community and variability driven by physiological acclimation (Moisan et al., 2017). In this paper, we have developed a model of growth rate using the colonial prymnesiophyte, P. antarctica, an ecologically and biogeochemically important organism in the polar and subpolar carbon cycle (Stuart et al., 2000; Smith et al., 2003; Pabi and Arrigo, 2006; Smith et al., 2006; Gieskes et al., 2007) and is responsible for significant amounts of new production (Arrigo et al., 1999). Temperature, light, and iron are major limiting factors that control the initiation and development of phytoplankton blooms in the Southern Ocean. We describe the range of variability and relationships of μn, (λ), and ϕμ for P. antarctica for a realistic range of temperature, light, and nutrient conditions that occur during the Antarctic spring bloom. Using steady-state experimental data, we developed a series of nested models that together form a photophysiological model of net growth. Our model is based on contemporary bio-optical models for photosynthesis (Kiefer and Mitchell, 1983; Cullen, 1990; Moisan and Mitchell, 1999) which utilize (λ) and ϕμ as photophysiological variables to describe phytoplankton net growth,
We determined the environmental control of (λ), and ϕμ by assessing their magnitude for co-limitation using controlled light and temperature experiments. Our model for ϕμ is based on a cumulative one-hit Poisson probability distribution and introduces the concept that both light and temperature regulate the maximal quantum yield of growth for any acclimated state. In general, the maximal quantum yield for any acclimated state should be modeled as a function of the limiting growth conditions (Moisan and Mitchell, 1999) rather than using the theoretical maximum (Sakshaug et al., 1989). Our formulation is based on Cullen (1990) and we extend our previous model of ϕμ (Moisan and Mitchell, 1999) as a variable dependent on both light and temperature,
where ϕμ is the quantum yield of growth, ϕm,Eo,T is the maximal quantum yield for growth for an acclimated state within the light and temperature limitation matrix, Ekμ is the photoacclimation parameter (Falkowski and Raven, 2007), and E0 is photosynthetically available radiation.
The culture experiments were designed to assess the broad range of temperature and light that Antarctic phytoplankton experience in nature that is relevant to formation of blooms. Since a bloom cannot form unless there are excess nutrients to support the growth of the bloom, we do not model nutrients although clearly macronutrients and iron can regulate the crop size and productivity (Sedwick, 2007; van Leeuwe and Stefels, 2007). By characterizing the light and temperature response of phytoplankton absorption and quantum yield over a realistic environmental range, we have parameterized a bio-optical model for μn for application to ocean color satellites and buoys. This effort to describe and model the variability in the biophysical parameters that mediate temperature and light control of phytoplankton growth provides important details related to phytoplankton acclimation when multiple environmental variables are regulating growth simultaneously.
Materials and Methods
Cultures of colonial P. antarctica (CCMP 1374) were grown semi-continuously at −1.5, 0, 2, and 4°C for 5–8 generations in f/2 medium (Gulliard and Ryther, 1962) under continuous blue light ranging from 14 to 542 mol quanta m−2 s−1. The spectrum of the light source was similar to the light quality observed in the upper ocean (Moisan and Mitchell, 1999). Cultures were maintained at ~30% of the carrying capacity of the culture medium. This protocol results in a steady-state acclimated condition at the time of experimental sampling. Details of the illumination source, blue filter and culturing system and our method to estimate spectral quantum flux in the cultures can be found in Moisan and Mitchell (1999).
Specific Growth Rate (μn)
Specific growth rate was estimated by a linear regression of loge transformed daily determinations of in vivo fluorescence intensity (n = 2) measured with a Turner Model 10 fluorometer at the same time each day. POC data was also collected during mid-log phase growth at the time of the experiments, allowing an estimate of the carbon-based growth rate for each experimental culture.
Fluorometric Estimates of Chl a
Chl a concentrations (n = 3) were estimated fluorometrically using a Turner Model 10-AU fluorometer according to (Welschmeyer, 1994).
High Performance Liquid Chromatography (HPLC)
Duplicate samples (n = 2) were concentrated onto Whatman GF/F filters and extracted in cold 100% acetone by grinding with a teflon-tip grinding rod. After centrifugation, the supernatant was mixed with 20% (v/v) HPLC-grade water and analyzed on a Shimadzu LC10-AD HPLC system (Wright et al., 1991). Pigment concentrations were based on absorption at 440 nm (Dynamax Model UV-1). Integrated HPLC peak area was quantified with external standards. Canthaxanthin was used as an internal standard. A spectral diode detector provided spectral absorption of peaks which were used to confirm the individual pigments by reference to a spectral library of standards. Duplicate samples (N = 2) differed by less than 2% of each other on replicate filtered samples. Note that there was a small difference (2–20%) between HPLC samples and fluorometric samples. For this reason, we have averaged the HPLC and fluorometric samples.
Chl-Specific Absorption Coefficient ( (λ))
For experiments at −1.5, 2, and 4°C, in vivo whole cell absorption spectra were determined (n = 4) on concentrated samples from 300 to 800 nm at 1 nm intervals with an integrating sphere accessory in a dual beam Perkin Elmer Lambda 6 UV/Vis spectrophotometer. Fresh f/2 medium was used as a reference and a blank. For cultures grown at 0°C, the integrating sphere failed and we estimated the absorption coefficient with the glass fiber filter method of Mitchell (1990) which has been shown to agree well with the integrating sphere methods after corrections for pathlength amplification (Mitchell et al., 2000). The chl-specific absorption coefficient was estimated by dividing loge absorption, aph (λ), by the corresponding chl a value:
Particulate Carbon and Nitrogen Content
Samples (n = 3) were filtered onto pre-combusted GF/F filters, stored at −20°C and run on a Carlo Erba carbon analyzer. Samples of acetanilide were used to validate the system's calibration. See Moisan and Mitchell (1999) for details.
Cell Concentrations
Cell concentrations were estimated in Palmer Maloney chambers both fresh (unfixed) and observed at a magnification of 400X. See Moisan and Mitchell (1999) for details.
Quantum Yield for Growth
Quantum yield for growth was based on the carbon-specific net growth rate, whole cell in vivo spectral absorption, and the spectral irradiance in each treatment (Sosik and Mitchell, 1991; Moisan and Mitchell, 1999) and is a rearrangement of Equation (1a).
Non-linear Curve Fitting
Coefficients for P-E curves, and temperature and light dependent equations for growth and quantum yield for growth were fit using a Marquardt-Levenberg non-linear least squares minimization routine (Marquardt, 1963). See Moisan and Mitchell (1999) for details.
Results and Discussion
The Relationship between Growth Rate, Temperature, and Light
Growth rates of P. antarctica varied ~8-fold ranging from 0.04 day−1 to 0.34 day−1 under conditions which were limiting to inhibiting for growth (Figure 1A). Specific net growth rates (μn) increased in response to light and approached photoinhibition at higher irradiances (Table 2). The initial slope of the light-dependent growth was lowest at 4°C (0.007 average± S.E. 0.001) and highest at 0°C (0.030 average ± S.E. 0.006). A photoacclimation parameter (Ekμ) was derived utilizing a curve-fitting scheme of all of the light treatments for a single temperature and other studies. Values of Ekμ were both temperature- and light- dependent (Figure 1A).
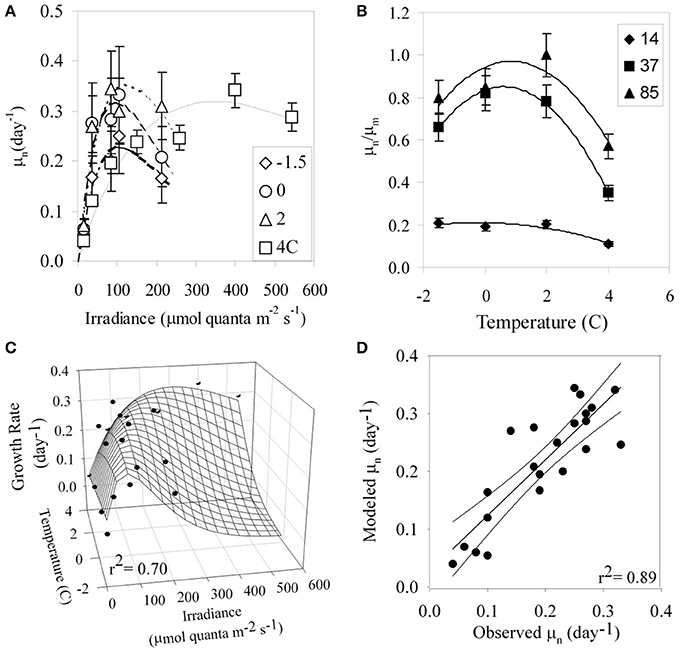
Figure 1. (A) Specific growth rates (μn, day−1) of P. antarctica with respect to irradiance for growth temperatures ranging from −1.5 to 4°C. (B) Relative growth rate (μn/μm) with respect to temperature for irradiances in units of μmol quanta m−2 s−1. (C) An empirically-derived model for growth rate based on combined limitation of light and temperature. The continuous surface is the model prediction and discrete points are experimental observations. (D) Modeled vs. observed μ (day−1) based on Equation (4).
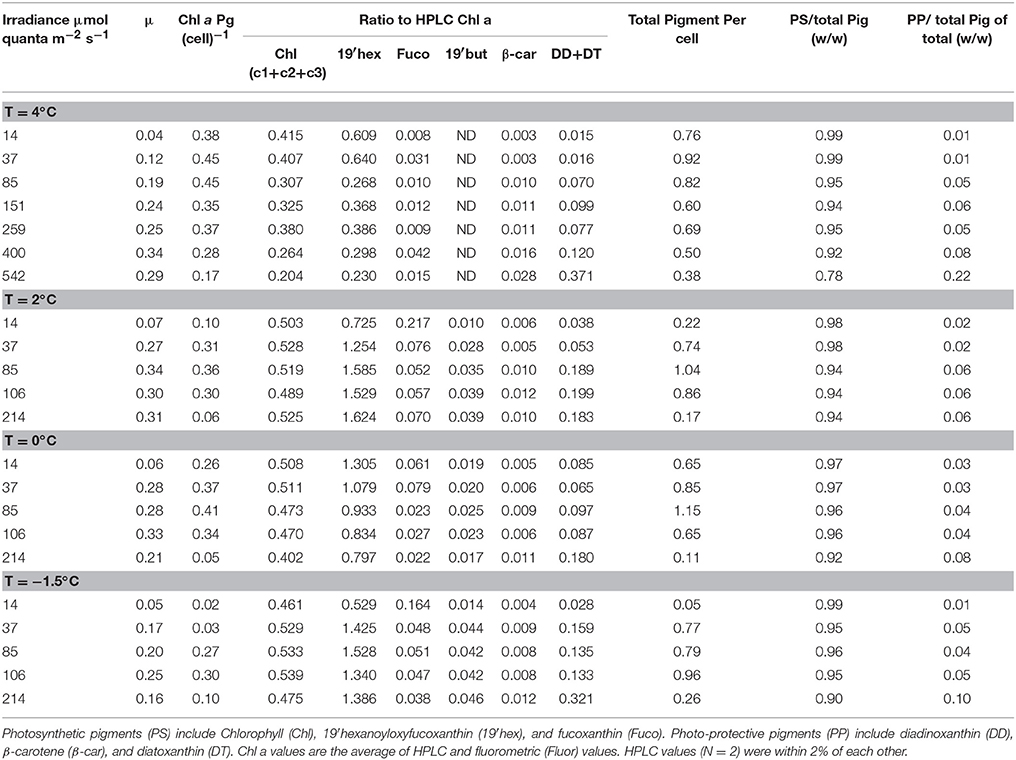
Table 2. Growth and pigmentation of P. antarctica grown under nutrient-replete conditions.
Relative growth rates (μn/μm) for our treatments exhibited a strong dependence on temperature, with maximal values between 0 and 2°C except at photoinhibiting intensities (Figure 1B, Tilzer and Dubinsky, 1987). In general, μn had a parabolic response to temperature, with a 1.5-fold change between minima and maxima with the exception of the treatments at 14 μmol quanta m−2 s−1. At low temperatures under moderate light intensities, P. antarctica achieved maximal growth similar to those grown at high light at 4°C. For example, the maximal growth rates, μm (0.98 ± 0.05, average ± S.E.) achieved at 37 μmol quanta m−2 s−1 at temperatures <2°C were lower than those observed at inhibiting growth conditions at 542 μmol quanta m−2 s−1 at 4°C (Figure 1A, t-test; p > 0.05).
Empirical Model of Growth Rate
The systematic dependence of net growth rate (μn) on temperature and light allowed for the derivation of a simple empirical model for μn (Figure 1C). We modeled the light-dependence of growth with a hyperbolic tangent equation commonly used for photosynthesis-irradiance relationships (Platt et al., 1980, Figure 1A) which allows μn to increase with irradiance and become saturated or photoinhibited at higher irradiances (Table 3). We modeled μm as a function of temperature (Eppley, 1972). Values of α were fit as linear functions of temperature and light (R2 = 0.85) as has been observed for Antarctic phytoplankton (Lizotte and Sullivan, 1991). Net growth for P. antarctica can be estimated with knowledge of light and temperature using the following equations,
where μn is net growth rate, μm is the maximal growth rate (day−1), T is temperature (°C), α is the initial slope of the μn vs. irradiance relationship, β is the inhibition of growth at high irradiance, α1 and α2 are the y-intercepts and slope for α with temperature, respectively, μsb (analogous to Psb in Platt et al., 1980) is a fitting parameter and PAR is photosynthetically available radiation (350–700 nm). Equations (3c,d) represent a growth equation originally derived by Platt et al. (1980) as a function of P vs. I. parameters. The values for α1 and α2 are 0.0069 ± 0.001 and (−0.001 ± 0.0003), respectively (p < 0.00001). We have very few treatments where irradiance was sufficient to inhibit growth. However, other investigators have clearly documented that phytoplankton growth is inhibited at higher irradiances (Goldman and Carpenter, 1974; Laws and Bannister, 1980; Platt et al., 1980). Therefore, we allow β to be constrained in a relatively large range to accomodate photoinhibition at high light under low temperature. These dynamics are in general agreement with increases in photoinhibition of short-term photosynthetic carbon fixation at high light (Platt et al., 1980).
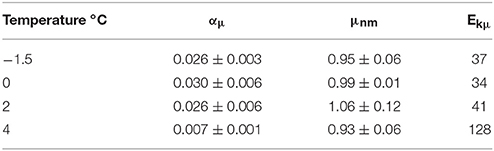
Table 3. Growth fitting parameters of Phaeocystis grown between −1.5 and 4°C.
This simple empirical model has an excellent ability for predicting μn based only on light and temperature as input (Figure 1D; r2 = 0.89, p < 0.05). However, it does not include explicit information about mechanisms of physiological acclimation. Therefore, we have also developed a model to predict growth using a series of nested models that predict the biophysical parameters, (λ) and ϕμ, based on acclimation to temperature and light.
Temperature and Light Dependence of (λ): Observations and Modeling of Variability
The in vivo whole cell chlorophyll-specific absorption properties, (λ), of P. antarctica varied with both irradiance and temperature (Figures 2A,B). Values of (λ) increased with increasing irradiance (Figures 2C–E). Values of (λ) at 436 and 676 nm generally increased with decreasing temperature but the magnitude of the temperature dependence was less than the irradiance dependence (Figures 2C,D, ANOVA p > 0.05). Values of (330), due to mycosporine-like amino acids (Moisan and Mitchell, 2001), had less dependence on temperature than estimates at 436 and 676 nm (Figure 2E). Our observations are within the range of (λ) observed during Phaeocystis-dominated blooms (Cota et al., 1994; Arrigo et al., 1998; Reynolds et al., 2001).
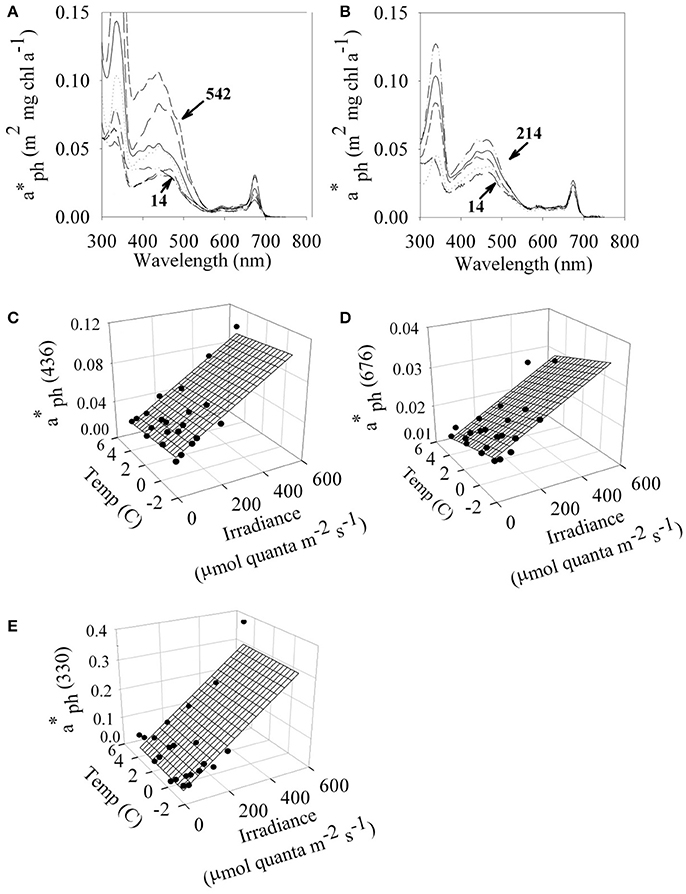
Figure 2. Absorption characteristics of P. antarctica. In vivo chl-specific absorption spectrum ( (λ)) for P. antarctica grown at (A) 4C and (B)−1.5°C between a range of irradiances (μmol quanta m−2 s−1). Irradiance- and temperature- dependent values of (circles) at (C) 436 nm (D) 676 nm and (E) 330 nm. Multiple linear regressions based on temperature and light (continuous surface) are overlaid on the discrete points of (λ). Each point represents the average of 4 replicates. C.V. for (λ) values are 5%.
Pigment package effects, changes in pigment ratios (Table 2), and thylakoid stacking played an important role in determining both the spectral shape and large changes in the magnitude of (λ) (Moisan and Mitchell, 1999; Moisan et al., 2006). Ratios of aph (330) to aph (676) increased linearly from 1.8 to 13 due to changes in MAA to Chl a concentrations as a photo-protective response to increased irradiance (Moisan and Mitchell, 2001).
We explored the dependence of (λ) on irradiance and temperature in an attempt to specify a simple parameterization for spectral absorption that could accurately capture the changes in both shape and magnitude caused by changes in pigment ratios and packaging. Singly, (676) was highly predictable by a linear regression with either irradiance (r2 = 0.62, Figure 3A) or temperature (r2 = 0.63, data not shown). However, the accuracy of modeled estimates of (λ) was improved by using a multiple linear regression with light and temperature,
where PAR is in units of μmol quanta m−2 s−1, temperature (T) is in °C, Co is the intercept of the multiple linear regression, CE and CT are the multiple linear regression coefficients for PAR and T. The multiple regression fit for (676) for temperature and light had an r2 = 0.82 (Figure 3B), a considerable improvement compared to the fit for only irradiance (r2 = 0.62, data not shown). A comparison of modeled (10 nm resolution) and observed (1 nm hyperspectral) (λ) are shown in Figures 3C,D. Our modeled values are in excellent agreement with measured (λ) in the visible region. Variability in (λ) between 300 and 400 nm is dominated by irradiance (Moisan and Mitchell, 2001) with negligible dependence on temperature (data not shown). For consistency, a single parameterization based on PAR and T is used for the full spectrum (300–700 nm). Coefficients for the model based on light and temperature are given in Table 4. The model does an excellent job of describing (λ) as illustrated for an extreme range of acclimation states representing high (Figure 3C) and low (Figure 3D) degrees of pigment packaging and changes in photosynthetic and photo-protective pigments relative to chlorophyll a. High relative error in the UV for the high light sample (Figure 3C) is caused in part because (330) is ~10 times smaller than the low light example (Figure 3D) caused by changes in cellular concentrations of mycosporine-like amino acids relative to chlorophyll a (Moisan and Mitchell, 2001). There was insignificant irradiance in the system below 350 nm so the large variance in the (λ) model for data between 300 and350 nm did not affect the estimates of ϕμ or μn; see section Performance of the Biophysical Model of Net Growth for P. antarctica for dertails on model application and Figures 5C,D for results modeling ϕμ and μn.
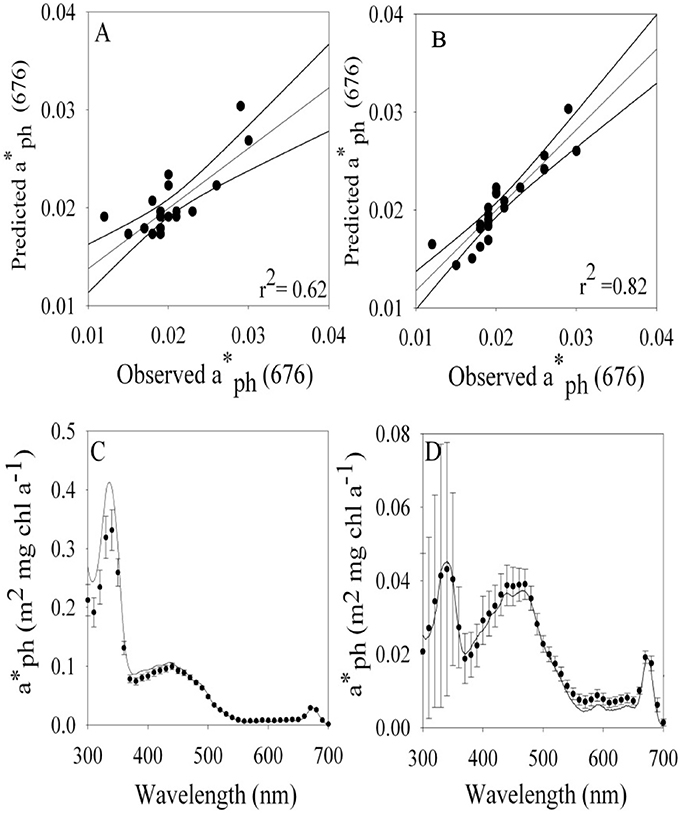
Figure 3. Modeled vs. observed values of at 676 nm based on a linear regression using (A) light and (B) a multiple linear regression based on temperature and light. Comparison of (λ) observed (1 nm resolution continuous line) vs. modeled values (10 nm resolution) based on temperature and light for cultures grown at (C) 4°C 542 μmol quanta m−2 s−1 and −1.5°C and (D) 37 μmol quanta m−2 s−1. Note scale difference in in (C,D). Standard error bars are shown for model estimates.
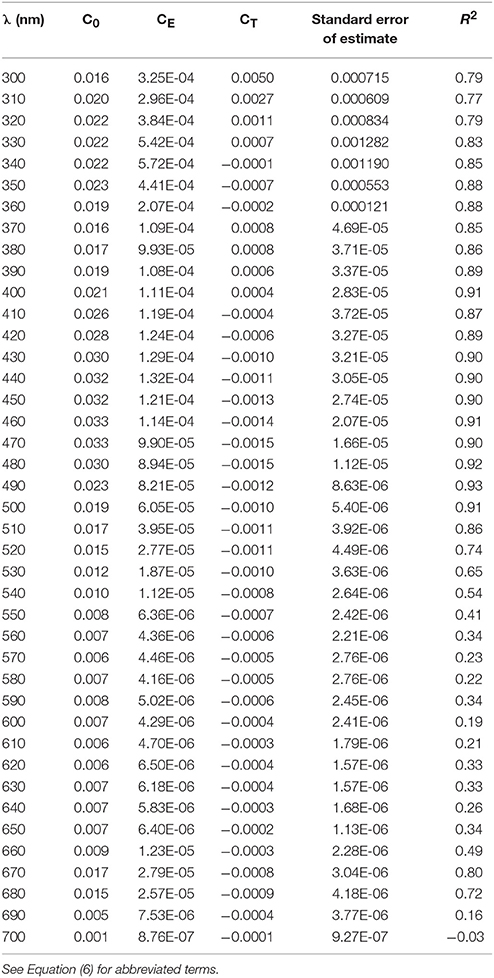
Table 4. Coefficients for multiple-linear regression model for (λ) based on temperature and light.
Temperature and Light Dependence of the Quantum Yield for Growth: Observations and Modeling
The quantum yield for growth, ϕμ, is the molar ratio of carbon fixed for net growth to the quanta absorbed. Understanding how ϕμ varies as a function of environmental conditions that are easily measured either in situ or remotely is critical in the parameterization of photosynthetic bio-optical models that have ecological relevance. We have chosen to estimate ϕμ in relation to light and temperature because they limit bloom formation, control cellular absorption, and enzymatic activity. Although phytoplankton may exhibit chromatic adaptation that optimizes the absorbing pigments to selectively absorb the modified under water light spectrum (Dubinsky and Stambler, 2009), the quantum yield of photosynthesis (oxygen evolved or carbon fixed per photon absorbed) is relatively flat from about 400–650 nm (Luning and Dring, 1985). In the classic review Photosynthesis by Rabinowitch and Govindjee (1969) they show the spectral quantum yield determined by Emerson and Lewis (1943) for Chlorella pyrenoidosa ranged from 0.07 to 0.09 over the spectral range 400–680 nm with the lowest values in the area of photoprotective carotenoids 480–510 nm. While this classic work shows very modest spectral variation in the spectral quantum yield of ±15% from 400 to 680 nm, there are other articles that show larger variations more like ±30%, including our work on the chlorophyll-a fluorescence yield of P. antarctica (Moisan and Mitchell, 2001) with a similar dip in the photoprotective carotenoid band and very low yields below 350 nm where mycosporine amino acids absorb. The work by (Luning and Dring, 1985) for 4 genera of macro algae indicated quantum yield varied by ±15% from 400 to 670 nm. There is spectral variation in the quantum yield that we did not determine in this study, but for the PAR region below 680 nm the variations are modest, depending on which study is cited.
We spectrally quantified total photon absorption and total carbon growth so we do not have resolution of the spectral dependence of ϕμ. The quantum yield for growth at steady state for experimental samples was estimated by rearranging Equation (1a),
For our study, ϕμ varied by 30-fold (Figure 4A) ranging from 0.003 to 0.09 mol C (mol quanta absorbed)−1. Values of ϕμ were highest at low irradiances and decreased at high light intensity but with a large difference in the relationship with light for different temperatures. For a given light level, ϕμ generally decreased with decreasing temperature (Figure 4A); the curve fitted to the 4°C was consistently higher than all other temperatures. Values of ϕμ for the 0 and 2°C treatments were similar to each other for the corresponding light treatments (t-test, p > 0.05). Our values for ϕμ are in the range previously reported for Phaeocystis-dominated blooms (SooHoo et al., 1987; Cota et al., 1994; Carder et al., 1995; Vaillancourt et al., 2003).
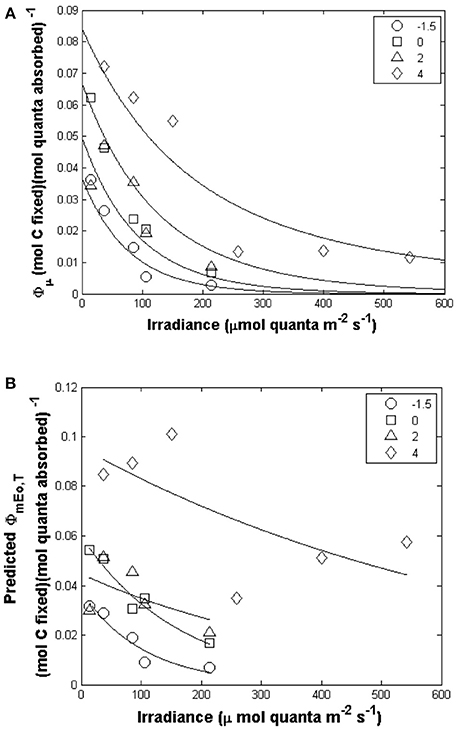
Figure 4. (A) Light and temperature dependence of ϕμ (mol C (mol quanta absorbed)−1) for P. antarctica (symbols). Our modeled ϕμ relationship with light and temperature (solid line) is calculated with a constant Ekμ and a modeled ϕmEo,T (Equation 6). (B) ϕmEo,T response to different temperature and irradiance treatments (Symbols are experimental observations, lines are model predictions). A fixed Ekμ value was used to calculate ϕmEo,T.
The quantum yield for net photosynthesis has previously been modeled as a product of the maximal quantum yield for net photosynthesis, ϕm and a Poisson probability function that an open photosynthetic unit will be hit. This model was originally formulated and validated with experiments on O2 evolution by short-term flashes of light (Dubinsky et al., 1986; Falkowski and Raven, 2007) and adopted to model the quantum yield for growth (Sakshaug et al., 1989; Cullen, 1990). Typically, ϕm has been set for all acclimation states to the theoretical maximal value which is equal to 0.125 mol C (mol quanta absorbed)−1 (e.g., Sakshaug et al., 1989). However, as reviewed by Laws et al. (2002), absorption by non-photosynthetic pigments will automatically result in quantum yields of photosynthesis less than the theoretical maximum. To address this important modeling issue, Moisan and Mitchell (1999) proposed a novel approach where the maximal quantum yield (ϕm) for each acclimated state was dependent on the irradiance. Here, we extend this concept of an environmentally controlled maximal quantum yield by also parameterizing it based on temperature which controls the thermodynamics of photosynthetic enzymes and therefore affects the quantum yield for growth. Thus, as we have shown for above, here we present a mechanistic control of ϕm based on co-limitation by light and temperature.
We found lower quantum yield for growth values at low light (<20 μmol quanta m−2s−1) whereas the cumulative hit Poisson Probability does not allow this roll off at low light. Johnsen and Barber (2003)have shown excellent experimental data that demonstrates that there are different photophysiological mechanisms at reduced light levels which contribute to a reduced quantum yield. Despite low quantum yields for growth and photosynthesis, there is experimental evidence that photosynthetic efficiency is not always maximal at low irradiances (Johnsen and Barber, 2003). Low photosynthetic quantum yield has been attributed to the Kok effect, S-state decay (S3 to S2), and imbalances in photosystem excitation (Diner and Mauzerall, 1973). Furthermore, it is expected that the ratio of respiration to photosynthesis may increase at very low light, leading to the observed reduction in quantum yield at very low light.
Given observed values of ϕμ, a function for ϕmEo,T was derived which exponentially decreased from low to high irradiances (Figure 4B). The equations used to predict ϕmEo,T are given below and the final estimate of ϕμ compared to observed values are plotted in in Figure 5C. Values of ϕmEo,T were described as a function of irradiance (Figure 4B) and the temperature dependence was incorporated into the coefficients a and b which are modeled as linear functions of temperature (Table 5),
where T is temperature in °C and Eo is in units of μmol quanta m−2 s−1. Values of a and b which are in Equation (6a) are linear relationships of parameters that rely on temperature. Values of ϕmEo,T and for Ekμ as estimated below were introduced into Equation (1b) to estimate ϕμ.
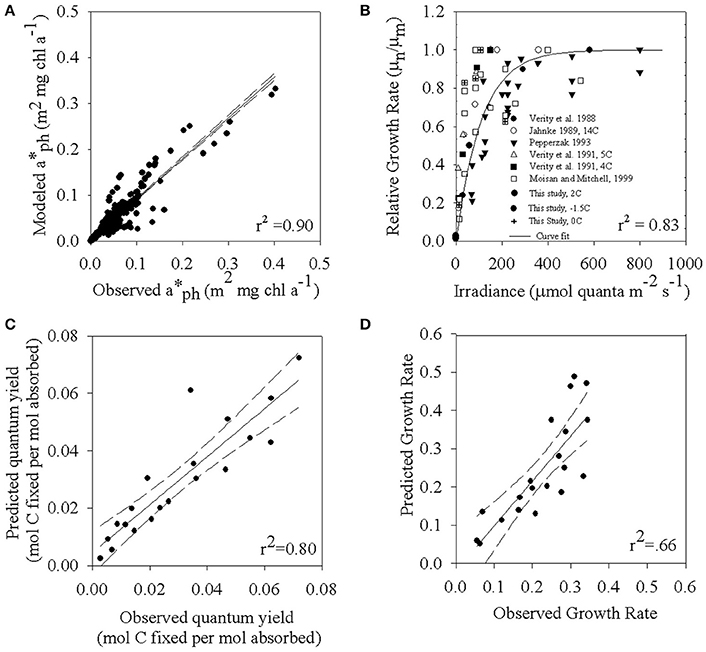
Figure 5. (A) The relationship between modeled (λ) based on temperature and light (Equation 6, Table 4) and observed values at individual wavelengths. (B) Relative growth rates measured from various Phaeocystis species grown under a variety of temperature and irradiance regimes. Note that there are overlapping data points. (C) Modeled ϕμ vs. observed values. There are overlapping points. (D) Relationship between the observed carbon-specific growth rate and model predictions of carbon-specific rate of net growth (μn). Model is based on Equation (1) and Table 4.
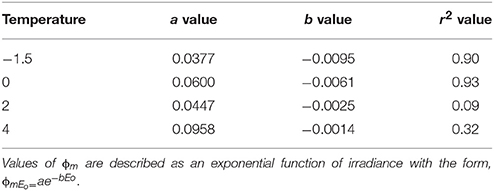
Table 5. Model variables for maximal quantum yield based on irradiance at discrete temperatures.
Performance of the Biophysical Model of Net Growth for P. antarctica
To test the performance of the biophysical model for net photosynthesis, we predicted (λ) and ϕμ using the temperature and light dependent model parameterizations as described above. Overall, the predicted values of (λ) underestimate the observed values by about 10% (Figures 3C,D, 5A) with greatest accuracy achieved in the region between 350 and 700 nm. Relatively more scatter was seen in the UV region between 300 and 350 nm. Figure 5B is a compilation of net growth normalized to the maximum value of the experiment vs. irradiance for the data presented here, Moisan and Mitchell (1999), and data from the literature for the genus Phaeocystis. To estimate an Ekμ value to introduce into Equation (1b), we used a non-linear curve fit (Platt et al., 1980) for the full data synthesis in Figure 5B. This fit resulted in a single value of μm and α for the full data set in Figure 5B that we used to estimate a generalized value of Ekμ (μm/α) for Phaeocystis spp. This resulted in a Ekμ value of 110 μmol quanta m−2 s−1 overall fit with r2 = 0.83 (Figure 5B). We also explored modeling using Ekμ determined from each individual growth vs. irradiance data set at the different temperatures (Figure 1A) but that did not improve the overall variance in our biophysical model so we kept the model simpler by using one generalized value determined from our data and literature synthesis (Figure 5B).
We predicted values of ϕμ using a cumulative one hit Poisson probability parameterization where ϕmEo,T in Equation (1b) is predicted from temperature and light (Equation 5). The ϕμ model also requires an input variable for Ekμ. Figure 5B combines data for Phaeocystis spp. presented in Moisan and Mitchell (1999) and the new data for −1.5, 0, and 2°C treatments that are presented here. Using the combined data set, we have derived an Ekμ. Our sensitivity analysis shows that the ϕμ is the most sensitive to ϕmEo,T as compared to Ekμ.We prefer the use of a composite Ekμ at this time although in principle it should depend on environmental acclimation, in this case the steady-state conditions we imposed in our experiment. Although we acknowledge that in nature both light and temperature may fluctuate on time scales faster than division rates and hence impact acclimation, our experiments were not designed to resolve that additional, and potentially important, variability. We conducted a sensitivity analysis of ϕμ that indicates that the relative magnitude of the error is greatest at high intensities; however, the absolute error is minor. These assumptions are justified on the basis that the entire equation is dependent on φmax. We do observe some variability in Ekμ between the lower temperature treatments and the 4°C treatment (Figure 1A). We derived a composite Ekμ from the intersection between the initial slope of the growth curve and the maximal growth rate (Figure 5B). The use of a generic Ekμ is appropriate because of the overall variability in growth curves with respect to irradiance for various Phaeocystis spp. Also, a sensitivity analysis of Ekμ within the model revealed that ϕμ was relatively insensitive to the changes that we observed in Ekμ. Using an Ekμ value of 110 μmol quanta m−2 s−1 and a temperature-light dependent model of ϕmEo,T results in an excellent prediction of ϕμ (Figure 5C, r2 = 0.80). Using these individual component models for (λ) and ϕmEo,T in Equations (1a,b), a comparison between observed and predicted values of μn (Figure 5D; r2 = 0.66). The simple empirical model using only temperature and light resulted in a slightly better estimate (r2 = 0.70; Figure 1C) however that empirical approach does not include the mechanistic dynamics of changes in (λ) and ϕmEo,T that represent how light and temperature co-limitation regulate the cellular physiology.
Although we used a single value of Ekμ a sensitivity analysis proved that using the estimated Ekμ for the different temperatures did not improve our model fit. Also, our quantum yields for growth are a net process of growth after respiration which can be important in nature (Grégori et al., 2002; Siegel et al., 2002; Marra and Barber, 2004; López-Urrutia et al., 2006). Our quantum yield for net growth calculations can be defined by:
Although respiration is often modeled as a fixed ratio to growth rate, or a basal a rate plus a fixed fraction of growth rate, this likely is not so simple. There are relatively few data sets in the literature for phytoplankton respiration over a range of growth conditions and we did not estimate respiration for our study. Respiration data that is commonly used in models is very noisy (Laws and Bannister, 1980; Geider et al., 1998) and is mostly limited to a modest range of intensity from about 50–200 μmol quanta m−2 s−1 so the fidelity of respiration models may not be robust over the full range of light intensity that is relevant to phytoplankton communities. One expects that the ratio of respiration to net growth (R/μn) will actually go to infinity at the limit as light goes to zero where there is no photosynthesis but basal respiration continues. Also, for the growth inhibiting irradiances greater than about 150 μmol quanta m−2 s−1 we observed at lower temperatures (Figure 1A), we speculate that the ratio of R/μn also must increase. Models that assume a basal respiration rate plus a fixed fraction of growth rate will not predict this increase in R/μn at higher growth inhibiting irradiances but will instead predict lower respiration as growth rate decreases. This seems flawed since inhibiting irradiances would cause damage from oxidative stress and hence very likely a greater respiration rate, not a lower rate. These two thought experiments based on simple logic indicate that it is important to obtain more data that includes respiration at very low light that and also at high growth inhibiting irradiances, but such data is lacking in the literature.
Our biophysical model includes explicit descriptions of the regulation of absorption and quantum yield by environmental controls which results both in an accurate model of net growth and captures details of light and temperature regulation of the biophysical variables that mediate light utilization. Our quantum yields for growth were calculated in a traditional way of modeling based on carbon, chlorophyll a, phytoplankton absorption, and spectral irradiance flux. However, our estimates are relatively high compared to other phytoplankton; our high C: chl a ratios are above the typical ratio of 75–150 for phytoplankton (Falkowski and Raven, 2007). This is likely due to the fact that Phaeocystis can accumulate a carbohydrate/glucan-rich mucilage that is not metabolically active in addition to metabolically active cellular carbon. Mathot et al. (2000) estimates that mucus-related carbon at peak bloom is about 14 ± 4% of total colony carbon but mucus-related carbon may be as high as 90% for a senescent bloom (Verity and Medlin, 2003). The colonial matrix acts as a spillover mechanism probably for storage of low molecular weight compounds (Lancelot and Mathot, 1985) and hence may accumulate when there is excess light.
Although natural systems may have substantial variations in both light and temperature over time-scales that are much less than the doubling times that will affect acclimation of algae in a more complicated way than the simple steady-state experiments we conducted, it is very time consuming to try to add that complexity to the matrix of growth and acclimation control. There is a relatively small literature for the steady-state co-limitation of light, nutrients and temperature acclimation of cellular pigments, absorption, quantum yield and growth (Laws and Bannister, 1980; Kiefer and Mitchell, 1983; Sosik and Mitchell, 1991, 1994; Geider et al., 1997). There is even more limited knowledge for cold water obligate psychrophiles like P. antarctica, for example the study of Luxem et al. (2017) who explored light and iron limitation for this organism. In the area of applied phycology aimed at commercial production, recent work with a similar experimental design for light and temperature as ours, for the seaweed Gracilaria, Nejrup et al. (2013), reported growth rates and metabolic capacity. Grobbelaar et al. (1996) have explored microalgae acclimated to different light levels, then exposed to light fluctuations that would be found in commercial cultivation. However, neither of these studies quantified spectral absorption or quantum yield, that ultimately underlie the responses for growth and bulk PvsE relationships. Our work advances the state of knowledge with greater detail of how light and temperature combined affect acclimation of the fundamental biophysical parameters light absorption and quantum yield of algae and provides a level of detail not previously reported for the ecologically important prymnesiophyte, Phaeocystis antarctica, that is a key structural component of the Southern Ocean and that may show changes in its role as stratification and heating of the Southern Ocean change both light and temperature climate in the future.
Conclusions
Understanding the contribution of Phaeocystis in the overall global carbon cycle is important because this genus can dominate mesoscale blooms and make a significant contribution to the carbon and sulfur cycle for open and coastal oceans as well in the vicinity of ice edges. The strain of P. antarctica we used for these experiments exhibits flexibility in its ability to absorb light due to changes in cell size and the cellular concentrations of photoprotective and photosynthetic pigments that are regulated by light and temperature co-limitation. These cellular changes have consequences for how P. antarctica captures light required for carbon fixation. Photo-protective pigments that divert absorbed photons from the photosynthetic reaction centers will automatically result in photosynthetic quantum yields below the theoretical maximum. Using data from our controlled laboratory experiments, we have developed both empirical and biophysical models that predict growth rates based on knowledge of chlorophyll a, light, and temperature. It is important to note that unlike some proposed models that depend only on easily measured variables our biophysical model, (λ) and ϕμ is parameterized based on light and temperature since nutrients are not regulating during the onset and development of blooms. We propose a conceptually important improvement over previous models by accepting the fact that the maximum quantum yield for any acclimated state may be considerably less than the theoretical maximum (Moisan and Mitchell, 1999) and that it should be regulated by environmental control, in this case light and temperature co-regulation. In general, (λ), Ekm and ϕμ, should all be modeled as variables determined by the simultaneous interaction of light, temperature, and nutrients. Furthermore, future ocean color missions with hyperspectral ability, such as PACE, may be capable of remote sensing phytoplankton spectral shape that we document changes significantly with different acclimation states (Figure 2). Such a capability might allow a link between community structure, photosynthetic processes and the biophysical model for absorption, cellular pigmentation and pigment packaging that is dependent on light and temperature co-limitation (see also Wang et al., 2016; Moisan et al., 2017). While this level of detail remains aspirational for our community, an accurate understanding of how biophysical variables (Equation 1) depend on the full matrix of environmental forcing requires these essential but time-consuming laboratory studies for representative taxa over the full range of environmental variability experienced by phytoplankton to advance our ability to apply advanced remote sensing methods to coastal processes of primary production and the carbon cycle.
Author Contributions
TM: Supervised all experiment, sample analysis and data analysis; TM and BGM: Contributed equally to writing, editing, graphics, and tables.
Funding
Support for this work was provided by ONR grant N00014-91-J-1186 and NASA Award # NNX15AC98G (BGM) and the NASA Biodiversity Program (05-TEB/05-0016) (TM).
Conflict of Interest Statement
The authors declare that the research was conducted in the absence of any commercial or financial relationships that could be construed as a potential conflict of interest.
Acknowledgments
We thank S. Cheng for excellent technical assistance; M. Vernet for insightful recommendations throughout this study and comments on earlier versions of the manuscript; M. Olaizola and R. Goericke for assistance with HPLC analysis and thoughtful discussions regarding pigment data; N. Delaney, N. Crawford, M. Cape, and M. Linkswiler for programming assistance; and M. Anderson for final manuscript preparation.
References
Arrigo, K. R., Robinson, D. H., Worthen, D. L., Dunbar, R. B., DiTullio, G. R., VanWoert, M., et al. (1999). Phytoplankton community structure and the drawdown of nutrients and CO2 in the southern ocean. Science 283, 365–367. doi: 10.1126/science.283.5400.365
Arrigo, K. R., Worthen, D., Schnell, A., and Lizotte, M. P. (1998). Primary production in Southern Ocean waters. J. Geophys. Res. 103, 15587–15600.
Arteaga, L., Pahlow, M., and Oschlies, A. (2014). Global patterns of phytoplankton nutrient and light co-limitation inferred from an optimality GÇÉ based model. Glob. Biogeochem. Cycle 28, 648–661. doi: 10.1002/2013GB004668
Arteaga, L., Pahlow, M., and Oschlies, A. (2016). Modeled Chl: C ratio and derived estimates of phytoplankton carbon biomass and its contribution to total particulate organic carbon in the global surface ocean. Glob. Biogeochem. Cycle 30, 1791–1810. doi: 10.1002/2016GB005458
Behrenfeld, M. J., Boss, E., Siegel, D. A., and Shea, D. M. (2005). Carbon-based ocean productivity and phytoplankton physiology from space. Glob. Biogeochem. Cycle 19:GB1006. doi: 10.1029/2004GB002299
Behrenfeld, M. J., Marañón, E., Siegel, D. A., and Hooker, S. B. (2002). Photoacclimation and nutrient-based model of light-saturated photosynthesis for quantifying oceanic primary production. Mar. Ecol. Prog.Ser. 228, 103–117. doi: 10.3354/meps228103
Carder, K. L., Lee, Z. P., Marra, J., Steward, R. G., and Perry, M. J. (1995). Calculated quantum yield of photosynthesis of phytoplankton in the marine light-mixed layers (59oN, 21oW). J. Geophys. Res. 100, 6655–6663.
Ciotti, A. M., Lewis, M. R., and Cullen, J. J. (2002). Assessment of the relationships between dominant cell size in natural phytoplankton communities and the spectral shape of the absorption coefficient. Limnol. Oceanogr. 47, 404–417. doi: 10.4319/lo.2002.47.2.0404
Cleveland, J. S., Perry, M. J., Kiefer, D. A., and Talbot, M. C. (1989). Maximum quantum yield of photosynthesis in the northwestern Sargasso Sea. J. Mar. Res. 47, 869–892. doi: 10.1357/002224089785076055
Cota, G. F., Smith, W. O. Jr., and Mitchell, B. G. (1994). Photosynthesis of Phaeocystis in the Greenland Sea. Limnol. Oceanogr. 39, 948–953. doi: 10.4319/lo.1994.39.4.0948
Cullen, J. J. (1990). On models of growth and photosynthesis in phytoplankton. Deep Sea Res. Part A 37, 667–683.
Diner, B., and Mauzerall, D. (1973). Feedback controlling oxygen production in a cross-reaction between two photosystems in photosynthesis. Biochim. Biophys. Acta 305, 329–352.
DiTullio, G. R., Grebmeier, J. M., Arrigo, K. R., Lizotte, M. P., Robinson, D. H., Leventer, A., et al. (2000). Rapid and early export of Phaeocystis antarctica blooms in the Ross Sea, Antarctica. Nature 404, 595–598. doi: 10.1038/35007061
Dubinsky, Z., Falkowski, P. G., and Wyman, K. (1986). Light harvesting and utilization by phytoplankton. Plant Cell Physiol. 27, 1335–1349. doi: 10.1093/oxfordjournals.pcp.a077232
Dubinsky, Z. V., and Stambler, N. (2009). Photoacclimation processes in phytoplankton: mechanisms, consequences, and applications. Aquat. Microb. Ecol. 56, 163–176. doi: 10.3354/ame01345
Edwards, K. F., Thomas, M. K., Klausmeier, C. A., and Litchman, E. (2016). Phytoplankton growth and the interaction of light and temperature: a synthesis at the species and community level. Limnol. Oceanogr. 61, 1232–1244. doi: 10.1002/lno.10282
Emerson, R., and Lewis, C. M. (1943). The dependence of the quantum yield of photosynthesis on the wavelength of light. Am. J. Bot. 30, 165–178.
Eppley, R. W. (1972). Temperature and phytoplankton growth in the sea. Fish. Bull. Nat. Ocean. Atmos. Adm. 70, 1063–1085.
Falkowski, P. G., and Raven, J. (2007). Aquatic Photosynthesis, 2nd Edn. Princeton, NJ: Princeton University Press.
Geider, R. J., MacIntyre, H. L., and Kana, T. M. (1997). Dynamic model of phytoplankton growth and acclimation: responses of the balanced growth rate and the chlorophyll a: carbon ratio to light, nutrient-limitation and temperature. Mar. Ecol. Prog. Ser. 148l, 187–200.
Geider, R. J., MacIntyre, H. L., and Kana, T. M. (1998). A dynamic regulatory model of phytoplanktonic acclimation to light, nutrients, and temperature. Limnol. Oceanogr. 43, 679–694.
Gieskes, W. W. C., Leterme, S. C., Peletier, H., Edwards, M., and Reid, P. C. (2007). Phaeocystis colony distribution in the North Atlantic Ocean since 1948, and interpretation of long-term changes in the Phaeocystis hotspot in the North Sea. Biochemistry 83, 49–60. doi: 10.1007/s10533-007-9082-6
Goldman, J. C., and Carpenter, E. J. (1974). A kinetic approach to the effect of temperature on algal growth. Limnol. Oceanogr. 19, 756–766.
Graff, J. R., Westberry, T. K., Milligan, A. J., Brown, M., Dall'Olmo, G., Reifel, K. M., et al. (2016). Photoacclimation of natural phytoplankton communities. Mar. Ecol. Prog. Ser. 542, 51–62. doi: 10.3354/meps11539
Grégori, G., Denis, M., Lefèvre, D., and Beker, B. (2002). A flow cytometric approach to assess phytoplankton respiration. Methods Cell Sci. 24, 99–106. doi: 10.1023/A:1024110418448
Grobbelaar, J. U., Nedbal, L., and Tichy, V. (1996). Influence of high frequency light/dark fluctuations on photosynthetic characteristics of microalgae photoacclimated to different light intensities and implications for mass algal cultivation. J. Appl. Phycol. 8, 335–343. doi: 10.1007/BF02178576
Gulliard, R. R., and Ryther, J. H. (1962). Studies on marine planktonic diatoms. I. Cyclotella nana Hustedt and Detonula confervacea (Cleve) Gran. Can. J. Microbiol. 8, 229–239.
Gypens, N., Lacroix, G., and Lancelot, C. (2007). Causes of variability in diatom and Phaeocystis blooms in Belgian coastal waters between 1989 and 2003: a model study. J. Sea Res. 57, 19–35. doi: 10.1016/j.seares.2006.07.004
Johnsen, Z., and Barber, R. T. (2003). The low-light reduction in the quantum yield of photosynthesis: potential errors and biases when calculating the maximal quantum yield. Photosyn. Res. 75, 85–95. doi: 10.1023/A:1022440305765
Kiefer, D. A., and Mitchell, B. G. (1983). A simple steady state description of phytoplankton growth based on absorption cross section and quantum efficiency. Limnol. Oceanogr. 28, 770–776.
Kishino, M., Takahashi, M., Okami, N., and Ichimura, S. (1985). Estimation of spectral absorption coefficients of phytoplankton in the sea. Bull. Mar. Sci. 37, 634–642.
Lacour, T., Lariviere, J., and Babin, M. (2017). Growth, Chl a content, photosynthesis, and elemental composition in polar and temperate microalgae. Limnol. Oceanogr. 1, 43–48. doi: 10.1002/lno.10369
Lancelot, C., and Mathot, S. (1985). Biochemical fractionation of primary production by phytoplankton in Belgian coastal waters during short- and long-term incubations with C-bicarbonate II. Phaeocystis poucheti colonial population. Mar. Biol. 86, 227–232.
Laws, E. A., and Bannister, T. T. (1980). Nutrient- and light-limited growth of Thalassiosira fluviatilis in continuous culture, with implications for phytoplankton growth in the ocean. Limnol. Oceanogr. 25, 457–473.
Laws, E., Sakshaug, E., Babin, M., Dandonneau, Y., Falkowski, P., Geider, R., et al. (2002). Photosynthesis and primary productivity in marine ecosystems: Practical aspects and application of techniques. Scientific Committee on Oceanic Research, JGOFS Report No. 36, 1–89.
Li, W. K. W. (1980). “Temperature adaptation in phytoplankton: cellular and photosynthetic characteristics,” in Primary Productivity in the Sea, ed P. G. Falkowski (New York, NY: Plenum), 259–279.
Lizotte, M. P., and Sullivan, C. W. (1991). Photosynthesis-irradiance relationships in microalgae associated with Antarctic pack ice: evidence for in situ activity. Mar. Ecol. Prog. Ser. 71, 175–184. doi: 10.3354/meps071175
López-Urrutia, A., San Martin, E., Harris R. P., and Irigoien, X. (2006). Scaling the metabolic balance of the oceans. Proc. Natl. Acad. Sci. U.S.A. 103, 8739–8744. doi: 10.1073/pnas.0601137103
Luning, K., and Dring, M. J. (1985). Action spectra and spectral quantum yield of photosynthesis in marine macroalgae with thin and thick thalli. Mar. Biol. 87, 119–129. doi: 10.1007/BF00539419
Luxem, K. E., Ellwood, M. J., and Strzepek, R. F. (2017). Intraspecific variability in Phaeocystis antarctica's response to iron and light stress. PLoS ONE 12:e0179751. doi: 10.1371/journal.pone.0179751
Marquardt, D. W. (1963). An algorithm for least squares estimations of parameters. J. Soc. Ind. Appl. Math. 11, 431–441.
Marra, J., and Barber, R. T. (2004). Phytoplankton and heterotrophic respiration in the surface layer of the ocean. Geophys. Res. Lett. 31:L09314. doi: 10.1029/2004GL019664
Marra, J., Langdon, C., and Knudson, C. A. (1995). Primary production, water column changes, and the demise of Phaeocystis bloom at the Marine Light-Mixed Layers site (59oN, 21oW) in the northeast Atlantic Ocean. J. Geophys. Res. 100, 6633–6643.
Mathot, S., Smith, W. O. Jr, Carlson, C. A., Garrison, D. L., Gowing, M. M., and Vickers, C. L. (2000). Carbon partitioning within Phaeocystis antarctica (Prymnesiophyceae) colonies in the Ross Sea, Antarctica. J. Phycol. 36, 1049–1056. doi: 10.1046/j.1529-8817.2000.99078.x
Mitchell, B. G. (1990). “Algorithms for determining the absorption coefficient of aquatic particulates using the quantitative filter technique (QFT),” in Ocean Optics X, ed R. Spinrad (Bellingham, WA: SPIE), 37–148.
Mitchell, B. G., Bricaud, A., Carder, K., Cleveland, J., Ferrari, G., Gould, R., et al. (2000). “Determination of spectral absorption coefficients of particles, dissolved material and phytoplankton for discrete water samples,” in Ocean Optics Protocols For Satellite Ocean Color Sensor Validation (Greenbelt, MD: NASA/TM-2000-209966), 125–153.
Mitchell, B. G., and Kiefer, D. A. (1988). Variability in pigment specific particulate fluorescence and absorption spectra in the northeastern Pacific Ocean. Deep Sea Res. Part I 35, 665–689.
Moisan, J. R., Moisan, T. A., and Abbot, M. R. (2002). Modeling the effects of temperature on the maximum growth rates of phytoplankton growth. Ecol. Model. 153, 197–215. doi: 10.1016/S0304-3800(02)00008-X
Moisan, T. A., Ellisman, M. H., Buitenhuys, C. W., and Sosinsky, G. E. (2006). Differences in chloroplast ultrastructure of Phaeocystis antarctica in low and high light. Mar. Biol. 149, 1281–1290. doi: 10.1007/s00227-006-0321-5
Moisan, T. A., and Mitchell, B. G. (1999). Photophysiological adaptation of Phaeocystis antarctica Karsten under PAR light limitation. Limnol. Oceanogr. 44, 247–258. doi: 10.4319/lo.1999.44.2.0247
Moisan, T. A., and Mitchell, B. G. (2001). UV absorption by mycosporine-like amino acids in Phaeocystis antarctica Karsten. Mar. Biol. 138, 217–227. doi: 10.1007/s002270000424
Moisan, T. A., Rufty, K. M., Moisan, J. R., and Linkswiler, M. A. (2017). Satellite observations of phytoplankton functional type spatial distributions, phenology, diversity, and ecotones. Front. Mar. Sci. 4:189. doi: 10.3389/fmars.2017.00189
Nejrup, L. B., Staehr, P. A., and Thomsen, M. S. (2013). Temperature- and light-dependent growth and metabolism of the invasive red algae Gracilaria vermiculophylla- a comparison with two native macroalgae. Eur. J. Phycol. 48, 295–308. doi: 10.1080/09670262.2013.830778
Nelson, N. B., and Prézelin, B. B. (1990). Chromatic light effects and physiological modeling of absorption properties of Heterocapsa pygmaea (= Glenodinium sp.). Mar. Ecol. Prog. Ser. 63, 37–46.
Pabi, S., and Arrigo, K. R. (2006). Satellite estimation of marine particulate organic carbon in waters dominated by different phytoplankton taxa. J. Geophys. Res. 111:C09003,
Pavlov, A. K., Taskjelle, T., Kauko, H. M., Hamre, B., Hudson, S. R., Assmy, P., et al. (2017). Altered inherent optical properties and estimates of the underwater light field during an Arctic under-ice bloom of Phaeocystis pouchetii. J. Geophys. Res. Oceans 122, 4939–4961. doi: 10.1002/2016JC012471
Platt, T., Gallegos, C. L., and Harrison, W. G. (1980). Photoinhibition of photosynthesis in natural assemblages of marine phytoplankton. J. Mar. Res. 38, 687–701.
Reynolds, R. A., Stramski, D., and Mitchell, B. G. (2001). A chlorophyll-dependent semi-analytical reflectance model derived from field measurements of absorption and backscattering coefficients within the Southern Ocean. J. Geophys. Res. 106, 7125–7138. doi: 10.1029/1999JC000311
Rhee, G. Y., and Gotham, I. J. (1981a). The effect of environmental factors on phytoplankton growth: light and the interactions of light with nitrate limitation. Limnol. Oceanogr. 26, 649–659.
Rhee, G. Y., and Gotham, I. J. (1981b). The effect of environmental factors on phytoplankton growth: temperature and the interactions of temperature with nutrient limitation. Limnol. Oceanogr. 26, 635–648.
Sakshaug, E., Andresen, K., and Kiefer, D. A. (1989). A steady state description of growth and light absorption in the marine planktonic diatom Skeletonema costatum. Limnol. Oceanogr. 34, 198–205. doi: 10.4319/lo.1989.34.1.0198
Sedwick, P. N. (2007). Evidence of high iron requirements of colonial Phaeocystis antarctica at low irradiance. Biochemistry 83, 83–97. doi: 10.1007/s10533-007-9081-7
Shuter, B. (1979). A model of physiological adaptation in unicellular algae. J. Theor. Biol. 78, 519–552.
Siegel, D. A., Doney, S. C., and Yoder, J. A. (2002). The North Atlantic spring Phytoplankton bloom and Sverdrup's critical depth hypothesis. Science 296, 730–733. doi: 10.1126/science.1069174
Smith, R. C., Prézelin, B. B., Bidigare, R. R., and Baker, K. S. (1989). Bio-optical modeling of photosynthetic production in coastal waters. Limnol. Oceanogr. 34, 1524–1544.
Smith, W. O. Jr., Codispoti, L. A., Nelson, D. M., Manley, T., Buskey, E. J., Niebauer, H. J., et al. (1991). Importance of Phaeocystis blooms in the high-latitude ocean carbon cycle. Nature 352, 514–516.
Smith, W. O., Dennett, M. R., Mathot, S., and Caron, D. A. (2003). The temporal dynamics of the flagellated and colonial stages of Phaeocystis antarctica in the Ross Sea. Deep Sea Res. Part II 50, 605–617. doi: 10.1016/S0967-0645(02)00586-6
Smith, W. O., Shields, A. R., Peloquin, J. A., Catalano, G., Tozzi, S., Dinniman, M. S., et al. (2006). Interannual variations in nutrients, net community production, and biogeochemical cycles in the Ross Sea. Deep Sea Res. Part II 53, 815–833. doi: 10.1016/j.dsr2.2006.02.014
SooHoo, J. B., Palmisano, A. C., Kottmeier, S. T., Lizotte, M. P., SooHoo, S. L., and Sullivan, C. W. (1987). Spectral light absorption and quantum yield of photosynthesis in sea ice microalgae and a bloom of Phaeocystis pouchetii from McMurdo Sound, Antarctica. Mar. Ecol. Prog. Ser. 39, 175–189.
Sosik, H. M. (1996). Bio-optical modeling of primary production: consequences of variability in quantum yield and specific absorption. Mar. Ecol. Prog. Ser. 143, 225–238.
Sosik, H. M., and Mitchell, B. G. (1991). Absorption, fluorescence and quantum yield for growth in nitrogen limited Dunaliella tertiolecta. Limnol. Oceanogr. 36, 910–921. doi: 10.4319/lo.1991.36.5.0910
Sosik, H. M., and Mitchell, B. G. (1994). Effects of temperature on growth, light absorption, and quantum yield in Dunalliela tertiolecta (chlorophyceae). J. Phycol. 30, 833–840.
Sosik, H. M., and Mitchell, B. G. (1995). Light absorption by phytoplankton, photosynthetic pigments, and detritus in the California current system. Deep Sea Res. Part I 42, 1717–1748. doi: 10.1016/0967-0637(95)00081-G
Stuart, V., Sathyendranath, S., Head, E. J. H., Platt, T., Irwin, B., and Maass, H. (2000). Bio-optical characteristics of diatoms and prymnesiophyte populations in the Labrador Sea. Mar. Ecol. Prog. Ser. 201, 91–106. doi: 10.3354/meps201091 (Sverdrup's Critical Depth Hypothesis. Science 296, 730–733).
Sunda, W. G., and Huntsman, S. A. (1997). Interrelated influence of iron, light and cell size on marine phytoplankton growth. Nature 390, 389–392. doi: 10.1038/37093
Sunda, W. G., and Huntsman, S. A. (2011). Interactive effects of light and temperature on iron limitation in a marine diatom: implications for marine productivity and carbon cycling. Limnol. Oceanogr. 56, 1475–1488. doi: 10.4319/lo.2011.56.4.1475
Tilzer, M. M., and Dubinsky, Z. (1987). Effects of temperature and day length on the mass balance of Antarctic Phytoplankton. Polar Biol. 7, 35–42.
Vaillancourt, R. D., Marra, J., Barber, R. T., and Smith, W. O. (2003). Primary productivity and in situ quantum yields in the Ross Sea and Pacific Sector of the Antarctic circumpolar current. Deep Sea Res. Partt. II 50, 559–578. doi: 10.1016/S0967-0645(02)00584-2
van Leeuwe, M. A., and Stefels, J. (2007). Photosynthetic responses in Phaeocystis antarctica towards varying light and iron conditions. Biochemistry 83, 61–70. doi: 10.1007/s10533-007-9083-5
van Leeuwe, M. A., Stefels, J., Belviso, S., Lancelot, C., Verity, P. G., and Gieskes, W. W. C. (2007). Phaeocystis, Major Link in the Biogeochemical Cycling of Climate-Relevant Elements. Dordrecht: Springer.
Verity, P. G., and Medlin, L. K. (2003). Observations on colony formation by the cosmopolitan phytoplankton genus Phaeocystis. J. Mar. Syst. 43, 153–164. doi: 10.1016/j.jmarsys.2003.09.001
Wang, G., Lee, Z. P., Mishra, D. R., and Ma, R. (2016). Retrieving absorption coefficients of multiple phytoplankton pigments from hyperspectral remote sensing reflectance measured over cyanobacteria bloom waters. Limnol.Oceanogr. Methods 14, 432–447. doi: 10.1002/lom3.10102
Welschmeyer, N. A. (1994). Fluorometric analysis of chlorophyll a in the presence of chlorophyll b and phaeopigments. Limnol. Oceanogr. 39, 1985–1992.
Westberry, T., Behrenfeld, M. J., Siegel, D. A., and Boss, E. (2008). Carbon-based primary productivity modeling with vertically resolved photoacclimation. Glob. Biogeochem. Cycle 22:GB2024. doi: 10.1029/2007GB003078
Wright, S. W., Jeffrey, S. W., Mantoura, R. F. C., Llewellyn, C. A., Björnland, T., Repeta, D., et al. (1991). Improved HPLC method for the analysis of chlorophylls and carotenoids from marine phytoplankton. Mar. Ecol. Prog. Ser. 77, 183–196.
Keywords: Phaeocystis, phytoplankton, photosynthesis, modeling, co-limitation, photophysiology, quantum yield, absorption
Citation: Moisan TA and Mitchell BG (2018) Modeling Net Growth of Phaeocystis antarctica Based on Physiological and Optical Responses to Light and Temperature Co-limitation. Front. Mar. Sci. 4:437. doi: 10.3389/fmars.2017.00437
Received: 06 July 2017; Accepted: 20 December 2017;
Published: 23 February 2018.
Edited by:
François G. Schmitt, Centre National de la Recherche Scientifique (CNRS), FranceReviewed by:
Fabrice Lizon, Lille University of Science and Technology, FranceRaghab Ray, UMR6539 Laboratoire des Sciences de L'environnement Marin (LEMAR), France
Copyright © 2018 Moisan and Mitchell. This is an open-access article distributed under the terms of the Creative Commons Attribution License (CC BY). The use, distribution or reproduction in other forums is permitted, provided the original author(s) and the copyright owner are credited and that the original publication in this journal is cited, in accordance with accepted academic practice. No use, distribution or reproduction is permitted which does not comply with these terms.
*Correspondence: B. Greg Mitchell, gmitchell@ucsd.edu
†Deceased.