First Deployment and Validation of in Situ Silicate Electrochemical Sensor in Seawater
 Carole Barus1*†
  Dancheng Chen Legrand1† Nicolas Striebig2
  Benoit Jugeau3 Arnaud David3 Maria Valladares4,5
  Praxedes Munoz Parra4,5
  Marcel E. Ramos4,5,6 Boris Dewitte1,4,5,6 Véronique Garçon1
- 1Laboratoire d'Etudes en Géophysique et Océanographie Spatiales, UMR 5566, Université de Toulouse, Centre National de la Recherche Scientifique, CNES, IRD, UPS, Toulouse, France
- 2Observatoire Midi-Pyrénées, Toulouse, France
- 3NKE Instrumentation, Hennebont, France
- 4Centre for Advanced Studies in Arid Zones, La Serena, Chile
- 5Departamento de Biología Marina, Facultad de Ciencias del Mar, Universidad Católica del Norte, Coquimbo, Chile
- 6Millennium Nucleus for Ecology and Sustainable Management of Oceanic Islands, Coquimbo, Chile
An electrochemical sensor is proposed to measure silicate concentration, in situ, in the ocean without any addition of liquid reagent. From the analytical principle to the laboratory prototype toward the first in situ, immersible sensor, the evolution of the mechanical design is presented and discussed. The developed in situ electronics were compared to the commercial potentiostat and gave promising results to detect low silicate signals with a limit of quantification of 1 μmol L−1.The flow rate of the pump appeared to be a crucial parameter in order to transfer the silicomolybdic complex formed from the “complexation cell” to the “detection cell” without dilution as well as to fill and rinse the whole circuit. The study of temperature effect revealed no influence on the electrochemical signal between ~7° and ~21°C. Finally the sensor was successfully deployed for the very first time on a mooring off Coquimbo, Chile and also integrated onto a PROVOR profiling float in the Mediterranean Sea off Villefranche-sur-Mer, France. The data collected and/or sent through satellite were in good agreement with the 2 reference samples and previously published values illustrating the great potential of this electrochemical sensor. A 7 days silicate time series from the mooring deployment off Chile is also presented.
Introduction
Among all macronutrients in the ocean, silicate (Si(OH)4) is assimilated by specific planktonic functional types such as diatoms to build their skeletal structures. Diatoms are estimated to contribute up to 45% of the total ocean primary production (DeMaster, 1981; Tréguer et al., 1995; Mann, 1999; Yool and Tyrrell, 2003; Tréguer and De La Rocha, 2013; Bristow et al., 2017). Like the other nutrient cycles (nitrogen, phosphorus), the silicate cycle is linked with the global carbon cycle and participates in carbon dioxide (CO2) sequestering in the ocean (Dugdale et al., 1995; Dugdale and Wilkerson, 1998; Falkowski et al., 1999; Yool and Tyrrell, 2003; Arrigo, 2005; Matear et al., 2010; Frings et al., 2016). To better understand the biogeochemical cycles, and the global carbon cycle and evaluate the consequences of anthropogenic nutrients releases and climate change, oceanic data are required with a very high spatio-temporal resolution. With this novel knowledge, climate models could be improved to accurately predict responses to future climate forcing events. The development of in situ sensors and oceanic observing systems to be deployed on autonomous underwater vehicles will provide extensive data-bases and unprecedented opportunity to study the ocean at much wider spatio-temporal scales than what was possible only a few years ago (COCA Working Group, 2014).
Oceanographic nutrient measurements are commonly made using traditional, discrete shipboard sampling techniques and on-board analyses (Patey et al., 2008; Ma et al., 2014). Over the past decade, significant progress has been made in the development of in situ nutrient sensors and a few sensors are commercially available to measure nitrate and phosphate (Thouron et al., 2003; Johnson et al., 2013; Legiret et al., 2013; Grand et al., 2017). Silicate is traditionally analyzed by spectrophotometric/colorimetry methods requiring liquid reagents addition (wet chemical techniques) (Thouron et al., 2003; Ma et al., 2014). We propose to use an electrochemical sensor to detect silicate without any liquid reagent addition using an in situ oxidation of a molybdenum electrode to form the silicomolybdic complex detectable on gold working electrode, thanks to a special design of the electrochemical cell using Nafion® membrane. The limit of quantification achieved using a 2 mm diameter working electrode and commercial potentiostat was 0.5 μmol L−1 (Lacombe et al., 2008; Aguilar et al., 2015).
This work presents the optimization of electrochemical parameters, the development of the in situ electronics and the transition of the mechanical design from the laboratory electrochemical cell to the first in situ immersible silicate sensor. The sensor will be characterized and validated. We will discuss the effect of temperature on the electrochemical detection as well as on the silicate complexation reaction. Finally the results obtained during the silicate sensor deployments on a mooring in the Chilean upwelling in the Pacific Ocean and also in the Mediterranean Sea off Villefranche-sur-Mer implemented on a PROVOR float will be shown.
Experimental Section
Chemicals and Material
All solutions were prepared in Milli-Q water (Millipore Milli-Q water system) and put into plastic containers (polymethylpentene or polypropylene); glass is not used in order to avoid silicate contamination in solution. Silicate solutions were prepared either with sodium hexafluorosilicate (Na2SiF6, from Carlo Erba) or from certified standard solution of sodium silicate (Na2SiO3, H2O, from Alfa Aesar) at 1001 ± 5 μg mL−1 in the concentration range between 5 and 65 μmol L−1 for sensor calibration.
The electrolytes for prepared solutions were either sodium chloride solution, pH ≈ 4.5, (NaCl supplied by Merck) at 34.5 g L−1 ([Cl−] = 0.6 mol L−1), or artificial seawater, pH ≈ 7 made with 30.36 g of sodium chloride ([Cl−] = 0.52 mol L−1), 6.74 g of magnesium sulfate heptahydrate (MgSO4, 7H2O, VWR) and 0.16 g of sodium hydrogenocarbonate (NaHCO3, VWR).
All metals were purchased from GoodFellow (molybdenum, silver, gold, platinum, titanium). A conventional three-electrode system was used for all experiments with gold working electrodes (for the silicomolybdic complex detection) made with gold wire inserted into epoxy resin. Prior to experiments, gold electrodes were first polished with aluminum oxide (0.3 μm diameter). Then, they were electrochemically cleaned in 0.5 mol L−1 sulphuric acid solution (prepared from a 98% H2SO4 solution supplied by Merck) by polarizing the electrode 10 s at +2 V and 10 s at −2 V to form O2 and H2 bubbles, respectively, at the electrode surface. Then, cyclic voltammograms were recorded between E1 = 0 V and E2 = 1.5 V at 100 mV s−1 until reproducible cycles were obtained. The reference electrode was a silver-silver chloride (Ag/AgCl/Cl−) either a commercial electrode (with [Cl−] = 3 mol L−1, Metrohm®) or made with silver wire potted into epoxy resin covered with silver chloride layer and immersed into chloride solution ([Cl−] concentration depending on the electrolyte/seawater being used). The design/geometry of the molybdenum electrodes used to form the reagents was adapted to the corresponding cell. Platinum or titanium grids acted as counter electrodes.
Electrochemical Cells and Designs
Two electrochemical cells (i.e., “open cell” and “small volume laboratory prototype”) were used to validate the method and optimize all the parameters before transferring them on the in situ electrochemical sensor. All the electrochemical measurements using the 2 laboratory cells were carried out at room temperature, under atmospheric conditions with μ-Autolab III potentiostat (Metrohm) using the NOVA software.
The “open cell” (not shown) corresponds to a 20 mL beaker separated into two compartments. In the first compartment of 2 mL, a molybdenum electrode was oxidized at 1V in order to produce molybdates () and protons (H+) according to Equation (1). To reach the acidic pH needed (pH ≈ 1.5) to form the silicomolybdic complex (Equation 2), the counter electrode was isolated from the molybdenum electrode behind a 180 μm thick non-proton exchange membrane (N117 Du Pont™ Nafion® PFSA Membrane) to limit the reduction of formed H+ (Lacombe et al., 2008). The solution was stirred using a magnetic stirrer after the molybdenum oxidation during 6 min to complex 100% of silicate in solution. The silicomolybdic complex was then detected on a gold working electrode by cyclic voltammetry.
The small volume (<400 μL) laboratory prototype made in PMMA (poly(methyl methacrylate)) in Figure 1 was designed in collaboration with the Groupe d'Instrumentation Scientifique (GIS) of Midi-Pyrénées Observatory of Toulouse. The machining of PMMA pieces was subcontracted. It is divided into 2 cells of 365 μL (Figure 1A) and 91 μL (Figure 1B) connected with a 4 cm long tube. The schematic arrangements of the electrodes inside the cells are drawn below each cell on Figure 1. The complexation cell (Figure 1A) is divided into 2 compartments linked through a Nafion® membrane. The molybdenum electrode was oxidized to produce molybdates () and protons (H+) and the counter electrode, placed in the cylindrical reservoir on the top, was isolated behind the membrane to reach the acidic pH as previously explained. The silicomolybdic complex formed was then transferred to the detection cell (Figure 1B) using a solenoid pump from Lee Company® (LPL solenoid pump) to be detected by cyclic voltammetry on homemade working electrode built with gold wire (Au, Ø = 1 mm) inserted into epoxy resin. Gold working electrode was cleaned in situ (in seawater) before each experiment by applying a fixed potential E = −0.2 V during 200 s. A silver wire inserted into epoxy resin (Ag, Ø = 1 mm) covered with silver chloride (AgCl) acted as a reference electrode and a platinum grid placed in the reservoir on the top was used as counter electrode on the detection cell (Figure 1B).
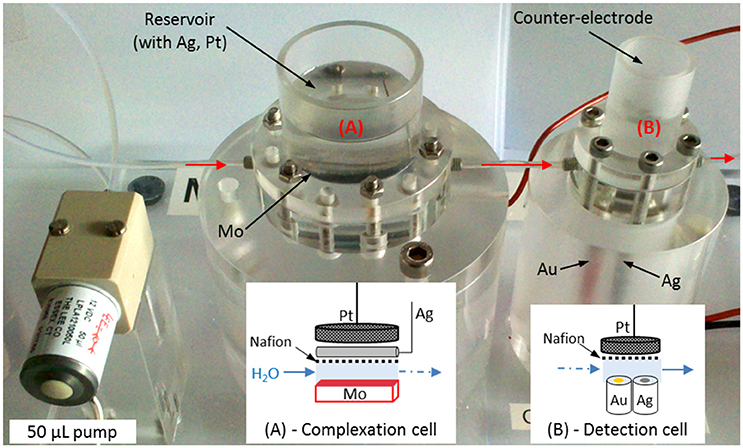
Figure 1. Small volume prototype to detect silicate in seawater with on the left the solenoid Lee-Co® pump, (A) complexation cell and (B) detection cell and the corresponding schematic representation of the electrodes.
The solenoid pump used to fill and clean the whole circuit as well as to transfer the solution to the detection cell injects 50 μL at each pulse. It is controlled by an electronic card connected to the μ-Autolab III potentiostat (Metrohm®).
The in situ silicate sensor presented in Figure 2 is an anodized aluminum cylindrical sensor of 2.2 kg in air, 90 mm diameter and 250 mm height without the connector. The bottom of the sensor with the connector and the electrochemical cells are designed in PEEK (polyether ether ketone) pieces. The top of the sensor is made of polyamide PA 6.6 GF30. The machining of plastic and anodized aluminum pieces were subcontracted, the assembly of the sensor as well as the pressure and waterproof tests were made by nke Instrumentation. The solenoid pump is placed into a reservoir equipped with a membrane and filled with dielectric oil in order to be in equipressure. The electronics were inserted into a dry compartment and the electrochemical cells (with the electrodes) are on the top of the sensor. The housing has been validated up to 60 bars (600 m) using pressure column. The two cells, namely the complexation cell and the detection cell, have almost the same size as the laboratory prototype i.e., 376 and 94 μL, respectively, and the same optimized tubing set up is used for the pump. The molybdenum electrode for reagents formation is placed at the bottom of the complexation cell. The silver wire reference electrode and the titanium grid counter electrode are behind the Nafion® membrane, directly in contact with the open ocean. Inside the detection cell, the three electrodes: gold working electrode, silver reference electrode and platinum counter electrode are inserted in the same PEEK piece with epoxy resin and all three are 2 mm diameter (Figure 2, bottom right). All electrodes are plugged and can be easily recovered for reconditioning or cleaning, making this sensor very handy. The sensor is also equipped with pressure and temperature sensors which measured the pressure at the beginning and at the end of the sampling and the temperature when the sensor measures the silicomolybdic complex signal.
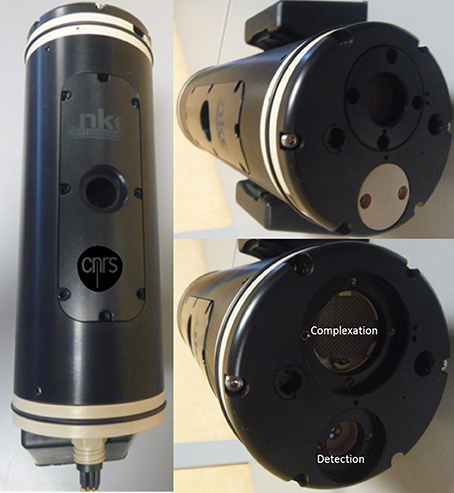
Figure 2. Silicate electrochemical in situ sensor.
The peak intensity corresponding to silicate concentration in seawater is measured on the first reduction wave obtained around 0.35 V/Ag/AgCl/Cl−. A tangent is drawn before the peak (higher potential) continuously to the baseline and the peak intensity is measured from the highest intensity (peak, in absolute value) to tangent's interception.
Results and Discussion
Design and Electronics Validations
In both the laboratory prototype and the in situ sensor, the silicomolybdic complex formed in the complexation cell is transferred into the detection cell with the Lee Company® pump. The flow rate of the Lee-Co® pump used is a critical parameter that needs to be optimized in order to transfer the complex without any dilution and also to fill and rinse the whole circuit properly.
Using the small volume prototype presented in Figure 1, the pH of the solution at the exit of the complexation cell as well as the silicate signal in the detection cell for each fraction of 50 μL injected by the pump have been measured. Two different set up of the Lee-Co® pumps were tested corresponding to 200 μL s−1 and 3.3 μL s−1 flow rates. The highest flow rate (200 μL s−1) corresponds to the conventional set up of the pump using tubes of identical internal diameter (Øint. = 0.8 mm) before (inlet) and after (outlet) the pump allowing a maximum operating frequency of 2 Hz (0.25 s to inject 50 μL). In this case, the tube between the complexation cell and the detection cell is 4 cm long and 0.8 mm diameter. The lowest flow rate (3.3 μL s−1) is obtained by increasing the back pressure using the same 0.8 mm internal diameter tube at the entrance of the pump (inlet) and a 0.3 mm internal diameter tube with a substantial length (≈50 cm) at the exit of the pump toward the cell. In this configuration, the injection of 50 μL of solution took approximately 15 s. The tube in between both cells has also been replaced with a Øint. = 0.3 mm tube (same length = 4 cm). The fractions giving the highest silicate signal (most concentrated fraction) for each flow rate (50 μL: 1 impulsion for 200 μL s−1 and 100 μL: 2 impulsions for 3.3 μL s−1) are compared with the signal obtained with the open cell (no transfer, homogeneous solution) in Figure 3. A waiting time after the molybdenum oxidation of 30 min was allowed in order to be sure to complex 100% of silicate.
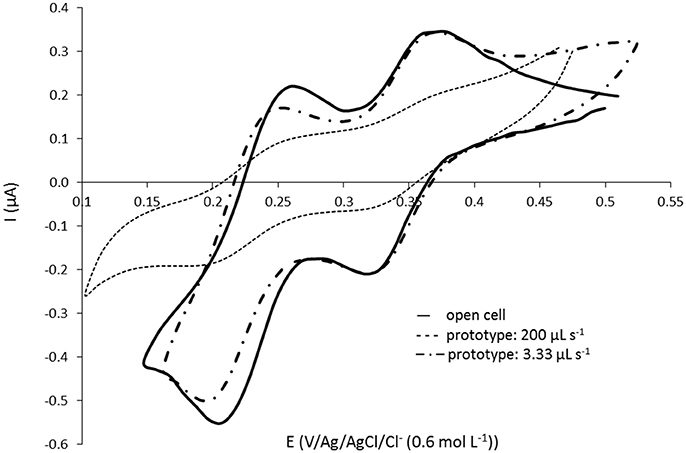
Figure 3. Cyclic voltammograms at 100 mV s−1 on gold homemade working electrode (Ø = 1 mm) for [Si(OH)4] = 101.1 μmol L−1 in NaCl solution at 34.5 g L−1. Comparison of signals obtained with (—) the open cell and with the prototype on Figure 1 for the fractions giving the highest signal obtained at flow rate (- - -) 200 μL s−1 (50 μL transferred) and at (– · –) 3.33 μL s−1 (100 μL transferred).
The signal obtained with 200 μL s−1 is much lower as compared to the signal obtained with the “open cell,” the flow rate is too high. It clearly indicates a dilution of the sample when it has been transferred. This resolution is not suitable for in situ sensor development as it would be impossible to measure low silicate concentration. However the lower flow rate (3.3 μL s−1) shows identical signal for the 1st peak at E = 0.33 V than the one obtained with the “open cell,” validating this set up for the pump (and low flow rate value). We are close to a laminar flow (plug flow), allowing to transfer the silicomolybdic complex into the detection cell without dilution. These results are in good agreement with the study of the most concentrated fraction observed for both flow rates (same results were obtained with the pH measurements). At 200 μL s−1, the highest signal was observed after 1 pump impulsion corresponding to only 50 μL transferred whereas the total volume to fill in (tube + detection cell) is 111 μL. At 3.3 μL s−1, the 2nd and 3rd pump impulsions (100 and 150 μL, respectively) gave the same highest signal for both pH and silicate signal measured. No dilution was observed as the total volume to replace is 94 μL with this set up. The same experiment has been performed with a smaller concentration and led to the same conclusions.
The in situ electronic board of the sensor, developed in collaboration with nke Instrumentation, controls pump actions, in situ electrochemical cleaning of gold working electrode, molybdenum oxidation, complexation time and detection by cyclic voltammetry. The performances and the current sampling parameters have been optimized in order to obtain the best detection signal possible. A comparison of the signal recorded (same electrodes) using the “open cell” for silicate solution at 101.1 μmol L−1 with the electronic card and the commercial Metrohm® potentiostat is presented in Figure 4. The same shape is obtained and the peak intensity (at E = 0.36 V) is even 18% higher with the in situ electronics (Ielectronics = 0.215 μA) than with the commercial potentiostat (Ipotentiostat = 0.182 μA) which is very promising to detect small concentrations in the ocean. The reproducible limit of quantification obtained with the in situ electronics and a 2 mm diameter working electrode was 1 μmol L−1. This exact same version of the electronics is included in the in situ silicate sensor.
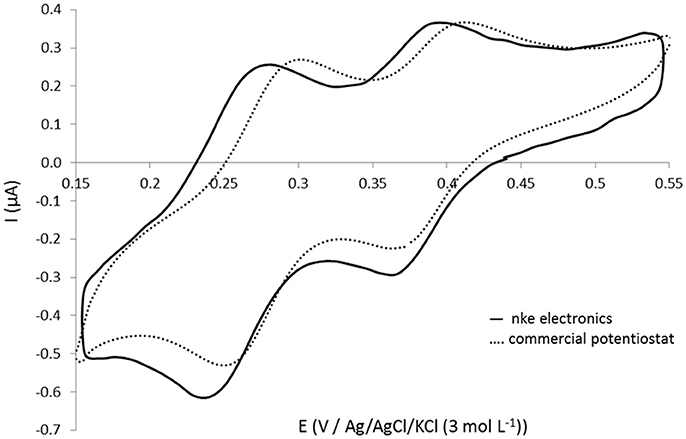
Figure 4. Cyclic voltammograms obtained at 100 mV s−1 on gold homemade working electrode (Ø = 1 mm) (open cell) for 101.1 μmol L−1 silicate in NaCl solution at 34.5 g L−1 using (—) nke electronics and (- - -) commercial Autolab Metrohm potentiostat.
The design of the in situ immersible silicate sensor has been directly adapted from the optimized laboratory prototype presented in Figure 1. The same pump set up is also used (Øint. = 0.8 mm (inlet), Øint. = 0.3 mm/l = 50 cm (outlet)). However the tube in between the complexation cell and detection cell no longer exists and has been replaced by a 0.5 mm internal diameter channel directly machined in the PEEK. All parameters validated with the laboratory prototype have been checked with the in situ version. At least 80 pump impulsions are needed to sample/clean the whole circuit and 3 or 4 pump impulsions are required to transfer the complex into the detection cell and a minimum of 10 min of complexation time to record a measurable signal.
In situ Sensor Characterization and Deployments
The influence of temperature was studied for 20 and 30 min complexation time with the sensor immersed in a tank filled with cold artificial seawater (stored at 4°C prior to experiment) containing 65.4 μmol L−1 silicate. The sensor measured silicate concentration continuously from the coldest temperature (around 8°C) until the temperature reached room temperature. This procedure was repeated twice. The temperature is measured by the in situ sensor before each silicate detection. All other parameters remained constant. In total, 11 different temperatures were studied between 8° and 17.3°C using 20 min complexation time and 22 temperatures between 7.7° and 20.6°C for 30 min complexation time. For both complexation times no influence of temperature on the electrochemical signal was observed. The peak intensities measured are the same on the whole temperature range. The averages of peak intensities over all the recorded temperatures of the 2 trials give:
From 30 to 20 min complexation time, the signal has decreased by about 12%. Since temperature has no effect on the analytical signal, the sensor can only be calibrated once prior deployment. In addition, the calibration can be performed at room temperature, even if the ambient temperature of the deployment environment is significantly different.
Deployment on a Mooring off Chile
A calibration has been done prior to in situ deployments in a seawater tank provided by the University of Coquimbo (Facultad de Ciencias del Mar), Chile using standard additions of silicate in the concentration range between 16 and 70 μmol L−1. The temperature of the tank was set at 17°C since it was fueled by surface seawater and the complexation time used was 20 min. The calibration obtained is presented in Figure 5.
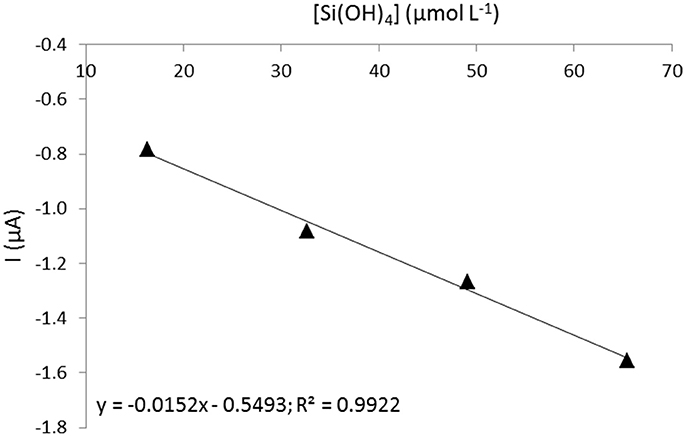
Figure 5. Calibration prior to deployment off Coquimbo (Chile) for 20 min complexation time.
The in situ silicate electrochemical sensor connected to a battery pack was assembled on a stainless steel cage and deployed at 55 meters depth at Talcaruca point, off-shore Coquimbo, Chile (30° 27.2′ S, 71° 42.7′ W) between the 16th April and the 29th April 2017 (Figure 6). This observation site is the most intense center of upwelling of the central-northern zone of Chile (Strub et al., 1998; Thiel et al., 2007). The complexation time chosen for this deployment was 30 min. The whole procedure took 62 min, so the silicate concentration (peak intensity) was measured almost every hour and 140 data files were recorded from the 16th to the 22nd April 2017 (Figure 7A).
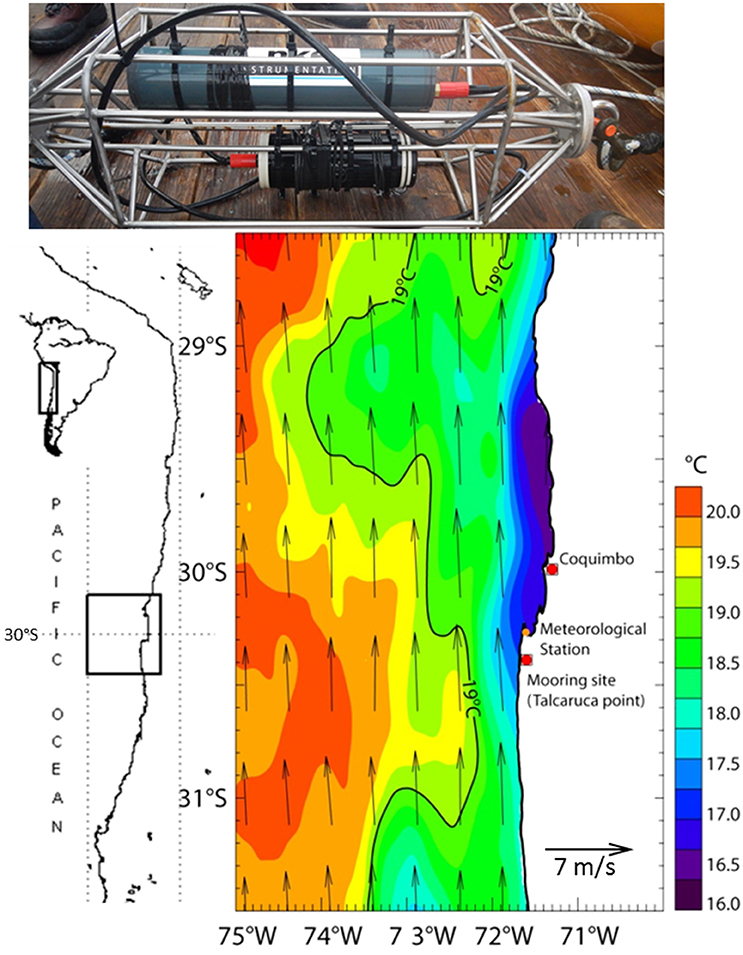
Figure 6. Stainless steel cage equipped with the silicate electrochemical sensor (Bottom) and its battery pack (Top) ready to be deployed at 55 m depth on a mooring off-shore Coquimbo, Chile at Talcaruca Point shown on the sea surface temperature and winds map derived from the Multi-scale Ultra-high Resolution (MUR) (0.01°) and ASCAT (0.25°), respectively. Average for the deployment period 16/04/2017-23/04/2017 - indicates the location of the meteorological station (Punta Lengua de Vaca) of CEAZA.
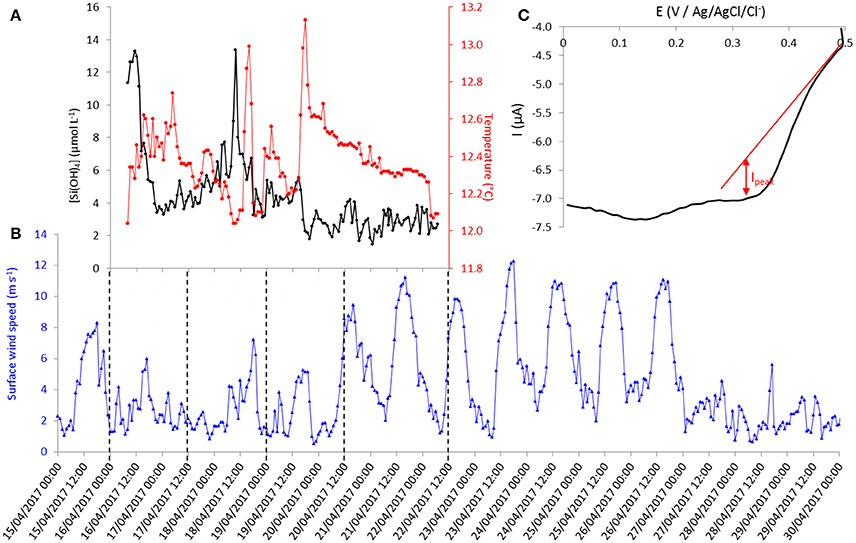
Figure 7. (A) Time evolution of silicate concentration and temperature recorded by the sensor at 55 meters depth at Talcaruca point between the 16th and the 22nd of April 2017 (local time: UTC-4 hours). (B) Time evolution of hourly mean value of surface wind speed from Punta Lengua de Vaca meteorological station. (C) Cyclic voltammogram (forward cycle) at 100 mV s−1 on gold working electrode (Ø = 2 mm).
A discrete sample was taken at the same depth and same time as the first sensor measurement to validate the sensor measurement. The sample was analyzed in triplicate after deployment by colorimetric method at Universidad Católica del Norte and gave a silicate concentration of 11.4 ± 0.1 μmol L−1 (Grasshoff et al., 1999). The corresponding cyclic voltammogram recorded by the sensor is presented in Figure 7C as well as the tangent drawn to measure the peak intensity. To recalculate the real concentration of silicate using the calibration made (Figure 5), we need to consider the signal drop of 12% from 30 to 20 min determined earlier. It gives a silicate concentration of 11.3 μmol L−1 which is in good agreement with the reference value.
The evolution of silicate concentration and seawater temperature at 55 m depth through time (local time, UTC-4 hours) is given in Figure 7A. The mean hourly value of surface wind speed from the nearby meteorological station (see location on Figure 6) recorded between the 15th and the 30th of April 2017 is shown in Figure 7B. The first peak of silicate recorded on April 16th could be interpreted as resulting from upwelling favorable wind peak on the 15th of April that could either uplift waters of higher values of silicate concentration or produce vertical mixing (Figures 7A,B). Then, the silicate concentration decreased to ~3.5 μmol L−1 correlated with an increase of the local temperature (at 55 m depth). This result is in agreement with the sea surface temperature (SST) observations from Multi-scale Ultra-high Resolution (MUR) shown in Figure 8. The SST map for the 16th of April shows a lower temperature (silicate rich seawater) at Talcaruca point (■ black squares on the maps) than on the maps corresponding to the 17th and 18th of April. The intense silicate peak recorded on April 18th (~13 μmol L−1) is probably due to eddy advection of silicate rich seawater since the upwelling favorable winds do not exhibit a clear enhancement and the SST is experiencing an slight increase. Restratification processes are also possible for explaining the SST warm peak on the 18th of April (Renault et al., 2009).
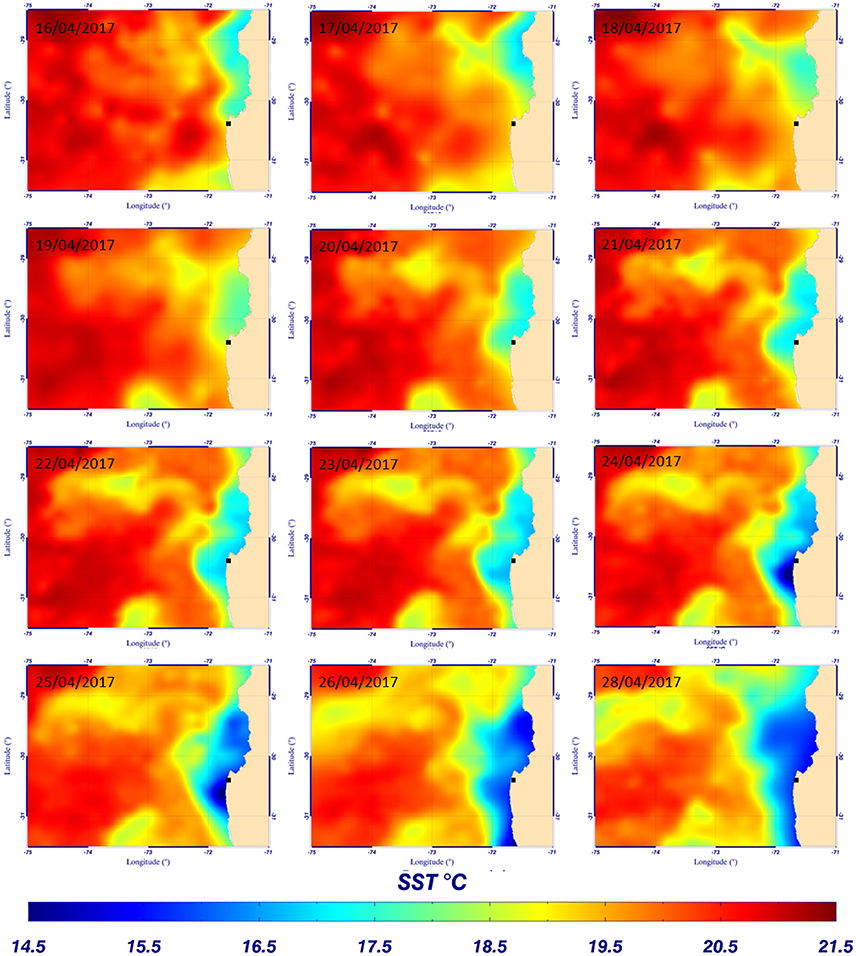
Figure 8. Evolution of sea surface temperature from the Multi-scale Ultra-high Resolution (MUR) (0.01°) between the 16th and 28th of April 2017 – ■ indicates the mooring position.
Then, the evolution of SST between the 19th and the 29th of April 2017 (Figure 8) shows the establishment and progression of the upwelling toward Talcaruca point correlated with strong winds recorded between the 20th and 27th (Figure 7B). Results obtained with the electrochemical sensor show also the decrease of the temperature at 55 m depth from April 20th and a slight increase of silicate concentration centered around 2.8 μmol L−1 (Figure 7A). The memory card of the sensor was full on the 22nd of April and did not save (erase) the following data measured by the sensor. The original plan was to recover the sensor on the 21st of April. However the wind increased drastically the day before, and the weather and sea state conditions prevailing during several days made impossible the recovery before the 29th of April. A second discrete sample was taken when the sensor was recovered and analyzed in triplicate given a concentration of 6.7 ± 0.2 μmol L−1. As expected, the silicate concentration continued to increase after April 22nd due to the upwelling progression (Figure 8).
Deployment on a PROVOR Float in the Mediterranean Sea
After deployment in Chile, the sensor has been directly adapted and implemented on a PROVOR float (Figure 9, inset) and deployed off Villefranche-sur-Mer in the Mediterranean Sea on Wednesday 10th May 2017 from the Sagitta III, CNRS – DT INSU ship. The float drifted until Monday 15th May 2017 afternoon when it has been recovered. The weather conditions were not favorable as the wind and current pushed the float toward the coast instead of offshore as we were expecting prior to deployment. Since the float remained close to the shore throughout the deployment period, no data deeper than 160 m were obtained. Nevertheless, the sensor measured silicate concentration when the float was at parking depth. The whole process took 45 min as a complexation time of 20 min was used. Therefore the calibration on Figure 5 can be directly used. Data were sent through satellite when the float reached the surface. We managed to analyse only few data as the signal shifted toward more negative intensities (baseline drop). Due to an automatic cut off of the electronics if intensity goes below −13 μA, the cyclic voltammograms recorded were not complete and it was not possible to analyse them. This parameter setting will be changed on the next electronics version. An example of cyclic voltammogram recorded at 14°C and 160 m depth is presented in Figure 9 and gives a silicate concentration of [Si(OH)4] = 5.94 μmol L−1 which is close to previously published historical silicate concentrations from this area, depth and season (Pasqueron de Fommervault et al., 2015).
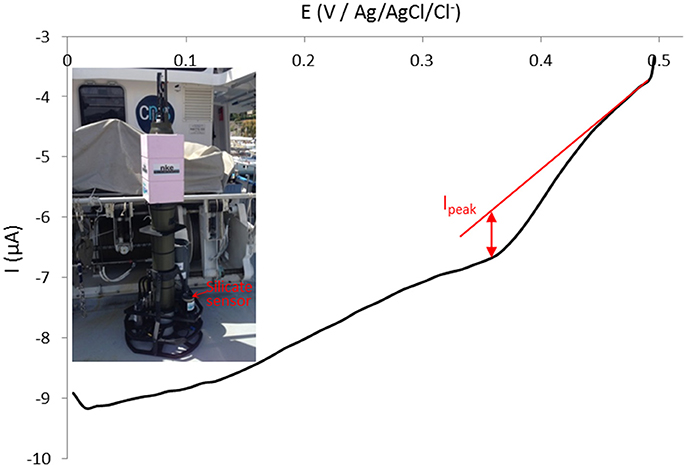
Figure 9. Silicate sensor implemented on PROVOR float (inset) transmitted through satellite cyclic voltammogram (forward cycle) at 100 mV s−1 on gold working electrode (Ø = 2 mm) recorded at 14°C and 160 m depth off Villefranche-sur-Mer, France (May 2017).
Conclusions
A significant increase in TRL (Technological Readiness Level) has been operated over these last years of sensor developments starting from the reagentless silicate detection principle, to the first laboratory prototype and to the first in situ, autonomous silicate electrochemical sensor. The mechanical design led to build a sensor with dimensions and energy consumption (25 mAh for 1 sample per hour configuration) allowing its deployment on moorings as well as its implementation on under-water vehicles such as a PROVOR float. Both deployments were world firsts, and they provided satisfactory results as compared to reference sample and literature. The potential of this sensor to measure silicate concentrations in situ in the open ocean has been proven (TRL of 7) and after a complete characterization of its life time and accuracy statistics, it will be ready for commercialization.
Author Contributions
CB and DC carried out the development of the sensor in the laboratory (including electrochemical development, electronics validation, and mechanical design approval) and performed the field in situ deployments, data analyses and wrote the paper. NS was in charge of the mechanical design of the laboratory prototype and reviewed the in situ sensor design. BJ and AD were in charge of the electronics part of the sensor. They made the mechanical design of the in situ silicate sensor and its mechanical integration on the PROVOR float. They participated to the PROVOR field deployment. MV, MR, and BD were in charge of the Chile deployment and participated to the field deployment/recovery. PM analyzed the discrete sample taken by colorimetry. VG is the PI of the project, initiated the design of the study, supervised the work, and co-wrote the paper.
Funding
The work presented has received funding from the European Union Seventh Framework Programme (FP7/2007-2013) under grant agreement n°614141 (project SenseOCEAN).
Conflict of Interest Statement
The authors declare that the research was conducted in the absence of any commercial or financial relationships that could be construed as a potential conflict of interest.
Acknowledgments
DC's contract and present work were supported by the SenseOCEAN project:Marine sensors for the twenty first century funded by the European Commission Seventh Framework Programme (FP7) under Grant Agreement n°614141 (http://www.senseocean.eu/).
The authors would like to thank Marcel Belot from the Groupe d'Instrumentation Scientifique of the Observatory Midi-Pyrénées, Toulouse, France for mechanical manufacturing and assistance.
The authors also thank Cécile Guieu, Laure Mousseau, Antoine Poteau from the Laboratoire d'Océanographie de Villefranche-sur-Mer UMR7093 and Jean-Yves Carval, captain of the SAGITTA 3 vessel of the Observatoire Océanologique de Villefranche-sur-Mer for their help and their implication during the PROVOR float deployment, and the crew of the scientific vessel Stella Maris II, Coquimbo, Chile. IRD is also thanked for financial support. We are grateful to the Centre for Advanced Studies in Arid Zones (CEAZA) for providing the wind data from the meteorological station of Punta Lengua de Vaca and assistance for processing the data. Joel Sudre from LEGOS laboratory is also thanked for his help on the SST MUR plots.
References
Aguilar, D., Barus, C., Giraud, W., Calas, E., Vanhove, E., Laborde, A., et al. (2015). Silicon-based electrochemical microdevices for silicate detection in seawater. Sens. Actuators B 211, 116–124. doi: 10.1016/j.snb.2015.01.066
Arrigo, K. R. (2005). Marine microorganisms and global nutrient cycles. Nature 437, 349–355. doi: 10.1038/nature04159
Bristow, L. A., Mohr, W., Ahmerkamp, S., and Kuypers, M. M. M. (2017). Nutrients that limit growth in the ocean. Curr. Biol. 27, R474–R478. doi: 10.1016/j.cub.2017.03.030
COCA Working Group (2014). The Collaborative on Oceanography and Chemical Analysis (COCA) and Suggestions for Future Instrumental Analysis Methods in Chemical Oceanography. Virtural Special Issue in Marine Chemistry. Available online at: http://media.journals.elsevier.com/content/files/cocameeting-30202026.pdf
DeMaster, D. J. (1981). The supply and accumulation of silica in the marine environment. Geochim. Cosmochim. Acta 45, 1715–1732. doi: 10.1016/0016-7037(81)90006-5
Dugdale, R. C., and Wilkerson, F. P. (1998). Silicate regulation of new production in the equatorial Pacific upwelling. Nature 391, 270–273. doi: 10.1038/34630
Dugdale, R. C., Wilkerson, F. P., and Minas, H. J. (1995). The role of silicate pump in driving new production. Deep Sea Res. I 42, 697–719. doi: 10.1016/0967-0637(95)00015-X
Falkowski, P. G., Barber, R. T., and Smetacek, V. (1999). Biogeochemical controls and feedback on ocean primary production. Science 281, 200–206. doi: 10.1126/science.281.5374.200
Frings, P. J., Clymans, W., Fontorbe, G., De La Rocha, C., and Conley, D. J. (2016). The continental Si cycle and its impact on the ocean Si isotope budget. Chem. Geol. 425, 12–36. doi: 10.1016/j.chemgeo.2016.01.020
Grand, M. M., Clinton-Bailey, G. S., Beaton, A. D., Schaap, A. M., Johengen, T. H., Tamburri, M. N., et al. (2017). A Lab-on-chip phosphate analyser for long-term in situ monitoring at fixed observatories: Optimization and performance evaluation in estuarine and oligotrophic coastal waters. Front. Mar. Sci. 4:255. doi: 10.3389/fmars.2017.00255
Grasshoff, K., Kremling, K., and Ehrhardt, M. (eds.). (1999). Methods of Seawater Analysis. Weinheim: Wiley-VCM.
Johnson, K. S., Coletti, L. J., Jannasch, H. W., Sakamoto, C. M., Swift, D. D., and Riser, S. C. (2013). Long-term nitrate measurements in the ocean using the in situ Ultraviolet Spectrophotometer: sensor integration into the APEX profiling float. J. Atmos. Oceanic Technol. 30, 1854–1866. doi: 10.1175/JTECH-D-12-00221.1
Lacombe, M., Garçon, V., Thouron, D., Le Bris, N., and Comtat, M. (2008). Silicate electrochemical measurements in seawater: chemical and analytical aspects towards a reagentless sensor. Talanta 77, 744–750. doi: 10.1016/j.talanta.2008.07.023
Legiret, F. E., Sieben, V. J., Woodward, E. M., Abi Kaed Bey, S. K., Mowlem, M. C., Connelly, D. P., et al. (2013). A high performance microfluidic analyser for phosphate measurements in marine waters using the vanadomolybdate method. Talanta 116, 382–387. doi: 10.1016/j.talanta.2013.05.004
Ma, J., Adornato, L., Byrne, R. H., and Yuan, D. (2014). Determination of nanomolar levels of nutrients in seawater. Trends Anal. Chem. 60, 1–15. doi: 10.1016/j.trac.2014.04.013
Mann, D. G. (1999). The species concept in diatoms. Phycologia 38, 437–495. doi: 10.2216/i0031-8884-38-6-437.1
Matear, R. J., Wang, Y. P., and Lenton, A. (2010). Land and ocean nutrient and carbon cycle interactions. Curr. Opin. Environ. Sustain. 2, 258–263. doi: 10.1016/j.cosust.2010.05.009
Pasqueron de Fommervault, O., Migon, C., D'Ortenzio, F., Riberad'Alcalà, M., and Coppola, L. (2015). Temporal variability of nutrient concentrations in the northwestern Mediterranean sea (DYFAMED time-series station). Deep Sea Res. I 100, 1–12. doi: 10.1016/j.dsr.2015.02.006
Patey, M. D., Rijkenberg, M. J. A., Statham, P. J., Stinchcombe, M. C., Achterberg, E. P., and Mowlem, M. (2008). Determination of nitrate and phosphate in seawater at nanomolar concentrations. Trends Anal. Chem. 27, 169–182. doi: 10.1016/j.trac.2007.12.006
Renault, L., Dewitte, B., Falvey, M., Garreaud, R., Echevin, V., and Bonjean, F. (2009). Impact of atmospheric coastal jets on SST off central Chile from satellite observations (2000-2007). J. Geophys. Res. 114, 1–22. doi: 10.1029/2008JC005083
Strub, P., Mesías, J., Montecino, V., Rutllant, J., and Salinas, S. (1998). “Coastal ocean circulation off western South America,” in The Sea, The Global Coastal Ocean, Vol. 11, eds A. Robinson and K. Brink (New York, NY: Wiley), 272–313.
Thiel, M., Macaya, E. C., Acu-a, E., Arntz, W. E., Bastias, H., Brokordt, K., et al. (2007). The Humboldt current system of Northern and Central Chile. Oceanographic processes, ecological interactions and socioeconomic feedback. Oceanogr. Mar. Biol. Ann. Rev. 45, 195–344. doi: 10.1201/9781420050943.ch6
Thouron, D., Vuillemin, R., Philippon, X., Lourenço, A., Provost, C., Cruzado, A., et al. (2003). An autonomous nutrient analyser for oceanic long-term in situ biogeochemical monitoring. Anal. Chem. 75, 2601–2609. doi: 10.1021/ac020696+
Tréguer, P. J., and De La Rocha, C. L. (2013). The World Ocean silica cycle. Annu. Rev. Mar. Sci. 5, 477–501. doi: 10.1146/annurev-marine-121211-172346
Tréguer, P., Nelson, D. M., Van Bennekom, A. J., DeMaster, D. J., Leynaert, A., and Quéguiner, B. (1995). The silica balance in the world ocean: a reestimate. Science 268, 375–379. doi: 10.1126/science.268.5209.375
Keywords: autonomous sensor, reagentless electrochemical detection, silicate, seawater, mooring and float deployments
Citation: Barus C, Chen Legrand D, Striebig N, Jugeau B, David A, Valladares M, Munoz Parra P, Ramos ME, Dewitte B and Garçon V (2018) First Deployment and Validation of in Situ Silicate Electrochemical Sensor in Seawater. Front. Mar. Sci. 5:60. doi: 10.3389/fmars.2018.00060
Received: 25 October 2017; Accepted: 09 February 2018;
Published: 26 February 2018.
Edited by:
Douglas Patrick Connelly, National Oceanography Centre Southampton, United KingdomReviewed by:
Moritz Holtappels, Alfred Wegener Institut Helmholtz Zentrum für Polar und Meeresforschung, GermanyMaxime M. Grand, University of Hawaii at Manoa, United States
Copyright © 2018 Barus, Chen Legrand, Striebig, Jugeau, David, Valladares, Munoz Parra, Ramos, Dewitte and Garçon. This is an open-access article distributed under the terms of the Creative Commons Attribution License (CC BY). The use, distribution or reproduction in other forums is permitted, provided the original author(s) and the copyright owner are credited and that the original publication in this journal is cited, in accordance with accepted academic practice. No use, distribution or reproduction is permitted which does not comply with these terms.
*Correspondence: Carole Barus, carole.barus@legos.obs-mip.fr
†Co-first authors.