Comparing a Multivariate Global Ocean State Estimate With High-Resolution in Situ Data: An Anticyclonic Intrathermocline Eddy Near the Canary Islands
 Bàrbara Barceló-Llull
 Ananda Pascual
 Evan Mason
 Sandrine Mulet2
- 1IMEDEA (CSIC-UIB), Esporles, Spain
- 2C.L.S. Space Oceanography Division, Toulouse, France
The provision of high-resolution in situ oceanographic data is key for the ongoing verification, validation and assessment of operational products, such as those provided by the Copernicus Marine Core Service (CMEMS). Here we analyze the ability of ARMOR3D—a multivariate global ocean state estimate that is available from CMEMS—to reconstruct a mesoscale anticyclonic intrathermocline eddy that was previously sampled with high-resolution independent in situ observations. ARMOR3D is constructed by merging remote sensing observations with in situ vertical profiles of temperature and salinity obtained primarily from the Argo network. In situ data from CTDs and an Acoustic Doppler Current Profiler were obtained during an oceanographic cruise near the Canary Islands (Atlantic ocean). The analysis of the ARMOR3D product using the in situ data is done over (i) a high-resolution meridional transect crossing the eddy center and (ii) a three-dimensional grid centered on the eddy center. An evaluation of the hydrographic eddy signature and derived dynamical variables, namely geostrophic velocity, vertical vorticity and quasi-geostrophic (QG) vertical velocity, demonstrates that the ARMOR3D product is able to reproduce the vertical hydrographic structure of the independently sampled eddy below the seasonal pycnocline, with the caveat that the flow is surface intensified and the seasonal pycnocline remains flat. Maps of ARMOR3D density show the signature of the eddy, and agreement with the elliptical eddy shape seen in the in situ data. The major eddy axes are oriented NW-SE in both data sets. The estimated radius for the in situ eddy is ~46 km; the ARMOR3D radius is significantly larger at ~ 92 km and is considered an overestimation that is inherited from an across-track altimetry sampling issue. The ARMOR3D geostrophic flow is underestimated by a factor of 2, with maxima of 0.11 (−0.19) m s−1 at the surface, which implies an underestimation of the local Rossby number by a factor of 3. Both the in situ and ARMOR3D eddies have decelerating flows at their northern edges. The ARMOR3D QG vertical velocity distribution has upwelling/downwelling cells located along the eddy periphery and similar magnitudes to the in situ-derived QG vertical velocity.
1. Introduction
The growing capacities of new products developed in operational oceanography (Schiller and Brassington, 2011; Bell et al., 2015; Chakraborty et al., 2015; Le Traon et al., 2015; Hernandez et al., 2015; Kaurkin et al., 2016; Sotillo et al., 2016) imply a need for ongoing assessment using independent high-resolution in situ data sets. Such efforts help ensure the provision of high quality services by, for example, the Copernicus Marine Service. Thus, advancement in our knowledge of the ocean depends on high quality three-dimensional (3D) observations of the global ocean. However, cruise-based in situ oceanographic sampling typically only covers small targeted regions of the ocean during short periods of time, providing knowledge of specific oceanographic features. Sustained observations in the framework of the Global Ocean Observing System (GOOS) address only a limited number of observational targets, and open ocean high-resolution measurements targeted at the mesoscale are not yet considered (Legler et al., 2015). Moreover, synopticity is a key factor in the in situ sampling of the ocean, partly solved by satellites which are able to sample the globe in a short period of time. Despite the global coverage of the remote sensing observations, they only provide a surface view of the ocean. In order to complement satellite observations, sustained observing efforts through profiling and surface drifters, expendable bathythermographs (XBTs), and moorings provide real-time in situ vertical profiles of temperature and salinity on a global, but unstructured, grid. Emerging technology, such as the recently established global underwater glider observing network could, in principle, provide the required high-resolution in situ profile data, but routine mapping of the mesoscale is not yet implemented (Liblik et al., 2016).
In order to take advantage of the global coverage provided by remote sensing observations and the available in situ vertical profiles of temperature and salinity, Guinehut et al. (2012) made the first 3D operational multi-observation estimate of the ocean state by merging remote sensing observations (sea level anomaly and sea surface temperature) with in situ temperature and salinity vertical profiles (XBTs, CTDs, moorings and Argo profiles). This multivariate observation-based product, named ARMOR3D, provides global 3D data sets of temperature, salinity, geopotential height and geostrophic currents on a 1/4° horizontal regular grid with weekly temporal resolution. Mulet et al. (2012) perform a validation of the ARMOR3D product by comparison with model reanalysis and in situ observations (ANDRO current velocities from Argo float displacements and velocity measurements from the RAPID-MOCHA current meter array). They demonstrate that the geostrophic circulation estimated using ARMOR3D temperature and salinity fields has errors of less than 10% in the ocean interior, which indicates the robustness of the application of the thermal wind equation to infer ARMOR3D geostrophic velocities on a basin scale.
Several studies have taken advantage of the ability of this product to analyze mesoscale dynamics. Buongiorno Nardelli et al. (2012) carried out the first attempt to apply the quasi-geostrophic (QG) approximation to the observation-based product in order to map 3D mesoscale dynamics. Pascual et al. (2015) and Barceló-Llull et al. (2016) derive the QG mesoscale vertical velocity from the ARMOR3D fields in order to analyze its distribution in different regions of the global ocean as well as its contribution to nutrient advection and phytoplankton growth. Mason et al. (2017) construct eddy-centric composites of tracers, geostrophic currents and QG vertical velocity diagnosed from ARMOR3D in the energetic Brazil-Malvinas Confluence region. Through subregional composites they are able to reveal and analyze mesoscale eddy heterogeneity. These studies have all pointed out that probably there is an underestimation of the inferred QG vertical velocities due to the smoothing of the ARMOR3D fields. However, the lack of independent in situ data has prevented previous studies to provide a correct quantification of this underestimation.
The objective of the present study is to characterize this underestimation using 3D high-resolution in situ CTD and horizontal current observations obtained from the intensively sampling of an anticyclonic intrathermocline eddy (ITE) inside the Canary Eddy Corridor in the northeast Atlantic (Sangrà et al., 2009; Barceló-Llull et al., 2017b). Barceló-Llull et al. (2017a) used these 3D in situ fields to infer the QG vertical velocity distribution within the anticyclonic intrathermocline eddy, as well as the vertical velocity obtained from the integration of a generalized omega equation valid for high Rossby numbers which includes the forcing contribution of the ageostrophic horizontal velocities. First, we perform a revision of the hydrographic eddy signature comparing ARMOR3D fields with high-resolution in situ data from the surface to 1,000 m depth. Then, we proceed with the analysis of ARMOR3D-derived dynamical variables such as the QG vertical velocity that has previously been computed and analyzed from ARMOR3D fields but has not yet been validated with in situ data. The final objective is to evaluate the ability of the ARMOR3D product to resolve mesoscale eddies for a specific regional case (the Canary Eddy Corridor) and reproduce their hydrographic and dynamic 3D structure. In section 2 we describe the data set used for the comparison, in section 3 we expose the results, and in section 4 we summarize the main conclusions.
2. Data and Methods
2.1. High-Resolution Independent in Situ Data Set
In the frame of the project PUMP (Study of the Vertical Oceanic Pump in mesoscale eddies), high-resolution in situ data were obtained from an anticyclonic intrathermocline eddy in the subtropical northeast Atlantic (Barceló-Llull et al., 2017b). The eddy was shed by the island of Tenerife in May 2014, and the survey took place 4 months later in a region 550 km to the southwest (Figure 1). Guided by the eddy signal in sea level anomaly (SLA) maps provided by AVISO, Barceló-Llull et al. (2017b) first crossed the eddy with two perpendicular transects sampled with continuous tows of a Conductivity Temperature Depth (CTD) probe on a SeaSoar (undulating vehicle). With these transects, they aimed to locate the eddy center and to make a first estimate of its radius and depth from density vertical sections with a precision of ±4 km, the averaged distance between SeaSoar profiles. The sampling strategy included a meridional transect (referred to as the Le Tourmalet transect) crossing the eddy center that consisted of 24 CTD stations 5 nautical miles apart down to a nominal depth of 1,000 m, and a 3D grid centered on the eddy center that consisted of six SeaSoar and three discrete CTD zonal transects 90 nautical miles long. The SeaSoar provided vertical profiles from 10 m down to 325 m every 4 km, while the rosette stations were 10 nautical miles apart with a nominal depth of 400 m. The 3D survey was conducted over 5 days (6–11 September) and the Le Tourmalet transect was sampled over 3 days (12–15 September). The 3D sampling was centered at (20.1°W, 26.1°N) while the Le Tourmalet transect crossed the eddy center at 20.3°W as the eddy moved westwards with a translation speed of 4 km d−1 derived from SLA near-real-time maps. Raw data files were processed with Sea-Bird SEASOFT (http://www.seabird.com/software/softrev.htm). We used TEOS-10 algorithms to compute conservative temperature, Θ, absolute salinity, SA, and potential density excess, σΘ (Feistel, 2003, 2008).
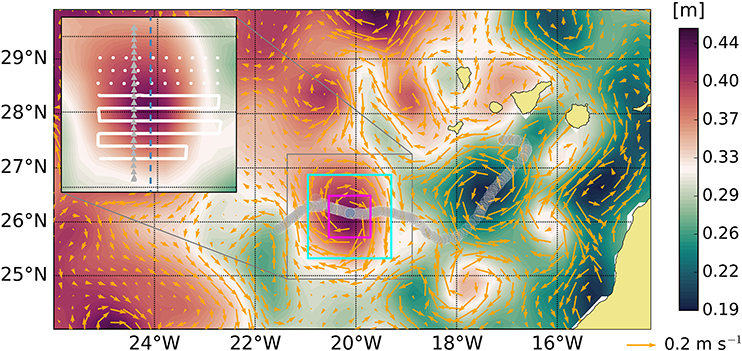
Figure 1. Absolute Dynamic Topography (ADT) with geostrophic velocity vectors at the sea surface from the ARMOR3D product (10-09-2014). Zoom (21.37–18.88°W, 24.94–27.26°N) shows the location of the CTD stations of the in situ high-resolution meridional transect (gray triangles, 20.3°W) and the position of the Seasoar and CTD zonal transects of the 3D sampling (white lines and dots, respectively). The dashed blue line represents the ARMOR3D meridional section along 20.1°W used for the comparison with the in situ high-resolution meridional transect. Cyan box (20.95–19.30°W, 25.33–26.87°N) highlights the eddy region considering an eddy radius of 92 km derived from ARMOR3D ADT and density fields. Magenta box (20.54–19.71°W, 25.71–26.49°N) delimits the real eddy size considering an eddy radius of 46 km derived from the in situ high-resolution meridional section (gray triangles in the zoom) of density anomaly (Barceló-Llull et al., 2017b). The trajectory of the eddy center from its formation is obtained through an automated eddy tracker (Mason et al., 2014) and is depicted by gray dots (the time interval between dots is 1 day); the blue dot shows the eddy center position on the date of the comparison (10-09-2014).
In all phases, current velocities were measured continuously using a hull-mounted Acoustic Doppler Current Profiler (ADCP) working at 75 kHz. The ADCP provided raw data with a 5-min ensembles from the surface to ~800 m depth and a bin size of 8 m. The raw data were quality controlled with the Common Oceanographic Data Access System (CODAS, Firing et al., 1995). On average, the controlled profiles provide good quality data from 21 to 625 m depth. The velocities were calibrated for transducer misalignment, adjusted from ship relative currents to absolute currents using GPS position measurements and spatially averaged each 0.09°. The density and horizontal velocity fields obtained from the 3D sampling were objectively interpolated onto a regular grid with a horizontal resolution of 0.1° and a vertical resolution of 8 m, extending from 20.8 to 19.1°W and from 25.4 to 26.7°N. The data covariance was fitted with a 2D Gaussian function with semimajor and semiminor axes of Lx = Ly = 40 km (Barceló-Llull et al., 2017b). Geostrophic velocities were diagnosed from the 3D density through thermal wind balance, imposing the ADCP velocity at the reference level (325 m depth) (Appendix). See Barceló-Llull et al. (2017b,a) for detailed description of the sampling strategy and data processing. For the present comparison we use data from (i) the high-resolution meridional transect crossing the eddy center, and (ii) the 3D grid covering the eddy region.
2.2. Temperature, Salinity, and Geostrophic Currents From ARMOR3D
The ARMOR3D product is a multivariate global ocean state estimation which provides weekly 3D combined temperature and salinity fields and geostrophic currents on a 1/4° horizontal regular grid with 33 unevenly spaced layers between the surface and 5,500 m depth (Guinehut et al., 2012; Mulet et al., 2012; Le Traon et al., 2017). The observation-based product combines remote sensing observations (SLA and sea surface temperature, SST) with in situ vertical profiles of temperature and salinity (mainly from Argo but also CTD, XBTs, etc.) using statistical methods. In a first step, surface information (SLA and SST) is projected along statistical profiles through a multiple linear regression method where depth-depend regression coefficients are deduced from historical data. Then, this first step estimate is combined with in situ data through objective analysis. From the resulting global 3D data set of temperature and salinity, the geostrophic currents are estimated through the thermal wind relation considering the reference level at the surface, where geostrophic currents are derived from altimetry (Mulet et al., 2012).
The multivariate ocean state data set is freely available for the Copernicus Marine Environment Monitoring Service (CMEMS) users at the webside http://marine.copernicus.eu/services-portfolio/access-to-products/?option=com_csw&view=details&product_id=GLOBAL_ANALYSIS_PHYS_001_020. The version used here is the near-real-time ARMOR3D L4 analysis (the product available at the time of the study) which uses near-real-time altimetry maps that benefit from the same improvements done for altimetry reprocessing (Capet et al., 2014; Pujol et al., 2016); note that a reprocessed version is also available. The dates used for the comparison are the 3rd and 10th of September 2014. In order to compare with the in situ data set, we used TEOS-10 algorithms to compute conservative temperature, Θ, absolute salinity, SA, and potential density excess, σΘ, from the ARMOR3D temperature and practical salinity (Feistel, 2003, 2008).
2.3. QG Vertical Velocity
Vertical velocity is inferred by integrating the QG omega equation (Hoskins et al., 1978) using the geostrophic velocity and density fields from the ARMOR3D product, obtaining wQGar, and from the in situ data, obtaining wQGis:
where f = 6.4 × 10⁻⁵ s−1 is the Coriolis parameter (considered constant and computed at the mean latitude); is the Brunt-Väisälä frequency, where is the mean specific volume, g is gravity, ρ is density and subscript z indicates a vertical derivative; and the Qg vector is defined as , where b = ρgα0 is the buoyancy. Vertical velocity is set to zero at the boundaries of the domain. Previous studies have demonstrated wQG to be largely independent of the choice of lateral boundary conditions a few grid points away from the boundary (e.g., Pascual et al., 2004).
3. Results
Five months before the cruise, Barceló-Llull et al. (2017b) periodically monitored the signature of the eddies generated by the Canary Islands in SLA maps provided by AVISO in order to select an anticyclonic eddy with a robust signature as the target for their study. In the first stage of the eddy survey, they crossed the eddy with two perpendicular SeaSoar transects to precisely detect the eddy center from vertical sections of density. They observed that the real eddy size was smaller than was expected from the SLA maps. Then, with a high-resolution meridional section of density anomaly they estimated an eddy radius of 46 km. As the ARMOR3D geopotential height is derived from altimetry, this overestimation of the eddy size is also reflected in its signature (Figure 1). The eddy center is located as the minimum in the ARMOR3D geostrophic flow (20.1°W, 26.1°N), and the eddy radius is derived from ARMOR3D Absolute Dynamic Topography and density fields giving a value of 92 km. Note that the derived quantities from ARMOR3D fields have a precision of ±1/4°, in accordance with the resolution of the product.
The averaged outer vertical profiles (average of the two outer profiles in each extreme of the meridional transects) of temperature and salinity (solid lines in Figures 2a,d) reveal a certain level of correspondence between ARMOR3D and in situ vertical stratification, with correlation coefficients greater than 0.99 for both temperature and salinity fields and root mean square differences of 0.23°C and 0.04 g kg−1, respectively, which represent 0.25 and 0.38% of the in situ vertical profile variances (Table 1). The higher differences at the eddy center profiles (dashed lines in Figures 2a,d) are observed in the upper 100 m and between 200 and 500 m depth, corresponding with regions with intense anomalies (Figures 2b–e). The anomalies of the center profiles with respect the averaged outer profiles of temperature and salinity have low correlation coefficients between both data sets of 0.42 and 0.71, respectively (not shown). Vertical sections of in situ temperature and salinity anomalies (Figures 2b,e) reveal that the PUMP eddy is characterized by a narrow cold and fresher upper layer located at 30 m depth, and a warm and salty core centered between 200 and 500 m depth. The ARMOR3D temperature anomaly (Figure 2c) also shows a warm region between 200 and 500 m depth with maximum values of +0.95oC (Table 2) in agreement with the location of the PUMP eddy core. However, the upper layer in the ARMOR3D field is warmer than the surrounding waters. The ARMOR3D salinity anomaly (Figure 2f) also reflects the presence of the PUMP eddy between 200 and 500 m depth, although the saltier region is vertically tilted to the south. As shown in Figures 2a,d, the temperature and salinity anomalies associated with the eddy in the ARMOR3D fields are smaller than in the high-resolution in situ fields (Table 2).
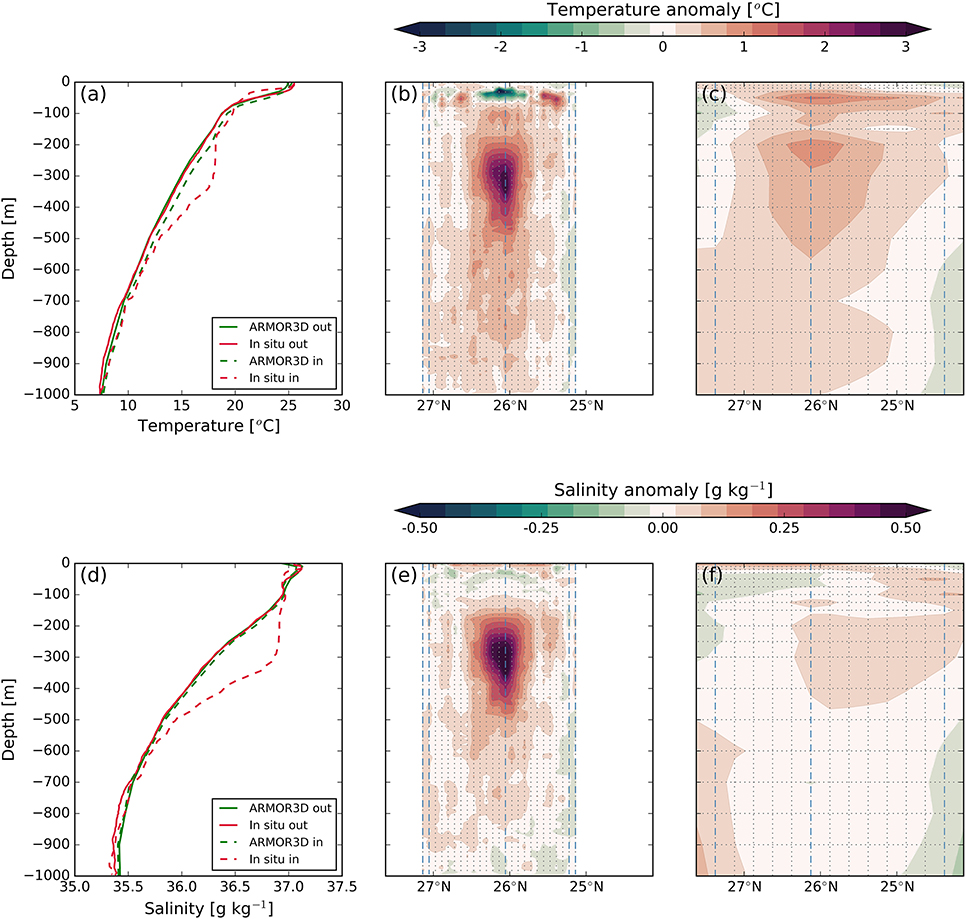
Figure 2. (a,d) Eddy center vertical profiles and averaged outer profiles (two outer profiles in each extreme of the transects) of temperature and salinity, respectively. Meridional sections of temperature (b,c) and salinity (e,f) anomalies computed with respect the averaged value of the outer profiles from the in situ Le Tourmalet transect and the ARMOR3D product (10-09-2014), respectively. The meridional sections are taken along 20.1°W for the ARMOR3D data and along 20.3°W for the in situ data in order to cross the eddy center in accordance with each data set. Vertical dotted lines in (b,c,e,f) represent the horizontal resolution of each data set. Horizontal dotted lines in (c,f) represent the vertical resolution of the ARMOR3D fields. The vertical resolution of the in situ data (5 m) is not shown for clarity. Dashed blue lines represent the outer and eddy center profiles used to construct (a,d).
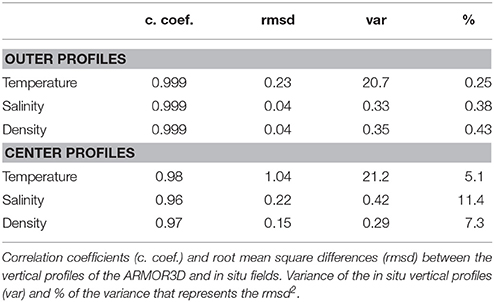
Table 1. Vertical profiles statistics.
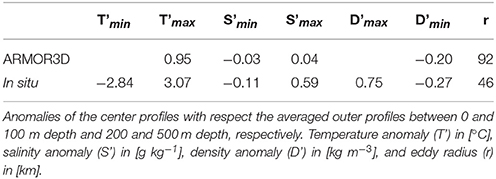
Table 2. Hydrographic properties.
The ARMOR3D density field, mainly dominated by temperature, is well correlated with in situ observations (gray contours in Figures 3b–d). The averaged outer profiles of density (Figure 3a) show good correspondence between both data sets with a correlation coefficient of 0.999 and a root mean square difference of 0.04 kg m−3 that represent 0.43% of the variance of the averaged outer vertical profile of the in situ density (Table 1). The ARMOR3D field (Figure 3d) shows a depression of the isopycnals below 100 m and between 25 and 27.5°N in accordance with the presence of an anticyclonic eddy, while the seasonal pycnocline remains flat. The ARMOR3D isopycnals are smooth, however the main pycnocline resembles well the depression depicted in the in situ data (Figures 3b,c). Moreover, the eddy signal can be observed from 100 m to the maximum sampled depth (1,000 m) in both fields. The upper doming of the seasonal pycnocline observed in the in situ data is the result of thermal wind balance in accordance with the vertical shear induced by the subsurface intensified anticyclonic flow (Barceló-Llull et al., 2017b). The ARMOR3D geostrophic velocities have maximum values at the surface and, in accordance with thermal wind balance, the upper pycnocline remains flat.
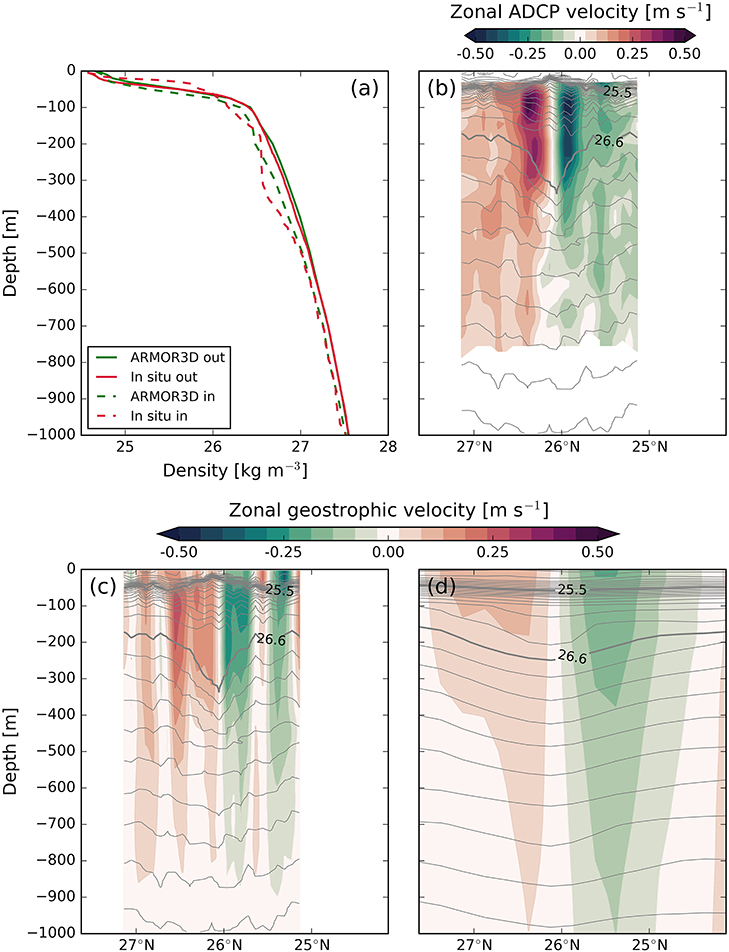
Figure 3. (a) Eddy center vertical profiles and averaged outer profiles (two outer profiles in each extreme of the transects) of density. Zonal component of the (b) ADCP velocity along the in situ Le Tourmalet transect, (c) geostrophic velocity estimated from the in situ density field along the Le Tourmalet transect, and (d) geostrophic velocity from ARMOR3D (10-09-2014). Gray contours in (b–d) represent density, σΘ, with a contour interval of 0.1 kg m−3.
The zonal component of the horizontal velocity measured with the ADCP during the meridional transect (Figure 3b), which includes geostrophic and ageostrophic motions, has maxima of 0.49 (−0.53) m s−1 at 97 m, while the ARMOR3D geostrophic velocity (Figure 3d) has maxima of 0.11 (−0.19) m s−1 at the sea surface, which represent an underestimation of the flow by a factor of 4 (Table 3). In addition, the ARMOR3D flow is surface intensified, contrary to the observed flow that shows subsurface maxima at ~100 m depth. Inferring the zonal component of the geostrophic velocity from the in situ density of the meridional transect (Figure 3c) and assuming a level of no motion at 1,000 m depth, the maxima are 0.27 (−0.30) m s−1, which represent twice the ARMOR3D geostrophic velocity. The anticyclonic circulation in the ARMOR3D field extends from 24.5°N to 27.5°N in the upper layers with the maximum intensification concentrated in the upper 500 m depth, defined as the eddy base from in situ observations (Barceló-Llull et al., 2017b) although its influence is apparent at least until the maximum sampled depth (1,000 m).
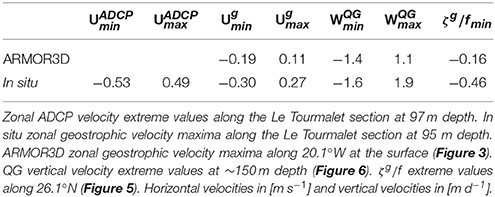
Table 3. Dynamical variables.
Figures 2, 3 highlight the difference in eddy sizes with each data set. In order to better compare horizontal distributions of density using the in situ 3D fields, in Figure 4 we perform a normalization of the horizontal axes using the respective estimated eddy radii: ris = 46 km for the PUMP eddy, and rar = 2ris = 92 km from ARMOR3D (Chelton et al., 2011; Gaube et al., 2013, 2014, 2015; Gaube and McGillicuddy, 2017; Mason et al., 2017). The in situ and ARMOR3D eddies have similar elliptical shapes of the isopycnals with the major axis oriented NW-SE in both data sets (Figure 4). The aspect ratio of the 26.58 kg m−3 isopycnal at 200 m depth is 1.44 for the in situ data and 1.38 for the ARMOR3D product. In situ geostrophic velocity magnitude is double the ARMOR3D geostrophic velocities with a similar deceleration of the flow at the northern part of the eddy (Figure 4).
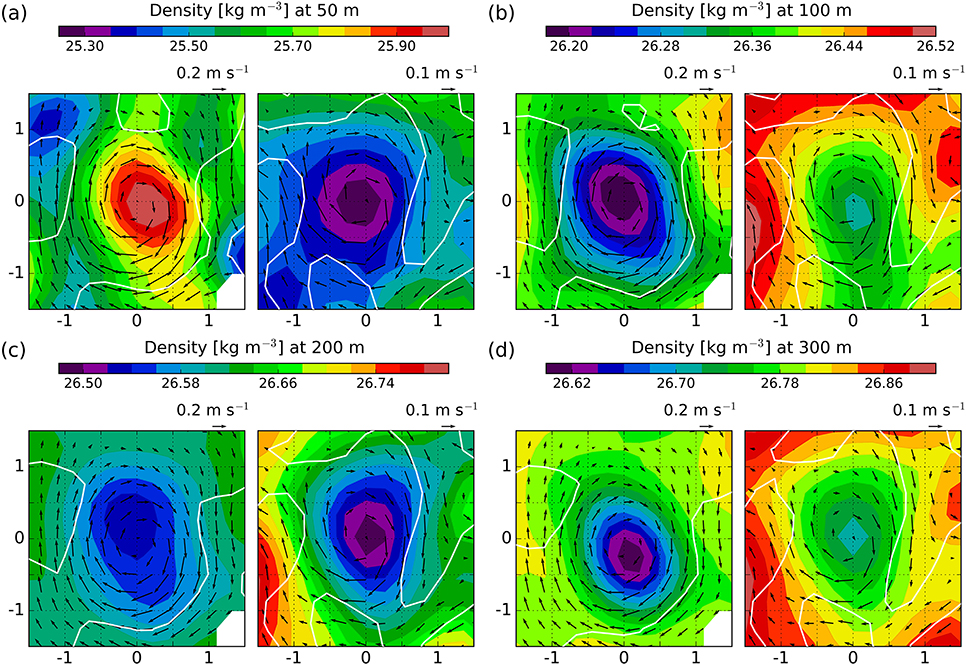
Figure 4. Horizontal sections of the density field, σΘ, at different depths with superimposed vectors of geostrophic velocity: (a) ~50 m, (b) ~100 m, (c) ~200 m and (d) ~300 m depth. Left (right) panel in each subplot represents the in situ (ARMOR3D, 10-09-2014) data. The longitude and latitude coordinates of the eddy are normalized by the eddy radius: 46 (92) km for the in situ (ARMOR3D) data. White contours represent ζg/f = 0.
The scaled geostrophic vertical relative vorticity, ζg/f, provides an estimate of the local geostrophic Rossby number. Figure 5 shows different vertical distributions of ζg/f for each data set related to the subsurface intensification of the in situ flow in contrast to the surface intensified ARMOR3D flow. The ARMOR3D field has an extreme value at the eddy center of ζg/f = −0.16 while with the in situ data we obtain a ζg/f = −0.46, almost three times larger (Table 3).
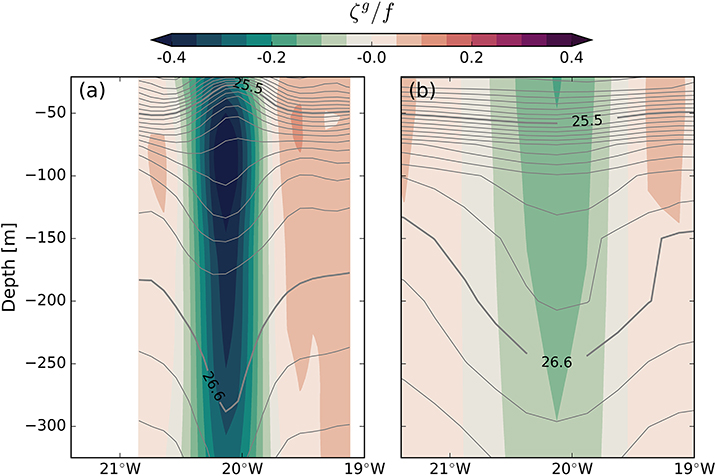
Figure 5. (a,b) Vertical sections along 26.1°N of the geostrophic vertical relative vorticity scaled by the planetary vorticity (ζg/f) for the in situ and ARMOR3D (10-09-2014) data, respectively. Contours represent density, σΘ, with a contour interval of 0.1 kg m−3.
QG vertical velocity is estimated for both data sets. For the ARMOR3D case, we derive wQGar for two consecutive weeks: 03-09-2014 and 10-09-2014, as the in situ 3D sampling was carried out in the middle of these two dates. The wQGis is characterized by two different horizontal distributions in the seasonal and main pycnoclines (Barceló-Llull et al., 2017a), while wQGar has the same horizontal distribution in all the water column. Figure 6 shows the horizontal distributions of wQG at ~150 m depth. At the main pycnocline the wQGis distribution has a quadripolar pattern, while the wQGar distribution is composed of small cells with alternating signs located along the eddy periphery. In consecutive weeks the location of the cells seems to be slightly rotated. The maxima of vertical velocity are located at the periphery of both eddies. Besides the difference in the horizontal distribution, the magnitude of wQG is similar for both eddies (Table 3).
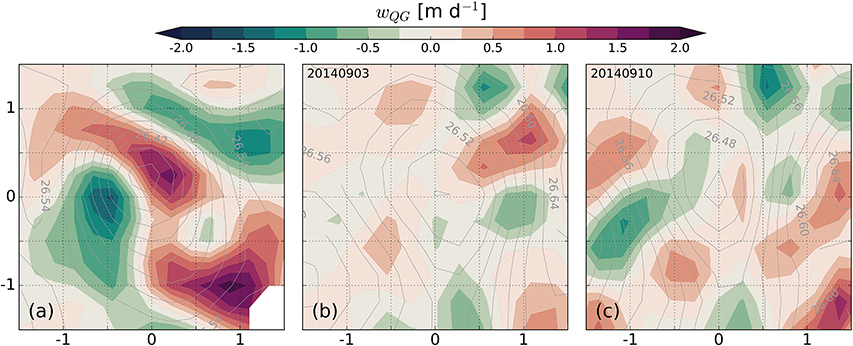
Figure 6. QG vertical velocity estimated with the in situ data (a) and with the ARMOR3D product (b,c) for two consecutive weeks (03-09-2014 and 10-09-2014) at ~150 m depth. Contours of density, σΘ, are represented for reference [kg m−3]. The longitude and latitude coordinates of the eddy are normalized by the eddy radius: 46 (92) km for the in situ (ARMOR3D) data.
4. Discussion and Concluding Remarks
We have presented a comparison of the CMEMS ocean state estimate ARMOR3D hydrodynamic fields with 3D high-resolution in situ observations in order to analyze the ability of the ARMOR3D product to describe the 3D structure of mesoscale eddies. ARMOR3D reproduces the large scale stratification of the ocean with an underestimation of the hydrographic anomalies within the eddy core, and an overestimation of the eddy radius inherited from altimetry of 92 km, in comparison with the in situ-derived eddy radius of 46 km. The overestimation of the eddy size in the SLA maps may be due to along track data coverage, their lower resolution (0.25°) and the correlation scales used to construct the product.
The PUMP eddy is characterized by a hydrographic core centered between 200 and 500 m depth. The core has warmer and saltier water properties than the surrounding waters at the same depth level (Bindoff and McDougall, 1994), as well as an elliptical horizontal isopycnal shape that is reflected in both data sets. The difference in density magnitude is due to the shallower depression of the ARMOR3D isopycnals in comparison with the deeper depressed in situ isopycnals (Figures 3, 5). The eddy signal is apparent in density and horizontal velocity to at least 1,000 m depth. The horizontal currents are most intense in the upper 500 m, which has been defined as the eddy base. The averaged outer vertical profiles of temperature, salinity and density show correlation coefficients between both data sets higher than 0.99 with root mean square differences that represent 0.3–0.4% of the in situ vertical profile variances (Table 1). The high correlation between the outer vertical profiles of the hydrographic fields is a good indicator of the ability of ARMOR3D to reproduce the subsurface vertical stratification of the ocean, as this mean outer profile may be different in other regions of the ocean. The eddy center profiles of temperature, salinity and density reveal that ARMOR3D underestimates the hydrographic anomalies. Moreover, in the upper 100 m depth ARMOR3D does not reproduce the eddy cap, i.e., the cold, saltier and denser upper region of the PUMP eddy. A global comparison with independent temperature and salinity profiles (Guinehut et al., 2012) shows that the root mean square error is higher around 50–100 m depth corresponding with the seasonal pycnocline.
Regarding the dynamical variables, ARMOR3D geostrophic velocities show a deceleration of the flow at the northern edge of the eddy, in accordance with the in situ observations, that may be due to the westward propagation of the eddy which would intensify the southern flank westward velocities and decelerate the northern flank eastward flow. However, we note that the significance of this observation is limited given that ARMOR3D underestimates the PUMP eddy geostrophic flow by a factor of 2 and describes a surface intensified flow. This surface intensification of the flow is reflected in the vertical distribution of the local geostrophic Rossby number, which has a magnitude that is underestimated by a factor of 3. Quasi-geostrophic (QG) vertical velocity inferred from the two data sets has similar magnitudes, and the upwelling/downwelling cells are located along the eddy periphery. In conclusion, ARMOR3D is capable of reproducing the large scale stratification of the ocean with an underestimation of the hydrographic anomalies and geostrophic velocities, and with similar QG vertical velocity magnitudes. On the other hand, at this date the product fails to reproduce the intrathermocline signature of the eddy, with flat isopycnals in the upper layers and a surface intensified circulation. Improvements are expected with a new reprocessed ARMOR3D product that uses sea surface salinity (SSS) fields (Droghei et al., 2016) and updated statistical profiles for the projection of surface data (SLA, SST, SSS) to depth.
The eddy analyzed in this study is an anticyclonic intrathermocline eddy (ITE). These eddies are characterized by complex baroclinic structure and intense submesoscale signatures (e.g., Lee and Niiler, 1998; Karstensen et al., 2017), making comparison particularly challenging. Better agreements between in situ and ARMOR3D fields may be expected with surface intensified anticyclonic/cyclonic eddies. However, our comparison here is justified because subsurface eddies are present all over the world ocean and may play important roles in lateral transports of momentum and hydrographic properties and also in triggering ecosystem responses (McWilliams, 1985; Pegliasco et al., 2015; McWilliams, 2016; Schütte et al., 2016a,b). Hence, it is important to evaluate the presence of this type of eddies in observation-based products and numerical models.
Anticyclonic ITEs have an upper density structure with upward displacement of the isopycnals toward the eddy center. Their surface velocity and SLA signature can also be weak (Schütte et al., 2016a) depending on the depth of their core, on the stratification and on the intensity of their anomalies within their cores. The present ITE does have a significant surface signature (maximum velocity ~0.2–0.3 m s−1) so the weaker dynamical signal reconstructed by ARMOR3D may be associated with the coarse resolution of SLA and the smoothing associated with the construction of the gridded SLA maps (here illustrated by the size of the eddy, which is twice the observed one), which are known to underestimate the geostrophic flows.
Figure 7a shows the SST signal on 10-09-2017 for the PUMP eddy region together with SLA contours and the Argo float positions of the vertical profiles used to construct the ARMOR3D output. The PUMP eddy cold signature is centered at around 30 m depth with no representation on the surface layer (Figure 2b), because of this there is no cold eddy signal on the SST map. The Argo profiles are found at the periphery of the eddy, with a gradual drift toward the eddy core with time. Figures 7b,c corroborate this approximation as the vertical profiles of temperature and salinity progressively approach the PUMP eddy center profiles. To be able to resolve the subsurface intensification of the flow with ARMOR3D fields, the presence of Argo vertical profiles of temperature and salinity within the eddy core are necessary so as to obtain the correct correlation functions to reconstruct the subsurface nature of the eddy (Assassi et al., 2016).
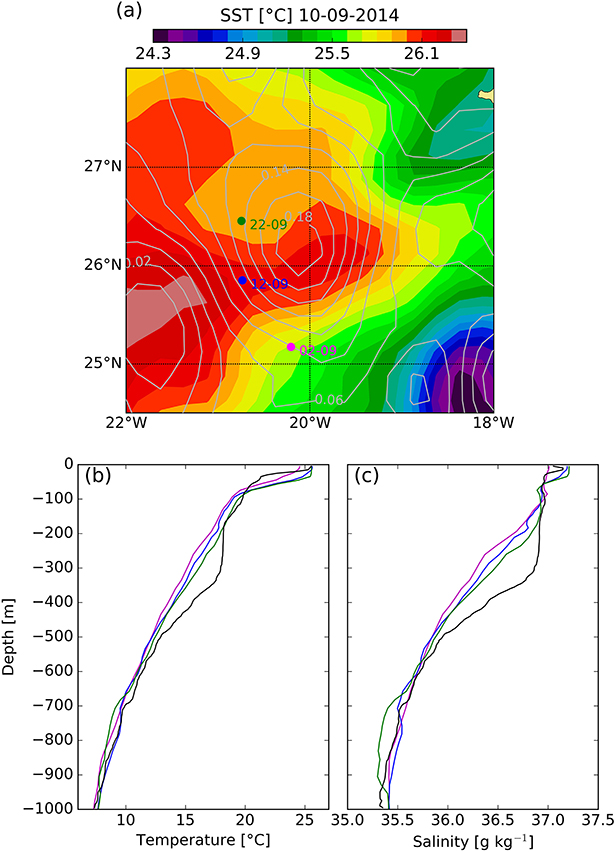
Figure 7. Data used to reconstruct the ARMOR3D fields: (a) SST signal from NOAA (https://www.ncdc.noaa.gov/oisst) on 10-09-2014 with SLA contours from CMEMS superimposed in meters. Dots represent Argo position in different dates (pink 02-09-2014; blue 12-09-2014; green 22-09-2014). (b,c) Temperature and salinity Argo profiles, respectively, with the same color code as in (a). Black lines are the eddy center temperature and salinity profiles from the PUMP data set.
As the upper cold signature of the PUMP eddy cannot be represented on SST maps, we analyze the PUMP eddy lifecycle using ARMOR3D fields, and the presence of Argo buoy profiles within the eddy. Using the automated eddy tracker of Mason et al. (2014) we could detect the PUMP eddy trajectory since its formation (gray dots in Figure 1). With ARMOR3D fields we can analyze the 3D hydrodynamic structure of the PUMP eddy every week since its formation until the end of October 2014. Zonal sections crossing the eddy center (Figure 8) reveal that the ARMOR3D eddy has a subsurface intensification of the flow 1 month after the eddy sampling, coinciding with the presence of an Argo buoy within the eddy core (Figure 9). In correspondence with the subsurface flow, the upper thermocline is bowl-shaped and introduces cold water upwards (Figure 9).
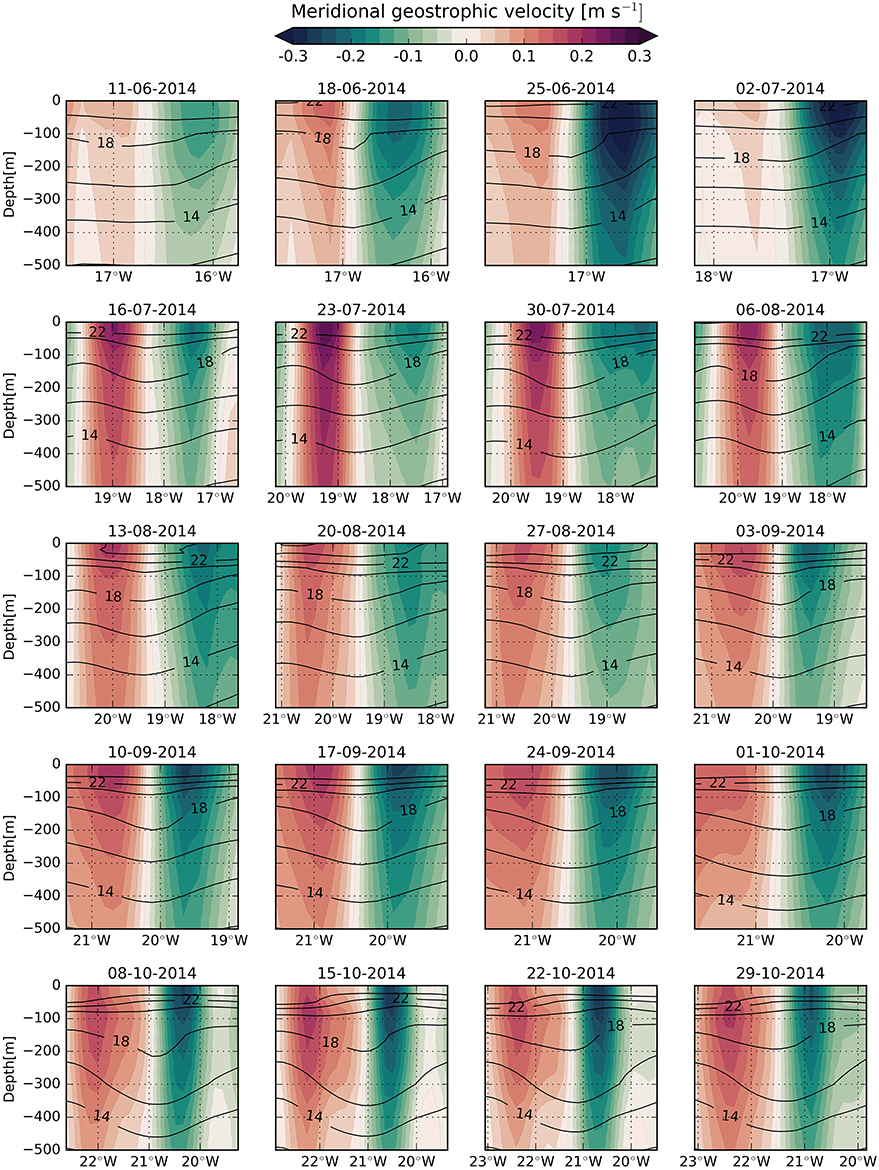
Figure 8. Meridional component of the geostrophic velocity along a zonal transect crossing the ARMOR3D eddy center since the eddy generation. Black contours represent temperature in [°C]. ARMOR3D eddy has a subsurface intensification of the flow and a bowl-shaped seasonal thermocline 1 month after the eddy sampling, coinciding with the presence of an Argo buoy within the eddy core.
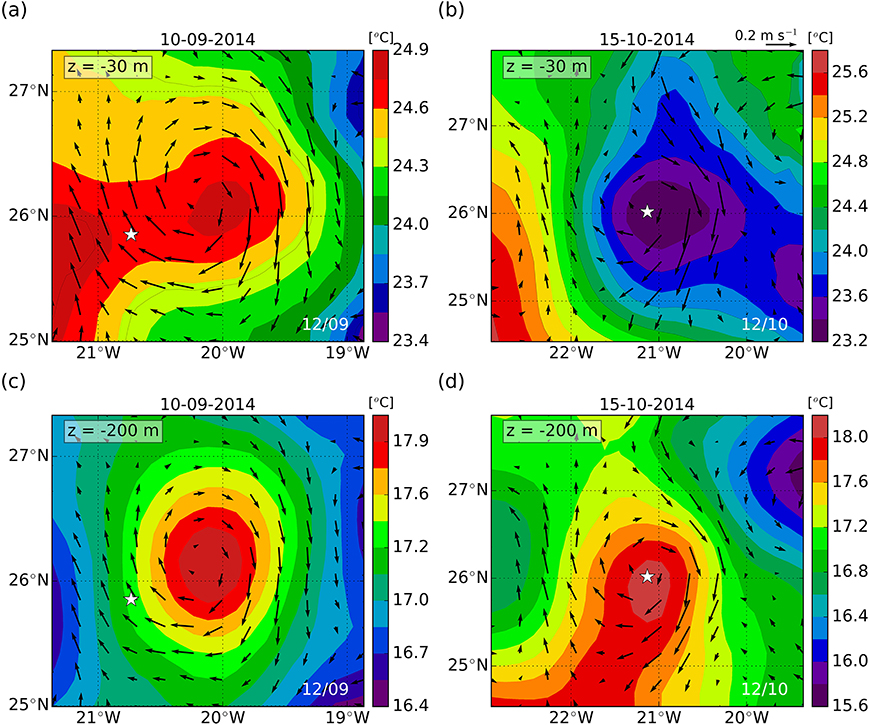
Figure 9. Temperature maps with geostrophic velocity vectors from ARMOR3D on the eddy comparison date (10-09-2014) and 1 month after (15-10-2014) at the seasonal (a,b) and main (c,d) thermoclines. White stars indicate the location of two Argo profiles: on 12-09-2014 at the eddy periphery (a,c) and on 12-10-2014 at the eddy core (b,d).
Our results demonstrate that, even with the presence of Argo floats, ARMOR3D may not resolve the ITE structure. To be able to reproduce the subsurface nature of ITEs it is needed the presence of Argo profiles within the eddy core. To check if we could find other examples of ITEs in the ARMOR3D data we again applied the automated eddy tracker of Mason et al. (2014) to weekly gridded CMEMS sea level anomalies at the Canary Eddy Corridor region for the period 2000-2015. We then evaluated the mean profile of the eddy geostrophic swirl speed from ARMOR3D for every identified eddy. We found that about 20% of the anticyclonic eddy swirl speed profiles had maxima between 50 and 150 m depth; this is the signature of an ITE. ARMOR3D is therefore able to detect and reproduce the vertical structure of intrathermocline eddies (subsurface intensification of the flow and cold seasonal thermocline) in the region under analysis not only for the PUMP eddy case. The ability of the ARMOR3D product to detect ITEs in other regions of the world ocean are expected to be a source of future work.
The underestimation of the local Rossby number may have important implications for the inference of the vertical velocity, as the QG approximation is valid for low Rossby numbers. If we compare the local geostrophic Rossby number inferred from ARMOR3D fields and the local Rossby number obtained with ADCP horizontal velocities (Barceló-Llull et al., 2017b) we obtain an underestimation by a factor of 4 of the total local Rossby number. If we only consider the local geostrophic Rossby number from both data sets we obtain an underestimation by a factor of 3. Besides this, we have to take into account that the in situ geostrophic Rossby field is estimated with the in situ geostrophic velocity, which is inferred with 3D density fields and considering the ADCP data at the reference level (325 m depth) (Appendix).
We note that the resolution of the 3D in situ fields obtained from the PUMP cruise is the result of a compromise between spatial resolution and synopticity of the eddy sampling (Barceló-Llull et al., 2017a), where the aim was to resolve the mesoscale circulation. Allen et al. (2001) study the implications of errors associated with sampling strategies on vertical velocity estimates. They used a sampling strategy similar to the PUMP survey to sample mesoscale structures, and they found that vertical velocity distributions remained unaltered, while their magnitudes were reduced because of the smoothing introduced by the sampling resolution, but without alterations due to quasi-synopticity. The geostrophic Rossby number and QG vertical velocity inferred here have not accounted for the ageostrophic component of the flow. To have a more realistic view of these parameters we refer to Barceló-Llull et al. (2017a). Regarding the resolution of the in situ fields, the derived parameters may be underestimated in comparison with the inclusion of small-scale features with high Ro (Klein and Lapeyre, 2009). Vertical motion is a challenging variable to diagnose and there are large errors associated with its inference due to theoretical approximations, the presence of inertial gravity waves and tides, the lack of synopticity of the experimental data, instrumental errors, the interpolation method and the scales resolved (e.g., Allen et al., 2001; Gomis et al., 2001; Naveira Garabato et al., 2001; Rixen and Beckers, 2002; Viúdez and Dritschel, 2003, 2004; Pallàs-Sanz and Viúdez, 2005). The importance of the vertical velocity has been known for decades and today is still considered a hot topic (Liang et al., 2017). This is one of the primary motivations of the Office of Naval Research (ONR) Coherent Lagrangian Pathways from the Surface Ocean to Interior (CALYPSO) program.
Data from multiplatform experiments such as PUMP can play an important role in the assessment of operational products such as those provided by CMEMS, and we expect to see more examples in the future as the need for and benefit of these types of experiments becomes apparent (Shcherbina et al., 2015; Pascual et al., 2017).
Author Contributions
BB-L and AP: planning of the research. BB-L, AP, EM, and SM: validation and analysis of the results. All authors contributed to the drafting of the manuscript.
Funding
During the drafting of the manuscript BB-L was supported by a pre-doctoral grant from the Spanish National Research Program associated with the PUMP project (BES-2013-065459). Now she is supported by a post-doctoral contract in the framework of the PRE-SWOT project (CTM2016-78607-P) funded by the Spanish National Research Program and the European Regional Development Fund (MINECO-FEDER). This paper is a contribution to the PUMP project (CTM2012-33355) funded by the Spanish National Research Program. EM is supported by the Copernicus Marine Environment Monitoring Service (CMEMS) MedSUB project. AP acknowledges support from the PRE-SWOT project (CTM2016-78607-P) funded by the Spanish National Research Program and the European Regional Development Fund (MINECO-FEDER). SM acknowledges support from the European Copernicus Marine Environment Monitoring Service (CMEMS).
Conflict of Interest Statement
The authors declare that the research was conducted in the absence of any commercial or financial relationships that could be construed as a potential conflict of interest.
Acknowledgments
The authors acknowledge the contribution of the reviewers to the improvement of this manuscript. ARMOR3D data are supplied by Copernicus Marine Environment Monitoring Service (CMEMS) at http://marine.copernicus.eu. The PUMP eddy raw data supporting the conclusions of this manuscript will be made available by the authors, without undue reservation, to any qualified researcher.
References
Allen, J. T., Smeed, D. A., Nurser, A. J. G., Zhang, J. W., and Rixen, M. (2001). Diagnosis of vertical velocities with the QG omega equation: an examination of the errors due to sampling strategy. Deep Sea Res. 48, 315–346. doi: 10.1016/S0967-0637(00)00035-2
Assassi, C., Morel, Y., Vandermeirsch, F., Chaigneau, A., Pegliasco, C., Morrow, R., et al. (2016). An index to distinguish surface- and subsurface-intensified vortices from surface observations. J. Phys. Oceanogr. 46, 2529–2552. doi: 10.1175/JPO-D-15-0122.1
Barceló-Llull, B., Mason, E., Capet, A., and Pascual, A. (2016). Impact of vertical and horizontal advection on nutrient distribution in the southeast Pacific. Ocean Sci. 12, 1003–1011. doi: 10.5194/os-12-1003-2016
Barceló-Llull, B., Pallàs-Sanz, E., Sangrà, P., Martínez-Marrero, A., Estrada-Allis, S. N., and Arístegui, J. (2017a). Ageostrophic secondary circulation in a subtropical intrathermocline Eddy. J. Phys. Oceanogr. 47, 1107–1123. doi: 10.1175/JPO-D-16-0235.1
Barceló-Llull, B., Sangrà, P., Pallàs-Sanz, E., Barton, E. D., Estrada-Allis, S. N., Martínez-Marrero, A., et al. (2017b). Anatomy of a subtropical intrathermocline eddy. Deep Sea Res. I 124, 126–139. doi: 10.1016/j.dsr.2017.03.012
Bell, M. J., Schiller, A., Le Traon, P.-Y., Smith, N. R., Dombrowsky, E., and Wilmer-Becker, K. (2015). An introduction to GODAE oceanView. J Operat. Oceanogr. 8, s2–s11. doi: 10.1080/1755876X.2015.1022041
Bindoff, N. L., and McDougall, T. J. (1994). Diagnosing climate-change and ocean ventilation using hydrographic data. J. Phys. Oceanogr. 24, 1137–1152.
Buongiorno Nardelli, B., Guinehut, S., Pascual, A., Drillet, Y., Ruiz, S., and Mulet, S. (2012). Towards high resolution mapping of 3-D mesoscale dynamics from observations. Ocean Sci. 8, 885–901. doi: 10.5194/os-8-885-2012
Capet, A., Mason, E., Rossi, V., Troupin, C., Faugère, Y., Pujol, I., et al. (2014). implications of refined altimetry on estimates of mesoscale activity and eddy-driven offshore transport in the Eastern Boundary Upwelling Systems. Geophys. Res. Lett. 41, 7602–7610. doi: 10.1002/2014GL061770
Chakraborty, A., Kumar, R., Basu, S., and Sharma, R. (2015). Improving ocean state by assimilating SARAL/AltiKa derived sea level and other satellite-derived data in MITGCM. Mar. Geodesy 38, 328–338. doi: 10.1080/01490419.2014.1002142
Chelton, D. B., Gaube, P., Schlax, M. G., Early, J. J., and Samelson, R. M. (2011). The influence of nonlinear mesoscale eddies on near-surface oceanic chlorophyll. Science 334, 328–332. doi: 10.1126/science.1208897
Droghei, R., Buongiorno Nardelli, B., and Santoleri, R. (2016). Combining in situ and satellite observations to retrieve salinity and density at the ocean surface. J. Atmos. Ocean. Tech. 33, 1211–1223. doi: 10.1175/JTECH-D-15-0194.1
Feistel, R. (2003). A new extended Gibbs thermodynamic potential of seawater. Prog. Oceanogr. 58, 43–114. doi: 10.1016/S0079-6611(03)00088-0
Feistel, R. (2008). A Gibbs function for seawater thermodynamics for -6 to 80oC and salinity up to 120g kg−1. Deep Sea Res. I Oceanogr Res. Pap. 55, 1639–1671. doi: 10.1016/j.dsr.2008.07.004
Firing, E., Ranada, J., and Caldwell, P. (1995). Processing ADCP Data with the CODAS Software System Version 3.1. Bremerhaven: Joint Institute for Marine and Atmospheric Research, University of Hawaii, National Oceanographic Data Center, PANGAEA.
Gaube, P., Chelton, D. B., Samelson, R. M., Schlax, M. G., and O'neill, L. W. (2015). Satellite observations of mesoscale eddy-induced Ekman pumping. J. Phys. Oceanogr. 45, 104–132. doi: 10.1175/JPO-D-14-0032.1
Gaube, P., Chelton, D. B., Strutton, P. G., and Behrenfeld, M. J. (2013). Satellite observations of chlorophyll, phytoplankton biomass, and Ekman pumping in nonlinear mesoscale eddies. J Geophys. Res. 118, 6349–6370. doi: 10.1002/2013JC009027
Gaube, P., and McGillicuddy, Jr. D. J. (2017). The influence of Gulf Stream eddies and meanders on near-surface chlorophyll. Deep Sea Res. Part I 122, 1–16. doi: 10.1016/j.dsr.2017.02.006
Gaube, P., McGillicuddy, D. J. Jr., Chelton, D. B., Behrenfeld, M. J., and Strutton, P. G. (2014). Regional variations in the influence of mesoscale eddies on near-surface chlorophyll. J. Geophys. Res. Oceans 119, 8195–8220. doi: 10.1002/2014JC010111
Gomis, D., Ruiz, S., and Pedder, M. A. (2001). Diagnostic analysis of the 3D ageostrophic circulation from a multivariate spatial interpolation of CTD and ADCP data. Deep Sea Res. Part I Oceanogr. Res. Pap. 48, 269–295. doi: 10.1016/S0967-0637(00)00060-1
Guinehut, S., Dhomps, A.-L., Larnicol, G., and Le Traon, P.-Y. (2012). High resolution 3-d temperature and salinity fields derived from in situ and satellite observation. Ocean Sci. 8, 845–857. doi: 10.5194/os-8-845-2012
Hernandez, F., Blockley, E., Brassington, G. B., Davidson, F., Divakaran, P., Drévillon, M., et al. (2015). Recent progress in performance evaluations and near real-time assessment of operational ocean products. J. Operat. Oceanogr. 8, s221–s238. doi: 10.1080/1755876X.2015.1050282
Hoskins, B. J., Draghici, I., and Davies, H. C. (1978). A new look at the ω-equation. Quart. J. R. Met. Soc. 104, 31–38. doi: 10.1002/qj.49710443903
Karstensen, J., Schütte, F., Pietri, A., Krahmann, G., Fiedler, B., Grundle, D., et al. (2017). Upwelling and isolation in oxygen-depleted anticyclonic modewater eddies and implications for nitrate cycling. Biogeosciences 14, 2167–2181. doi: 10.5194/bg-14-2167-2017
Kaurkin, M. N., Ibrayev, R. A., and Belyaev, K. P. (2016). ARGO data assimilation into the ocean dynamics model with high spatial resolution using Ensemble Optimal Interpolation (EnOI). Oceanology 56, 774–781. doi: 10.1134/S0001437016060059
Klein, P., and Lapeyre, G. (2009). The oceanic vertical pump induced by mesoscale and submesoscale turbulence. Annu. Rev. Marine Sci. 1, 351–375. doi: 10.1146/annurev.marine.010908.163704
Le Traon, P.-Y., Ali, A., Alvarez Fanjul, E., Aouf, L., Axell, L., Aznar, R., et al. (2017). The copernicus marine environmental monitoring service: main scienti c achievements and future prospects. Spec. Issue Mercator Ocean J. 56, 1–101. doi: 10.25575/56
Le Traon, P.-Y., Antoine, D., Bentamy, A., Bonekamp, H., Breivik, L. A., Chapron, B., et al. (2015). Use of satellite observations for operational oceanography: recent achievements and future prospects. J. Operat. Oceanogr. 8, S12–S27. doi: 10.1080/1755876X.2015.1022050
Lee, D.-K., and Niiler, P. P. (1998). The inertial chimney: the near-inertial energy drainage from the ocean surface to the deep layer. J. Geophys. Res. Oceans, 103, 7579–7591. doi: 10.1029/97JC03200
Legler, D. M., Freeland, H. J., Lumpkin, R., Ball, G., McPhaden, M. J., North, S., et al. (2015). The current status of the real-time in situ global ocean observing system for operational oceanography. J. Operat. Oceanog. 8, s189–s200. doi: 10.1080/1755876X.2015.1049883
Liang, X., Spall, M. A., and Wunsch, C. (2017). Global ocean vertical velocity from a dynamically consistent ocean state estimate. J. Geophys. Res. Oceans. 122, 8208–8224. doi: 10.1002/2017JC012985
Liblik, T., Karstensen, J., Testor, P., Alenius, P., Hayes, D., Ruiz, S., et al. (2016). Potential for an underwater glider component as part of the Global Ocean Observing System. Methods Oceanogr. 17, 50–82. doi: 10.1016/j.mio.2016.05.001
Mason, E., Pascual, A., Gaube, P., Ruiz, S., Pelegrí, J. L., and Delepoulle, A. (2017). Subregional characterization of mesoscale eddies across the brazil-malvinas confluence. J. Geophys. Res. Oceans. 122, 3329–3357. doi: 10.1002/2016JC012611
Mason, E., Pascual, A., and McWilliams, J. C. (2014). A new sea surface height–based code for oceanic mesoscale eddy tracking. J. Atmos. Ocean. Technol. 31, 1181–1188. doi: 10.1175/JTECH-D-14-00019.1
McWilliams, J. C. (1985). Submesoscale, coherent vortices in the ocean. Rev. Geophys. 23, 165–182. doi: 10.1029/RG023i002p00165
McWilliams, J. C. (2016). Submesoscale currents in the ocean. Proc. R. Soc. A 472, 1–32. doi: 10.1098/rspa.2016.0117
Mulet, S., Rio, M.-H., Mignot, A., Guinehut, S., and Morrow, R. (2012). A new estimate of the global 3D geostrophic ocean circulation based on satellite data and in-situ measurements. Deep-Sea Res II: Top Stud Oceanogr. 77–80, 70–81. doi: 10.1016/j.dsr2.2012.04.012
Naveira Garabato, A. C., Leach, H., Allen, J. T., Pollard, R. T., and Strass, V. H. (2001). Mesoscale subduction at the antarctic polar front driven by baroclinic instability. J. Phys. Oceanogr. 31, 2087–2107. doi: 10.1175/1520-0485(2001)031<2087:MSATAP>2.0.CO;2
Pallàs-Sanz, E., and Viúdez, A. (2005). Diagnosing mesoscale vertical motion from horizontal velocity and density data. J. Phys. Oceanogr. 35, 1744–1762. doi: 10.1175/JPO2784.1
Pascual, A., Gomis, D., Haney, R. L., and Ruiz, S. (2004). A quasigeostrophic analysis of a meander in the palamos canyon: vertical velocity, geopotential tendency, and a relocation technique. J. Phys. Oceanogr. 34, 2274–2287. doi: 10.1175/1520-0485(2004)034<2274:AQAOAM>2.0.CO;2
Pascual, A., Ruiz, S., Buongiorno Nardelli, B., Guinehut, S., Iudicone, D., and Tintoré, J. (2015). Net primary production in the Gulf Stream sustained by quasi-geostrophic vertical exchanges. Geophys. Res. Lett. 42, 441–449. doi: 10.1002/2014GL062569
Pascual, A., Ruiz, S., Olita, A., Troupin, C., Claret, M., Casas, B., et al. (2017). A multiplatform experiment to unravel meso- and submesoscale processes in an intense front (AlborEx). Front. Mar. Sci. 4:39. doi: 10.3389/fmars.2017.00039
Pegliasco, C., Chaigneau, A., and Morrow, R. (2015). Main eddy vertical structures observed in the four major Eastern Boundary Upwelling Systems. J. Geophys. Res. 120, 6008–6033. doi: 10.1002/2015JC010950
Pujol, M.-I., Faugère, Y., Taburet, G., Dupuy, S., Pelloquin, C., Ablain, M., et al. (2016). DUACS DT2014: the new multi-mission altimeter data set reprocessed over 20 years. Ocean Sci. 12, 1067–1090. doi: 10.5194/os-12-1067-2016
Rixen, M., and Beckers, J.-M. (2002). A synopticity test of a sampling pattern in the Alboran Sea. J. Mar. Syst. 35, 111–130. doi: 10.1016/S0924-7963(02)00080-5
Sangrà, P., Pascual, A., Rodríguez-Santana, A., Machín, F., Mason, E., McWilliams, J. C., et al. (2009). The Canary ddy Corridor: a major pathway for long-lived eddies in the subtropical North Atlantic. Deep Sea Res. 56, 2100–2114. doi: 10.1016/j.dsr.2009.08.008
Schiller, A., and Brassington, G. B. (eds.). (2011). Operational Oceanography in the 21st Century, 1st Edn. Springer
Schütte, F., Brandt, P., and Karstensen, J. (2016a). Occurrence and characteristics of mesoscale eddies in the tropical northeastern atlantic ocean. Ocean Sci. 12, 663–685. doi: 10.5194/os-12-663-2016
Schütte, F., Karstensen, J., Krahmann, G., Hauss, H., Fiedler, B., Brandt, P., et al. (2016b). Characterization of “dead-zone” eddies in the eastern tropical north atlantic. Biogeosciences 13, 5865–5881. doi: 10.5194/bg-13-5865-2016
Shcherbina, A. Y., Sundermeyer, M. A., Kunze, E., D'Asaro, E., Badin, G., Birch, D., et al. (2015). The latmix summer campaign: submesoscale stirring in the upper ocean. Bull. Am. Meteorol. Soc. 96, 1257–1279. doi: 10.1175/BAMS-D-14-00015.1
Sotillo, M. G., Amo-Balandrón, A., Padorno, E., Garcia-Ladona, E., Orfila, A., Rodríguez-Rubio, P., et al. (2016). How is the surface Atlantic water inflow through the Gibraltar Strait forecasted? A lagrangian validation of operational oceanographic services in the Alboran Sea and the Western Mediterranean. Deep Sea Res. II Trop. Stud. Oceanogr. 133, 100–117. doi: 10.1016/j.dsr2.2016.05.020
Viúdez, A., and Dritschel, D. G. (2003). Vertical velocity in mesoscale geophysical flows. J. Fluid Mech. 483, 199–223. doi: 10.1017/S0022112003004191
Viúdez, A. and Dritschel, D. G. (2004). Potential vorticity and the quasigeostrophic and semigeostrophic mesoscale vertical velocity. J. Phys. Oceanogr. 34, 865–887. doi: 10.1175/1520-0485(2004)034<0865:PVATQA>2.0.CO;2
Appendix
Because of the difference in reference level used to infer the ARMOR3D geostrophic flow and the in situ 3D geostrophic velocity, we represent in Figure A1 the horizontal distribution of these velocities at different depths, as well as the ADCP velocity vectors. Both geostrophic velocities show good agreement, with an anticyclonic circulation and a deceleration of the flow at the northwestern eddy edge.
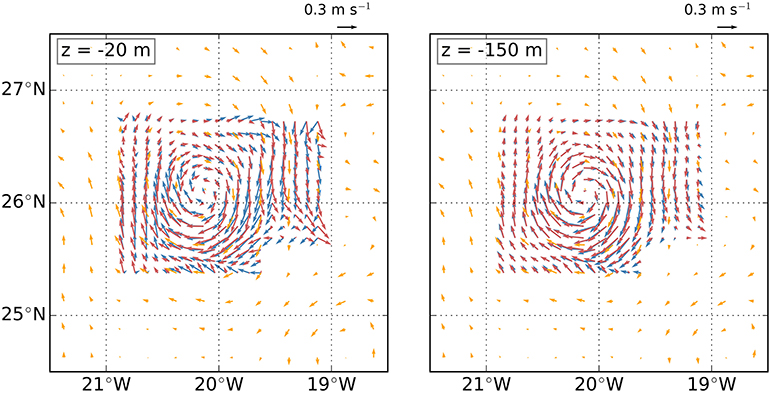
Figure A1. Horizontal sections at ~20 and ~150 m depth of the ARMOR3D geostrophic velocity (yellow arrows), in situ geostrophic velocity from the 3D sampling (red arrows) and ADCP velocity from the 3D sampling (blue arrows).
Keywords: intrathermocline eddy, observation-based product, remote sensing, altimetry, argo, geostrophic flow, vertical velocity, quasi-geostrophy
Citation: Barceló-Llull B, Pascual A, Mason E and Mulet S (2018) Comparing a Multivariate Global Ocean State Estimate With High-Resolution in Situ Data: An Anticyclonic Intrathermocline Eddy Near the Canary Islands. Front. Mar. Sci. 5:66. doi: 10.3389/fmars.2018.00066
Received: 28 August 2017; Accepted: 13 February 2018;
Published: 27 March 2018.
Edited by:
Gilles Reverdin, Centre National de la Recherche Scientifique (CNRS), FranceReviewed by:
Yves Morel, UMR5566 Laboratoire d'Études en Géophysique et Océanographie Spatiales (LEGOS), FranceLouis Marie Prieur, UMR7093 Laboratoire d'Océanographie de Villefranche (LOV), France
Johannes Karstensen, GEOMAR Helmholtz Centre for Ocean Research Kiel, Germany
Copyright © 2018 Barceló-Llull, Pascual, Mason and Mulet. This is an open-access article distributed under the terms of the Creative Commons Attribution License (CC BY). The use, distribution or reproduction in other forums is permitted, provided the original author(s) and the copyright owner are credited and that the original publication in this journal is cited, in accordance with accepted academic practice. No use, distribution or reproduction is permitted which does not comply with these terms.
*Correspondence: Bàrbara Barceló-Llull, b.barcelo.llull@gmail.com