Integrating Larval Dispersal, Permitting, and Logistical Factors Within a Validated Habitat Suitability Index for Oyster Restoration
 Brandon J. Puckett1,2*
  Seth J. Theuerkauf1
  David B. Eggleston1
  Rodney Guajardo1,2 Craig Hardy3 Jie Gao4 Richard A. Luettich4
- 1Department of Marine, Earth and Atmospheric Sciences, Center for Marine Sciences and Technology, North Carolina State University, Morehead, NC, United States
- 2North Carolina Coastal Reserve and National Estuarine Research Reserve, Beaufort, NC, United States
- 3North Carolina Division of Marine Fisheries, Morehead, NC, United States
- 4Institute of Marine Sciences, University of North Carolina-Chapel Hill, Morehead, NC, United States
Habitat suitability index (HSI) models are increasingly used to guide ecological restoration. Successful restoration is a byproduct of several factors, including physical and biological processes, as well as permitting and logistical considerations. Rarely are factors from all of these categories included in HSI models, despite their combined relevance to common restoration goals such as population persistence. We developed a Geographic Information System (GIS)-based HSI for restoring persistent high-relief subtidal oyster (Crassostrea virginica) reefs protected from harvest (i.e., sanctuaries) in Pamlico Sound, North Carolina, USA. Expert stakeholder input identified 17 factors to include in the HSI. Factors primarily represented physical (e.g., salinity) and biological (e.g., larval dispersal) processes relevant to oyster restoration, but also included several relevant permitting (e.g., presence of seagrasses) and logistical (e.g., distance to restoration material stockpile sites) considerations. We validated the model with multiple years of oyster density data from existing sanctuaries, and compared HSI output with distributions of oyster reefs from the late 1800's. Of the 17 factors included in the model, stakeholders identified four factors—salinity, larval export from existing oyster sanctuaries, larval import to existing sanctuaries, and dissolved oxygen—most critical to oyster sanctuary site selection. The HSI model provided a quantitative scale over which a vast water body (~6,000 km2) was narrowed down by 95% to a much smaller suite of optimal (top 1% HSI) and suitable (top 5% HSI) locations for oyster restoration. Optimal and suitable restoration locations were clustered in northeast and southwest Pamlico Sound. Oyster density in existing sanctuaries, normalized for time since reef restoration, was a positive exponential function of HSI, providing validation for the model. Only a small portion (10–20%) of historical reef locations overlapped with current, model-predicted optimal and suitable restoration habitat. We contend that stronger linkages between larval connectivity, landscape ecology, stakeholder engagement and spatial planning within HSI models can provide a more holistic, unified approach to restoration.
Introduction
Ecological restoration is a global endeavor with the potential to stem declines in populations, biodiversity, and ecosystem services (Aronson and Alexander, 2013; Wortley et al., 2013; Perring et al., 2015). A critical first step in the restoration process is the identification of optimal sites for restoration within the broader land- or seascape of interest (Bell et al., 1997; Weinstein, 2007). Habitat suitability models tailored to restoration applications are commonly used to inform the site selection process (U. S. Fish and Wildlife Service, 1981; Brooks, 1997; Roloff and Kernohan, 1999). Sites are selected to maximize a spatially-explicit habitat suitability index (HSI) generated from the integration of several relevant factors including physical and biological processes, as well as permitting and logistical considerations. Rarely are factors from all four categories included in HSI models despite their combined relevance to common restoration goals such as ecological functionality and population persistence (Roloff and Kernohan, 1999). Population persistence is a critically important restoration goal for bivalves such as oysters, which, unlike other biogenic habitats (e.g., seagrass, mangroves, salt marsh), are commercially and recreationally harvested (Coen and Luckenbach, 2000). In marine systems, (meta)populations persist when the interplay between (sub)population demographics and connectivity, typically the exchange of larvae among (sub)populations, ensures each adult is replaced by at least one larval recruit that survives to reproduce (Hastings and Botsford, 2006). Larval dispersal and connectivity are often considered the primary drivers of (meta)population persistence in marine systems (Hastings and Botsford, 2006; Lipcius et al., 2008). Here, we develop and validate a Geographic Information System (GIS)-based HSI using a combination of 17 physical, biological, permitting, and logistical factors, including larval dispersal to provide spatially-explicit guidance for restoration of subtidal eastern oyster (Crassostrea virginica) reefs with the goal of promoting population persistence.
Oyster reefs are one of the most imperiled marine habitats on earth (Beck et al., 2011). Native oyster populations globally are estimated at 10–15% of their historic levels due to a combination of overfishing, habitat destruction, and disease. Concomitant with population declines has been a loss in key ecosystem services that oysters and oyster reefs provide such as water filtration, shoreline stabilization and essential fish habitat (Coen and Luckenbach, 2000; Beck et al., 2011; Grabowski et al., 2012). The global loss of native oyster populations has prompted extensive efforts to restore these economically- and ecologically-important bivalves. Oyster restoration techniques vary, but are generally designed to provide habitat (e.g., thin layer of shell or three-dimensional artificial reefs) where habitat is limiting, or subsidies of juvenile oysters (e.g., hatchery-based stock enhancement) where recruitment is limiting (Coen and Luckenbach, 2000; Laing et al., 2006; Quan et al., 2009; Theuerkauf et al., 2015). Recent efforts to restore eastern oysters (the focal species of this work; hereafter referred to as oysters) along the U.S. Atlantic and Gulf coasts have focused on constructing three-dimensional artificial reefs to provide hard substrate for oyster settlement (Powers et al., 2009; Schulte et al., 2009; Puckett and Eggleston, 2012; La Peyre et al., 2014).
The success of oyster restoration is mixed. Relatively high, yet variable oyster densities have been reported on artificial reefs designated as no-harvest oyster sanctuaries in Chesapeake Bay and Pamlico Sound, USA (Powers et al., 2009; Schulte et al., 2009; Puckett and Eggleston, 2012). In oyster sanctuaries in Pamlico Sound, oyster densities generally peaked 2–4 years post-restoration at 200–1,000 oysters m−2 followed by a gradual decline over the next 10+ years to 100–600 oysters m−2 (Figure 1). The notable exception occurred at two (of 10) sanctuaries where oyster densities completely collapsed within seven years of restoration (closed circles in Figure 1). Over these decadal time scales, Powers et al. (2009) reported a 36% failure rate of restored artificial oyster reefs in estuaries of North Carolina, USA. A recent analysis across multiple states in the Gulf of Mexico indicated that 25% of restored artificial reefs failed to harbor any oysters several years post-construction (La Peyre et al., 2014). The failure of restored artificial oyster reefs is often linked to byproducts of inadequate site selection, such as burial by sedimentation, poor water quality (e.g., low dissolved oxygen), recruitment failure, and high post-settlement mortality from predation, bioeroders, and disease (Powers et al., 2009; Carnegie and Burreson, 2011; Dunn et al., 2014).
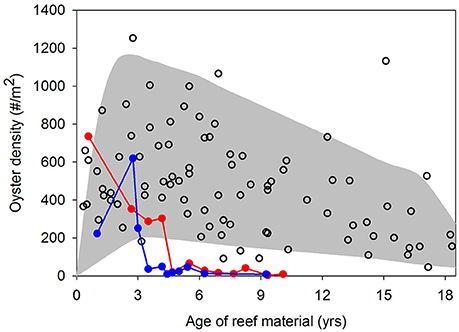
Figure 1. Mean oyster density as a function of age of restored reefs in 10 oyster sanctuaries sampled by the North Carolina Division of Marine Fisheries from 2007 to 2014 (NC DMF, unpublished data). The filled area provides general maximum and minimum density trends across reef ages and open circles are actual observations. Closed circle lines represent two instances where oyster densities in sanctuaries collapsed. See Figure 2 (closed squares) for sanctuary locations in Pamlico Sound, NC USA.
Site selection for oyster restoration is often based, in part, on locations where oysters were historically abundant (e.g., maps created in the later 1,800 s). Substantial changes to estuarine ecosystems over time may preclude the usefulness of historical records for present-day site selection (Jackson et al., 2001). More recently, HSI models have been developed to inform the oyster restoration site selection process (Soniat and Brody, 1988; Mann and Evans, 2004; Barnes et al., 2007; Starke et al., 2011; Beseres Pollack et al., 2012; Linhoss et al., 2016; Theuerkauf and Lipcius, 2016). These models have included many factors relevant to oyster biology and subsidence of artificial reefs, such as salinity and sediment type. However, these models have generally not included larval dispersal relevant to recruitment dynamics and population persistence (but see ElsaBer et al., 2013), permitting factors relevant to restoration permit acquisition, or logistical factors relevant to material deployment and public access. Furthermore, validation is often absent from HSI models for oyster restoration and where present, is generally based on a single year of data (e.g., density or production Soniat and Brody, 1988; Cho et al., 2012; Theuerkauf and Lipcius, 2016), which may not reflect long-term population persistence.
In this study, we developed and validated a HSI model for restoration of eastern oyster reefs and applied the model to guide restoration efforts in Pamlico Sound, North Carolina, USA. Specifically, we: (1) convened stakeholder meetings to identify model inputs and their relative importance to oyster restoration, (2) used a GIS-based modeling approach to integrate 17 physical, biological, permitting, and logistical factors to identify optimal locations for habitat restoration that maximize persistence of oyster populations on restored reefs, (3) assessed HSI sensitivity to several factors, and (4) validated the model output with existing oyster restoration sites using oyster density normalized by the age of restored reefs. We further compared output of the HSI with a comprehensive map of historic oyster reef distribution derived from Lt. Francis E. Winslow's 1886–1887 survey of subtidal oyster reefs in Pamlico Sound (Winslow, 1889, hereafter referred to as the Winslow survey).
Materials and Methods
Study Species
The general biphasic life history of the eastern oyster (C. virginica) with sessile adults and a dispersive pelagic larval stage is similar to that of many marine benthic invertebrates, making them an ideal model species for developing and refining restoration strategies. Along the east and gulf coasts of the USA, the native oyster is an ecologically- and economically-important species at historic population lows (Beck et al., 2011). Eastern oysters are protandrous hermaphrodites that spawn gametes into the water column where eggs are fertilized and subsequently develop during their 10–30 day pelagic larval duration (Kennedy et al., 1996 and references therein). Competent larvae seek a solid surface for settlement. Newly settled oyster (spat) remain as permanently attached epibenthic organisms.
Study System
The Croatan-Albemarle-Pamlico-Estuarine System (CAPES) is the largest lagoonal system and second largest estuarine system in the U.S., covering an area of ~6,600 km2 (Epperly and Ross, 1986; Luettich et al., 2002). Pamlico Sound, the largest component of the CAPES (~120 × 40 km), is shallow with a mean depth of ~4.5 m and well-mixed water body that is separated from the Atlantic Ocean by the “Outer Banks” barrier island chain (Figure 2). The high primary productivity, relatively stable salinities and low tidal amplitude characteristic of Pamlico Sound provide ideal nursery habitat for many estuarine-dependent finfish and shellfish populations (Epperly and Ross, 1986; Paerl et al., 2001; Eggleston et al., 2010).
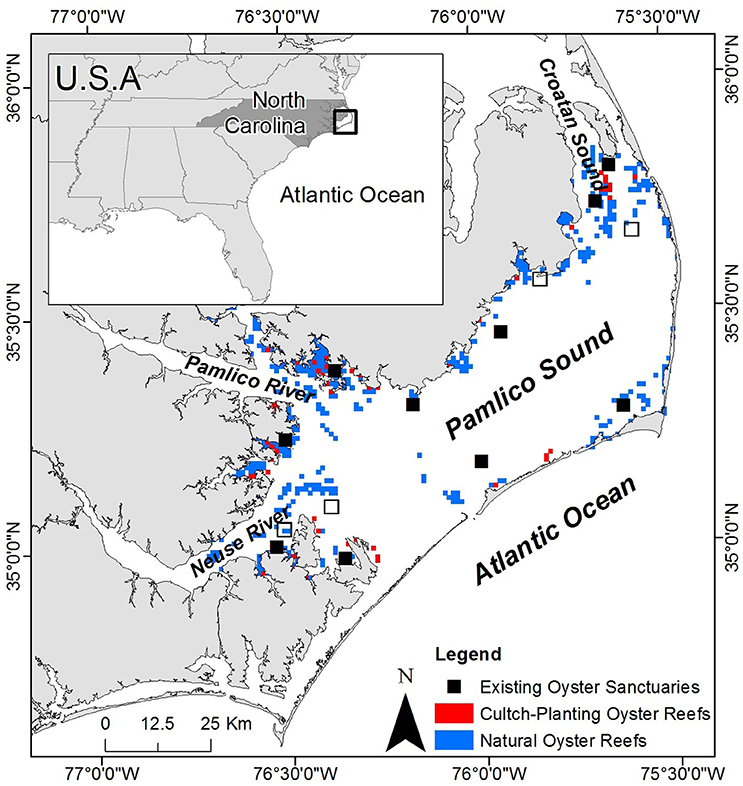
Figure 2. Map of study system including Pamlico Sound, Croatan Sound, and Neuse and Pamlico Rivers. The locations of existing oyster sanctuaries are depicted by black squares including the 10 sanctuaries used for model validation (closed squares), as well as recently constructed sanctuaries (open squares). The locations of cultch-planting oyster reefs and natural oyster reefs are depicted by red and blue squares, respectively. Sanctuaries and reefs not to scale.
Subtidal oyster reefs, a once prevalent benthic habitat in Pamlico Sound, are believed to cover ~1–10% of their historical footprint (Beck et al., 2011). Attempts to restore oyster populations have generally involved three distinct strategies: (1) stock enhancement, the hatchery-production and subsequent “planting” of juveniles in the wild, (2) cultch-planting, the deployment of a thin veneer of oyster shell to replace shell (i.e., settlement substrate) removed through commercial oyster harvest to promote colonization by larval oysters, and (3) no-harvest sanctuaries, the designation of areas protected from harvest within which, large high-relief artificial reefs are constructed to provide settlement substrate (Coen and Luckenbach, 2000; Laing et al., 2006; Paynter et al., 2010; Peters et al., 2017). This study focuses on identifying optimal locations for no-harvest sanctuaries in a manner that is complementary to the existing sanctuaries in Pamlico Sound, with the goal of designing a sanctuary network that functions as a self-persistent metapopulation capable of providing larval subsides to commercially harvested oyster reefs (Puckett and Eggleston, 2016).
Previous research within the existing oyster sanctuaries in Pamlico Sound has highlighted the spatial variability in oyster density and demographic rates among sanctuaries (Mroch et al., 2012; Figure 1; Powers et al., 2009; Puckett and Eggleston, 2012). At 2 of the 10 sanctuaries with multiple (5+) years of density data, oyster populations have declined precipitously after initial population booms (Figure 1). Population collapses and the wide range of observed densities in sanctuaries suggest that identification of suitable restoration locations that are likely to promote population persistence is essential. Oyster larval dispersal simulations have suggested that local retention of larvae within sanctuaries and larval connectivity among sanctuaries is highly variable, and generally minimal (Puckett et al., 2014). Consequently, some sanctuaries functioned as population sources, others as population sinks, and the sanctuary network was likely incapable of functioning as a self-persistent metapopulation (Haase et al., 2012; Puckett et al., 2014; Puckett and Eggleston, 2016). Larval exchange between: (1) no-harvest sanctuaries, (2) restored and harvested cultch-planting reefs, and (3) non-restored and harvested “natural” reefs is likely an important recruitment subsidy for sanctuaries (S. J. Theuerkauf, unpubl. data). Hence, larval dispersal from all reef-types within the overall oyster metapopulation should be considered in the development of a HSI model.
Model Development
We engaged a 12-person stakeholder group to co-develop the HSI model. The stakeholder group consisted of state and federal resource managers (North Carolina Division of Marine Fisheries, Army Corps of Engineers), restoration practitioners (North Carolina Coastal Federation and The Nature Conservancy), and academics (North Carolina State University, University of North Carolina at Chapel Hill, and University of North Carolina at Wilmington). We convened six stakeholder meetings to: (1) identify factors relevant to oyster restoration, (2) assess and quantify the relative importance of these factors to long-term oyster restoration success (i.e., population persistence), and (3) iteratively refine #1 and #2 upon reviewing draft versions of the model. Ultimately, the stakeholder group identified 17 factors that were included in the model. These factors represented biological, physical, permitting, and logistical considerations relevant to oyster populations and habitat restoration.
Using ArcMap 10.3 (ESRI, 2016), we assembled a layer for each of the 17 factors (Table 1). Each layer was projected onto the grid of Pamlico Sound consisting of 5,987 1 km × 1 km (1 km2) cells covering the waters of Pamlico Sound. The grid matched the spatial extent of the hydrodynamic and particle tracking modeling grid used to simulate oyster larval dispersal (see below; Puckett et al., 2014). Each grid cell contained a “value” for each layer. Based on stakeholder input, we divided layers into “threshold” and “exclusion” categories. Threshold layers were scored based on thresholds values and weightings. For example, salinity was a threshold layer whereby the optimal long-term average salinity threshold was 10–15 (assigned a threshold value of 1), the suitable salinity threshold was from 5–10 or 15–25 (assigned a threshold value of 0.5), and the unsuitable salinity threshold was <5 or >25 (assigned a threshold value of 0). The relative importance of each threshold layer to siting oyster sanctuaries was quantified by assigning a weight to each layer (higher weight = more important). Exclusion layers were scored on a binary, 0 or 1, scale and used to exclude unsuitable sites. For example, bathymetry was an exclusion layer because a grid cell was either of sufficient depth to provide safe navigational clearance over artificial oyster reefs (assigned exclusion value of 1), or the cell was excluded (assigned exclusion value of 0) because the reefs could pose a potential navigational hazard, and permits to conduct the restoration would not be approved.
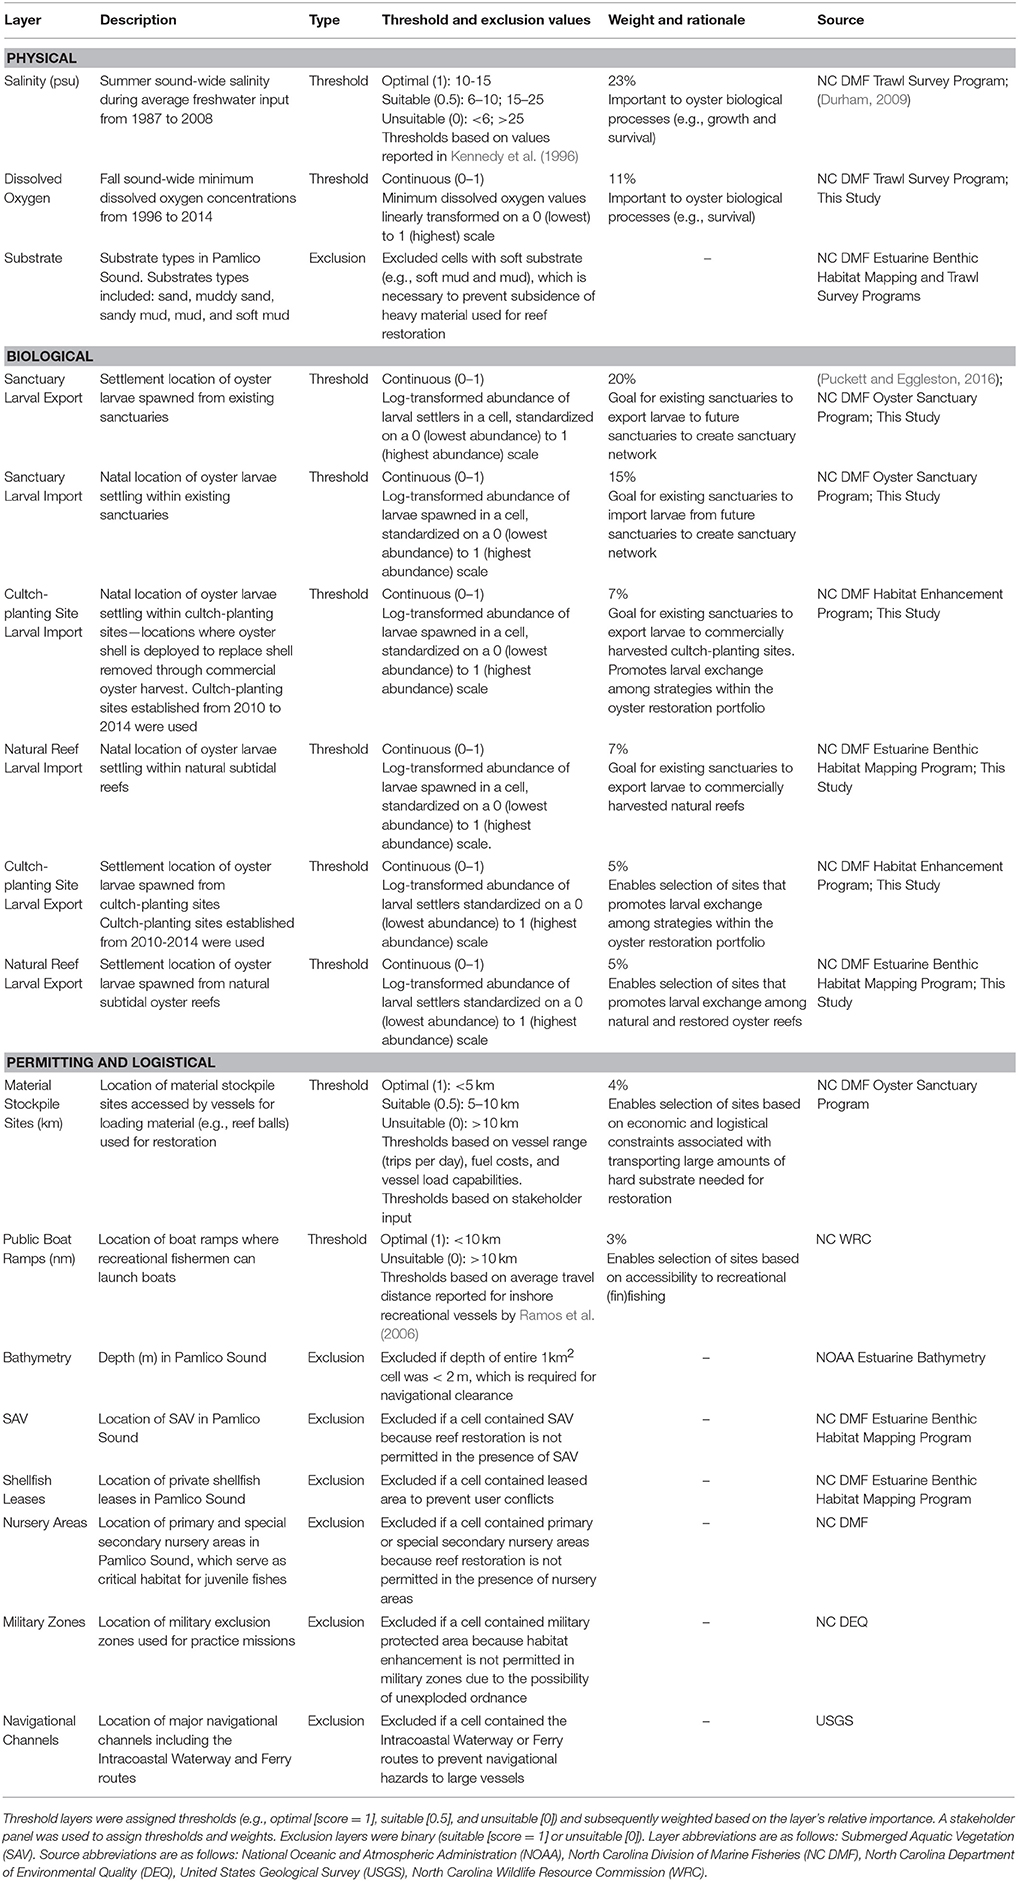
Table 1. List of 17 GIS layers used in determining suitability of sites in Pamlico Sound for placement of oyster sanctuaries.
Threshold values and weights, as well as exclusion layer cutoffs were determined through literature reviews, stakeholder input, and regulatory statutes. Stakeholders were asked to assign thresholds for certain layers (e.g., distance to material stockpile sites; Table 1), as well as weights for all threshold layers. Stakeholders anonymously and independently weighed each threshold layer based on their perceived importance of that layer for oyster restoration and their confidence in the accuracy of the data underlying each layer. The average of these weights was used to assign threshold layer weights such that the weight of all threshold layers summed to 100%. We also ran model simulations where all layers were weighted equally (see Model Sensitivity below). Information used to define exclusion criteria was based on rules and regulations pertaining to restoration permitting, which were identified with the assistance of the stakeholder group. The integration of stakeholder input on layer thresholds, weights, and criteria was evaluated by North Carolina State University's Institutional Review Board Office, which concluded that “… this was not human research” because “… the information that was collected was not about the participants nor did it manipulate their environment.”
Model Calculation
Using the GIS-raster calculator, the suitability of each cell (Sj) for siting oyster sanctuaries was calculated in a two-step process as:
where Cj is the cumulative value of cell j calculated as the product of the threshold value L of cell j in threshold layer x and the weight W of layer x summed across all 10 threshold layers, and Ej is the binary (0 or 1) score for cell j based on the product of all 7 binary exclusion layers. On a scale of 0 to 1, cell suitability scores for oyster sanctuaries were ranked from highest (most suitable) to lowest (least suitable).
Model Sensitivity
To determine the sensitivity of the model to individual layers, we: (1) sequentially removed the four threshold layers with the highest weight (i.e., salinity-23%, sanctuary larval export-20%, sanctuary larval import-15%, and dissolved oxygen-11%), (2) re-weighted the remaining layers proportionally based on the weight of the removed layer, (3) re-ran the model, and (4) calculated the percent change in suitability of each cell (Sj) with removal of each layer. To determine the sensitivity of the model to our weightings, we ran the model with equal weightings for each of the 10 threshold layers. We visually compared output from the full, stakeholder-weighted model with the null, equally-weighted model to qualitatively determine how weighting threshold layers impacted model output.
Model Validation
We conducted an ad-hoc model validation by comparing predicted HSI with a multi-year, empirically-based biological measure of persistence of restored oyster reefs within 10 sanctuaries distributed throughout Pamlico Sound (closed squares in Figure 2). For validation purposes, HSI for each sanctuary was calculated using only the 10 threshold layers (Table 1) because the exclusion layers were generally more relevant to regulations than biological measures of persistence. Oyster density, normalized by reef age was used for model validation. To calculate normalized density, average oyster density at each sanctuary from 2007–2014, was multiplied by the mean age of artificial reefs surveyed within each sanctuary. Density data and reef age data were obtained from NCDMF. We normalized oyster density by reef age to account for general observed patterns of rapid increases in oyster density soon after artificial reef creation, followed by declines in oyster density (and even complete collapse at certain reefs) over time as restored reefs age (Figure 1). Higher values of normalized density are indicative of high oyster densities that have persisted over time. The value of such an index is that oyster density and date of restoration are parameters that are routinely collected for restoration projects, therefore, the index can be easily calculated from available data.
To determine the form of the relationship between HSI and normalized oyster density, we used a global curve fitting program (Systat, 2007) to fit linear, exponential, quadratic and sigmoid functions to the relationships based on functions selected in previous HSI studies (Soniat and Brody, 1988; Reiley et al., 2014; Theuerkauf and Lipcius, 2016). Akaike Information Criterion (second-order bias correction estimator, AICc) was used to verify the best fitting model of the four possible functions.
Results
Model Development
The stakeholder group identified seven exclusion layers and 10 threshold layers that were included in the final HSI model. A complete list of all layers, layer classifications, and layer details can be found in Table 1 and Appendices 1, 2 (Supplementary Materials). The threshold layers included in the model underwent significant modifications throughout stakeholder meetings. Only four of the threshold layers initially identified by stakeholders—sanctuary larval export, salinity, material stockpile sites, and public boat ramps—were included in the final model. These four layers were two of the highest and two of the lowest weighted threshold layers in the model. Average layer weightings of the 10 layers included in the final model ranged from 23 ± 3% (SE) for salinity to 3 ± 1% (SE) for boat ramps (Table 1). Four of the ten threshold layers—salinity, sanctuary larval export, sanctuary larval import, and dissolved oxygen—had a combined weighting of 69% and were the primary drivers of modeled suitability.
Model Output
Threshold Layers
Optimal salinities of 10–15 (Kennedy et al., 1996) were generally located in the southwestern and northern portions of Pamlico Sound proximal to riverine input and far from oceanic inlets (Figure 3A). The greatest export of larvae from the existing sanctuaries (Figure 3B) generally overlapped with locations of optimal salinity, as well as locations of cultch-planting and natural reefs (Figure 2), indicating that the sanctuaries may be functioning as originally intended—a broodstock providing a larval subsidy for commercially harvested oyster reefs. The natal locations of larvae immigrating into the existing sanctuaries were generally associated with locations of sanctuaries, cultch-planting sites, and natural reefs, suggesting that oyster reefs in Pamlico Sound, both restored and natural, function as a connected metapopulation (Appendix 1A in Supplementary Materials). The highest dissolved oxygen concentrations were generally located proximal to oceanic inlets and far from nutrient rich riverine input (i.e., opposite of optimal salinity; Appendix 1B in Supplementary Materials).
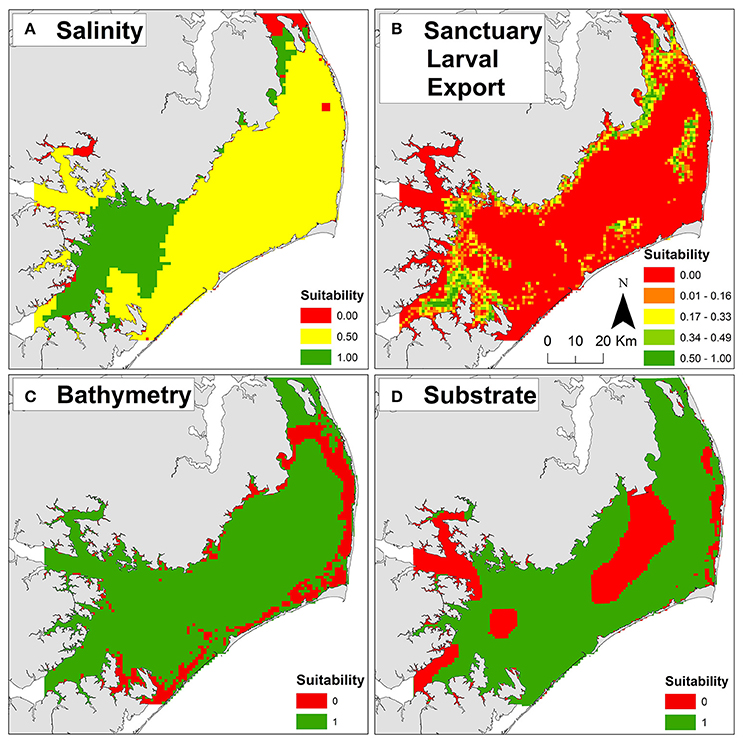
Figure 3. Example threshold and exclusion layers used to compute habitat suitability for oyster sanctuary restoration. (A) Salinity threshold layer. (B) Sanctuary larval export threshold layer. (C) Bathymetry exclusion layer. (D) Substrate exclusion layer. Suitability scores of zero (red) are unsuitable and one (green) are optimal for each layer. For additional layer details, see Table 1 and Appendices 1, 2 in Supplementary Materials.
Integration of the 10 threshold layers yielded oyster sanctuary HSI values ranging from 0.04 to 0.69. Optimal habitat for oyster sanctuaries, defined as the top 1% of HSI values (range = 0.54–0.69) covered 60 km2 (1%) of Pamlico Sound and was predominately located in the southwestern (mouth of Neuse and Pamlico Rivers and bays) and northwestern portions of Pamlico Sound (Figure 4A) where salinity was optimal (Figure 3A) and sanctuary larval export was highest (Figure 3B). An additional 539 km2 (8.9%) was suitable for oyster sanctuaries, defined as the top 10% of HSI values (range = 0.43–0.53). The majority of Pamlico Sound (90.1%; 5,388 km2) was only marginally suitable, defined as the lower 90% of HSI values (range = 0.04–0.42).
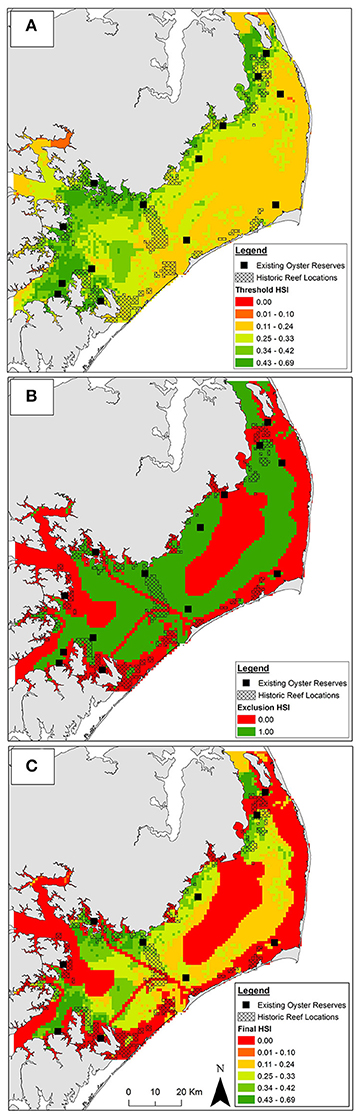
Figure 4. Habitat suitability from (A) aggregated threshold layers, (B) aggregated exclusion layers, and (C) aggregated exclusion and threshold layers combined. In panels (A,C) suitability is represented by a continuous habitat suitability index (HSI). Suitability in panel (B) is binary. Suitability increases from low (red) to high (green) HSI. Existing oyster sanctuaries used for model validation depicted by black squares (not to scale). Location of historic oyster reefs depicted by black crosshatch.
Exclusion Layers
Unsuitable cells were concentrated near shore due to depth limitations (Figure 3C) and presence of submerged aquatic vegetation (Appendix 2A in Supplementary Materials), and in central Pamlico Sound and Rivers due to unsuitable substrate (e.g., soft silt and sandy silt; Figure 2D). Based on the seven exclusion layers, 56% (3,357 km2) of Pamlico Sound and adjacent tributaries were unsuitable for siting oyster sanctuaries (Figure 4B).
Threshold + Exclusion Layers
By combining the aggregated exclusion and threshold layers, 53% (32 km2) and 50% (294 km2) of optimal and suitable habitat, respectively was reclassified as unsuitable (Figure 4A vs. Figure 4C). Only a small portion (18%) of historical reefs coincided with optimal and suitable habitat as identified by threshold layers (Figure 4A), and an even smaller portion of historic reefs (8%) coincided with optimal and suitable habitat when exclusion layers were included (Figure 4C).
Model Sensitivity
The full, stakeholder-weighted model was generally most sensitive to layers in order of their weightings. The percent change in HSI averaged among all grid cells was 32.9 ± 0.2% SE with the removal of the salinity layer (weighted at 23%) and 22.4% ± 0.2% SE with removal of the oyster larval export layer (weighted at 20%; Figure 5). The null, equally-weighted model was most sensitive to removal of the dissolved oxygen layer, followed by salinity, sanctuary larval import, and sanctuary larval export (Figure 5). The null, equally-weighted model was less selective than the full model. The null model was characterized by a unimodal distribution of HSI values and limited clustering of optimal restoration locations, whereas the full model had a bimodal distribution of HSI values and greater clustering of optimal locations.
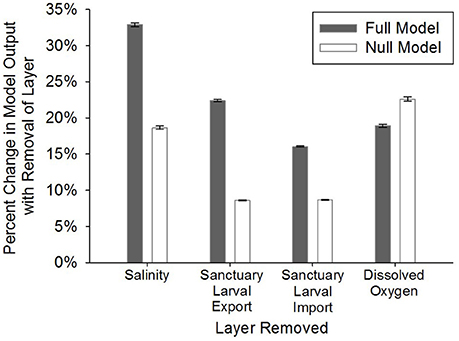
Figure 5. Model sensitivity analysis where: (1) the four layers with the highest weights (full, stakeholder-weighted model; “Full Model”) were individually removed, (2) the remaining layers were proportionally re-weighted based on the weight of the removed layer, and (3) the percent change in model output was calculated on a cell-by-cell basis for removal of each layer. The same process was followed in the null, equally-weighted model (“Null Model”). Error bars represent standard error of the mean.
Model Validation
HSI values at 10 existing sanctuaries (closed squares in Figure 2) ranged from 0.26 to 0.66. Mean oyster density within sanctuaries ranged from 156 ± 65 to 809 ± 158 m−2 on restored reefs ranging in age from 1.8 ± 0.6 to 11.9 ± 1.3 years. The index of normalized density, the product of mean oyster density and age of artificial reefs within each sanctuary, ranged from 529 to 6,186. Normalized density increased exponentially as a function of HSI [F(1, 8) = 9.8; p = 0.01; Figure 6].
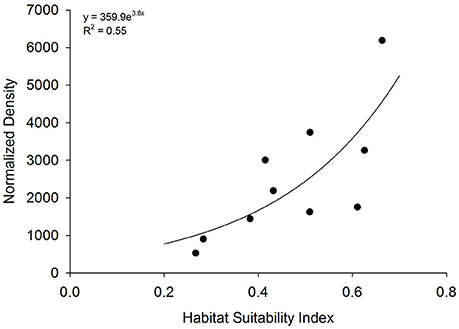
Figure 6. Model validation. Relationship between habitat suitability index (HSI) at 10 existing oyster sanctuaries and normalized density. Normalized density is the product of mean 5-year oyster density and age of artificial reefs within each sanctuary.
Discussion
Habitat suitability indices offer objective, spatially-explicit, and quantitative guidance for ecological restoration by integrating multiple factors relevant to restoration success (Roloff and Kernohan, 1999). In this study, we developed and validated a GIS-based HSI for restoration of subtidal oyster reefs. The HSI model included 17 factors spanning biological, physical, permitting, and logistical considerations relevant to successful oyster restoration, which we defined as restoration of persistent oyster populations. This modeling approach provided a quantitative scale over which a vast water body (~6,000 km2) was narrowed down by 95% to a much smaller suite of optimal and suitable locations for oyster restoration. No location was optimal across all factors (i.e., HSI < 1) suggesting that there are risks and tradeoffs that must be considered when restoring oysters anywhere within the system (for tradeoffs see Theuerkauf et al., in review). The most suitable restoration locations tended to be clustered regionally, which we interpreted as restoration “hot spots” that should be focal areas for future oyster sanctuary restoration efforts in Pamlico Sound. While the model developed herein was specific to restoration of high-relief subtidal oyster reefs protected from harvest (i.e., sanctuaries) in Pamlico Sound, the framework and approach are broadly applicable to other estuarine systems and benthic organisms. Our key contributions included: (1) incorporation of expert stakeholder knowledge and feedback throughout model development, (2) integration of novel biological (e.g., larval dispersal) and logistical (e.g., proximity to restoration material stockpiles) factors rarely included in HSI models applied in marine systems, (3) quantitative sensitivity analysis of the full, stakeholder-weighted and null, equally-weighted versions of the model, (4) independent validation of the HSI using multi-year oyster density data from existing oyster sanctuaries, and (5) qualitative comparison of HSI output with a comprehensive map of historic oyster reef distributions from the late 1800's (Winslow, 1889).
Effective selection and integration of factors relevant to marine spatial planning, such as site selection for large-scale restoration (i.e., artificial reefs), can benefit greatly from engagement with diverse stakeholders (Gopnik et al., 2012). The stakeholder-driven, co-development process we used greatly improved the model. For instance, we may not have divided layers into threshold and exclusion categories without stakeholder input. Yet, this layer bifurcation turned out to be critical in meeting the preferences of different potential user groups. Resource managers were most interested in identifying optimal sites from a biological and logistical perspective (i.e., suitability based only on threshold layers; Figure 4A), followed by their own rigorous ground-truthing of potential suitable sites to identify any issues related to exclusion layers (e.g., SAV surveys, bathymetry, sediment type). In this case, we were able to “toggle off” the exclusion layers. In contrast, the restoration practitioners preferred a combination of both layer categories so that biological and logistical considerations were included along with potential permitting conflicts (Figure 4C). The stakeholder engagement process and incorporation of different stakeholder needs was critical for getting “buy-in” to the modeling approach and adoption of the tool for use. The model is currently being used to inform oyster sanctuary restoration plans by the North Carolina Division of Marine Fisheries and North Carolina Coastal Federation. Additionally, the model is publicly accessible on The Nature Conservancy's “Coastal Resilience North Carolina Restoration Explorer” web-based mapping platform (TNC, 2017).
Oyster habitat suitability models are generally developed with a focus on physical factors such as salinity, substrate type, and water depth (Theuerkauf and Lipcius, 2016 and references therein). We included these core factors within our model with substrate type and water depth being binary exclusion layers, and salinity being the highest weighted threshold layer in the model due to its importance in several oyster biological processes (Kennedy et al., 1996). We also included several novel biological (e.g., larval dispersal) and logistical (e.g., proximity to restoration material stockpiles, distance to boat ramps) factors not previously considered in oyster HSI models. Larval dispersal, connectivity, and recruitment are fundamental to marine (meta)population dynamics (Kritzer and Sale, 2004; Cowen et al., 2007) and, therefore are important to consider for restoring marine (meta)populations (Kim et al., 2013). Larval dispersal was included in two ways within our HSI to identify: (1) locations where larval settlement (and presumably recruitment) exported from sanctuaries, cultch-planting reefs, and natural oyster reefs was greatest and (2) locations where larval import to these different reef types was greatest. Information on larval export from existing reefs is important for restoring reefs where they are likely to receive a recruitment subsidy. Consistent recruitment at restored reefs is critical for population persistence at the restored site. Information on larval import to existing reefs is important for restoring reefs where they are likely to subsidize existing reefs, which is an important function of oyster sanctuaries where subsidizing commercially harvested cultch-planted sites and natural reefs is a primary goal. Information on larval import may also assist in siting restoration efforts to benefit reefs that may be recruitment limited. Siting restored reefs in locations that maximize both larval import and export is critical for promoting metapopulation persistence (Hastings and Botsford, 2006).
Ecological restoration is expensive and often relies on public support through taxpayer funding (Holl and Howarth, 2000). Accordingly, restoration practices should consider factors that reduce costs and accommodate, to the extent practical, human needs (Weinstein, 2007). In marine systems, restoration projects often require large vessels equipped with heavy machinery to deploy materials such as limestone marl and concrete for artificial reef construction. Minimizing the distance between material stockpile sites and restoration locations can provide significant cost-savings in fuel, vessel time, and personnel time. Accounting for human needs such as public access to restoration sites (e.g., hook and line fishing on restored oyster reefs), is also prudent for developing public support for restoration (Holl and Howarth, 2000). We used distance from public boat ramps as a simple proxy for the potential for the public to access sites (Ramos et al., 2006). Both “logistical” layers were weighted relatively low by the stakeholder group. Low weights were due partly to stakeholder's preference to prioritize more biologically-relevant layers, but also due to the paucity of data supporting thresholds established for layers such as distance from boat ramps. Nevertheless, the model framework provides the flexibility to change layer weights should restoration priorities shift or better data become available. Future HSI models should consider integration of factors such as human population density, mean income, willingness to pay, and surveillance costs to more fully capture important socioeconomic considerations of restoration.
Sensitivity analyses are a useful way to identify factors that disproportionately influence model output. In the full, stakeholder-weighted model, sensitivity was generally a function of layer weight whereby model output was most sensitive to layers with the highest weight. Model output in the null, equally-weighted model was most sensitive to layers characterized by: (1) threshold values that were highly variable spatially (i.e., patchy) across the model system and (2) a small proportion of cells with threshold values = 0 (i.e., unsuitable). For instance, the null model was more sensitive to the dissolved oxygen layer than the salinity layer due to greater spatial variability and patchiness in threshold values over the model domain in the dissolved oxygen layer (Appendix 1B in Supplementary Materials vs. Figure 3A). In contrast, the model was more sensitive to the salinity layer then either sanctuary larval import or export layer despite greater spatial variability of threshold values in the dispersal layers relative to the salinity layer (Figure 3B vs. Figure 3A). In both sanctuary larval dispersal layers, the threshold values for a majority of the cells were 0 (i.e., indicative of no larval import or export from a given cell) and removing those layers from the model would have less impact on model output than removing the salinity layer where threshold values of very few cells = 0. Thus, acquisition of accurate spatial information for factors that are: (1) important in determining suitability (i.e., heavily weighted), (2) likely to be highly variable in space, and (3) likely to have minimal amounts of unsuitable area for the species of interest should be prioritized when developing future HSI models.
Validating HSI model predictions with appropriate data is critical for assessing model performance (Roloff and Kernohan, 1999). In this study, we used oyster density normalized by reef age for model validation. The utility of an index of normalized density is several-fold: (1) ease of calculation based on values that are often known (i.e., age of restoration) and values that are often collected post-monitoring (i.e., density Powers et al., 2009; Baggett et al., 2015), (2) ability to account for observed peaks and declines in density over time (e.g., Figure 1), and (3) relevance to common density-based restoration targets that can be set over a time period (i.e., 100 oyster m−2 over a 20 year period = normalized density of 2000). Normalized density was a statistically-significant exponential function of HSI, providing validity of the HSI as a robust predictor of suitable habitat for oyster sanctuary restoration in Pamlico Sound. Positive relationships between indices of abundance and HSI have been identified previously in validation studies, but the relationships have generally been linear or sigmoidal (Cho et al., 2012; Reiley et al., 2014; Theuerkauf and Lipcius, 2016). The exponential relationship between HSI and normalized density can be used, through inverse calculations, to determine HSI values needed to reach restoration targets (i.e., target normalized density of 2,000 generally occurs at HSI values > 0.45). Moreover, the exponential relationship suggests that proper siting of restoration is critical since relatively small changes in habitat suitability may yield substantial increases in oyster density over time.
Historic surveys of oyster reefs beginning in the late 1800's have provided useful baselines of reef location and extent (Zu Ermgassen et al., 2012). These historic baselines have often been used to guide restoration targets and site selection (Lipcius et al., 2015), although we speculate this approach may be misguided where changes in estuarine systems have altered the distribution of suitable habitat (Jackson et al., 2001). Based on the Winslow (1889) survey, only a small percentage (<20%) of historic oyster reef distribution was located in present-day suitable habitat predicted by the HSI model (based only on threshold layers; Figure 4A). If we consider both threshold and exclusion layers, the distribution of an even smaller portion of historic reefs (<10%) overlapped with present-day predictions of suitable habitat (Figure 4C). Mismatches between the distribution of historic subtidal oyster reefs and predictions of suitable habitat for oyster sanctuary restoration as identified by the HSI could be due to: (1) changes in salinity patterns from opening and closing of inlets (Mallinson et al., 2008), (2) increases in hypoxia and anoxia affecting the tributaries and sub-estuaries of Pamlico Sound (Paerl et al., 1998; Buzzelli et al., 2002; Bell and Eggleston, 2005), (3) changes in sedimentation and geomorphology (e.g., shifting of shoals Roelofs and Bumpus, 1953; Paerl et al., 2001), (4) reductions in the historical abundance of oysters in Pamlico Sound and the associated decrease in the number and spatial coverage of dispersing larvae, and (5) discrepancies in the scope of the HSI model (i.e., siting oyster sanctuaries) and the historic data being used for comparison (natural subtidal oyster reefs). For these reasons, including historic locations of oyster reefs as a factor in an HSI model may be problematic. Still, comparing the location of predicted suitable locations from an HSI with locations that were presumably suitable habitat historically can be informative. Areas of overlap between predicted suitable habitat and historic suitable habitat may be indicative of long-term stability in an area and, therefore, ideal areas for restoration. Moreover, locations of historic reefs could serve as a “tiebreaker” between multiple locations with similar HSI values.
The modeling approach used in this study was extensive and required highly specialized skills in a number of technical disciplines, but several important caveats are worth noting. We were unable to include factors that captured ecological processes and rates, such as food availability (e.g., plankton for oysters, but see Theuerkauf et al., in review), prevalence of disease, or post-settlement demographics (e.g., growth and survival). The larval dispersal factors did not include spatial variability in fecundity, despite evidence that fecundity can vary widely over space in the model system (Mroch et al., 2012). As such, the larval import and export layers depicted “potential” rather than “realized” dispersal, which can have important implications on connectivity (Watson et al., 2010). We assumed that a higher concentration of larvae was more suitable for the larval dispersal factors, yet we know very little about biologically optimal levels of larval settlement in this system with some evidence of density dependence (Puckett and Eggleston, 2012). Certain factors such as dissolved oxygen and substrate were interpolated from point data for projection onto the model grid yielding uncertainty in the precision of interpolated values across the model domain, although these factors were interpolated using 500+ points and 10+ years of data (Appendices 1, 2 in Supplementary Materials). Factors were depicted as static layers. Static layers do not automatically update as reefs are added to (e.g., restoration) or removed from (e.g., failed restoration or commercial harvest) the system. Static layers also preclude integrating the impacts of a changing climate (e.g., sea level rise and new inlet formation on salinity regime) on long-term restoration planning. Lastly, we validated the model with data on oyster density, but recognize that density does not necessarily reflect population persistence. Data on size structure, as well as demographic rates such as fecundity, growth, and survival would also be useful data to include in model validation.
As ecological restoration and the availability of spatial datasets for relevant environmental factors continue to proliferate, HSI models will play an increasingly important role in the restoration planning and implementation process. We developed a HSI to guide restoration efforts in areas that were most likely to maximize the goal of restoring persistent oyster populations. The HSI model framework and validation developed in this study can be adapted to other systems, as well as previously developed HSIs to enhance the efficacy of oyster restoration. Models can build on and complement this approach by developing a HSI to maximize important ecosystem services oyster provide such as water filtration (Theuerkauf et al., in review) and fish production. Locations that meet multiple restoration goals simultaneously, such as maximizing population persistence and ecosystem service provision may be justified as restoration priorities. We contend, as have others (e.g., Olds et al., 2016), that stronger linkages between larval connectivity, landscape ecology, stakeholder engagement and spatial planning within HSI models can improve restoration efforts in marine systems by replacing the pervasive piecemeal, ad-hoc approach to restoration with a more holistic, unified approach.
Author Contributions
All authors listed have made a substantial, direct and intellectual contribution to the work, and approved it for publication.
Conflict of Interest Statement
The authors declare that the research was conducted in the absence of any commercial or financial relationships that could be construed as a potential conflict of interest.
The handling Editor declared a past co-authorship with the authors BP and ST.
Acknowledgments
We thank the North Carolina Division of Marine Fisheries, North Carolina Department of Environmental Quality, North Carolina Wildlife Resource Commission, National Oceanic and Atmospheric Administration, and United States Geological Survey for providing datasets used in this study. We thank Troy Alphin, Brian Boutin, Jan DeBlieu, Erin Fleckenstein, Pelle Holmlund, Niels Lindquist, Aaron McCall, Steve Murphey, Stopher Slade, Lexia Weaver, Curt Weychert, and Chuck Wilson for providing expert stakeholder input during model development. We also thank X reviewers for helpful comments that improved the manuscript. Funding for this project was provided by the North Carolina Coastal Recreational Fishing License Program (Grant No. 2010-H-004), North Carolina Sea Grant (R12-HCE-2) and the National Science Foundation (OCE-1155609) to DE. Additional funding was provided by a North Carolina Sea Grant and North Carolina Space Grant Fellowship, a National Defense Science and Engineering Graduate Fellowship (contract FA9550-11- C-0028 awarded by the Department of Defense, Air Force Office of Scientific Research, 32 CFR 168a), a North Carolina Coastal Conservation Association Scholarship, and a Beneath the Sea Foundation Scholarship to ST.
Supplementary Material
The Supplementary Material for this article can be found online at: https://www.frontiersin.org/articles/10.3389/fmars.2018.00076/full#supplementary-material
References
Aronson, J., and Alexander, S. (2013). Ecosystem restoration is now a global priority: time to roll up our sleeves. Restor. Ecol. 21, 293–296. doi: 10.1111/rec.12011
Baggett, L. P., Powers, S. P., Brumbaugh, R. D., Coen, L. D., Deangelis, B. M., Greene, J. K., et al. (2015). Guidelines for evaluating performance of oyster habitat restoration. Restor. Ecol. 23, 737–745. doi: 10.1111/rec.12262
Barnes, T. K., Volety, A. K., Chartier, K., Mazzotti, F. J., and Pearlstine, L. (2007). A habitat suitability index model for the eastern oyster (Crassostrea virginica), a tool for restoration of the Caloosahatchee Estuary, Florida. J. Shellfish Res. 26, 949–959. doi: 10.2983/0730-8000(2007)26[949:AHSIMF]2.0.CO;2
Beck, M. W., Brumbaugh, R. D., Airoldi, L., Carranza, A., Coen, L. D., Crawford, C., et al. (2011). Oyster reefs at risk and recommendations for conservation, restoration, and management. Bioscience 61, 107–116. doi: 10.1525/bio.2011.61.2.5
Bell, G. W., and Eggleston, D. B. (2005). Species-specific avoidance responses by blue crabs and fish to chronic and episodic hypoxia. Mar. Biol. 146, 761–770. doi: 10.1007/s00227-004-1483-7
Bell, S. S., Fonseca, M. S., and Motten, L. B. (1997). Linking restoration and landscape ecology. Restor. Ecol. 5, 318–323. doi: 10.1046/j.1526-100X.1997.00545.x
Beseres Pollack, J., Cleveland, A., Palmer, T. A., Reisinger, A. S., and Montagna, P. A. (2012). A restoration suitability index model for the Eastern Oyster (Crassostrea virginica) in the mission-aransas estuary, TX, USA. PLoS ONE 7:e40839. doi: 10.1371/journal.pone.0040839
Buzzelli, C. P., Luettich, R. A., Powers, S. P., Peterson, C. H., McNinch, J. E., Pinckney, J. L., et al. (2002). Estimating the spatial extent of bottom-water hypoxia and habitat degradation in a shallow estuary. Mar. Ecol. Prog. Ser. 230, 103–112. doi: 10.3354/meps230103
Carnegie, R. B., and Burreson, E. M. (2011). Declining impact of an introduced pathogen: Haplosporidium nelsoni in the oyster Crassostrea virginica in Chesapeake Bay. Mar. Ecol. Prog. Ser. 432, 1–15. doi: 10.3354/meps09221
Cho, Y., Lee, W. C., Hong, S., Kim, H. C., and Kim, J. B. (2012). GIS-based suitable site selection using habitat suitability index for oyster farms in Geoje-Hansan Bay, Korea. Ocean Coast. Manag. 56, 10–16. doi: 10.1016/j.ocecoaman.2011.10.009
Coen, L. D., and Luckenbach, M. W. (2000). Developing success criteria and goals for evaluating oyster reef restoration: ecological function or resource exploitation? Ecol. Eng. 15, 323–343. doi: 10.1016/S0925-8574(00)00084-7
Cowen, R. K., Gawarkiewicz, G., Pineda, J., Thorrold, S. R., and Werner, F. E. (2007). Population connectivity in marine systems: an overview. Oceanography 20, 14–21. doi: 10.5670/oceanog.2007.26
Dunn, R. P., Eggleston, D. B., and Lindquist, N. (2014). Effects of substrate type on demographic rates of Eastern Oyster (Crassostrea virginica). J. Shellfish Res. 33, 177–185. doi: 10.2983/035.033.0117
Durham, C. L. (2009). Spatial Dynamics in an Estuarine System: Modeling Biophysical Components and Interactions to Advance Blue Crab Fishery Management. MS thesis, NC State University, Raleigh, NC. Available online at: http://www.lib.ncsu.edu/resolver/1840.16/758
Eggleston, D. B., Reyns, N. B., Etherington, L. L., Plaia, G. R., and Xie, L. (2010). Tropical storm and environmental forcing on regional blue crab (Callinectes sapidus) settlement. Fish. Oceanogr. 19, 89–106. doi: 10.1111/j.1365-2419.2009.00530.x
ElsaBer, B., Farinas-Franco, J. M., Wilson, C. D., Kregting, L., and Roberts, D. (2013). Identifying optimal sites for natural recovery and restoration of impacted biogenic habitats in a special area of conservation using hydrodynamic and habitat suitability modelling. J. Sea Res. 77, 11–21. doi: 10.1016/j.seares.2012.12.006
Epperly, S. P., and Ross, S. W. (1986). Characterization of the North Carolina Pamlico-Albemarle Estuarine Complex. Beaufort, NC: National Oceanic and Atmospheric Administration.
Gopnik, M., Fieseler, C., Cantral, L., McClellan, K., Pendleton, L., and Crowder, L. (2012). Coming to the table: early stakeholder engagement in marine spatial planning. Mar. Policy 36, 1139–1149. doi: 10.1016/j.marpol.2012.02.012
Grabowski, J. H., Brumbaugh, R. D., Conrad, R. F., Keeler, A. G., James, J., Peterson, C. H., et al. (2012). Economic valuation of ecosystem services provided by oyster reefs. Bioscience 62, 900–909. doi: 10.1525/bio.2012.62.10.10
Haase, A. T., Eggleston, D. B., Luettich, R. A., Weaver, R. J., and Puckett, B. J. (2012). Estuarine circulation and predicted oyster larval dispersal among a network of reserves. Estuar. Coast. Shelf Sci. 101, 33–43. doi: 10.1016/j.ecss.2012.02.011
Hastings, A., and Botsford, L. W. (2006). A simple persistence condition for structured populations. 9, 846–852. doi: 10.1111/j.1461-0248.2006.00940.x
Holl, K. D., and Howarth, R. B. (2000). Paying for restoration. Restor. Ecol. 8, 260–267. doi: 10.1046/j.1526-100x.2000.80037.x
Jackson, J. B., Kirby, M. X., Berger, W. H., Bjorndal, K. A., Botsford, L. W., Bourque, B. J., et al. (2001). Historical overfishing and the recent collapse of coastal ecosystems. Science 293, 629–638. doi: 10.1126/science.1059199
Kennedy, V. S., Newell, R. I. E., and Eble, A. F. (1996). The Eastern Oyster Crassostrea virginica. College Park, MD: Maryland Sea Grant College.
Kim, C. K., Park, K., and Powers, S. P. (2013). Establishing restoration strategy of eastern oyster via a coupled biophysical transport model. Restor. Ecol. 21, 353–362. doi: 10.1111/j.1526-100X.2012.00897.x
Kritzer, J. P., and Sale, P. F. (2004). Metapopulation ecology in the sea: from Levins' model to marine ecology and fisheries science. Fish Fish. 5, 131–140. doi: 10.1111/j.1467-2979.2004.00131.x
La Peyre, M., Furlong, J., Brown, L. A., Piazza, B. P., and Brown, K. (2014). Oyster reef restoration in the northern Gulf of Mexico: extent, methods and outcomes. Ocean Coast. Manag. 89, 20–28. doi: 10.1016/j.ocecoaman.2013.12.002
Laing, I., Walker, P., and Areal, F. (2006). Return of the native: is European oyster (Ostrea edulis) stock restoration in the UK feasible? Aquat. Living Resour. 19, 283–287. doi: 10.1051/alr:2006029
Linhoss, A. C., Camacho, R., and Ashby, S. (2016). Oyster Habitat Suitability in the Northern Gulf of Mexico. J. Shellfish Res. 35, 841–849. doi: 10.2983/035.035.0412
Lipcius, R. N., Burke, R. P., McCulloch, D. N., Schreiber, S. J., Schulte, D. M., Seitz, R. D., et al. (2015). Overcoming restoration paradigms: value of the historical record and metapopulation dynamics in native oyster restoration. Front. Mar. Sci. 2:65. doi: 10.3389/fmars.2015.00065
Lipcius, R. N., Eggleston, D. B., Schreiber, S. J., Seitz, R. D., Shen, J., Sisson, M., et al. (2008). Importance of metapopulation connectivity to restocking and restoration of marine species. Rev. Fish. Sci. 16, 101–110. doi: 10.1080/10641260701812574
Luettich, R. A., Carr, S. D., Reynolds-Fleming, J. V., Fulcher, C. W., and McNinch, J. E. (2002). Semi-diurnal seiching in a shallow, micro-tidal lagoonal estuary. Cont. Shelf Res. 22, 1669–1681. doi: 10.1016/S0278-4343(02)00031-6
Mallinson, D. J., Culver, S. J., Riggs, S. R., Walsh, J. P., Ames, D., and Smith, C. W. (2008). Past, Present and Future Inlets of the Outer Banks Barrier Islands, North Carolina. Greenville, NC: East Carolina University.
Mann, R., and Evans, D. A. (2004). Site selection for oyster habitat rehabilitation in the virginia portion of the Chesapeake Bay: a commentary. J. Shellfish Res. 23, 41–49.
Mroch, R. M., Eggleston, D. B., and Puckett, B. J. (2012). Spatiotemporal variation in oyster fecundity and reproductive output in a network of no-take reserves. J. Shellfish Res. 31, 1091–1101. doi: 10.2983/035.031.0420
Olds, A. D., Connolly, R. M., Pitt, K. A., Pittman, S. J., Maxwell, P. S., Huijbers, C. M., et al. (2016). Quantifying the conservation value of seascape connectivity: a global synthesis. Glob. Ecol. Biogeogr. 25, 3–15. doi: 10.1111/geb.12388
Paerl, H. W., Bales, J. D., Ausley, L. W., Buzzelli, C. P., Crowder, L. B., Eby, L. A., et al. (2001). Ecosystem impacts of three sequential hurricanes (Dennis, Floyd, and Irene) on the United States' largest lagoonal estuary, Pamlico Sound, NC. Proc. Natl. Acad. Sci. U.S.A. 98, 5655–5660. doi: 10.1073/pnas.101097398
Paerl, H. W., Pinckney, J. L., Fear, J. M., and Peierls, B. L. (1998). Ecosystem responses to internal and watershed organic matter loading: consequences for hypoxia in the eutrophying Neuse River Estuary, North Carolina, USA. Mar. Ecol. Prog. Ser. 166, 17–25. doi: 10.3354/meps166017
Paynter, K. T., Politano, V., Lane, H. A., Allen, S. M., and Meritt, D. (2010). Growth rates and prevalence of Perkinsus marinus in restored oyster populations in Maryland. J. Shellfish Res. 29, 309–317. doi: 10.2983/035.029.0205
Perring, M. P., Standish, R. J., Price, J. N., Craig, M. D., Erickson, T. E., Ruthrof, K. X., et al. (2015). Advances in restoration ecology: rising to the challenges of the coming decades. Ecosphere 6, art131. doi: 10.1890/ES15-00121.1
Peters, J. W., Eggleston, D. B., Puckett, B. J., and Theuerkauf, S. J. (2017). Oyster demographic in harvested reefs vs. no-take reserves: implications for larval spillover and restoration success. Front. Mar. Sci. 4:326. doi: 10.3389/fmars.2017.00326
Powers, S. P., Peterson, C. H., Grabowski, J. H., and Lenihan, H. S. (2009). Success of constructed oyster reefs in no-harvest sanctuaries: implications for restoration. Mar. Ecol. Prog. Ser. 389, 159–170. doi: 10.3354/meps08164
Puckett, B. J., and Eggleston, D. B. (2012). Oyster demographics in a network of no-take reserves: recruitment, growth, survival, and density dependence. Mar. Coast. Fish. 4, 605–627. doi: 10.1080/19425120.2012.713892
Puckett, B. J., and Eggleston, D. B. (2016). Metapopulation dynamics guide marine reserve design: importance of connectivity, demographics, and stock enhancement. Ecosphere 7:e01322. doi: 10.1002/ecs2.1322
Puckett, B. J., Eggleston, D. B., Kerr, P. C., and Luettich, R. A. (2014). Larval dispersal and population connectivity among a network of marine reserves. Fish. Oceanogr. 23, 342–361. doi: 10.1111/fog.12067
Quan, W. M., Zhu, J. X., Ni, Y., Shi, L. Y., and Chen, Y. Q. (2009). Faunal utilization of constructed intertidal oyster (Crassostrea rivularis) reef in the Yangtze River estuary, China. Ecol. Eng. 35, 1466–1475. doi: 10.1016/j.ecoleng.2009.06.001
Ramos, J., Santos, M. N., Whitmarsh, D., and Monteiro, C. C. (2006). Patterns of use in an artificial reef system: a case study in Portugal. Bull. Mar. Sci. 78, 203–211.
Reiley, B. M., Bednarz, J. C., and Brown, J. D. (2014). A test of the swainson's warbler habitat suitability index model. Wildl. Soc. Bull. 38, 297–304. doi: 10.1002/wsb.414
Roelofs, E. W., and Bumpus, D. F. (1953). The hydrography of Pamlico Sound. Bull. Mar. Sci. 3, 181–205.
Roloff, G. J., and Kernohan, B. J. (1999). Evaluating reliability of habitat suitability index models. Wildl. Soc. Bull. 27, 973–985.
Schulte, D. M., Burke, R. P., and Lipcius, R. N. (2009). Unprecedented restoration of a native oyster metapopulation. Science 325, 1124–1128. doi: 10.1126/science.1176516
Soniat, T. M., and Brody, M. S. (1988). Field validation of a habitat suitability index model for the American oyster. Estuaries 11, 87–95. doi: 10.2307/1351995
Starke, A., Levinton, J. S., and Doall, M. (2011). Restoration of Crassostrea Virginica (Gmelin) to the Hudson River, USA: a spatiotemporal modeling approach. J. Shellfish Res. 30, 671–684. doi: 10.2983/035.030.0309
Theuerkauf, S. J., and Lipcius, R. N. (2016). Quantitative validation of a habitat suitability index for oyster restoration. Front. Mar. Sci. 3:64. doi: 10.3389/fmars,.2016.00064
Theuerkauf, S. J., Burke, R. P., and Lipcius, R. N. (2015). Settlement, growth and survival of eastern oysters on alternative reef substrates. J. Shellfish Res. 34, 241–250. doi: 10.2983/035.034.0205
U. S. Fish and Wildlife Service (1981). Standards for the Development of Habitat Suitability Index Models. Washington, DC: U. S. Fish and Wildlife Service.
Watson, J. R., Mitari, S., Siegel, D. A., Caselle, J. E., Dong, C., and McWilliams, J. C. (2010). Realized and potential larval connectivity in Southern California Bight. Mar. Ecol. Prog. Ser. 401, 31–48. doi: 10.3354/meps08376
Weinstein, M. P. (2007). Linking restoration ecology and ecological restoration in estuarine landscapes. Estuaries Coasts 30, 365–370. doi: 10.1007/BF02700179
Winslow, F. (1889). Sounds and Estuaries of North Carolina with Reference to Oyster Culture. Raleigh, NC: US Coast and Geodetic Survey.
Wortley, L., Hero, J. M., and Howes, M. (2013). Evaluating ecological restoration success: a review of the literature. Restor. Ecol. 21, 537–543. doi: 10.1111/rec.12028
Keywords: eastern oyster, Crassostrea virginica, population persistence, decision support tool, HSI, Pamlico Sound, larval connectivity
Citation: Puckett BJ, Theuerkauf SJ, Eggleston DB, Guajardo R, Hardy C, Gao J and Luettich RA (2018) Integrating Larval Dispersal, Permitting, and Logistical Factors Within a Validated Habitat Suitability Index for Oyster Restoration. Front. Mar. Sci. 5:76. doi: 10.3389/fmars.2018.00076
Received: 28 November 2017; Accepted: 20 February 2018;
Published: 04 April 2018.
Edited by:
Romuald Lipcius, Virginia Institute of Marine Science, United StatesReviewed by:
Jon Olaf Olaussen, Norwegian University of Science and Technology, NorwayAndrew D. Thaler, Blackbeard Biologic, United States
Copyright © 2018 Puckett, Theuerkauf, Eggleston, Guajardo, Hardy, Gao and Luettich. This is an open-access article distributed under the terms of the Creative Commons Attribution License (CC BY). The use, distribution or reproduction in other forums is permitted, provided the original author(s) and the copyright owner are credited and that the original publication in this journal is cited, in accordance with accepted academic practice. No use, distribution or reproduction is permitted which does not comply with these terms.
*Correspondence: Brandon J. Puckett, brandon.puckett@ncdenr.gov