Cross-Shore Environmental Gradients in the Western Mediterranean Coast and Their Influence on Nearshore Phytoplankton Communities
 Gotzon Basterretxea1*
  Francisco J. Torres-Serra1
  Elisabet Alacid2
  Sílvia Anglès1
  Jordi Camp2
  Isabel Ferrera2
  Eva Flo2 Joan S. Font-Muñoz1
  Antoni Jordi3
  Albert Reñé2
  Paula M. Salgado-Hernanz1 Nagore Sampedro2
  Esther Garcés2
- 1Department of Ecology and Marine Resources, Mediterranean Institute for Advanced Studies, Universitat de les Illes Balears-Consejo Superior de Investigaciones Científicas, Esporles, Spain
- 2Departament de Biologia Marina i Oceanografia, Institut de Ciències del Mar, Consejo Superior de Investigaciones Científicas, Barcelona, Spain
- 3Davidson Laboratory, Stevens Institute of Technology, Hoboken, NJ, United States
During summer, when oligotrophic conditions prevail offshore in the Mediterranean Sea, enhanced phytoplankton stripes are often observed in nearshore waters. In this study, we examine the cross-shore hydrographic variability and the associated microbial plankton communities in this zone. Detailed cross-shore underway sampling at 47 coastal sites spread along the Balearic and Catalan coasts revealed the widespread existence of narrow bands of warm and decreased salinity water beholding high phytoplankton biomass (up to 50-fold vs. offshore chlorophyll). Most intense physical and biological anomalies along these transects were generally constrained to the first hundred meters from the shoreline (i.e., a transition zone starting at ~400 m). We use Principal Component Analysis (PCA) and k-means cluster analysis to categorize temperature, salinity and chlorophyll (T, S and Chl) in three main types of cross-shore trends. Prevalence of exponential-shaped Chl trends was observed particularly in areas with shoreward directed winds (B1-type). The other two trends (B2 and B3) presented variations off the coast produced by alongshore structures like river plumes, city outfalls and other features. Exponential-shaped cross-shore chlorophyll distribution (B1-type) accumulated 90% of the total transect Chl variation in the first 367 ± 190 m from the shoreline, whereas this distance was variable in the other profile types. Repeated daily sampling at one site with this transect typology revealed that wind forcing variations produced fast response on cross-shore T and S properties. Chl was less sensitive to changes at this time-scale. Phytoplankton communities exhibited site-dependent responses to the nearshore environment. Pico- and nanoplankton assemblages, typically dominating coastal assemblages during summer in the Mediterranean Sea, showed lower cross-shore variation. Conversely, larger response to nearshore conditions was observed in microplankton populations. These larger cells, represented by dinoflagellates, cryptophytes and diatoms, were able to actively exploit the nearshore conditions constituting an independent and distinct assemblage from that one prevailing offshore. Our results suggest that despite the importance of local-scale processes in determining biotic structure, some common patterns emerge providing clues on the main drivers of this nearshore niche.
Introduction
Nearshore waters, here defined as a coastal boundary region extending up to 2-km zone from the shoreline and depths of <25 m, influence key ecological processes, including the transport and remineralization of nutrients and organic matter, primary production, larval dispersal and settlement, as well as overall diversity (Roy et al., 1992; Gaylord et al., 2002; Siegel et al., 2008). This environment is being increasingly altered as result of human population expansion along coastline and is particularly sensitive to the effects of climatic change (Valiela et al., 1990; Bowen and Valiela, 2001). Sensible management decisions concerning coastal waters require fundamental understanding on the functioning of this system and timely communication of this understanding to managers and stakeholders, i.e., Brink et al. (1992). However, while the ecological relevance and societal benefits provided by nearshore habitats are well-recognized (Crooks et al., 2011), many aspects regarding their physical structure and associated ecological functions remain unclear.
The physical properties of nearshore waters are strongly influenced by the seafloor topography, coastal geomorphology and terrestrial outflows. The combination of direct air-sea fluxes and the interaction of currents and waves with land boundaries produce a highly variable energy flux flow in nearshore waters (Bird, 2011), whereas land-derived materials (nutrients, metals, organic matter, etc.) are important determinants of their chemical interactions. These site-specific mechanisms originate a variety of distinct environments and conditions for the growth of phytoplankton and other pelagic organisms. Due to this local-scale complexity, the search for common features governing plankton dynamics in nearshore ecosystems has remained elusive (Cloern and Jassby, 2010).
In some coastal areas, flow patterns can isolate the waters immediately adjacent to the shore such that inland effluents are retained and sharp cross-shore gradients are generated, e.g., Blythe et al. (2011). Because of bottom and coastline boundary effects, nearshore circulation is strongly anisotropic and cross-shore gradients are usually much stronger than alongshore variations (i.e., Kim et al., 2009). Some microorganisms such as certain bloom-forming flagellates are able to successfully exploit this ecological niche and, as a consequence, a variation in planktonic organisms abundance and community composition is sometimes visually evidenced as a well-delineated colored bands and/or foam lines in the water (Corcoran and Shipe, 2011; Lucas et al., 2011).
In the Mediterranean coast, waters adjacent to the shore differ from those further offshore with respect to macronutrient enrichment. This feature can be related to the changes in population structures, land use, and economic development occurring during the last decades. Such changes have resulted in widespread urbanization, but also more intensively cultivated agricultural areas (EEA, 2002). Indeed, long-term monitoring programs reveal marked differences in cross-shore nutrient concentrations and phytoplankton biomass, in which average nearshore chlorophyll (Chl) concentrations can be up to 6-fold higher than offshore values (Flo et al., 2011).
Ecologically, the persistence of a nutrient enriched nearshore habitat with reduced exchange can favor the development of compositionally distinct nearshore communities whose functionality differ from that in offshore waters. In fact, recurrent nearshore algal blooms with high cell abundances and durations spanning from days to weeks have been reported along Mediterranean coasts over the last few decades (Garcés et al., 1999; Garcés and Camp, 2012). These blooms rely on favorable sea and wind conditions for their maintenance and may thus undergo rapid variation with changing atmospheric and oceanographic conditions (Basterretxea et al., 2005). Moreover, coastal blooms differ in terms of their size, shape, species composition, and the generative processes. Thus, knowledge of the fine scale variations in the abundance and composition of the phytoplankton communities is essential to understand their biogeochemical effects in the ecosystem, to predict bloom formation and, therefore, to implement adequate management strategies.
Identifying cross-shore environmental gradients and characterizing both their phytoplankton variability and community composition are relevant steps to understand anthropogenically and climatically mediated variations in the coastal ocean. The aim of this study is to characterize the cross-shore physical and biological properties of nearshore waters in the Mediterranean Sea during summer conditions, when nearshore blooms are frequent in these waters. Using continuous underway measurements, we analyze the physical patterns of surface water variation and the phytoplankton composition and distribution in this niche. We conclude our analysis by discussing the implications of the formation of this ecosystem as a precursor of harmful algal blooms (HABs) and the consequences of the existence of intense nearshore gradients for coastal zone management.
Materials and Methods
Site Description
Summer in the Western Mediterranean coast is characterized by scarce precipitation and mild thermal winds. Absence of significant tidal mixing and weak coastal circulation together with large photoperiod and warm sea temperatures favor the development of nearshore blooms from late May to September (Basterretxea et al., 2007; Figure 1a). Thus, sampling was conducted during June–July 2014 and July 2015 along the Balearic and Catalan coasts (Figure 1b). The survey was concentrated on five regions with land uses varying from agricultural to urban. Alcudia (ALC) and Palma (PAL) are intensive agricultural areas on the island of Mallorca with reported nutrient rich groundwater seeps along the shoreline (Rodellas et al., 2014; Tovar-Sánchez et al., 2014). Girona (GIR) coastal area corresponds to a wetland with some agriculture and low flow Mediterranean river rich in nitrates, the Ter (>50 μM in river plumes). Tarragona (TGN) is a sparsely populated region with dryland agriculture. While groundwater seeps from nearby coastal aquifers have been reported (Fernandez-Ruiz, 2012), nutrient concentrations along the coast are lower than at the other agricultural areas of this study (see Figure 1c). Barcelona (BCN) corresponds to a highly developed urban area with a population of 1.6 million of habitants. Ancillary nearshore nitrate concentrations at each of the selected areas are shown in Figure 1c. As in other coastal regions, while mean long-term nutrient concentrations are indicative of enrichening in the Mediterranean coast, raw samples rarely correlate well with Chl or phytoplankton abundance (Flo et al., 2011).
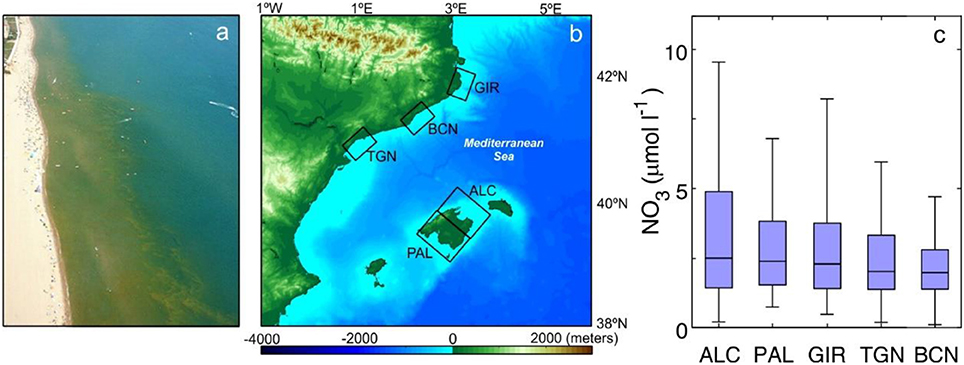
Figure 1. (a) Aerial image of a nearshore phytoplankton bloom in Girona (GIR) coastal area and (b) map of the five surveyed areas covering the Balearic Islands and the Catalan coast (Alcudia ALC, Palma PAL, Girona GIR, Tarragona TGN, and Barcelona BCN). (c) Box-whisker plots of nearshore nitrate concentrations at the five regions studied (median, q1, q3, min, and max). Data from the Balearic Islands are from (2000–2007), data from the Catalan Coast are from Agència Catalana de l'Aigua (ACA; 1990–2015). Only values with salinities exceeding 37 ppt have been included in GIR to avoid values perturbed by the influence of the river.
Fine-Scale Characterization of Nearshore Waters
In 2014, a spatial survey covering a total of 47 cross-shore transects was conducted in the five sampling regions. Continuous underway automatic measurements of temperature (T), salinity (S) and fluorescence based Chl were carried out from the shoreline (i.e., 0.5 m depth) to a minimum distance of 1,500 m at each sampling point. Samples were collected between 9 and 16 UTC under good weather conditions, either in the absence of breakers or with small waves breaking on the shoreline. We selected relatively linear beaches typically presenting bottom slopes (β) varying between 0.006 and 0.02. In addition, during July 2015, 10 consecutive transects of T, S, and Chl were obtained at Palma Bay to assess temporal changes in the cross-shore gradients on a scale of days. Measurements at this site were performed twice a day; in the morning (between 10 and 12 UTC) and early evening (between 18 and 19 UTC). These hours are roughly coincident with the beginning and end of the diurnal breeze cycle at Palma Bay (Basterretxea et al., 2005) and allowed to assess the influence of the wind.
Cross-shore registers of T, S and fluorescence (volts) were obtained using an integrated system composed of a SBE 45 MicroTSG thermosalinograph, and an Enviro-T in-line fluorometer. The data were captured at 1 Hz and merged with both with the GPS position and with the echosounder depth. Surface seawater was pumped from a depth of ~0.25 m at a rate of 1.5 L min−1 using a submersible pump attached to the side of a boat. At each sampling site, the slow navigation of the boat (2–2.5 kt) allowed a spatial resolution of roughly 1 record m−1. Fluorescence records were converted into Chl (mg m−3) using a calibration (r2 = 0.76, p < 0.01) obtained from simultaneous discrete water samples (see section Discrete Water Sampling and Analyses) and samples collected at the beginning and the end of each transect.
Continuous Data Processing and Statistics
Continuous T, S and fluorescence records converted to Chl were despiked and interpolated at 1 m intervals. Offshore reference values were calculated as the mean of the data registered between 1,500 and 2,000 m. A canonical correspondence analysis (CCA) and subsequent clusterization of the first mode of T, S and Chl anomalies (explaining 77% of the variation) was used to statistically delimit nearshore, transition and offshore waters. Coherent variance patterns in the cross-shore T, S and Chl transects were identified by principal component analysis (PCA). For this analysis, the lengths of the profiles were homogenized to 1,500 m and the T, S, and Chl values were normalized (0–1). The aim of this PCA was to obtain simplified patterns of cross-shore variation from corresponding complex [47 transects × 1,500 values] data matrices of these three variables. Also, by this approach, high dimensional data are transformed into lower dimensional data while minimizing information loss. We use the simplified dataset –the coefficients of the three first components of the PCA (Supplementary Figure 1)- to cluster the T, S, and Chl transects into three major groups using k-means clustering (Seber, 1984). Clusters for each variable (T, S, Chl) were obtained separately and do not necessarily include the same transects.
Power spectra were calculated for the T, S, and Chl data series from the continuous cross-shore sampling as follows. Very low frequency fluctuations were removed by a first-difference filter. The autospectra were calculated using 900-point Fast Fourier transforms (FFTs) tapered with a Hanning window and 50% overlap. Spectral estimates obtained from the averages of the separate blocks were much more stable than single estimates, although a narrower range of inverse wavelengths was covered.
Autocorrelation analysis was used to assess the main length scale of phytoplankton patchiness along the transects. First, the Chl data were detrended and periodicities were afterwards estimated using the autocorrelation function. Decorrelation lengths were estimated by abscissa axis crossing of the autocorrelation function. Both power spectral and autocorrelation characterizations of horizontal variability were made under the assumption that the processes are comparatively static for the period of the survey. This fact should not introduce large errors, since cross-shore currents in the coastal Mediterranean are generally low as compared with sampling speed (e.g., Jordi et al., 2011).
Discrete Water Sampling and Analyses
Discrete water samples (8–9 per transect) for Chl and phytoplankton community determinations were obtained along 9 transects distributed among the five study regions. Chl concentration was determined on a Trilogy laboratory fluorometer (Turner) following the method of Yentsch and Menzel (1963). Phytoplankton were enumerated by flow cytometry and identified by microscopy. For flow-cytometry quantification of pico-, and nanoplankton, 2 mL of each sample was fixed in the dark for 30 min with paraformaldehyde plus glutaraldehyde (1 and 0.05% final concentrations, respectively), stored in liquid nitrogen in situ, and transferred after arrival in the laboratory to a −80°C freezer. Samples were analyzed with standard protocols on a Becton-Dickinson FACScalibur flow cytometer following the recommendations of Gasol and DelGiorgio (2000). Autotrophic cells were separated into the cyanobacteria Synechococcus and Prochlorococcus, picoeukaryotes, nanoeukaryotes, and cryptophytes. For microplankton identification and quantification by microscopy, samples were collected and fixed in Lugol's iodine or formaldehyde solution. An aliquot of 100 mL was settled in a microscopic chamber for 24 h and an appropriate area then scanned using a Leica-Leitz DM-II inverted microscope. The entire community was identified to the species or lowest taxonomic level possible according to morphological criteria. To estimate algae carbon biomass (C) for each taxonomic group, published species specify C (Eppley et al., 1970; Montagnes et al., 1994; Menden-Deuer and Lessard, 2000; Marañón et al., 2013) and data from the NW Mediterranean Sea (Estrada, Arin, pers. comm.) was used. C biomass for each category was calculated by multiplying cell concentration by cell C.
Similarities within phytoplankton communities along the cross-shore transects were evaluated from a taxonomic approach (lists of species or groups and abundance) using the Bray-Curtis dissimilarity index that appropriately emphasize changes in the composition or relative abundances of the identities (Legendre and Gallagher, 2001; Clarke et al., 2006; De Cáceres et al., 2013). A taxonomic resemblance matrix was calculated based on the standardized square root transformed abundance data.
Results
Patterns of Spatial Variability
Figure 2 shows the mean and envelope of the measured continuous transects. Overall, warming (mean 0.6 ± 0.5°C above offshore values) was evidenced in the proximity of the shoreline in most of the registers revealing heat accumulation with decreasing depth near the shore. Shoreline temperatures occasionally exceeded 2.4°C offshore values, but most frequently warming was in the range of 0.5–1°C. Salinity variations were site dependent and ranged from weak (0.02) declines in the first tenths of meters from the shoreline to more intense declines at TGN (0.5) or in the presence of river plumes (i.e., >3.0 at three transects at GIR). Chl values showed minor variations in the offshore boundary of the transects (e.g., 0.45 ± 0.28 mg m−3 at 1,500 m). These Chl concentrations, although still low, exceeded typical open ocean values in the Western Mediterranean during summer ~0.1 mg m−3 (Colella et al., 2016), thus revealing the influence of coastal conditions at the offshore boundary of the sampled transects. Near the shoreline, Chl concentrations were highly variable, with median values of 0.91 mg m−3 but with concentrations reaching up to 10.37 mg m−3 at PAL (range 0.28–10.37 mg m−3). High phytoplankton biomass accumulation (>2-fold offshore reference values) was generally recorded in the first 100–200 m from the shoreline and biomass decreased thereof seaward across a transition zone highly variable. Results from the CCA analysis indicate a mean nearshore limit of 117 ± 78 m and an offshore boundary of the transition zone at a mean distance of 429 ± 281 m from the shore.
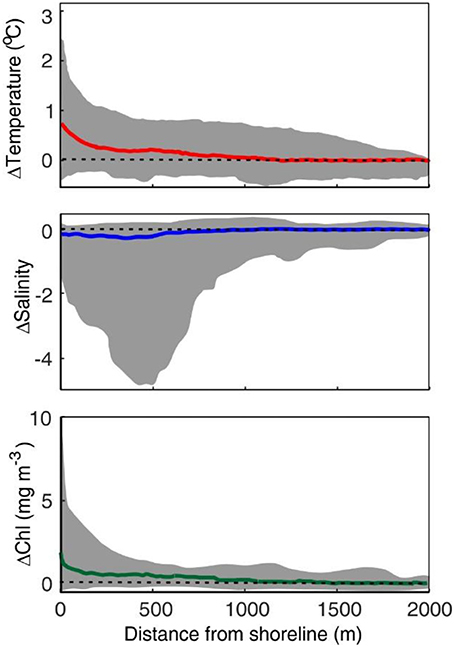
Figure 2. Mean (colored line) T, S, and Chl and envelope (shaded area) of the 47 transects. Values are represented as absolute anomalies from offshore value in each transect (mean from 1,500 to 2,000 m). Dashed lines indicate the y = 0 reference value.
The main patterns of cross-shore variation obtained using PCA are shown in Figure 3. The first three components explain more than 82% of the variability of each of the three variables analyzed (T, S, and Chl). The first component (c1) in T explains 52% of the variability, revealing a linear trend from offshore toward the shore. This linear trend was determined in ~87% of the transects. The second and third components also indicated nearshore warming. This gradient was exponential in shape in the restricted band <400 m from the shoreline line (marked in gray in the figure). Salinity components indicated this variable declines toward the shore. While a quasilinear shoreward decreasing tendency was observed in c1, components 2 and 3 reflected different patterns of variation with decays at the nearshore. The c2 and c3 trend is perturbed by variations that may either increase or decrease S in the offshore. Similarly to T, the first component of Chl indicated lineal enhancement toward the coast. The c2 and c3 components of Chl also presented a trend comparable to that of T.
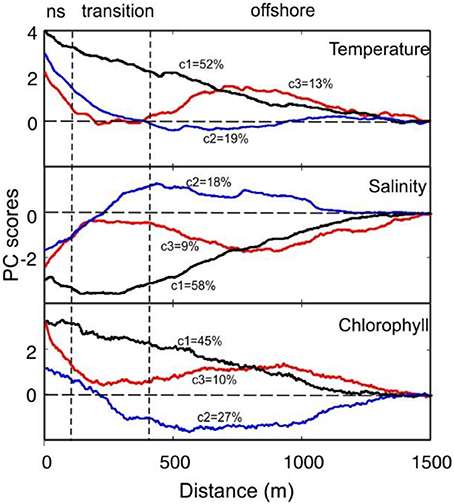
Figure 3. PCA scores for T, S, and Chl. The variability explained by each component (c1, c2, and c3) is indicated. The patterns were adjusted to zero in the offshore limit (1,500 m) to facilitate interpretation. Mean position of nearshore (ns) and transition limits as depicted form CCA analysis are indicated by the vertical dashed lines.
Figure 4 shows the mean T, S, and Chl transects resulting from k-means clusterization. Most transects (up to 49% in the case of Chl) are included in Cluster 1 that represents exponential variation with distance from shore (see T1 and B1). Both T and Chl increase in nearshore whereas a marked decline is observed in S. These changes mainly occur in the first 400 m from the shoreline (i.e., inshore from the transition zone boundary). The cumulative sum of along Chl transect reveals that 90% of the biomass is located in the first 367 ± 190 m from the shoreline. Other mean transects obtained by clustering, such as T3, S3, and B2, represent transects with variations at a larger distance from shore (400–600 m). The distance from shore at which 90% of the accumulated Chl occurs varies between 898 ± 215 m at B2 and 655 ± 94 m at B3 revealing a higher cross-shore dispersion of the biomass. The spatial distribution of the Chl clusters is shown in Figure 5. B1 mainly corresponds to transects at PAL and GIR. B2 is widely distributed, with more presence at ALC and TGN whereas B3 dominates at BCN.
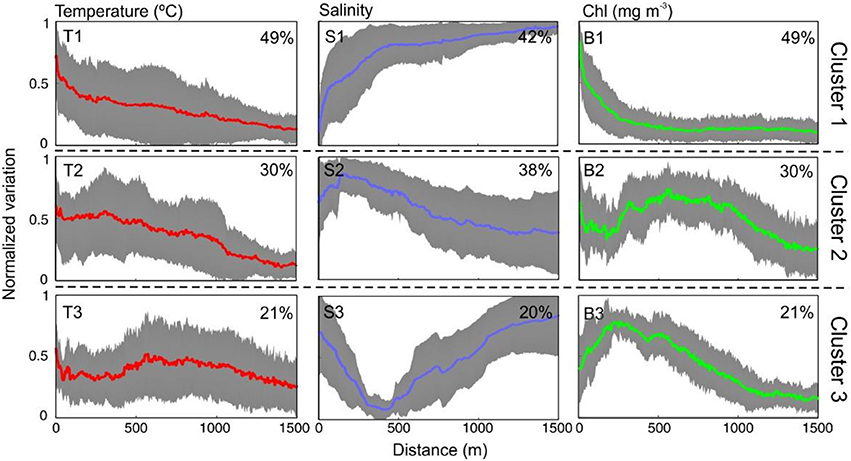
Figure 4. Mean cross-shore variation of T, S, and Chl (normalized values) for each of the three clusters obtained by k-means clustering of the 47 transects analyzed. The colored line is the mean value and the gray shaded areas indicate the standard deviation. The percentage indicates the proportion of transects included in the mean.
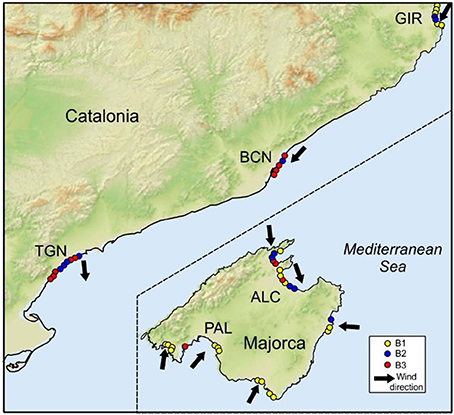
Figure 5. Map showing the Chl onshore-offshore transects categorized by types (B1, B2, B3) as shown in Figure 4. Arrows indicate wind direction during the sampling.
Fine-Scale Variability
Figure 6A, displays the mean spectra of the measurements of T, S, and Chl. T and S exhibited mean spectral slopes (β) of −2.7 ± 0.4 and −3.0 ± 0.7, higher that the expected power law spectrum exponent (E(k) = k−β; where k is a wave number) of −5/3 (Kolmogorov, 1962; Oboukhov, 1962). However, similar values have been reported for small spatial scales (van Gennip et al., 2016). Chlorophyll slope was flatter (β = −2.4 ± 0.4) but increased at high frequencies (k >0.05 m−1) where it was not significantly different (β = 2.9 ± 0.5, p < 0.01) to the general slope of that of T, suggesting dominance of physical processes at this scale. A slight peak is observed in the Chl spectrum at distances between 25 and 80 m. We used spatial autocorrelation analysis to further examine along this phytoplankton patch scale (Figure 6B). The Chl spatial decorrelation lengths varied between 30 and 300 m, with median values of 77 m and 25–75% percentiles of 60 and 120. Larger scales were observed in T (median = 134 m; percentiles = 100–174) and S (median = 142 m; percentiles = 95–173 m). The frequency distribution of the Chl crossings of the 47 transects is shown in Figure 6C, and presents a log-normal distribution.
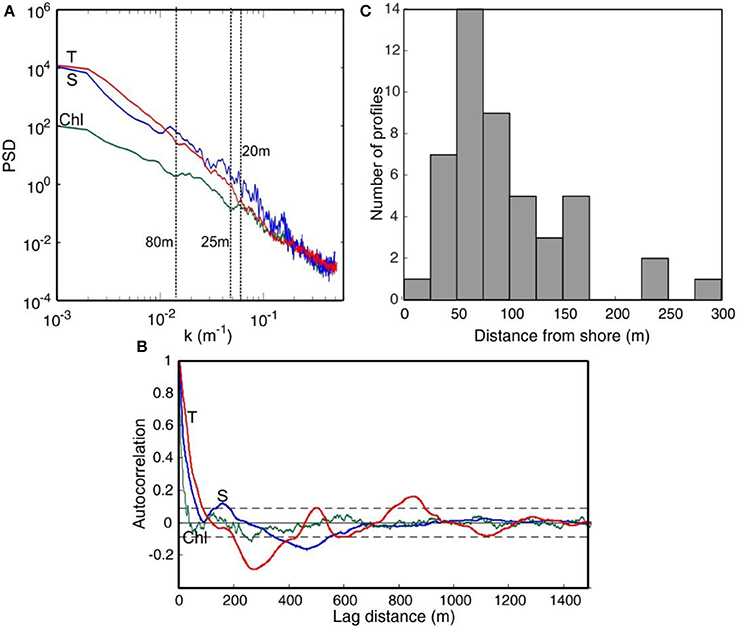
Figure 6. (A) Mean power spectra of T, S, and Chl from continuous records obtained during 2014 (n = 47). (B) Spatial autocorrelation of the same variables as a function of lag. Data are from a transect at Palma Bay (located at PAL). (C) Histogram showing the frequency of Chl decorrelation lengths calculated for the 47 transects.
Diel Variations
Repeated measurements in a location presenting an exponential shaped B1-type transect (PAL) were carried out to assess the short-term (days) persistence of this cross-shore pattern. Wind conditions during the survey were characterized by a shoreward directed sea-breeze during daylight and wind direction reversal at night (Figure 7A). This breeze regime was interrupted only on July 25 when northerly (land to sea winds) of enhanced intensity (up to 8 m/s) blew at Palma Bay.
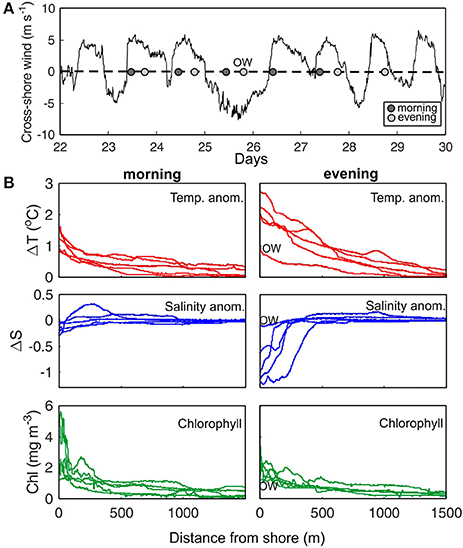
Figure 7. (A) Cross-shore wind variation at Palma Bay during July 2015. Positive values indicate winds toward the coast. Dots indicate when transects were sampled. (B) Cross-shore transects of T (ΔT) and S (ΔS) anomalies, and chlorophyll (Chl) for morning and evening surveys. OW indicates an evening transect measured with offshore directed winds.
While maintaining the general trend of an exponential cross-shore variation of T, and Chl, remarkable changes occurred within a diel cycle (Figure 7B). Cross-shore anomalies extended offshore to up to 1,500 m, but most remarkable variations of T and S occurred within the first 500 m from the shoreline and somewhat closer in the case of Chl (<300 m). Sea surface T warmed during the day reaching anomalies >2°C in the nearshore during the evening. Salinity anomalies also increased from 0.1 to 0.3 at morning transects to >0.5 in the evening. Due to the poor correlation of these S declines with sealevel changes (data not shown), it is suggested that groundwater exchanges are driven by other processes, such as wave pumping. This would be supported by the low S change in the transect sampled on July 25 with offshore directed winds (OW) and absence of significant waves in the nearshore. In this sampling, variation of T and S in the evening was in the range of morning values.
The nearshore values of Chl typically oscillated between 0.8 and 3.5 mg m−3 but exceeded 5 mg m−3 in two of the morning samplings. These high concentrations were restricted to very shallow waters, in the first 25 m from the shoreline, and corresponded to midday measurements. Despite these differences in absolute Chl values, the shape of the normalized values did not vary from morning to evening. Unlike T and S, the variability on Chl concentration within a diel cycle appears to be minor.
Cross-Shore Variation in Plankton Community Structure
Among the autotrophic organisms, dinoflagellates were the group that most contributed to total biomass (mgC m−3), followed by diatoms, picoeukaryotes and Synechococcus spp. (Figure 8A). Cross-shore variation in the relative total biomass exhibit high content of C only restricted to nearshore waters in GIR and PAL, with no clear cross patterns in the rest of the transects (Figure 8B). In the case of microplanktonic groups identified and quantified by microscopy, diatoms, dinoflagellates and cryptophytes presented the highest difference in the cross-shore variation (i.e., GIR). With some exceptions (i.e., BCN), pico- and nanoplankton, did not exhibit large cross-shore variations (Figures 8C1–3). Indeed, at some locations like BCN contribution to total C of some groups like Synechococcus spp. decreased in the nearshore being substituted by other cytometric groups (picoeukaryotes).
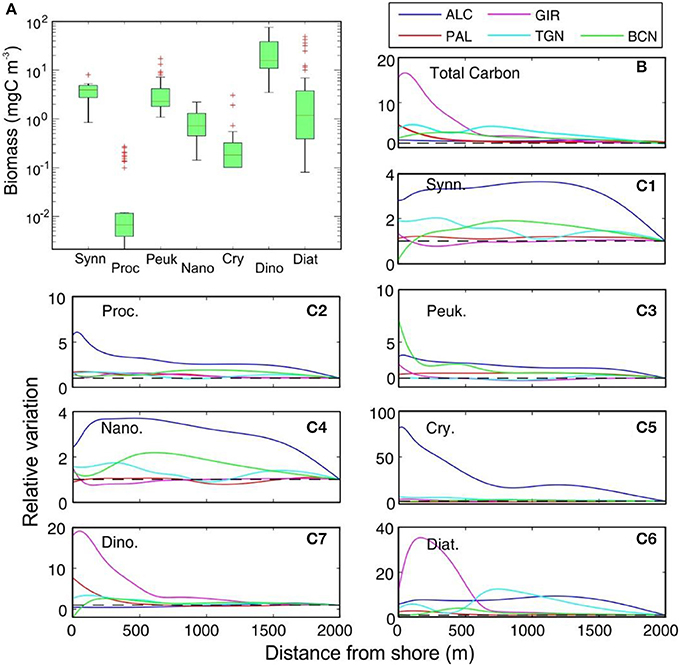
Figure 8. (A) Box-whisker plot of the biomass of representative groups of phytoplankton community at the five studied areas (median, q1, q3, and whiskers for min and max). Red crosses indicate the outliers. (B) Cross-shore variation in the relative biomass of the total carbon of the phytoplankton community at the sampling sites (relative to 2,000 m value). (C) Cross-shore variation in the relative biomass of each group at the sampling sites. Synn, Synechococcus; Proc, Prochlorococcus; Peuk, picoeukaryotes; Nano, nanoeukaryotes; Cry, cryptophytes; Dino, dinoflagellates; Diat, diatoms.
The degree of dissimilarity (Bray-Curtis index) was used to quantitatively assess the cross-shore variation in the composition of micro-, and nano- and picophytoplankton communities. It should be noted that absolute values of both fractions are not fully comparable since the level of detail in their groups is different and that a higher degree of definition (as in the case of microphytoplankton) increases the dissimilarity indices. As shown in Figure 9, dissimilarity matrices for pico- and nanoplankton reveal weak differences in abundance and composition between the stations located within the same transect, with unclear patterns in the case of PAL and GIR and higher dissimilarities between St2 and St3 at TGN. Higher dissimilarity in the pattern was observed in the case of microphytoplankton. For example, St1–St3 in PAL, affected by lower S, are similar among them and different from the rest of the transect, and a similar pattern arises at St2–St5 in GIR, affected by a river plume. While matching between Chl and Bray-Curtis index suggests a strong influence of biomass variation in the dissimilarity patterns, calculation of the Jaccard index, which is independent of organism abundance, yields similar results in the nearshore band at PAL and TGN (not shown). Overall, the cross-shore variations in the degree of dissimilarity of the microphytoplankton community is due to: (i) a large number of species were exclusively present at the nearshore station in almost all the transects, (ii) some of these species often dominated the microphytoplankton community, (iii) a large number of low-abundance species in nearshore station, indicative of a community structure clearly different from the rest in the transect and iv) only few microphytoplankton species were always present along all cross-shore transects (these species were represented by cosmopolitan dinoflagellates such as Prorocentrum micans or Tripos furca).
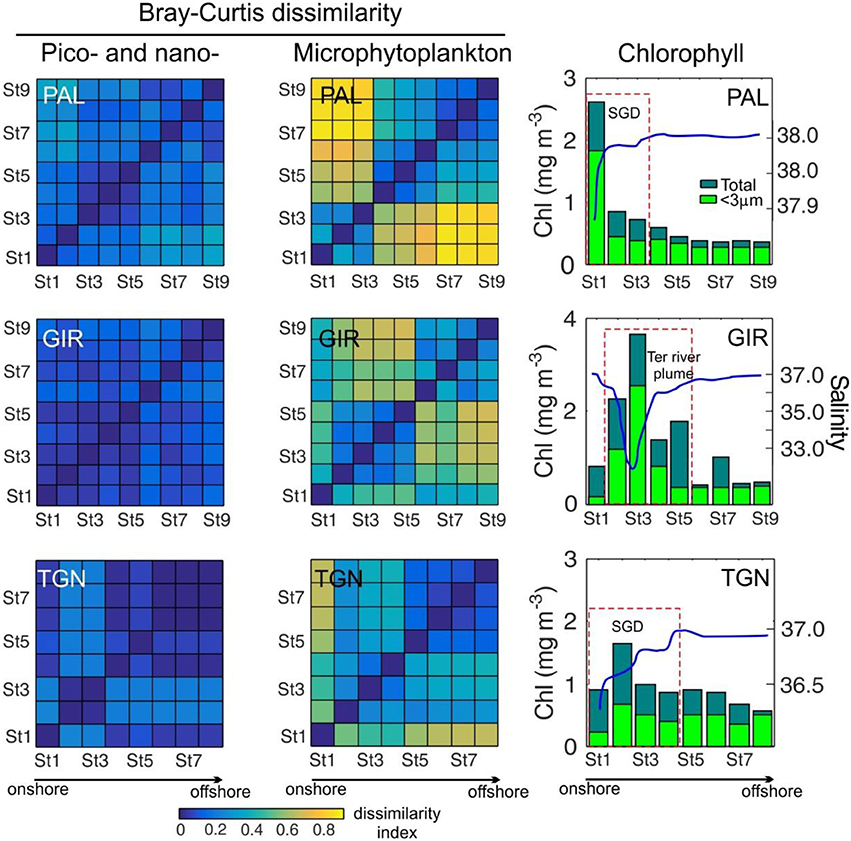
Figure 9. Examples of Bray-Curtis dissimilarity matrices for pico- and nanophytoplankton (left) and microphytoplankton (right) among different stations within the same transect. Corresponding cross-shore Chl (bars) and S (blue line) patterns are shown in the right panels. The stations affected by lower S water masses originated by submarine groundwater discharges (SGD) or river plumes are indicated by a dashed box.
In a further step to identify bloom-forming and noxious dinoflagellate species in these nearshore coastal waters, we observed that some of these species were found exclusively in these waters (see Figure 10 as an example at PAL). Among the species contributing to the nearshore assemblages several potentially harmful species were identified, including Alexandrium minutum, A. taylori, A. tamarense, A. margalefi, A. insuetum, Dinophysis sacculus, Karlodinium spp., Prorocentrum spp., Gymnodinium spp., and Heterocapsa spp. Species as A. minutum were constrained to the nearshore, rapidly disappearing at a distance between 400 and 1,000 m from the coast.
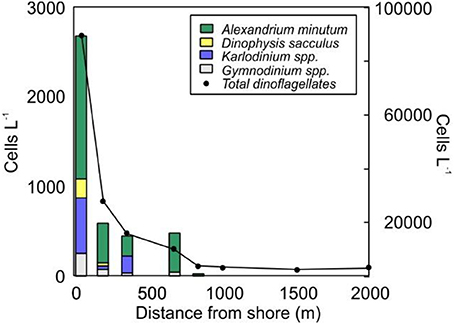
Figure 10. Cross-shore variation of the abundances of the dominant bloom-forming and noxious species at PAL in 2014 (transect corresponding to Chl cluster 1). The total dinoflagellate abundance is represented in the right axis.
Discussion
The present study contributes to the characterization of the fine-scale abiotic structure of the nearshore environment in the western Mediterranean Sea during summer conditions and to the comprehension of how these conditions influence the phytoplankton communities inhabiting this zone. The ubiquity of intense cross-shore gradients in T, S, and Chl waters reveals a unique coastal-margin environment along the examined region. Consistent with previous studies, the cross-shore variations in the physical properties and biological communities of this environment are highly site-specific. Nevertheless, our dataset also reveals common features and trends that help to conceptualize this ecosystem.
Physical Environment and Phytoplankton Biomass
Despite the dry summer climate, nearshore negative S anomalies were observed in most transects, revealing an important influence of land freshwater sources. Away from areas of river influence, diffuse groundwater seeps are an important nutrient source sustaining nearshore communities in the Mediterranean Sea (Basterretxea et al., 2010; Rodellas et al., 2015).
In addition to freshwater inputs and associated nutrient discharge, other local major factors regulating the physical development of the nearshore niche in the Mediterranean Sea are insolation and wind induced transport and mixing. Both have a greater impact on nearshore waters because of the shallow depth, resulting in greater T fluctuations than occur farther offshore (Eisma, 1982). Our cross-shore T records reveal that T at the shoreline margin can increase up to +2.8°C. Warmer nearshore temperatures generate horizontal density gradients that drive an onshore-offshore flow exchange, often referred to as horizontal convection or “thermal siphon” (Adams and Wells, 1984; Monismith et al., 1990; Mao et al., 2010). Due to this T driven-process warm water flows at surface toward the ocean and cold water flows to the shore at bottom. The significance of this buoyancy-driven flow has been demonstrated in field measurements and can influence water chemistry as well as plankton distribution by generating nearshore vertical circulation cells (Stefan et al., 1989; Monismith et al., 2006). Nearshore warming varies with the extent of hydraulic isolation and can be used as a predictor of an environment prone to phytoplankton accumulation. Temperature variations can also modify conditions optimal for phytoplankton growth, such that the dominance of some species is favored. Indeed, there is a two way effect since heating can be enhanced by the increased absorption of radiation produced by phytoplankton or other particles (Ramp et al., 1991; Edwards et al., 2004).
As revealed by the PCA, a transition area lies between the coastal margin and offshore waters. In some transects, such as the B1-type Chl trend, this zone presents a gentle transition from warmer waters containing high phytoplankton biomass to the oligotrophic conditions prevailing offshore. Wind induced cross-shore advection is a key factor determining accumulation and variability in this zone (see Figure 7). Indeed, B1-type mainly occurs in areas where winds are shoreward directed (see Figure 5). In other Chl transect types (B2, B3), variability in this transition zone is similar or exceeds nearshore variations. These variations are generally related to alongshore features generated by river plumes, city outfalls and/or other coastal front dynamics. This is clearly observed in the proximity of the Ter river at GIR, and at some sampling points near the city of Barcelona (BCN) but it also occurs at TGN. The definition of these river-plume features fades with distance from source and it could be plausible to speculate that in some cases B3-type is indeed the result of a dampened signal produced by a distant source similar to that on B2-type. In the case of river and stream plumes the source can be tracked by changes in S. In some other cases, the source of these perturbations at the transition zone are more difficult to identify. Headland fronts, topographic eddies and water masses in ports, inlets and other coastal features are source of this variability.
In conclusion, although nearshore waters are naturally enriched in nutrients, these inputs can be intensified by agricultural, industrial and urban development, both of which result in diffuse but relevant inputs of nutrients that can fuel nearshore biological productivity. Shifts in the concentrations and forms of nutrients can lead to shifts in the standing stock of phytoplankton, and the species composition of the community due to nutrient preferences among algal taxa (Litchman et al., 2006). However, enhanced phytoplankton growth is a necessary but not sufficient condition for the biomass variation observed in the nearshore (Figure 7). Over short time scales (<1 day), the growth-related changes in a phytoplankton population are typically small since in the case of nearshore phytoplankton, net growth rates of the dominant microplankton species are low (μ = 0.3–0.7 d−1; Stolte and Garcés, 2006). Rather, our data suggest that, despite the importance of biological activity, nearshore systems are highly sensitive to variations in wind forcing over short (hours) time scales. Indeed, Figure 5 and Figure 7A suggest that winds toward the coast may be crucial in the development of B1 type of transects. Plankton is commonly assumed to be dispersed and advected passively by the local hydrodynamic regime, but this is an oversimplification since there are biological means to achieve phytoplankton population integrity or cohesion (Wyatt and Zingone, 2014). Indeed, the observed flattening in the Chl power spectrum suggests that, at scales greater than 20 m, coastal phytoplankton does not behave as a passive tracer. Similar results in Chl spectra can been attributed to biological effects, for example, the swimming and behavioral capabilities of some microplankton species and their ability to drive organism distribution will oppose to the energy of the physical processes driving phytoplankton redistribution (McManus and Woodson, 2012). Phytoplankton accumulation and the development of a distinct nearshore community would reflect the local equilibria between these biological and physical forces.
Nearshore Phytoplankton Composition
Our study highlights the emergence of distinct microplankton communities in nearshore waters, and a mosaic-like surface distribution of plankton from nearshore to offshore. In marine phytoplankton ecology, a widely accepted paradigm is that most of the temporal and geographical variability in total biomass and productivity is associated with changes in larger size fractions, with picoplankton regarded as a “background” component whose abundance and activity remain fairly constant (Raimbault et al., 1988; Chisholm, 1992; Rodríguez et al., 1998). The superior ability of cells with sizes in the range of 4–40 μm to exploit high nutrient explains their biomass dominance during blooms, see Marañón (2015). With some exceptions -i.e. when massive nanoflagellate blooms develop-, the general rule that the contribution of picoplankton and nanoplankton decreases as the Chl concentration increases (Li, 2002) also applies in this Mediterranean nearshore environment. As shown in Figure 8, cross-shore variation mainly affects the microplankton size fraction while the community of smaller cells is more weakly affected. Changes in the microphytoplankton size fraction are mainly evidenced in the large number of species (i.e., dinoflagellates) that are exclusively present at nearshore stations. The dominance of these species, and the large number of low-abundance species in that environment constituting an independent and distinct assemblage from that prevailing offshore (see Figure 9).
Large cells exhibit a number of physiological advantages that may aid their proliferation in this environment, including their ability to store nutrients when resources are abundant (Verdy et al., 2009) and effective vertical position maintenance via buoyancy or by swimming. Also, they are less vulnerable to grazing by the microzooplankton community. However, the development of a distinct community requires some degree of stability in environmental conditions. The coastal margin is an intrinsically unstable environment where short-term fluctuations dominate (Kaplan et al., 2003; McPhee-Shaw et al., 2007). This implies frequent resetting of the conditions, which would preclude the divergence of nearshore from offshore assemblages. Major drivers of divergence are succession and stability. An accepted ecological paradigm is that phytoplankton succession starts upon stabilization of the water column after a period of intense mixing, and progresses toward a more complex community structure as long as stability persists (Margalef, 1963, 1967). Accordingly, as it is found here, emergence of a nearshore community should be associated with the temporal stability of nearshore and offshore waters and their rate of exchange. Only if the changes persist such that resources and species interactions are altered, they may induce identifiable community shifts and therefore differentiated community structure. Furthermore, phytoplankton species that bloom in the nearshore zone of the Mediterranean Sea, mainly nanoflagellates, diatoms and dinoflagellates, are probably not derived from oceanic communities. Instead, phytoplankton blooms are hypothesized to be induced by local seeding, growth and accumulation. Specialized behaviors, the capability of motility and vertical migration, the ability to use organic nutrients forms and mixotrophy, represent other, very successful adaptations that allow a species to prevail in stratified waters (e.g., Stoecker, 1999).
Implications for Coastal Management and Water-Quality Assessment
The conceptualization of coastal processes has traditionally been based on assessments of the influence of terrestrial nutrients on coastal communities, especially the bottom-up control of phytoplankton populations. While the enriching effect of rivers on the Mediterranean has been well studied (Sempéré et al., 2000; Billen and Garnier, 2007; Ludwig et al., 2009), much less is known about the impact of diffuse sources of nutrients such as submarine groundwater discharge (SGD). However, only 10% of Mediterranean coastal waters are affected by rivers and, with the exception of major rivers, runoff in this Sea is both irregular and scarce, e.g., García-Ruiz et al. (2011). Consequently, the common state of the Mediterranean coast is low-runoff, low river influence. In this case, runoff and SGD are potential not negligible sources of nutrients. Moreover, the type of land use determines the quantity and quality of the runoff and therefore also the types of nutrients that reach coastal waters, organic matter generation, and ultimately the degree of eutrophication of coastal waters.
Cross-shore phytoplankton variations pose a challenge for the design of coastal monitoring strategies in the Mediterranean Sea. Our observations provide an explanation for the difficulties in interpreting sampling data obtained as part of most European Water Framework Directive (WFD) monitoring programs in the Mediterranean Sea, see also Camp et al. (2016). Measurements taken at a particular distance from shore may lead to misinterpretations on the overall biomass and community composition. To avoid these biases, the spatial resolution of measurements across nearshore waters should be sufficiently refined such that they capture the main patterns in the system. According to Kalikhman (2001) a field can be reconstructed properly (r2 > 0.70) if sampling distance/autocorrelation < 1.0–1.5. This implies that, with the spatial Chl decorrelation scales obtained in the present study, water measurements should be obtained at spatial intervals of 90 to 180 m to finely characterize the nearshore gradient. While fine spatial resolution may be unnecessary for the purpose of most monitoring programs, our results raise concern on coastal water assessment based on single point measurements.
Author Contributions
Conceived and designed the study: GB, JC, EF, AJ, EG. Performed field studies and acquisition of data for the work: EA, SA, IF, EF, JF-M, AJ, AR, PS-H, NS. Analyzed the data: GB, FT-S, EG, EA. Interpreted the data and wrote the paper: GB, EG, JC. All authors reviewed the manuscript and give the final approval of the version to be published.
Funding
This article is a result of the MINECO Grant GRADIENTS Fine-scale structure of cross-shore GRADIENTS along the Mediterranean coast (CTM2012-39476).
Conflict of Interest Statement
The authors declare that the research was conducted in the absence of any commercial or financial relationships that could be construed as a potential conflict of interest.
Acknowledgments
The authors would especially like to thank the Club Nautic S'Arenal for their cooperation during the field work. We are grateful to M. Delgado for assistance with phytoplankton quantification and identification.
Supplementary Material
The Supplementary Material for this article can be found online at: https://www.frontiersin.org/articles/10.3389/fmars.2018.00078/full#supplementary-material
References
Adams, E., and Wells, S. A. (1984). Field measurements on side arms of Lake Anna, Va. J. Hydraul. Eng. 110, 773–793.
Basterretxea, G., Garcés, E., Jordi, A., Anglès, S., and Masó, M. (2007). Modulation of nearshore harmful algal blooms by in situ growth rate and water renewal. Mar. Ecol. Prog. Ser. 352, 53–65. doi: 10.3354/meps07168
Basterretxea, G., Garcés, E., Jordi, A., Masó, M., and Tintore, J. (2005). Breeze conditions as a favoring mechanism of Alexandrium taylori blooms at a Mediterranean beach. Estuar. Coast. Shelf Sci. 62, 1–12. doi: 10.1016/j.ecss.2004.07.008
Basterretxea, G., Tovar-Sanchez, A., Beck, A. J., Masqué, P., Bokuniewicz, H. J., Coffey, R. J., et al. (2010). Submarine groundwater discharge to the coastal environment of a Mediterranean Island (Majorca, Spain): ecosystem and biogeochemical significance. Ecosystems 13, 629–643. doi: 10.1007/s10021-010-9334-5
Billen, G., and Garnier, J. (2007). River basin nutrient delivery to the coastal sea: assessing its potential to sustain new production of non-siliceous algae. Mar. Chem. 106, 148–160. doi: 10.1016/j.marchem.2006.12.017
Bird, E. C. F. (2011). Coastal Geomorphology: An Introduction. Chichester, UK: John Wiley and Sons Ltd, The Atrium, Southern Gate.
Blythe, J. N., Da Silva, J. C. B., and Pineda, J. (2011). Nearshore, seasonally persistent fronts in sea surface temperature on Red Sea tropical reefs. ICES J. Mar. Sci. 68, 1827–1832. doi: 10.1093/icesjms/fsr109
Bowen, J., and Valiela, I. (2001). Ecological effects of urbanization of coastal watersheds: historical increases in nitrogen loads and eutrophication of Waquoit Bay estuaries. Can. J. Fish. Aquat. Sci. 58, 1489–1500. doi: 10.1139/f01-094
Brink, K. H., Bane, J. M., Church, T. M., Fairall, C. W., Geernaert, G. L., Hammond, D. E., et al. (1992). Coastal ocean processes: a science prospectus. WHOI 9, 2–18. doi: 10.1575/1912/803
Camp, J., Flo, E., Vila, M., Arin, L., Reé, A., Sampedro, N., et al. (2016). “Pros and cons of biological quality element phytoplankton as a water-quality indicator in the NW Mediterranean Sea,” in Experiences From Ground, Coastal and Transitional Water Quality Monitoring: The EU Water Framework Directive Implementation in the Catalan River Basin District (Part II), eds A. Munné, A. Ginebreda and N. Prat (Cham: Springer International Publishing), 135–160.
Chisholm, S. W. (1992). “Phytoplankton size,” in Primary Productivity and Biogeochemical Cycles in the Sea, eds P. G. Falkowski, A. D. Woodhead, and K. Vivirito (Boston, MA: Springer), 213–237.
Clarke, K. R., Somerfield, P. J., and Chapman, M. G. (2006). On resemblance measures for ecological studies, including taxonomic dissimilarities and a zero-adjusted Bray–Curtis coefficient for denuded assemblages. J. Exp. Mar. Biol. Ecol. 330, 55–80. doi: 10.1016/j.jembe.2005.12.017
Cloern, J. E., and Jassby, A. D. (2010). Patterns and scales of phytoplankton variability in estuarine–coastal ecosystems. Estuaries Coasts 33, 230–241. doi: 10.1007/s12237-009-9195-3
Colella, S., Falcini, F., Rinaldi, E., Sammartino, M., and Santoleri, R. (2016). Mediterranean ocean colour Chlorophyll trends. PLoS ONE 11:e0155756. doi: 10.1371/journal.pone.0155756
Corcoran, A. A., and Shipe, R. F. (2011). Inshore–offshore and vertical patterns of phytoplankton biomass and community composition in Santa Monica Bay, CA (USA). Estuar. Coast. Shelf Sci. 94, 24–35. doi: 10.1016/j.ecss.2011.05.007
Crooks, S., Herr, D., Tamelander, J., Laffoley, D., and Vandever, J. (2011). “Mitigating climate change through restoration and management of coastal wetlands and near-shore marine ecosystems: challenges and opportunities,” in Environment Department Papers, ed M. E. Series (Washington, DC: World Bank), 121.
De Cáceres, M., Legendre, P., and He, F. (2013). Dissimilarity measurements and the size structure of ecological communities. Methods Ecol. Evol. 4, 1167–1177. doi: 10.1111/2041-210X.12116
Edwards, A. M., Wright, D. G., and Platt, T. (2004). Biological heating effect of a band of phytoplankton. J. Mar. Syst. 49, 89–103. doi: 10.1016/j.jmarsys.2003.05.011
EEA (2002). Corporate Document No 1/2003. EEA Annual Report. Luxembourg: Office for Official Publications of the European Communities, 2003.
Eisma, D. (1982). “Nearshore water characteristics,” in Beaches and Coastal Geology, The Encyclopedia of Beaches and Coastal Environments, ed S. Maurice (Boston, MA: Springer), 568–569.
Eppley, R. W., Reid, F. M. H., and Strickland, J. D. H. (1970). Estimates of phytoplankton crop size, growth rate and primary production. Bull. Scripps Inst. Oceanogr. 17, 33–42.
Fernandez-Ruiz, L. (2012). Las aguas Subterráneas en la Planificación Hidrogeológica. Madrid: IGME, 481.
Flo, E., Garcés, E., Manzanera, M., and Camp, J. (2011). Coastal inshore waters in the NW Mediterranean: physicochemical and biological characterization and management implications. Estuar. Coast. Shelf Sci. 93, 279–289. doi: 10.1016/j.ecss.2011.04.002
Garcés, E., and Camp, J. (2012). “Habitat changes in the Mediterranean Sea and the consequences for Harmful Algal Blooms formation,” in Life in the Mediterranean Sea: A Look at Habitat Changes, ed N. Stambler (New York, NY: Nova Science Publishers, Inc.), 519–541.
Garcés, E., Masó, M., and Camp, J. (1999). A recurrent and localized dinoflagellate bloom in a Mediterranean beach. J. Plankton Res. 21, 2373–2391. doi: 10.1093/plankt/21.12.2373
García-Ruiz, J. M., López-Moreno, J. I., Vicente-Serrano, S. M., Lasanta–Martínez, T., and Beguería, S. (2011). Mediterranean water resources in a global change scenario. Earth Sci. Rev. 105, 121–139. doi: 10.1016/j.earscirev.2011.01.006
Gasol, J. M., and DelGiorgio, P. A. (2000). Using flow cytometry for counting natural planktonic bacteria and understanding the structure of planktonic bacterial communities. Sci. Mar. 64, 197–224. doi: 10.3989/scimar.2000.64n2197
Gaylord, B., Reed, D., Raimondi, P., Washburn, L., and McLean, S. (2002). A physically based model of macroalgal spore dispersal dispersal in the wave and current-dominated nearshore. Ecology 83, 1239–1251. doi: 10.1890/0012-9658(2002)083[1239:APBMOM]2.0.CO;2
Jordi, A., Basterretxea, G., and Wang, D.-P. (2011). Local versus remote wind effects on the coastal circulation of a microtidal bay in the Mediterranean Sea. J. Mar. Syst. 88, 312–322. doi: 10.1016/j.jmarsys.2011.05.007
Kalikhman, I. (2001). Patchy distribution fields: sampling distance unit and reconstruction adequacy. ICES J. Mar. Sci. 58, 1184–1194. doi: 10.1006/jmsc.2001.1106
Kaplan, D. M., Largier, J. L., Navarrete, S., Gui-ez, R., and Castilla, J. C. (2003). Large diurnal temperature fluctuations in the nearshore water column. Estuar. Coast. Shelf Sci. 57, 385–398. doi: 10.1016/S0272-7714(02)00363-3
Kim, S. Y., Cornuelle, B. D., and Terrill, E. J. (2009). Anisotropic response of surface currents to the wind in a coastal region. J. Phys. Oceanogr. 39, 1512–1533. doi: 10.1175/2009JPO4013.1
Kolmogorov, A. N. (1962). A refinement of previous hypotheses concerning the local structure of turbulence in a viscous incompressible fluid at high Reynolds number. J. Fluid Mech. 13, 82–85. doi: 10.1017/S0022112062000518
Legendre, P., and Gallagher, E. D. (2001). Ecologically meaningful transformations for ordination of species data. Oecologia 129, 271–280. doi: 10.1007/s004420100716
Li, W. K. W. (2002). Macroecological patterns of phytoplankton in the northwestern North Atlantic Ocean. Nature 419, 154–157. doi: 10.1038/nature00994
Litchman, E., Klausmeier, C. A., Miller, J. R., Schofield, O. M., and Falkowski, P. G. (2006). Multi-nutrient, multi-group model of present and future oceanic phytoplankton communities. Biogeosciences 3, 585–606. doi: 10.5194/bg-3-585-2006
Lucas, A. J., Dupont, C. L., Tai, V., Largier, J. L., Palenik, B., and Franks, P. J. S. (2011). The green ribbon: multiscale physical control of phytoplankton productivity and community structure over a narrow continental shelf. Limnol. Oceanogr. 56, 611–626. doi: 10.4319/lo.2011.56.2.0611
Ludwig, W., Dumont, E., Meybeck, M., and Heussner, S. (2009). River discharges of water and nutrients to the Mediterranean and Black Sea: major drivers for ecosystem changes during past and future decades? Prog. Oceanogr. 80, 199–217. doi: 10.1016/j.pocean.2009.02.001
Mao, Y., Lei, C., and Patterson, J. (2010). Unsteady near-shore natural convection induced by surface cooling. J. Fluid Mech. 642, 213–233. doi: 10.1017/S0022112009991765
Marañón, E. (2015). Cell size as a key determinant of phytoplankton metabolism and community structure. Ann. Rev. Mar. Sci. 7, 241–264. doi: 10.1146/annurev-marine-010814-015955
Marañón, E., Cermeño, P., López-Sandoval, D. C., Rodríguez-Ramos, T., Sobrino, C., Huete-Ortega, M., et al. (2013). Unimodal size scaling of phytoplankton growth and the size dependence of nutrient uptake and use. Ecol. Lett. 16, 371–379. doi: 10.1111/ele.12052
Margalef, R. (1963). On certain unifying principles in ecology. Am. Nat. 97, 357–374. doi: 10.1086/282286
Margalef, R. (1967). Some Concepts Relative to the Organization of Plankton. Oceanography and Marine Biology: An Annual Review. London: Aberdeen University Press; Allen & Unwin.
McManus, M. A., and Woodson, C. B. (2012). Plankton distribution and ocean dispersal. J. Exp. Biol. 215, 1008–1016. doi: 10.1242/jeb.059014
McPhee-Shaw, E. E., Siegel, D. A., Washburn, L., Brzezinski, M. A., Jones, J. L., Leydecker, A., et al. (2007). Mechanisms for nutrient delivery to the inner shelf: observations from the Santa Barbara Channel. Limnol. Oceanogr. 52, 1748–1766. doi: 10.4319/lo.2007.52.5.1748
Menden-Deuer, S., and Lessard, E. J. (2000). Carbon to volumen relationships for dinoflagellates, diatoms, and other protist plankton. Limnol. Ocanogr. 45, 569–579. doi: 10.4319/lo.2000.45.3.0569
Monismith, S. G., Genin, A., Reidenbach, M. A., Yahel, G., and Koseff, J. R. (2006). Thermally driven exchanges between a coral reef and the adjoining ocean. J. Phys. Ocean. 36, 1332–1347. doi: 10.1175/JPO2916.1
Monismith, S. G., Imberger, J., and Morison, M. L. (1990). Convective motions in the sidearm of a small reservoir. Limnol. Oceanogr. 35, 1676–1702. doi: 10.4319/lo.1990.35.8.1676
Montagnes, D. J. S., Berges, J. A., Harrison, P. J., and Taylor, F. J. R. (1994). Estimating carbon, nitrogen, protein, and chlorophyll a from volume in marine phytoplankton. Limnol. Oceanogr. 39, 1044–1060. doi: 10.4319/lo.1994.39.5.1044
Oboukhov, A. M. (1962). Some specific features of atmospheric tubulence. J. Fluid Mech. 13, 77–81. doi: 10.1017/S0022112062000506
Raimbault, P., Taupier-Letage, I., and Rodier, M. (1988). Vertical size distribution of phytoplankton in the western Mediterranean Sea during early summer. Mar. Ecol. Prog. Ser. 45, 153–158. doi: 10.3354/meps045153
Ramp, S. R., Garwood, R. W., Davis, C. O., and Snow, R. L. (1991). Surface heating and patchiness in the coastal ocean off central California during a wind relaxation event. J. Geophys. Res. Oceans 96, 14947–14957. doi: 10.1029/91JC01140
Rodellas, V., Garcia-Orellana, J., Masqué, P., and Font-Muñoz, J. S. (2015). The influence of sediment sources on radium-derived estimates of submarine groundwater discharge. Mar. Chem. 171, 107–117. doi: 10.1016/j.marchem.2015.02.010
Rodellas, V., Garcia-Orellana, J., Tovar-Sánchez, A., Basterretxea, G., López-Garcia, J. M., Sánchez-Quiles, D., et al. (2014). Submarine groundwater discharge as a source of nutrients and trace metals in a Mediterranean bay (Palma Beach, Balearic Islands). Mar. Chem. 160, 56–66. doi: 10.1016/j.marchem.2014.01.007
Rodríguez, J., Blanco, J. M., Jiménez-Gómez, F., Echevarri A. F., Gil, J., RodriGuez, F., et al. (1998). Patterns in the size structure of the phytoplankton community in the deep fluorescence maximum of the Alboran Sea (Southwestern Mediterranean). Deep Sea Res. Oceanogr. Res. Papers 45, 1577–1593. doi: 10.1016/S0967-0637(98)00030-2
Roy, C., Cury, P., and Kifani, S. (1992). Pelagic fish recruitment success and reproductive strategy in upwelling areas: environmental compromises. S. Afr. J. Mar. Sci. 12, 135–146. doi: 10.2989/02577619209504697
Sempéré, R., Charrière, B., Van Wambeke, F., and Cauwet, G. (2000). Carbon inputs of the Rhône river to the Mediterranean sea: biogeochemical implications. Glob. Biogeochem. Cycles 14, 669–681. doi: 10.1029/1999GB900069
Siegel, D. A., Mitarai, S., Costello, C. J., Gaines, S. D., Kendall, B. E., Warner, R. R., et al. (2008). The stochastic nature of larval connectivity among nearshore marine populations. Proc. Natl. Acad. Sci. U.S.A. 105, 8974–8979. doi: 10.1073/pnas.0802544105
Stefan, H. G., Horsch, G. M., and Barko J. W. (1989). A model for the estimation of convective exchange in the littoral region of a shallow lake during cooling. Hydrobiologia 174, 225–234.
Stoecker, D. K. (1999). Mixotrophy among dinoflagellates. J. Eukar. Microbiol. 46, 397–401. doi: 10.1111/j.1550-7408.1999.tb04619.x
Stolte, W., and Garcés, E. (2006). “Ecological aspects of harmful algal in situ population growth rates,” in Ecology of Harmful Algae, eds E. Granéli and J. T. Turner (Berlin; Heidelberg: Springer), 139–152.
Tovar-Sánchez, A., Basterretxea, G., Rodellas, V., Sánchez-Quiles, D., García-Orellana, J., Masqué, P., et al. (2014). Contribution of groundwater discharge to the coastal dissolved nutrients and trace metal concentrations in Majorca Island: karstic vs detrital systems. Environ. Sci. Technol. 48, 11819–11827. doi: 10.1021/es502958t
Valiela, I., Costa, J., Foreman, K., Teal, J. M., Howes, B., and Aubrey, D. (1990). Transport of groundwater-borne nutrients from watersheds and their effects on coastal waters. Biogeochemistry 10, 177–197. doi: 10.1007/BF00003143
van Gennip, S., Martin, A. P., Srokosz, M. A., Allen, J. T., Pidcock, R., Painter, S. C., et al. (2016). Plankton patchiness investigated using simultaneous nitrate and chlorophyll observations. J. Geophys. Res. 121, 4149–4156. doi: 10.1002/2016JC011789
Verdy, A., Follows, M. J., and Flierl, G. (2009). Optimal phytoplankton cell size in an allometric model. Mar. Ecol. Prog. Ser. 379, 1–12. doi: 10.3354/meps07909
Wyatt, T., and Zingone, A. (2014). Population dynamics of red tide dinoflagellates. Deep Sea Res. Topical Stud. Oceanogr. 101, 231–236. doi: 10.1016/j.dsr2.2013.09.021
Keywords: plankton, nearshore marine ecosystems, coastal transition zone, microalgal blooms, fine-scale variability
Citation: Basterretxea G, Torres-Serra FJ, Alacid E, Anglès S, Camp J, Ferrera I, Flo E, Font-Muñoz JS, Jordi A, Reñé A, Salgado-Hernanz PM, Sampedro N and Garcés E (2018) Cross-Shore Environmental Gradients in the Western Mediterranean Coast and Their Influence on Nearshore Phytoplankton Communities. Front. Mar. Sci. 5:78. doi: 10.3389/fmars.2018.00078
Received: 25 October 2017; Accepted: 21 February 2018;
Published: 18 April 2018.
Edited by:
Marta Álvarez, Instituto Español de Oceanografía (IEO), SpainReviewed by:
Yantao Liang, Qingdao Institute of Bioenergy and Bioprocess Technology (CAS), ChinaOnur Kerimoglu, Helmholtz-Zentrum Geesthacht Zentrum für Material- und Küstenforschung, Germany
Francisco G. Figueiras, Instituto de Investigaciones Marinas (CSIC), Spain
Copyright © 2018 Basterretxea, Torres-Serra, Alacid, Anglès, Camp, Ferrera, Flo, Font-Muñoz, Jordi, Reñé, Salgado-Hernanz, Sampedro and Garcés. This is an open-access article distributed under the terms of the Creative Commons Attribution License (CC BY). The use, distribution or reproduction in other forums is permitted, provided the original author(s) and the copyright owner are credited and that the original publication in this journal is cited, in accordance with accepted academic practice. No use, distribution or reproduction is permitted which does not comply with these terms.
*Correspondence: Gotzon Basterretxea, gotzon@imedea.uib-csic.es