Corals and Their Microbiomes Are Differentially Affected by Exposure to Elevated Nutrients and a Natural Thermal Anomaly
 Lu Wang1
  Andrew A. Shantz2
  Jérôme P. Payet1,3
  Thomas J. Sharpton1,4
  Amelia Foster1
  Deron E. Burkepile2
  Rebecca Vega Thurber1*
- 1Department of Microbiology, Oregon State University, Corvallis, OR, United States
- 2208 Mueller Laboratory, Department of Biology, The Pennsylvania State University, University Park, PA, United States
- 3College of Earth, Ocean, and Atmospheric Science, Oregon State University, Corvallis, OR, United States
- 4Department of Statistics, Oregon State University, Corvallis, OR, United States
Nutrient pollution can increase the prevalence and severity of coral disease and bleaching in ambient temperature conditions or during experimental thermal challenge. However, there have been few opportunities to study the effects of nutrient pollution during natural thermal anomalies. Here we present results from an experiment conducted during the 2014 bleaching event in the Florida Keys, USA, that exposed Agaricia sp. (Undaria) and Siderastrea siderea corals to 3 types of elevated nutrients: nitrogen alone, phosphorous alone, and the combination of nitrogen and phosphorus. Overall, bleaching prevalence and severity was high regardless of treatment, but nitrogen enrichment alone both prolonged bleaching and increased coral mortality in Agaricia corals. At the same time, the elevated temperatures increased the prevalence of Dark Spot Syndrome (DSS), a disease typically associated with cold temperatures in Siderastrea siderea corals. However, nutrient exposure alone did not increase the prevalence or severity of disease, suggesting that thermal stress overwhelms the effects of nutrient pollution on this disease during such an extreme thermal event. Analysis of 78 Siderastrea siderea microbial metagenomes also showed that the thermal event was correlated with significant shifts in the composition and function of the associated microbiomes, and corals with DSS had microbiomes distinct from apparently healthy corals. In particular, we identified shifts in viral, archaeal, and fungal families. These shifts were likely driven by the extreme temperatures or other environmental co-variates occurring during the 2014 bleaching event. However, no microbial taxa were correlated with signs of DSS. Furthermore, although nutrient exposure did not affect microbial alpha diversity, it did significantly affect microbiome beta-diversity, an effect that was independent of time. These results suggest that strong thermal anomalies and local nutrient pollution both interact and act independently to alter coral health in a variety of ways, that ultimately contribute to disease, bleaching, and mortality of reefs in the Florida Keys.
Introduction
Ocean warming and coastal pollution are two of the most widespread threats to coral reefs. Increases in sea surface temperatures of just a few degrees can exceed the thermal tolerance of many tropical corals, causing coral bleaching and warm-water associated epizootics that together threaten up to one-third of all coral species (Carpenter et al., 2008). Although it has been widely publicized that the frequency of coral bleaching will increase over the coming century (e.g., Magris et al., 2015; van Hooidonk et al., 2016), increasing frequency and severity of coral diseases may pose a greater threat to reefs than bleaching events (Maynard et al., 2015). At the same time, nutrient enrichment in nearshore waters is one of the major anthropogenic forces altering coastal ecosystems (Halpern et al., 2008) and can drive the increased prevalence of coral diseases and bleaching on reefs worldwide (Vega Thurber et al., 2014; Maynard et al., 2015). For example, field surveys suggest that the prevalence of coral disease is often correlated with nutrient concentrations (Haapkylä et al., 2011; Kaczmarsky and Richardson, 2011).
While the effects of coastal nutrient pollution on bleaching tolerance and disease have garnered a great deal of interest (e.g., Bruno et al., 2003; Wooldridge and Done, 2009; Wagner et al., 2010; Vega Thurber et al., 2014; Wooldridge, 2016), little is known about the interactions between nutrients, temperature stress, and coral diseases. Troublingly, large increases in coastal nitrogen loading are projected to occur alongside ocean warming as a result of climate change (Sinha et al., 2017), adding urgency to our need to understand the interactive effects of nutrients and temperature stress on coral health.
Nitrogen (primarily as nitrate) and phosphorus are two major nutrient pollutants in terrestrial run-off (Howarth, 2008), and the effects of each of these nutrients on coral physiology are distinct. Enrichment with nitrogen causes Symbiodinium to rapidly proliferate (Hoegh-Guldberg and Smith, 1989; Muscatine et al., 1989; Marubini and Davies, 1996; Cunning and Baker, 2013), disrupting the translocation of nutrients between Symbiodinium and their coral hosts, and thus compromising the animal's energy budget (Shantz et al., 2016). Furthermore, nitrogen enrichment can result in limitation of other important nutrients. For example, nitrogen-induced phosphorus limitation is linked to reduced thermal tolerance in corals (Wiedenmann et al., 2013). Because the ability of corals to survive bleaching events is influenced by, among other things, a coral's energy reserves (Schoepf et al., 2015), nitrogen enrichment also reduces coral resilience in the face of bleaching events by jeopardizing coral energy budgets.
In contrast, surplus phosphorus increases stress tolerance in corals (e.g., Beraud et al., 2013; Wiedenmann et al., 2013). Under typical conditions, the impacts of phosphorus enrichment on coral physiology are small (Shantz and Burkepile, 2014; Ferrier-Pagès et al., 2016). However, under thermal stress, phosphorus uptake rates increase as phosphorus is required to maintain symbiont density, photosynthesis, and carbon translocation (Ezzat et al., 2016). Thus, while coastal pollution can impact coral physiology, the interactive effects of pollution and warming are likely mediated by the ratio of nitrogen:phosphorus delivered to the environment.
Less is known about the relative impacts of nitrogen and phosphorus on coral diseases, such as Dark Spot Syndrome (DSS) in scleractinian corals. DSS is one of the most common diseases of corals in the Florida Keys, representing 71% of all diseased corals and typically afflicting 26% of Montastrea annularis colonies and 8% of Siderastrea siderea colonies on most reefs (Porter et al., 2011). DSS is identified by darkened pigmentation of the coral tissue resulting in purple, black, or brown lesions that can either be circular or elongate (Weil, 2004; Gochfeld et al., 2006). A necrotizing disease, DSS can cause affected tissues to die at a rate of 4.0 cm/month in S. siderea corals (Cervino et al., 2001). Though it is often not obviously deleterious to whole coral colonies, it is a known marker for more aggressive diseases such as Black Band Disease and Yellow Band Disease (Richardson, 1998; Cervino et al., 2001). Additionally, DSS affected corals are more likely to bleach than their healthy counterparts (Brandt and McManus, 2009).
Nutrient loading increases the severity of coral diseases (e.g., Bruno et al., 2003; Voss and Richardson, 2006) and in some instances, may cause disease outbreaks. For example, Vega Thurber et al. (2014) showed that combined nitrogen and phosphorus enrichment increased both the severity and frequency of DSS in S. siderea, an abundant coral on reefs in Florida. Substantial evidence exists showing that nutrient enrichment drives changes in the microbial communities associated with corals (e.g., Thompson et al., 2015; Zaneveld et al., 2016; Shaver et al., 2017), and these changes are often associated with increases in pathogenic bacteria and the appearance of disease signs (for review see, McDevitt-Irwin et al., 2017). However, the relative role of nitrogen vs. phosphorus in shaping disease susceptibility and the coral microbiome is currently underexplored. To date, we are not aware of any studies that have investigated how phosphorus modifies the susceptibility of corals to diseases.
In the summer of 2014, an anomalous thermal event occurred in the Florida Keys, providing the opportunity to study how nutrient pollution interacted with thermal stress to impact coral bleaching and disease. We evaluated how increases in two nutrients (nitrate and phosphate) separately and in combination can exacerbate the effects of thermal stress on coral disease and bleaching. To test this question, we exposed individuals of two species of corals, Siderastrea siderea, and Agaricia sp. (Undaria) in the field to nitrogen alone, phosphorus alone, and the combination of each, in addition to control corals with no nutrients, for 6 months while following the visual health of corals throughout the experiment. Furthermore, we evaluated the microbial ecology of the control and exposed corals before, during, and after nutrient enrichment and thermal stress.
Methods
Nutrient Enrichment Experimental Design
To evaluate the effects of nutrient enrichment on natural coral colonies, we conducted an in situ nutrient enrichment experiment at Pickles Reef (N24.99430, W80.40650) in the Florida Keys from July 14th 2014 to January 12th 2015 (Figure 1). Along two 30 m transects, approximately 20 m apart, at a depth of ca. 5–6 m, we haphazardly selected 20 Agaricia sp. (Undaria) and 20 Siderastrea siderea colonies at least 10 cm2 in area and visually deemed to be in good health. Individual coral colonies were randomly assigned to a nutrient treatment with either (1) nitrogen and phosphorus, (2) nitrogen, (3) phosphorus, or (4) left untreated to serve as controls, with five replicates per treatment.
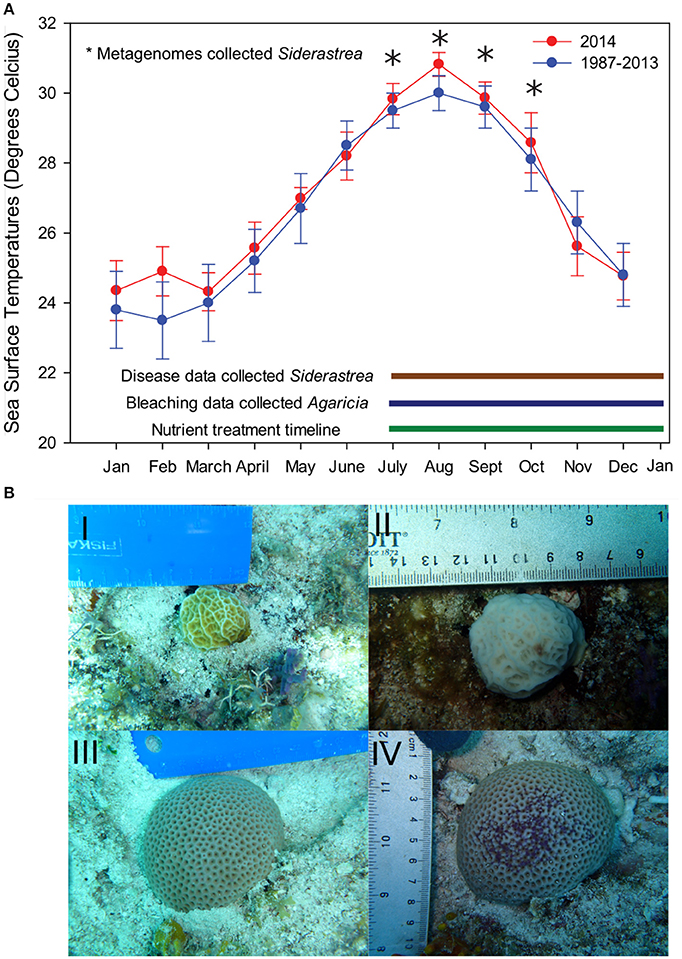
Figure 1. Experimental design and temperature profile from field site. (A) Data from NOAA Molasses buoy show that mean monthly sea surface temperatures in 2014 were significantly elevated both in the winter and summer months (red lines) compared to the monthly means from 1987–2008 (blue lines). Error bars indicate the standard error of means of all temperature data available for that month. (B) During this summer, we monitored control and nutrient exposed Agaricia corals for bleaching prevalence, severity, and recovery as well as tissue loss from July (pretreatment) to January 2015. Photos I and II represent Agaricia corals from July and September, respectively. Siderastrea control and nutrient exposed corals were also monitored for disease prevalence and severity across the course of the experiment. Photos III and IV represent Siderastrea corals from July and September, respectively. Siderastrea mucus samples for metagenomes (indicated by the stars) were only collected at the pretreatment time point (July 14, 2014) and three post treatment months: August 13th, Sept 14, and October 14th.
To achieve our enrichments, we deployed nutrient diffusers constructed from PVC pipes with holes drilled throughout that were filled with either slow-release nitrate (150 g, 12% NO3), phosphate (45 g, 40% PO4), or both, and wrapped in mesh as described in Zaneveld et al. (2016, Supplementary Figure 1). We stationed each nutrient diffuser 10 cm from the target coral, and replaced the fertilizer monthly. We have successfully used this method in the past to enrich sections of the reef (e.g., Vega Thurber et al., 2014; Zaneveld et al., 2016). Water column NO3 and PO4 concentrations collected near the diffusers 24 h after deployment were ca. 4.5- and 2.4-fold higher in N and P respectively than concentrations at control sites (3.18 μM NO3 and 0.34 μM PO4 vs. 0.71 μM NO3 and 0.14 μM PO4). Per previous experiments, the nutrients from these apparatuses were shown to diffuse within approximately 1 m from the experimental area.
Disease and Bleaching Surveys
From July 2014 to January 2015, corals were surveyed monthly by SCUBA to track changes in their health throughout the course of the experiment (Supplementary Table 1). For each coral, divers recorded whether bleaching or disease symptoms were visually present and photographed the coral from a fixed position with an object of known length. Using ImageJ (v1.50), we analyzed photos from each monthly survey to estimate the total surface area of each coral, as well as the area of each colony afflicted by disease or bleaching (Abramoff et al., 2004). A portion of a coral was considered bleached when it no longer retained any pigmentation and the white coral skeleton was visible through the tissue. Bleached or diseased areas were divided by total surface area to calculate the percentage of the total colony surface afflicted as measures for disease and bleaching severity. In addition, tissue mortality was estimated from each coral by comparing the area of live tissue on each coral with the coral's initial live tissue area from our pre-treatment surveys. At the end of our final round of surveys in January, we also estimated bleaching recovery as the proportion of bleached tissue that had regained pigmentation. Although we recorded both bleaching and disease measurements for both coral species, here we only report measurements of DSS in S. siderea and bleaching in Agaricia sp.; only a single colony of Agaricia sp. ever showed disease, and only a single S. siderea colony showed signs of bleaching (data not shown).
Coral Mucus and Seawater Sampling
Coral mucus from each colony, as well as seawater samples, were collected by divers at four time points to generate microbial metagenomes. A pretreatment sample was collected in July of 2014, followed by monthly samples in August, September, and October. To investigate the role of microbes and viruses in the etiology of DSS, metagenomes were only made for the Siderastrea siderea corals. Agaricia sp. (Undaria) mucus samples were not explored using metagenomes due to the high mortality rate of our Agarcia specimen that ultimately resulted in low replication over time and treatment.
Surface coral mucus was collected by gently agitating the colony surface with a sterile syringe, as detailed in Zaneveld et al. (2016). Specifically, on all corals, we agitated the top of the animal, collecting mucus across the entire surface. We chose to sample mucus due to the benign effect of sampling upon the coral, and due to its role in providing a barrier for the coral from pathogens (Zaneveld et al., 2016). Mucus samples were brought back to the boat, where they were transferred into sterile 15 mL falcon tubes, immediately frozen on dry-ice for transport, and then stored at −80°C prior to nucleic acid extraction. Seawater samples were collected in duplicate 50 mL falcon tubes from 1 m above each transect and stored frozen as described above.
We also used mucus samples from a previous enrichment experiment (Zaneveld et al., 2016) to generate comparative S. sideraea metagenomes. In August of 2012, 25 apparently healthy and 25 DSS afflicted corals were selected from within control and nutrient enriched plots. In this enrichment experiment, only combined nitrogen and phosphorus was used to mimic nutrient pollution (for details see Vega Thurber et al., 2014). Mucus samples were collected in the same manner as described above and processed in the exact same manner for metagenome generation and analysis as described below.
Microbial Metagenome Library Generation and Sequencing
Thawed mucus and seawater samples were pre-filtered through 5.0 μm pore-size EMD Millipore Millex (Millipore) syringe filters to remove larger particles. Viral and microbial size-particles from resulting filtrates were further concentrated using the 30 kDa cutoff Amicon Ultra-15 centrifugal filter units (Millipore). DNA from microbial concentrates was then extracted using the MasterPure Complete DNA purification kit (Epicenter, Illumina). Purified DNA extracts served as input for the NexteraXT DNA library preparation (Illumina) to generate multiplexed metagenome libraries for high-throughput sequencing, following the manufacturer's recommendations. Multiplexed sample libraries were cleaned using AMPure XP magnetic beads (Agencourt) and checked for quality and size distribution on a Bioanalyzer 2100 (Agilent), prior to being pooled in equimolar concentrations for sequencing. Whole genome shotgun sequencing was conducted on the HiSeq2000 platform (Illumina) at the CGRB facility at the Oregon State University, yielding 2 × 100 bp long paired-end reads. This approach resulted in 86 metagenomes including 6 seawater samples, and 80 coral metagenomes that spanned 4 time points, 4 treatments, and 5 replicate colonies per treatment (Supplementary Table 2). Two metagenomes were removed from the analysis due to their low number of reads and one seawater sample from August and one seawater sample from September were lost during shipment. The resulting 84 metagenomes had an average of 4,753,686 reads, with about 77% of reads remaining after quality-control. These metagenomes are freely and publicly available online at the Sequence Read Archive (SRA; #SRP133535 for the 2014 metagenomes and #SRP133699 for the 2012 metagenomes) and our own websites: http://files.cgrb.oregonstate.edu/Thurber_Lab/NOAA_SSids/, and http://files.cgrb.oregonstate.edu/Thurber_Lab/DSS/.
Bioinformatic Analyses of Metagenomic Data
We used the program Shotcleaner (https://github.com/sharpton/shotcleaner) to filter out host and symbiont sequences and low-quality reads with quality scores below 25. This program also trimmed Illumina adapters and combined duplicate sequences. Shotcleaner is a workflow program that integrates an ensemble of programs such as Trimmomatic v0.35 (Bolger et al., 2014), Bowtie2 v 2.3.2 (Langmead and Salzberg, 2012), and FastQC (Andrews, 2010). For this analysis, the coral, Acropora digitifera (RefSeq NW_015441057.1) was used as the reference host, as the Siderastrea siderea genome is not currently available. Sequences from the coral endosymbiont Symbiodinium were filtered out using the Symbiodinium minutum genome (GenBank DF242864.1). Host and symbiont genomic reads were filtered out using Bowtie2, which aligned the metagenome reads to the host and symbiont genomes. Bowtie2 was run using default “end-to-end” parameters set to “-sensitive.” In short, both the read and its reverse complement were aligned end-to-end to the host and symbiont genomes. Mismatch penalties ranged from a minimum of 2 and a maximum of 6, depending on the quality value of the read character. A lower quality score would lead to a lower penalty to the overall alignment score in the case of a mismatch. Gap penalties were 5 to open a gap, and 3 for a gap extension, for both the read and reference sequences.
We used the program Kraken (v.0.10.5) to conduct taxonomic assignment of the filtered metagenomics reads (Wood and Salzberg, 2014). Paired-end reads were analyzed using the “--paired” option, which concatenates the pair and increases classification sensitivity (Wood and Salzberg, 2014). Then a custom MiniKraken database was built, comprising all Archaea, Bacteria, Fungi, Protozoans and Viruses RefSeq released genomes, using the k-mer length of 25. The resulting database contained all k-mers and the lowest common ancestor of genomes that possess any particular k-mer. Annotations were made by alignment of metagenomic reads to k-mers in the database. The Kraken output was then transformed into a taxonomy table using kraken-translate, with the option “--mpa-format.”
We also used the program ShotMAP for functional annotations (Nayfach et al., 2015). ShotMAP utilizes Prodigal (https://doi.org/10.1186/1471-2105-11-119) to predict genes in unassembled shotgun reads ab initio, and compares the predicted protein coding sequences against a protein family database using alignment algorithms. For this analysis, KEGG (release 73.1) was used as the reference database (Kanehisa and Goto, 2000). ShotMAP was run using the option “–ags-method none,” as the genome size estimation tool was not compatible with this dataset. ShotMAP outputs for all 85 metagenomes were combined using compare_shotmap_samples.pl.
ShotMAP outputs were sorted by KEGG identification numbers and grouped via KEGG BRITE functional hierarchies to level B (excluding the categories drug development, human diseases, and organismal systems). Given that KEGG ID numbers are often associated with multiple pathways, we calculated the ratio of the average count of unique KEGG IDs in a pathway and the sum of unique average counts for that KEGG ID in all pathways. The average count of unique KEGG IDs is the average count of all instances in each sample in which a pathway is associated with a unique KEGG ID. The original counts in the ShotMAP output count table were then replaced with the new unique average counts.
The unique averages were summed for each KEGG ID (added up unique averages of all pathways that are assigned to that KEGG ID). Then, the unique average of each pathway assigned to a KEGG ID was divided by the sum of unique averages of pathways in that KEGG ID. This determines which pathways are more abundant in the metagenomes, relative to all other pathways that also were assigned to that KEGG ID. This approach therefore results in a ratio that determines how well-represented a pathway is relative to other pathways associated with that KEGG ID in the sampling environment. The unique average count/sum of unique average count ratios for each KEGG pathway were used for all subsequent analysis and statistics.
Statistical Analyses for Environmental and Metagenomic Data
Comparisons of mean monthly temperature data from the NOAA Molasses Buoy (a station approximately 5 km from the experimental site) in the Upper Florida Keys were performed using a Kruskal-Wallis and Dunn's post-hoc test in SigmaPlot Version 11 (Supplementary Table 3). Differences in bleaching and disease prevalence were analyzed using generalized linear mixed models with a binomial distribution and logit link function in the lme4 package (Bates et al., 2015) in R (R Core Team, 2016). To assess significance, fitted models were tested against a null model that included only time and the random colony effect via likelihood ratio tests.
We analyzed the effects of enrichment on bleaching and disease severity using mixed-effects models. For these models, we used the logit-transformed severity scores as the response variable and included nitrogen, phosphorus, and date as interacting fixed factors and a random effect for coral colony. When significant effects were present, we conducted Tukey's post-hoc analyses using the glht() function in the multicomp package (Hothorn et al., 2008). Treatment and time were considered fixed effects, and a random effect was included for coral colonies. For analyses of bleaching and disease prevalence and severity, we excluded July data points, as July was the start of the experiment and corals were deliberately selected to have no signs of disease or bleaching. Additionally, we used data from our final surveys to test for differences in the recovery of bleached tissue and tissue mortality using two-factor ANOVA that included nitrogen and phosphorus enrichments as interacting factors. Both the recovery and mortality data were logit transformed to meet assumptions of parametric statistics.
Prior to statistical analysis, we first normalized metagenomic taxonomic raw results to relative abundance. Differences in taxonomic relative abundance between nutrient treatments and over time were tested using generalized linear mixed models using the lme4 package in R, with treatment and time as fixed effects, and individual corals as random effects (Bates et al., 2015). Post-hoc tests were conducted using the multicomp package in R (Hothorn et al., 2008). Statistical analysis comparing relative abundance of functional pathways found in the metagenomes over time and among treatments were also done as described above. All metagenomic data graphs were visualized using ggplot2 (Wickham, 2009).
We used the indicator species analysis function in Mothur v1.39.3 (Schloss et al., 2009) to generate microbial Operational Taxonomic Units (OTUs) indicative of the microbiome of apparently healthy or diseased S. siderea. We used the indicator() command with a shared OTU table and a design file containing the relevant metadata. An indicator value, ranging from 1 to 100, decides the indicator status of an OTU in a group of pre-determined sites or samples. The indicator value of an OTU is a calculation of its abundance and fidelity in a group of sites (how often the OTU is present in all sites of a group) (Dufrêne and Legendre, 1997). Ten thousand random permutation of sites among groups tests the statistical significance of an OTU's indicator species status. We used a cutoff indicator value of 30 to obtain the strongest indicators of any group. This threshold ensures that an OTU is present in over half of the samples in a group, and that its relative abundance in that group is at least 50% (Dufrêne and Legendre, 1997).
To check for effects of time and treatment on microbial diversity indices, alpha and beta-diversity were measured for both time and treatment separately and together using the Phyloseq package in R, with the estimate_richness() function for Chao1 calculations, and the distance() function on normalized data for Bray-Curtis indices (McMurdie and Holmes, 2013). Chao1 values were compared over time and between treatments using Kruskal-Wallis and Dunn's post-hoc test (Supplementary Table 4). Bray-Curtis data were further analyzed using the Adonis function in the Vegan package in R, and post-hoc testing was performed using the RVAideMemoire package using pairwise.perm.manova(), which conducts pairwise tests on matrix data using Adonis (Hervé, 2017; Oksanen et al., 2017).
Results
Time and Treatment Variably Affect Agaricia sp. Bleaching
In 2013–2014, the Florida Keys experienced the warmest winter and summer on record up to that date (Manzello, 2015). These anomalously high temperatures were likely the main driver of the 2014 bleaching event as portions of the Florida Keys, including our study site, reached between 6 and 12 Degree Heating Weeks (NOAA and Coral Reef Watch, 2014; Barnes et al., 2015). Our experiment began on July 14th, 2014, just preceding the NOAA bleaching alert warning for the study area (Figure 1). The average hourly temperature on July 14th was 29.8°C. By August, the Upper Keys surpassed the thermal stress thresholds (max monthly mean sea surface temperature + 1°C) and significant bleaching occurred (Manzello, 2015). During this time, the maximum mean monthly temperature at our site was 30.8 ± 1.1°C in August, with the warmest time point within our experimental time period falling on August 15th at 31.9°C (Figure 1). The mean daily temperature in August was significantly higher than all other months during metagenome sampling (Kruskal Wallis, p < 0.05).
The thermal stress event in 2014 induced severe bleaching in our Agaricia sp. corals (Figure 2). While no corals showed signs of bleaching in July, all corals began to bleach in August. By early September, 100% of the Agaricia sp. corals were bleached to some degree, regardless of nutrient treatment (Figure 2A). However, 4 months later, in January 2015, the control Agaricia sp. corals had mostly recovered with only 1 out of 5 control corals remaining bleached. In contrast, bleaching prevalence in surviving enriched corals remained between 50 and 66% depending on the treatment, however, this effect was not statistically significant [ = 1.475, p = 0.692] Similarly, we were unable to detect an impact of nutrients on bleaching severity in Agaricia sp., as upwards of 90% of the surface area of all colonies were bleached by September (Figure 2B). Interestingly, nitrogen tended to impede recovery of bleached coral tissue (Figure 2C), although differences were not statistically different from other nutrient treatments [F(1, 15) = 4.053, p = 0.06]. Furthermore, reduced recovery in nitrogen alone enriched corals coincided with increased mortality in these corals. By January, mean tissue loss for the control Agaricia was 67 ± 12% vs. 92.5 ± 3.2% of tissue lost in nitrogen alone exposed Agaricia (Figure 2D).
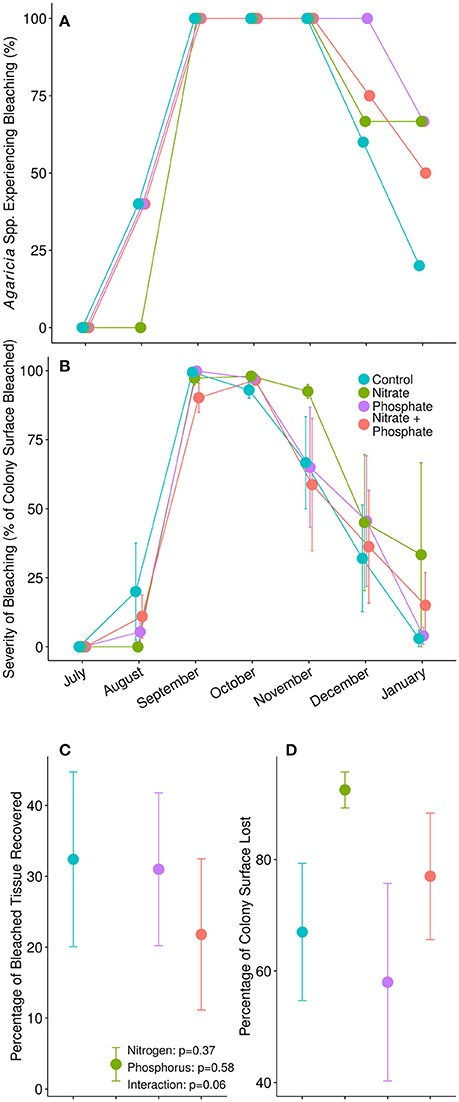
Figure 2. (A) Proportion of Agaricia spp. in each treatment experiencing bleaching during our monthly surveys. (B) The average severity of bleaching, calculated as the percentage of colony surface area with no pigmentation, during each survey point. (C) The average percentage of previously bleached tissue in each colony that had regained pigment and recovered from bleaching by January, 2015. P-values are from a two-factor ANOVA. (D) The average percentage of each coral's surface area that died between pretreatment surveys in July, 2014, and final surveys in January, 2015.
Thermal Stress Associated With Dark Spot Syndrome in Siderastrea siderea
Across all treatments, the average prevalence of DSS in the experimental corals increased from 0% in July, to >40% in August, and peaked at >60% by September (Figure 3A). All of the nitrogen alone and combined nitrogen and phosphorus treated corals exhibited signs of disease by September. By October, half of the diseased corals in the control treatments had recovered (e.g., 80% in September to 40% in October) while more than 60% of the nutrient-enriched corals showed signs of DSS from October until January, suggesting that, like bleaching, nutrient exposure prolongs disease signs (Figure 3A). Overall, while a trend existed, we again did not detect a significant effect of enrichment on DSS prevalence [ = 6.25, p = 0.09].
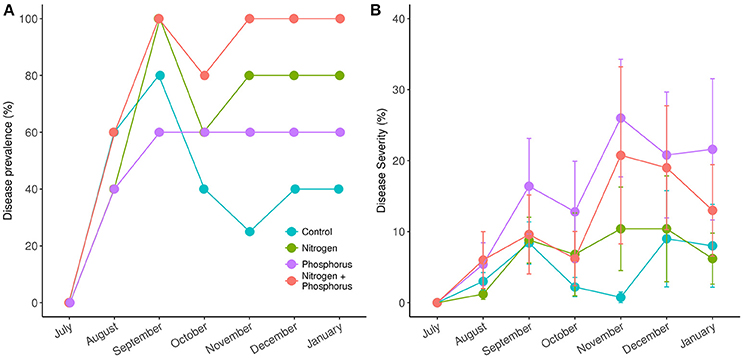
Figure 3. Prevalence (A) and severity (B) of Dark Spot Syndrome in Siderastrea siderea corals during the course of study. Measurements taken in July were taken prior to nutrient treatment, while August, September, and October measurements were taken post treatment. Disease prevalence was calculated as the proportion of diseased individuals at each time point. Disease severity was calculated as the proportion of diseased tissue in each individual.
Throughout the experiment, disease severity was lowest in August (3.9%, p < 0.001) and highest in November (14.9%) and December (14.8%) (Figure 3B). Disease severity in November and December were statistically higher than in August (p < 0.001), September (p = 0.02, p = 0.005), and October (p < 0.001). Amongst treatments, disease severity again tended to be higher in the nutrient exposed corals, with the controls exhibiting the lowest mean disease severity (5.4%) compared to nitrogen alone (7.3%), phosphorus alone (12.1%), and nitrogen and phosphorus combined (17.2%) diseased tissue levels. However, despite a visual trend there were no statistical differences in disease severity among nutrient types.
To track how time, treatment, or the interaction shifted overall diversity metrics of the microbiome, we generated shotgun metagenomes for all of the S. siderea and compared the community structure and function among the different coral microbiomes. There was a significant change in microbial alpha diversity metrics overtime (Figure 4A). Post-hoc tests showed that alpha diversity differed between August and September (p < 0.01), September and October (p < 0.01), and July and October (p = 0.01). September samples, which had the highest amount of DSS recorded, had the highest overall alpha diversity, with an average Chao1 OTU index of ~5,277 ± 71.29 OTUs, compared to July (4,888 ± 203.44), August (4,420 ± 203.66), and October (4,130 ± 204.58) (Figure 4A). Nutrient exposure had no significant effect on alpha-diversity (p > 0.01, Figure 4A).
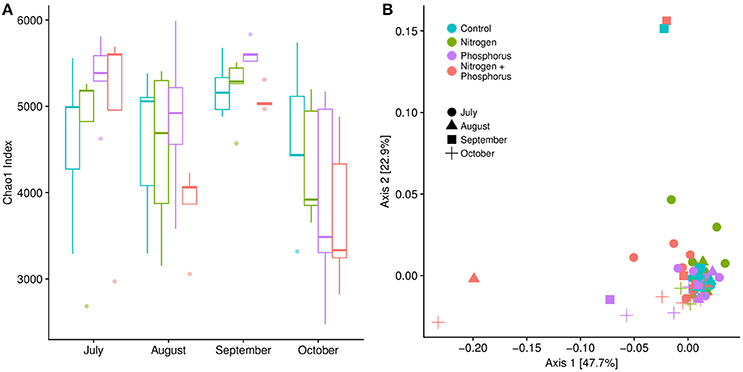
Figure 4. (A) Alpha diversity of the microbial communities associated with Siderastrea siderea over time, calculated using the Chao1 index. Microbial alpha diversity in September was statistically different from alpha diversity metrics in August and October (Kruskal-Wallis test: p < 0.01; FDR-corrected Games-Howell post-hoc test: p < 0.01). (B) Beta diversity was calculated using a Bray-Curtis dissimilarity matrix and plotted on an MDS (multidimensional scaling) graph. Beta-diversity metrics were not different over time, but were instead significantly different between treatments (Adonis, p = 0.01). Pair-wise comparisons showed that the beta-diversity metrics were different between control sites and combined nutrient sites, and nitrogen and combined nutrient sites (Adonis, p = 0.042 and 0.03).
Although nutrients did not alter coral microbiome alpha diversity, nutrient enrichment did increase microbial beta-diversity, or sample to sample variation (Figure 4B; p = 0.01). As visualized on an ordination plot, control samples clustered together, while the phosphorus enriched samples were aligned along Axis 1, and the nitrogen enriched samples were aligned along Axis 2 (Figure 4B). Post-hoc tests showed significant differences between the combined nitrogen and phosphorus samples compared to control and nitrogen enriched samples (p = 0.04 & p = 0.03, respectively). Surprisingly there were no differences in beta-diversity over time (Adonis, p = 0.11), nor was there a significant interaction of time and nutrient treatments on beta-diversity (Adonis, p = 0.96).
Siderastrea siderea Microbiome Community Structure Shifts
In addition to alpha and beta-diversity analysis, we conducted metagenomics analysis to determine if different taxa, groups of taxa, or functions were differential affected by time, treatment, or the interaction. Hierarchical taxonomic and functional analysis showed clear effects of time but few effects of the nutrient additions on different individual or groups of microbial organisms (Table 1). Overall the mean number of microbial and viral annotations within the coral metagenomes were: 3.66% Archaea, 21.19% Bacteria, 1.14% Virus, and 61.24% Eukarya (excluding the host and symbiont). Archaea were composed of 82.90% Euryarchaeota, 10.35% Crenarcheota, and 6.06% Thaumarcheota. The Bacteria were composed primarily of Proteobacteria (36.10%), Firmicutes (28.52%), Bacteroidetes (16.15%), Actinobacteria (4.19%), and Cyanobacteria (2.84%). The top five viral families consisted of Myoviridae (25.98%), Siphoviridae (9.26%), Mimiviridae (7.89%), Baculoviridae (7.61%), and Poxviridae (5.81%). Approximately half of all the Eukaryotic reads (32.11%) were assigned as Fungi, consisting of the following top five phyla: Ascomycota (75.22%), Basidiomycota (17.75%), Microsporidia (1.56%), Chytridiomycota (0.64%), and Entomophthoromycota (0.04%). An average of 12.75% of the metagenome reads were unclassified. While time significantly affected the composition of the microbiome, (see below) there were no significant differences at any taxonomic level in relative abundance of different taxonomic groups among nutrient treatments (p > 0.01; Supplementary Figure 2).
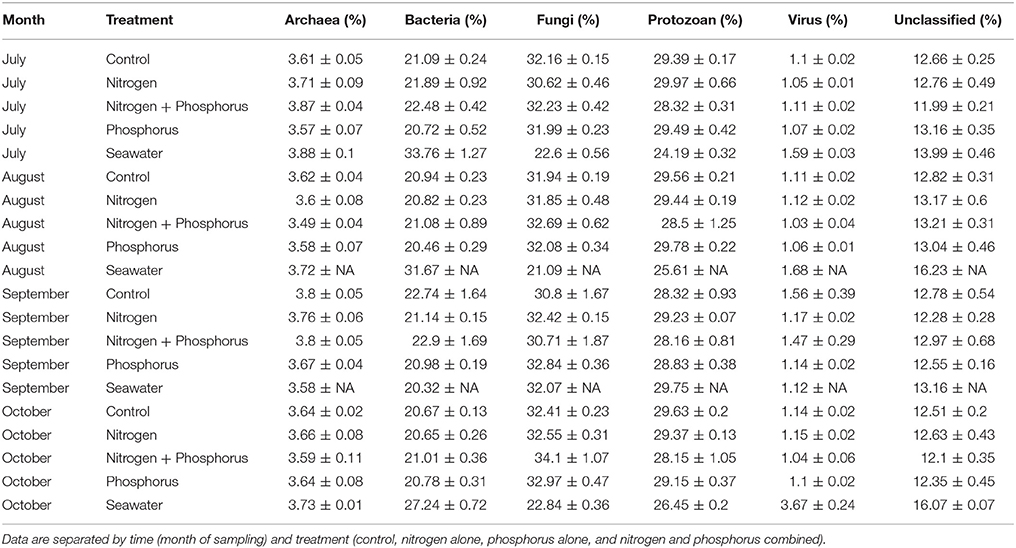
Table 1. Mean relative taxonomic composition and standard error of the mean of different microbial groups identified from Siderastrea siderea coral metagenomes.
Coral-Associated Viral Consortia Shift During Thermal Stress
Among the highest hierarchical categories, three taxonomic groups significantly changed with time: viruses, Archaea, and Fungi (Table 2). For example, viral annotations showed shifts in the early part of the coral collections, with September corals consisting of a significantly higher relative abundance of viral annotations compared to July (p = 0.01) and August (p = 0.006) (Figure 5). The relative abundance of viral reads went from 1.07% in July, to 1.24% in September, declining again to 1.12% in October. A large part of this increase in viral annotations came from the order Caudovirales (dsDNA bacteriophages) which were significantly higher in September compared to July (p = 0.005) and August (p = 0.03) (Table 2). These September samples contained a higher abundance of annotations assigned to the family Myoviridae than July (p = 0.002) and August samples (p = 0.007) where they increased from ~25% in July and August to 29.34% in September (Table 2). Around 70% of the Myoviridae annotations were unclassified, while 23.11% were classified as T4-like viruses. In October, Myoviridae annotations decreased back to 25.58%, similar to those in July (23.61%) and August (23.73%) samples (Table 2). Of the eukaryotic viral families, only the Poxviridae were found to change over time. Annotations to these nucleocytoplasmic large DNA viruses were highest in July, but then decreased in relative abundance in September (p = 0.03) and October (p = 0.013).
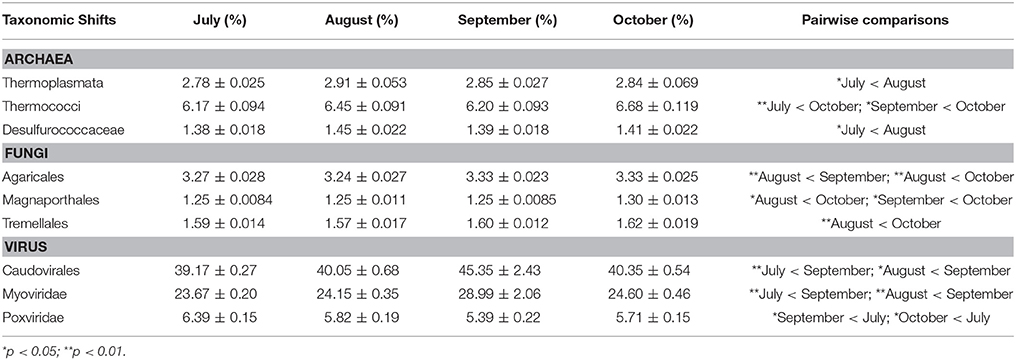
Table 2. Statistically significant shifts in taxonomic groups across time in Siderastrea siderea metagenomes as measured by generalized linear mixed models with Tukey's post-hoc test.
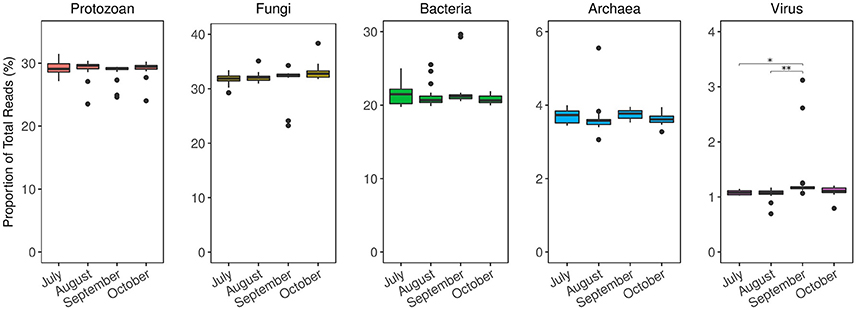
Figure 5. Taxonomic distribution of Siderastrea siderea coral microbiomes from metagenome analysis over time. Results are normalized as the relative abundance of each taxa at every time point. The microbiome composition among domains remained relatively stable throughout time, except for viral annotations. The relative abundance of viral annotations was higher in September, compared to July (p = 0.01) and August (p < 0.01). *p ≤ 0.05; **p ≤ 0.01.
Coral-Associated Archaea Shift in Abundance During Warming
Along with the viruses, there were shifts in the Archaea associated with the Siderastraea corals. At the class level, the Thermoplasmata had lower abundance in July (2.78%) than in August (2.91%; p = 0.02). In the case of Thermococci, the October metagenome contained higher relative abundance of 6.68% compared to 6.16% in July (p < 0.001) and 6.20% in September (p = 0.02). This class consisted solely of the order Thermococcales, and within that, the family Thermococcaceae. Additionally, the relative abundance of Desulfurococcaceae in July (1.38%) was lower than that in August (1.45%) (p = 0.045).
Coral-Associated Fungi Shift Across the Thermal Stress Event
Within the Eukaryotes there was a statistically significant change in fungal orders over time, with several orders of low relative abundance fungi becoming more abundant in the October metagenomes. Agaricales, a Basidiomycota, had a relative abundance of 3.24% in August and increased to 3.33% in September (p < 0.001) and October (p = 0.008). Another Basidiomycota, the Tremellales, also had higher relative abundance in October, 1.62%, compared to August (1.57%; p = 0.001). The Sordariomycetes order, Magnaporthales, had a higher relative abundance of 1.30% in October compared to 1.25% in August (p = 0.03), and 1.25% in September (p = 0.01).
Indicator Species of Healthy Coral Microbiomes
We conducted indicator species analysis on healthy and diseased S. siderea microbial metagenome samples to find the taxa most indicative of either healthy or diseased states. The indicator species of apparently healthy S. siderea included solely fungi and viruses. Fungal indicators include Olpidium brassicae, an unclassified Entomophthoromycete, Polychytrium aggregatum in the order Polychytriales, and Pluteus saupei, in the order Agaricales. Fourteen virus families also showed up as indicator taxa in healthy S. siderea microbiomes. These include Astroviridae, Baculoviridae, two OTUs within Betaflexiviridae, Bromovoridae, Circoviridae, Closteroviridae, two OTUs within Geminiviridae, Nyamiviridae, two OTUs in Polyomaviridae, Potyviridae, Secoviridae, two OTUs within Siphoviridae, Tombusviridae, and two OTUs within Totiviridae. Interestingly, we found no taxa indicative of diseased S. siderea microbiomes.
Coral Microbiome Function Is Altered During Thermal Stress
One advantage of metagenomes is the ability to quantify shifts in both the taxonomic structure of a microbiome as well as the functional potential of that community. Overall the functional potential of the coral microbiome showed the following distribution of classified functions: 9.77% Cellular Processes, 14.75% Environmental Information Processing, 24.23% Genetic Information Processing, and 51.25% Metabolism. We found that the functional potential of the coral microbiomes shifted across time but not with treatment (Table 3). Within the broadest hierarchical level, KEGG category 1, there was a higher abundance of genes for “genetic information processing” in October (24.75%) compared to July (23.91%; p = 0.008). This category houses the subcategories of “transcription,” “translation,” “folding,” “sorting and degrading,” and “replication and repair.” Genes for “translation” were more abundant in October (9.51%) compared to July (9.29%) (p = 0.02), and genes for “replication and repair” were found to be lowest, at 6.76%, in July, compared to 6.92% in August (p = 0.04), 6.98% in September (p < 0.001), and 6.95% in October (p < 0.001).
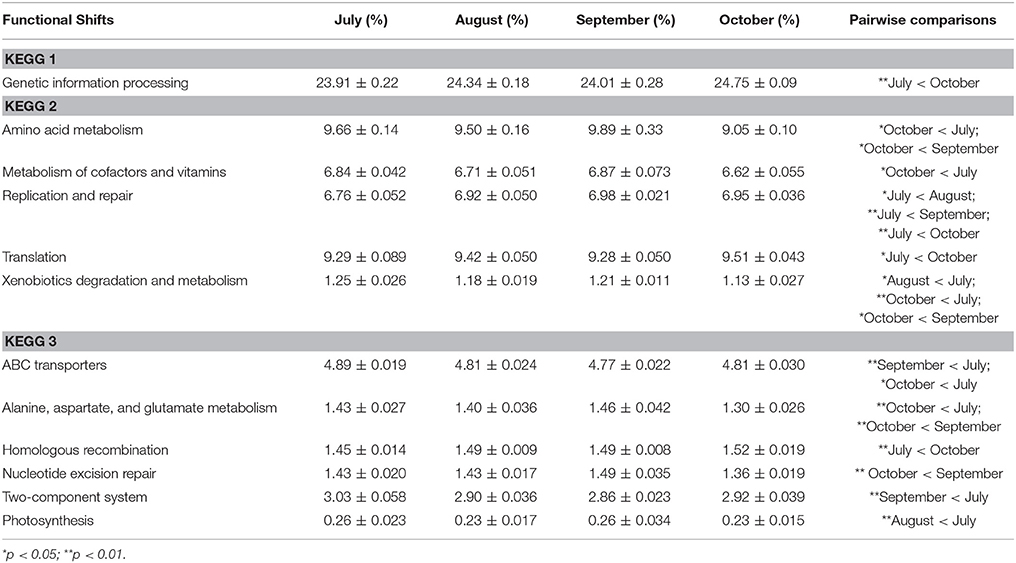
Table 3. Statistically significant shifts in functional assignments across time in Siderastrea siderea metagenomes as measured by generalized linear mixed models with Tukey's post-hoc test.
In contrast, genes for “amino acid metabolism” were lower in October (9.05%) than July (9.66%) (p = 0.03) and September (9.89%) (p = 0.04) while genes for “metabolism of cofactors and vitamins” were also lower in October (6.62%) compared to July (6.84%) (p = 0.02). Lastly, genes for “xenobiotics biodegradation and metabolism” were more abundant in July (1.25%) and September (1.21%) compared to August (1.18%) (p = 0.02) and October (1.13%) (p < 0.001, p = 0.01).
Within the highest resolution KEGG categories, the subcategory “genetic information processing” showed that only a few genes increased in abundance over time while many were reduced. For example, genes for “homologous recombination” were higher in October (1.52%) than in July (1.45%; p < 0.001) while “nucleotide excision repair” genes were more abundant in September (1.49%) than in October (1.36%; p = 0.007). But genes assigned to functional subcategories within “environmental information processing, cellular processes, and metabolism” tended to be more abundant in July compared to later months with “ABC transporter” genes higher in July (4.89%) than September (4.77%; p = 0.001) and October (4.81%; p = 0.04), and genes for the “two-component system” also being elevated in July (3.03%) compared to September (2.86%; p = 0.001). “Photosynthesis” genes were more abundant in July (0.26%) than in August (0.23%; p = 0.008), and genes for “alanine, aspartate, and glutamate metabolism” were higher in July (1.43%; p = 0.007) and September (1.46%; p = 0.007) compared to October (1.30%).
Thermal Stress Shifts the Microbiomes of DSS Afflicted Corals
Although there is no ascribed etiological agent responsible for DSS, by subdividing the data into corals with and without DSS, we found metagenomic evidence that corals experiencing DSS are unique microbiologically. Like nutrient exposure, DSS samples exhibited increased beta-diversity (Adonis, p = 0.011) compared to apparently healthy ones (Figure 6A). However, there was no significant difference in alpha diversity (Chao1 index) between DSS and non-DSS coral microbiomes (Welch's T-test, p = 0.24). To test if the thermal stress event altered the microbiomes, we compared only the August 2014 DSS (n = 10) and apparently healthy samples (n = 8) to another metagenomic dataset (n = 42) from coral mucus collected in August 2012. The 2012 samples (23 DSS and 19 apparently healthy) came from S. siderea corals that were either exposed to nutrient enrichment or control conditions. Compared to 2014, the 2012 samples were only experiencing moderate thermal stress (~6 DHW) (Zaneveld et al., 2016). The 2012 DSS and apparently healthy corals had indistinguishable microbiomes regardless of treatment and disease, and they clustered separately from the 2014 microbiome samples (Figure 6B, Adonis, p ≤ 0.001).
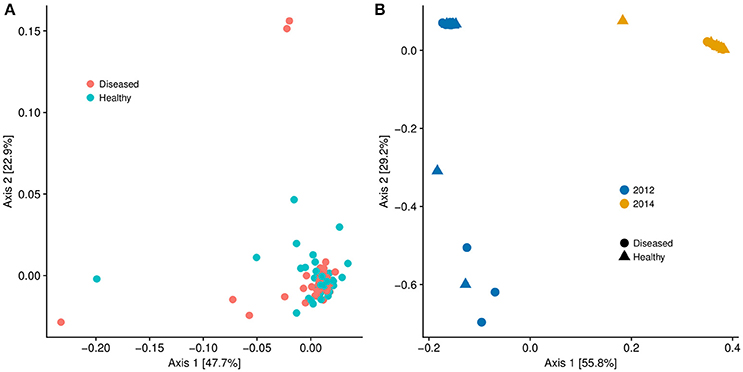
Figure 6. (A) Multidimensional scaling graph of beta diversity of microbial communities of Siderastrea siderea samples broken into diseased and healthy groups. The microbiome of the diseased corals was statistically different from the microbiome of the healthy corals (Adonis, p = 0.01). (B) Multidimensional scaling graph of beta diversity of microbial communities of Siderastrea siderea corals. The 2012 data points were taken from Siderastrea siderea microbial metagenome data from a nutrient-enrichment experiment conducted in August of 2012. The 2014 data points were metagenomes from the current dataset sampled in August of 2014, which was subject to nutrient enrichment and high water temperatures. There was no statistical difference between the diseased and healthy microbiomes in 2012 and 2014, but there was a difference between the 2012 and 2014 samples (Adonis, p < 0.01).
Discussion
In 2014, corals in the Florida Keys experienced severe thermal stress of 6–12 degree heating weeks depending on location. We found that this thermal anomaly was associated with increased bleaching and disease alongside changes in the alpha diversity of the microbiome and distinct shifts in different groups of taxa associated with the corals, particularly fungi and viruses. Shifts in the function of the microbiomes were also correlated with time. Nutrient exposure, on the other hand, only caused clear shifts in beta-diversity of the microbiomes, a finding that was independent from time, and thus likely not a result of the thermal anomaly.
Nutrient Exposure May Prolong Temperature-Mediated Bleaching in Agaricia Corals
Nutrient exposed corals were more likely to remain bleached 5 months after thermal stress compared to control corals. Though all Agaricia spp. corals bleached after the thermal stress event in August, recovery trended in favor of the corals in ambient conditions (80% recovered), compared to the corals in nutrient-stressed conditions (less than 50% recovered) (Figure 2A). All corals experienced high bleaching severity after thermal stress in August, however, only control corals and corals exposed to phosphorus completely recovered by January; corals exposed to nitrogen alone, or nitrogen and phosphorus did not fully recover by the end of the experiment (Figure 2B). Though not of statistical significance, likely due to our low replication within each category, these trends suggest that nitrogen and phosphorus behave in different ways to influence susceptibility and resilience to bleaching.
Corals Disease Linked to Thermal Stress
Disease prevalence in all S. sideraea corals (Figures 3A,B) went from 0% in July 2014 to ~80% within 2 months. DSS declined by October to 40% in the controls but remained steady at this level until January when we ended the experiment. This was a somewhat unexpected finding, as although a single study has also found that DSS prevalence can increases with higher water temperatures (Gil-Agudelo and Garzón-Ferreira, 2001), DSS generally peaks in the winter months, not the summer (Borger, 2005; Gochfeld et al., 2006). Interestingly, the prevalence of disease also remained above 50% from September to the conclusion of the experiment for all nutrient treatments, suggesting only in the presence of elevated nutrients do such thermal events reduce coral resilience by prolonging disease and/or preventing recovery.
Siderastrea siderea Disease and Microbial Diversity
Diversity within the S. siderea microbiome changed significantly across time with alpha diversity peaking in September across all treatments. Interestingly, the September alpha diversity metrics also had low variability compared to samples from other months. In contrast to microbial alpha diversity, the beta diversity of the metagenome samples varied with both nutrient treatment and disease status. In particular, we found that beta-diversity in the combined nitrogen and phosphorus enriched corals differed from both the control and the nitrogen-treated corals. Similarly, DSS-afflicted coral microbiomes clustered separately from healthy colonies, linking DSS with the coral microbiome, although it is unclear if this is a cause or an effect. Yet this increase and difference in beta diversity in the microbiomes of stressed and diseased corals aligns with the Anna Karenina principle, which states that the microbiomes of stressed animals are usually in an unstable dysbiosis, due the host being unable to regulate its microbial community (Zaneveld et al., 2017).
We used metagenomics instead of 16S analysis because we and others had previously found no correlation in microbial taxa shifts associated with DSS using 16S analysis. (Borger, 2005; Kellogg et al., 2014; Meyer et al., 2016). Using this approach, we again found no single taxon or groups of taxa that were associated with the disease. Yet in a study focusing on Stephanocoenia intersepta, the microbes of healthy and diseased patches of coral were characterized and found to differ among health states (Sweet et al., 2013). In DSS lesions, but absent in healthy tissue, four types of pathogenic bacteria were identified (Corynebacterium, Acinetobacter, Parvularculaceae, and Oscillatoria) along with the pathogenic fungi, Rhytisma acerinum, implicating that DSS in S. intersepta is caused not by a single pathogen but rather by a collection of taxonomically diverse microbes (Sweet et al., 2013). More recently, the transmission of DSS between S. siderea individuals was also experimentally tested, but there was no evidence of direct or indirect (water-borne) transmission of DSS symptoms, suggesting that DSS is not an infectious disease but rather a physiological one (Randall et al., 2016).
We have now extensively analyzed two metagenomic datasets of apparently healthy and DSS afflicted S. siderea from two different years (2012 and 2014) that were significantly different in terms of the ambient conditions present. Our indicator species analysis showed a plethora of viral and fungal taxa associated with a healthy coral microbiome, but no indicator species was found for DSS-afflicted coral samples. This provides further evidence that there is likely no pathogen responsible for DSS, although these negative results could be due to the low power of our experiment design. However, given that we find increased beta-diversity in the DSS microbiomes, it is not surprising that we found no taxa or group of taxa that are exclusively associated or significantly elevated in DSS corals. These collective data contribute to the growing body of thought that the signs of this disease are likely manifestations of an alteration of host physiology as a response to severe temperatures and nutrient pollution and that one is manifested as increased instability of the microbiome.
Thermal Anomaly Associated With Taxonomic and Functional Microbiome Shifts
Although there was no significant shift in microbial taxa from nutrient exposure, we did find shifts in certain virus, Archaea, and Fungi over time. Because changes in time and temperature in this experiment were inherently connected, we hypothesize that these taxonomic shifts were directly related to changes in seawater temperatures or some covariate(s). We found a higher proportion of the virus order Caudovirales in September metagenomes compared to other months. Phages targeting bacteria and archaea are the most abundant viral types found in scleractinian corals (Vega Thurber et al., 2017). These phages are crucial in shaping the coral microbiome and controlling microbial populations. Phages serve as a lytic barrier against potential pathogens (Sweet and Bythell, 2017) and have been described as non-host-derived immunity (Barr et al., 2013). The viral order Caudivirales has consistently been found in coral viromes (Wood-Charlson et al., 2015; Vega Thurber et al., 2017; Weynberg et al., 2017), with its top three families being Siphoviridae, Podoviridae, and Myoviridae. Most of the Caudovirales reads from this experiment were assigned to the Myoviridae family, which consisted mainly of T4-like viruses. The abundance of these lytic phages suggests a high turnover of the microbial community, and may also have obscured any shifts in the bacterial community, including any potential pathogens.
The family Poxviridae had a higher relative abundance in July, the start of the experiment, compared to September and October, but there was no dominating viral genus within this family. Members of Poxviridae infect insects and terrestrial vertebrates such as humans and birds, but have also been found in dolphins, whales, and sea lions (Bracht et al., 2006). Marine Poxviridae often make up the top five viral families found in coral viromes (Vega Thurber et al., 2017; Weynberg et al., 2017). These eukaryotic viruses either infect the coral host or eukaryotic members of the microbiome, yet this taxon tends to be more abundant in healthy coral viromes compared to diseased or bleached viromes (Vega Thurber et al., 2017), which may explain the decline of the relative abundance of Poxviridae in S. siderea metagenomes as thermal stress increased and coral health declined. Interestingly, neither Myoviridae nor Poxviridae were identified as indicator species for a healthy S. siderea microbiome. However, the plethora of viral OTUs found to be indicative of the microbiome of a healthy coral host show the importance of viruses in shaping the coral-associated microbial community.
The Archaeal members of the S. siderea holobiont consisted mainly of Crenarchaeota and Euryarchaeota. While they are not known to form species-specific symbioses with their coral host, they are hypothesized to participate in nutrient cycling (Wegley et al., 2004). For example, it is hypothesized that the Crenarchaeota turn over nitrogen via ammonia oxidation (Siboni et al., 2008). In this study, we did not find any correlation between Archaeal communities and nutrient exposure. Instead, we found three Archaeal members of the microbiome to shift across time. Both the Euryarchaeota, Thermoplasmata, and the Crenarchaeota, Desulfurococcaceae, had higher relative abundance in August, when seawater temperature reached its peak.
Fungi, particularly endolithic fungi, have long been acknowledged as endemic members of the scleractinian coral holobiont (Bentis et al., 2000; Ainsworth et al., 2017). Though most marine fungi are thought to be opportunistic, with the exception of Aspergillus sydowii, the confirmed pathogen of Caribbean sea fans (Smith et al., 1996), the role of endolithic fungi in coral tissue has yet to be confirmed. These fungi are hypothesized to participate in nutrient cycling by participating in symbiotic relationships with nitrogen-fixing bacteria. One early metagenome study of the Porites astreoides holobiont found fungal reads to make up the majority of classified eukaryotic sequence sequences (Wegley et al., 2007). Most of these fungal reads consisted of Ascomycota, which are in many healthy coral holobionts (Wegley et al., 2007). Similarly, Ascomycota made up 75% of the fungal reads in this study. Ascomycetes also dominated the fungal community in another coral metagenome study of the Porites compressa holobiont (Vega Thurber et al., 2009), but in that study, nutrient enrichment did not affect the composition of the fungal community. Again, we saw the same result in this study, in which certain fungal orders shifted with time and temperature, but not with nutrient addition. Other hypothesized roles of these fungi include competition with algal members of the holobiont, contribution to coral resistance to disease and bleaching, and parasitism upon the coral host (Yarden, 2014; Ainsworth et al., 2017). In this study, we found an Entomophthoromycete, a Chytridiomycete, and an Agaricomycete as fungal indicator species of healthy S. siderea, showing that at least some fungal species exist in either a commensal or mutualistic relationship with the coral host.
Functional analysis of the S. siderea microbial metagenome showed several contrasts between the start of the nutrient enrichment experiment in July, and the end of metagenome sampling in October. Prior to the bleaching event there was a higher relative abundance of genes for metabolism of cofactors and vitamins, and metabolism of amino acids—in particular alanine, aspartate, and glutamate. Additionally, prior to the thermal stress there was a higher relative abundance of photosynthesis genes (compared to August), two-component system genes (compared to September), ABC transporter genes (compared to September and October), and genes for xenobiotics biodegradation and metabolism (compared to August and October).
In contrast, microbial metagenomes of the latter months showed distinct functional potential. This manifested in the higher abundance of genes in October metagenomes for translation, replication and repair, homologous recombination, and a higher abundance of genes for nucleotide excision repair in September. The elevation of these genes categories could be interpreted as a shift in the community to more stress resistant taxa as a result of the thermal anomaly.
Conclusions
We conducted an in situ nutrient enrichment experiment in the Upper Florida Keys on Agaricia sp. and Siderastrea siderea corals in 2014, which coincided with a bleaching event due to a thermal anomaly. These unique environmental conditions allowed us to study the effects of high temperature and nutrient pollution on these corals. Elevated temperatures resulted in higher bleaching prevalence and severity of Agaricia sp. regardless of nutrient treatment and resulted in higher disease prevalence and severity in Siderastrea siderea. In the Siderastrea siderea metagenomes, there were several shifts in viral, archaeal, and fungal families across sampling time points, most notably a severe increase in the Myoviridae viruses associated with the aftermath of the thermal anomaly. Interestingly, we found no microbial taxa correlated with DSS.
Experimental Design Considerations and Future Work
Due to the low number of replicates in each coral category, there was a likelihood of Type II errors (false negatives). For example, many statistical tests failed to meet the standard p-value requirements after multiple corrections tests, especially since many animals died during the experiment. Trends in our data are thus likely suggestive of important patterns that should be tested and confirmed in the future. Repeat experiments with a higher number of replicates are suggested to provide better statistical power. Additionally, we acknowledge that many of our statistically significant results show shifts in the relative abundance of taxonomic or functional assignments of less than 3%. Whether these shifts are biologically significant and meaningful is debatable. However, for some groups, even small changes that occur in the background of host and symbiont genetic information is likely to be biologically important. In particular, viral genomes are typically many orders of magnitude shorter in length than bacterial or eukaryotic genomes, thus they make up a very small percentage of any host associated metagenome. Additionally, in other systems, it is well established that presence and absence of rare taxa have been found to be significant due to potentially high metabolic activity of low abundance bacteria and fungi members of microbial consortia (Kurm et al., 2017). Therefore, any statistically significant shift in the taxonomic composition of viruses could have meaningful consequences in the microbial community. Yet for shifts we discovered within fungi and Archaea, interpretations of such small shifts in the relative abundance of genes associated with these taxa should be tempered.
Lastly, to confirm the hypothesis that DSS is a physiological stress response, and not caused by a disease agent, we suggest future work to include transcriptome analysis of DSS-infected S. siderea, and the transcriptome analysis of the Symbiodinium associated with DSS-infected S. siderea. Studying differential gene expression in DSS-afflicted and healthy corals and Symbiodinium can provide answers for disease symptom initiation, progression, and restriction.
Author Contributions
RV and DB designed the experiment. AS, DB, and JP conducted the fieldwork. JP and AF generated the metagenomes. LW, AS, TS, DB, and RV performed the analysis. LW, AS, JP, RV, and DB wrote the manuscript.
Conflict of Interest Statement
The authors declare that the research was conducted in the absence of any commercial or financial relationships that could be construed as a potential conflict of interest.
Acknowledgments
We thank numerous volunteers for assistance with the experiment, and the Florida Keys National Marine Sanctuary for permits (FKNMS-2009-047 and FKNMS-2011-090). This research was funded by the NOAA Coral Reef Conservation Program Grant #NA14NOS4820090 to RV and DB with additional support from a NSF Biological Oceanography Grant (#OCE-1130786) to DB and RV.
Supplementary Material
The Supplementary Material for this article can be found online at: https://www.frontiersin.org/articles/10.3389/fmars.2018.00101/full#supplementary-material
References
Abramoff, M. D., Magalhaes, P. J., and Ram, S. J. (2004). Image processing with image J. Biophotonics Int. 11, 36–42.
Ainsworth, T. D., Fordyce, A. J., and Camp, E. F. (2017). The other microeukaryotes of the coral reef microbiome. Trends Microbiol. 25, 980–991. doi: 10.1016/j.tim.2017.06.007
Andrews, S. (2010). FastQC: A Quality Control Tool for High Throughput Sequence Data. Available online at: http://www.bioinformatics.babraham.ac.uk/projects/fastqc
Barnes, B. B., Hallock, P., Hu, C., Muller-Karger, F., Palandro, D., Walter, C., et al. (2015). Prediction of coral bleaching in the Florida keys using remotely sensed data. Coral Reefs 34, 491–503. doi: 10.1007/s00338-015-1258-2
Barr, J. J., Auro, R., Furlan, M., Whiteson, K. L., Erb, M. L., Pogliano, J., et al. (2013). Bacteriophage adhering to mucus provide a non-host-derived immunity. Proc. Natl. Acad. Sci. U.S.A. 110, 10771–10776. doi: 10.1073/pnas.1305923110
Bates, D., Maechler, M., Bolker, B., and Walker, S. (2015). Fitting linear mixed-effects models using lme4. J. Stat. Softw. 67:148. doi: 10.18637/jss.v067.i01
Bentis, C. J., Kaufman, L., and Golubic, S. (2000). Endolithic fungi in reef-building corals (Order: Scleractinia) are common, cosmopolitan, and potentially pathogenic. Biol. Bull. 198, 254–260. doi: 10.2307/1542528
Béraud, E., Gevaert, F., Rottier, C., and Ferrier-Pages, C. (2013). The response of the scleractinian coral Turbinaria reniformis to thermal stress depends on the nitrogen status of the coral holobiont. J. Exp. Biol. 216, 2665–2674. doi: 10.1242/jeb.085183
Bolger, A. M., Lohse, M., and Usadel, B. (2014). Trimmomatic: a flexible trimmer for illumina sequence data. Bioinformatics 30, 2114–2120. doi: 10.1093/bioinformatics/btu170
Borger, J. L. (2005). Dark spot syndrome: a scleractinian coral disease or a general stress response? Coral Reefs 24, 139–144. doi: 10.1007/s00338-004-0434-6
Bracht, A. J., Brudek, R. L., Ewing, R. Y., Manire, C. A., Burek, K. A., Rosa, C., et al. (2006). Genetic identification of novel poxviruses of cetaceans and pinnipeds. Arch. Virol. 151, 423–438. doi: 10.1007/s00705-005-0679-6
Brandt, M. E., and McManus, J. W. (2009). Disease incidence is related to bleaching extent in reef-building corals. Ecology 90, 2859–2867. doi: 10.1890/08-0445.1
Bruno, J. F., Petes, L. E., Harvell, C. D., and Hettinger, A. (2003). Nutrient enrichment can increase the severity of coral diseases. Ecol. Lett. 6, 1056–1061 doi: 10.1046/j.1461-0248.2003.00544.x
Carpenter, K. E., Abrar, M., Aeby, G., Aronson, R. B., Banks, S., Bruckner, A., et al. (2008). One-third of reef-buildling corals face elevated extinction risk from climate change and local impacts. Science 321, 560–563. doi: 10.1126/science.1159196
Cervino, J., Goreau, T. J., Nagelkerken, I., Smith, G. W., and Hayes, R. (2001). Yellow band and dark spot syndromes in Caribbean corals: distribution, rate of spread, cytology, and effects on abundance and division rate of zooxanthellae. Hydrobiologia 460, 53–63. doi: 10.1023/A:1013166617140
Cunning, R., and Baker, A. C. (2013). Excess algal symbionts increase the susceptibility of reef corals to bleaching. Nat. Clim. Change 3, 259–262. doi: 10.1038/nclimate1711
Dufrêne, M., and Legendre, P. (1997). Species assemblages and indicator species: the need for a flexible asymmetrical approach. Ecol. Monogr. 67, 345–366. doi: 10.2307/2963459
Ezzat, L., Maguer, J.-F., Grover, R., and Ferrier-Pagès, C. (2016). Limited phosphorus availability is the Achilles heel of tropical reef corals in a warming ocean. Sci. Rep. 6:31768 doi: 10.1038/srep31768
Ferrier-Pagès, C., Godinot, C., D'Angelo, C., Wiedenmann, J., and Grover, R. (2016). Phosphorus metabolism of reef organisms with algal symbionts. Ecol. Monogr. 86:262–277. doi: 10.1002/ecm.1217
Gil-Agudelo, D., and Garzón-Ferreira, J. (2001). Spatial and seasonal variation of dark spots disease in coral communities of the Santa Marta area (Colombian Caribbean). Bull. Marine Sci. 69, 619–629.
Gochfeld, D., Olson, J., and Slattery, M. (2006). Colony versus population variation in susceptibility and resistance to dark spot syndrome in the Caribbean coral Siderastrea siderea. Dis. Aquat. Org. 69, 53–65. doi: 10.3354/dao069053
Haapkylä, J., Unsworth, R. K. F., Flavell, M., Bourne, D. G., Schaffelke, B., and Willis, B. L. (2011). Seasonal rainfall and runoff promote coral disease on an inshore reef. PLoS ONE 6:e16893. doi: 10.1371/annotation/365162ee-3718-44ce-b2e9-88302d5e0801
Halpern, B. S., Walbridge, S., Selkoe, K. A., Kappel, C. V., Micheli, F., D'Agrosa, C., et al. (2008). A global map of human impact on marine ecosystems. Science 319, 948–952. doi: 10.1126/science.1149345
Hervé, M. (2017). RVAideMemoire: Diverse Basic Statistical and Graphical Functions. R Package Version 0.9-65. Available online at: https://CRAN.R-project.org/package=RVAideMemoire
Hoegh-Guldberg, O., and Smith, G. J. (1989). Influence of the population density of zooxanthellae and supply of ammonium on the biomass and metabolic characteristics of the reef corals Seriatopora hystrix and Stylophora pistillata. Mar. Ecol. Prog. Ser. 57, 173–186. doi: 10.3354/meps057173
Hothorn, T., Bretz, F., and Westfall, P. (2008). Simultaneous inference in general parametric models. Biom. J. 50, 346–363. doi: 10.1002/bimj.200810425
Howarth, R. W. (2008). Coastal nitrogen pollution: a review of sources and trends globally and regionally. Harmful Algae 8, 14–20. doi: 10.1016/j.hal.2008.08.015
Kaczmarsky, L., and Richardson, L. L. (2011). Do elevated nutrients and organic carbon on Philippine reefs increase the prevalence of coral disease? Coral Reefs 30, 253–257. doi: 10.1007/s00338-010-0686-2
Kanehisa, M., and Goto, S. (2000). KEGG: kyoto encyclopedia of genes and genomes. Nucleic Acids Res. 28, 27–30. doi: 10.1093/nar/28.1.27
Kellogg, C. A., Piceno, Y. M., Tom, L. M., DeSantis, T. Z., Gray, M. A., and Andersen, G. L. (2014). Comparing bacterial community composition of healthy and dark spot-affected siderastrea siderea in florida and the Caribbean. PLoS ONE 9:e108767. doi: 10.1371/journal.pone.0108767
Kurm, V., van der Putten, W. H., de Boer, W., Naus-Wiezer, S., and Hol, W. H. G. (2017). Low abundant soil bacteria can be metabolically versatile and fast growing. Ecology 98, 555–564. doi: 10.1002/ecy.1670
Langmead, B., and Salzberg, S. (2012). Fast gapped-read alignment with Bowtie 2. Nat. Methods 9, 357–359. doi: 10.1038/nmeth.1923
Magris, R. A., Heron, S. F., and Pressey, R. L. (2015). Conservation planning for coral reefs accounting for climate warming disturbances. PLoS ONE 10:e0140828. doi: 10.1371/journal.pone.0140828
Manzello, D. P. (2015). Rapid recent warming of coral reefs in the Florida keys. Sci. Rep. 5:16762. doi: 10.1038/srep16762
Marubini, F., and Davies, P. S. (1996). Nitrate increases zooxanthellae population density and reduces skeletogenesis in corals. Mar. Biol. 127, 319–328. doi: 10.1007/BF00942117
Maynard, L., van Hooidonk, R. V., Eakin, C. M., Puotinen, M., Garren, M., Williams, G., et al. (2015). Projections of climate conditions that increase coral disease susceptibility and pathogen abundance and virulence. Nat. Clim. Change 5:688–694. doi: 10.1038/nclimate2625
McDevitt-Irwin, J. M., Baum, J. K., Garren, M., and Thurber, V. L. R. (2017). Responses of coral-associated bacterial communities to local and global stressors. Front. Mar. Sci. 4:262. doi: 10.3389/fmars.2017.00262
McMurdie, P. J., and Holmes, S. (2013). phyloseq: an R package for reproducible interactive analysis and graphics of microbiome census data. PLoS ONE 8:e61217. doi: 10.1371/journal.pone.0061217
Meyer, J. L., Rodgers, J. M., Dillard, B. A., Paul, V. J., and Teplitski, M. (2016). Epimicrobiota associated with the decay and recovery of orbicella corals exhibiting dark spot syndrome. Front. Microbiol. 7:893. doi: 10.3389/fmicb.2016.00893
Muscatine, L., Falkowski, P. G., Dubinsky, Z., Cook, P. A., and McCloskey, L. R. (1989). The effect of external nutrient resources on the population dynamics of zooxanthellae in a reef coral. Proc. R. Soc. Lond. B 236, 311–324. doi: 10.1098/rspb.1989.0025
NOAA and Coral Reef Watch, US Department of Commerce. (2014). 2014 Annual Summaries of Thermal Conditions Related to Coral Bleaching for U.S. National Coral Reef Monitoring Program (NCRMP) Jurisdictions. NOAA and Coral Reef Watch, US Department of Commerce.
Nayfach, S., Bradley, P. H., Wyman, S. K., Laurent, T. J., Williams, A., Eisen, J. A., et al. (2015). Automated and accurate estimation of gene family abundance from shotgun metagenomes. PLoS Comput. Biol. 11:e1004573. doi: 10.1371/journal.pcbi.1004573
Oksanen, J. F., Blanchet, G., Friendly, M., Kindt, R., Legendre, P., McGlinn, D., et al. (2017). vegan: Community Ecology Package. R package version 2.4-3. Available online at: https://CRAN.R-project.org/package=vegan
Porter, J. W., Torres, C., Sutherland, K. P., Meyers, M. K., Callahan, M. K., Ruzicka, R., et al. (2011). Prevalence, severity, lethality, and recovery of dark spots syndrome among three Floridian reef-building corals. J. Exp. Mar. Biol. Ecol. 408, 79–87. doi: 10.1016/j.jembe0.2011.07.027
R Core Team (2016). R: A Language and Environment for Statistical Computing. Vienna: R Foundation for Statistical Computing. Available online at: https://www.R-project.org/
Randall, C. J., Jordán-Garza, A. G., Muller, E. M., and Woesik, R. van (2016). Does dark-spot syndrome experimentally transmit among Caribbean Corals? PLoS ONE 11:e0147493. doi: 10.1371/journal.pone.0147493
Richardson, L. L. (1998). Coral diseases: what is really known? Trends Ecol. Evol. 13, 438–443. doi: 10.1016/S0169-5347(98)01460-8
Schloss, P. D., Westcott, S. L., Ryabin, T., Hall, J. R., Hartmann, M., Hollister, E. B., et al. (2009). Introducing mothur: open-source, platform-independent, community-supported software for describing and comparing microbial communities. Appl. Environ. Microbiol. 75, 7537–7541. doi: 10.1128/AEM.01541-09
Schoepf, V., Grottoli, A. G., Levas, S. J., Aschaffenburg, M. D., Baumann, J. H., Yohei Matsui, et al. (2015). Annual coral bleaching and the long-term recovery capacity of coral. Proc. R. Soc. B. 282:20151887 doi: 10.1098/rspb.2015.1887
Shantz, A. A., and Burkepile, D. E. (2014). Context-dependent effects of nutrient loading on the coral-algal mutualism. Ecology 95, 1995–2005. doi: 10.1890/13-1407.1
Shantz, A. A., Lemoine, N. P., and Burkepile, D. E. (2016). Nutrient loading alters the performance of key nutrient exchange mutualisms. Ecol. Lett. 19, 20–28. doi: 10.1111/ele.12538
Shaver, E. C., Shantz, A. A., McMinds, R., Burkepile, D. E., Vega Thurber, R. L., Silliman, B. R., et al. (2017). Effects of predation and nutrient enrichment on the success and microbiome of a foundational coral. Ecology 98, 830–839. doi: 10.1002/ecy.1709
Siboni, N., Ben-Dov, E., Sivan, A., and Kushmaro, A. (2008). Global distribution and diversity of coral-associated Archaea and their possible role in the coral holobiont nitrogen cycle. Environ. Microbiol. 10, 2979–2990. doi: 10.1111/j.1462-2920.2008.01718.x
Sinha, E., Michalak, A. M., and Balaji, V. (2017). Eutrophication will increase during the 21st century as a result of precipitation changes. Science 357, 405–408. doi: 10.1126/science.aan2409
Smith, G. W., Ives, L. D., Nagelkerken, I. A., and Ritchie, K. B. (1996). Caribbean sea-fan mortalities. Nature 383, 487–487. doi: 10.1038/383487a0
Sweet, M., and Bythell, J. (2017). The role of viruses in coral health and disease. J. Invertebr. Pathol. 147, 136–144. doi: 10.1016/j.jip.2016.12.005
Sweet, M., Burn, D., Croquer, A., and Leary, P. (2013). Characterisation of the bacterial and fungal communities associated with different lesion sizes of dark spot syndrome occurring in the coral stephanocoenia intersepta. PLoS ONE 8:e62580. doi: 10.1371/journal.pone.0062580
Thompson, J. R., Rivera, H. E., Closek, C. J., and Medina, M. (2015). Microbes in the coral holobiont: partners through evolution, development, and ecological interactions. Front. Cell. Inect. Microbiol. 4:176. doi: 10.3389/fcimb.2014.00176
van Hooidonk, R., Maynard, J., Tamelander, J., Gove, J., Ahmadia, G., Raymundo, L., et al. (2016). Local-scale projections of coral reef futures and implications of the Paris Aggreement. Sci. Rep. 6:39666 doi: 10.1038/srep39666
Vega Thurber, R. L., Burkepile, D. E., Fuchs, C., Shantz, A. A., McMinds, R., and Zaneveld, J. R. (2014). Chronic nutrient enrichment increases prevalence and severity of coral disease and bleaching. Glob. Chang. Biol. 20, 544–554. doi: 10.1111/gcb.12450
Vega Thurber, R., Payet, J. P., Thurber, A. R., and Correa, A. M. S. (2017). Virus–host interactions and their roles in coral reef health and disease. Nature Rev. Microbiol. 15:205. doi: 10.1038/nrmicro.2016.176
Vega Thurber, R., Willner-Hall, D., Rodriguez-Mueller, B., Desnues, C., Edwards, R. A., Angly, F., et al. (2009). Metagenomic analysis of stressed coral holobionts. Environ. Microbiol. 11, 2148–2163. doi: 10.1111/j.1462-2920.2009.01935.x
Voss, J. D., and Richardson, L. L. (2006). Nutrient enrichment enhances black band disease progression in corals. Coral Reefs 25, 569–576. doi: 10.1007/s00338-006-0131-8
Wagner, D. E., Kramer, P., and van Woesik, R. (2010). Species composition, habitat and water quality influence coral bleaching in southern Florida. Mar. Ecol. Prog. Ser. 408:65–78. doi: 10.3354/meps08584
Wegley, L., Edwards, R., Rodriguez-Brito, B., Liu, H., and Rohwer, F. (2007). Metagenomic analysis of the microbial community associated with the coral Porites astreoides. Environ. Microbiol. 9, 2707–2719. doi: 10.1111/j.1462-2920.2007.01383.x
Wegley, L., Yu, Y., Breitbart, M., Casas, V., Kline, D. I., and Rohwer, F. (2004). Coral-associated archaea. Mar. Ecol. Prog. Ser. 273, 89–96. doi: 10.3354/meps273089
Weil, E. (2004). “Coral Reef diseases in the Wider Caribbean,” in Coral Health and Disease, eds E. Rosenberg and Y. Loya (Berlin; Heidelberg: Springer), 35–68.
Weynberg, K. D., Laffy, P. W., Wood-Charlson, E. M., Turaev, D., Rattei, T., Webster, N. S., et al. (2017). Coral-associated viral communities show high levels of diversity and host auxiliary functions. PeerJ 5:e4054. doi: 10.7717/peerj.4054
Wiedenmann, J., D'Angelo, C., Smith, E. G., Hunt, A. N., Legiret, F.-E., et al. (2013). Nutrient enrichment can increase the susceptibility of reef corals to bleaching. Nat. Clim. Chang. 3, 160–164. doi: 10.1038/nclimate1661
Wood, D. E., and Salzberg, S. L. (2014). Kraken: ultrafast metagenomic sequence classification using exact alignments. Genome Biol. 15, R46. doi: 10.1186/gb-2014-15-3-r46
Wood-Charlson, E. M., Weynberg, K. D., Suttle, C. A., Roux, S., and van Oppen, M. J. H. (2015). Metagenomic characterization of viral communities in corals: mining biological signal from methodological noise: methodological biases in coral viromics. Environ. Microbiol. 17, 3440–3449. doi: 10.1111/1462-2920.12803
Wooldridge, S. A. (2016). Excess seawater nutrients, enlarged algal symbiont densities and bleaching sensitive reef locations: 1. identifying thresholds of concern for the great barrier reef, Australia. Mar. Pol. Bull. doi: 10.1016/j.marpolbul.2016.04.054
Wooldridge, S. A., and Done, T. J. (2009). Improved water quality can ameliorate effects of climate change on corals. Ecol. Appl. 19, 1492–1499. doi: 10.1890/08-0963.1
Yarden, O. (2014). Fungal association with sessile marine invertebrates. Front. Microbiol. 5:228. doi: 10.3389/fmicb.2014.00228
Zaneveld, J. R., Burkepile, D. E., Shantz, A. A., Pritchard, C. E., McMinds, R., Payet, J. P., et al. (2016). Overfishing and nutrient pollution interact with temperature to disrupt coral reefs down to microbial scales. Nat. Commun. 7:833. doi: 10.1038/ncomms11833
Keywords: bleaching, disease, corals, dark spot syndrome, viruses, fungi, reefs, bacteria
Citation: Wang L, Shantz AA, Payet JP, Sharpton TJ, Foster A, Burkepile DE and Vega Thurber R (2018) Corals and Their Microbiomes Are Differentially Affected by Exposure to Elevated Nutrients and a Natural Thermal Anomaly. Front. Mar. Sci. 5:101. doi: 10.3389/fmars.2018.00101
Received: 24 January 2018; Accepted: 12 March 2018;
Published: 28 March 2018.
Edited by:
Michael Sweet, University of Derby, United KingdomReviewed by:
Kimberly B. Ritchie, University of South Carolina Beaufort, United StatesJulie L. Meyer, University of Florida, United States
Raquel Peixoto, Universidade Federal do Rio de Janeiro, Brazil
Copyright © 2018 Wang, Shantz, Payet, Sharpton, Foster, Burkepile and Vega Thurber. This is an open-access article distributed under the terms of the Creative Commons Attribution License (CC BY). The use, distribution or reproduction in other forums is permitted, provided the original author(s) and the copyright owner are credited and that the original publication in this journal is cited, in accordance with accepted academic practice. No use, distribution or reproduction is permitted which does not comply with these terms.
*Correspondence: Rebecca Vega Thurber, rvegathurber@gmail.com; rebecca.vega-thurber@oregonstate.edu