New Perspectives on Nitrogen Fixation Measurements Using 15N2 Gas
 Nicola Wannicke1,2*
  Mar Benavides3,4
  Tage Dalsgaard5,6
  Joachim W. Dippner1
  Joseph P. Montoya7
  Maren Voss1
- 1Department Biological Oceanography, Leibniz Institute for Baltic Sea Research, Rostock, Germany
- 2Plasma Agriculture, Leibniz Institute for Plasma Science and Technology, Greifswald, Germany
- 3Marine Biological Section, University Copenhagen, Helsingør, Denmark
- 4Aix Marseille Univ, Université de Toulon, CNRS, IRD, MIO UM 110, Marseille, France
- 5Arctic Research Centre, Department of Bioscience, Aarhus University, Aarhus, Denmark
- 6Unisense, Aarhus, Denmark
- 7Georgia Institute of Technology, Atlanta, School of Biological Sciences, Atlanta, GA, United States
Recently, the method widely used to determine 15N2 fixation rates in marine and freshwater environments was found to underestimate rates because the dissolution of the added 15N2 gas bubble in seawater takes longer than theoretically calculated. As a solution to the potential underestimate of rate measurements, the usage of the enriched water method was proposed to provide constant 15N2 enrichment. Still, the superiority of enriched water method over the previously used bubble injection remains inconclusive. To clarify this issue, we performed laboratory based experiments and implemented the results into an error analysis of 15N2 fixation rates. Moreover, we conducted a literature search on the comparison of the two methods to calculate a mean effect size using a meta-analysis approach. Our results indicate that the error potentially introduced by an equilibrium phase of the 15N2 gas is −72% at maximum for experiments with very short incubation times of 1 h. In contrast, the underestimation was negligible for incubations lasting 12–24 h (error is −0.2%). Our meta-analysis indicates that 84% of the measurements in the two groups will overlap and there is a 61% chance that a sample picked at random from the enriched water group will have a higher value than one picked at random from the bubble group. Overall, the underestimation of N2 fixation rates when using the bubble method relative to the enriched water method is highly dependent on incubation time and other experimental conditions and cannot be generalized.
Introduction
Over the last few decades, the stable isotopic tracer 15N2 was used to measure the production of diazotroph (N2-fixer) biomass directly. This isotopic approach was first introduced by Burris and Miller (1941), but it was not until the 1990s that isotope ratio mass spectrometers (IRMS) were sensitive enough to measure low, open ocean low N2 fixation rates. The protocol established by Montoya et al. (1996) has been widely used in the last two decades, yielding a large amount of N2 fixation data, which are particularly abundant in the North Atlantic and North Pacific Oceans (Luo et al., 2012). Briefly, the method consists of adding a volume of 15N2 gas into a seawater sample, which is incubated for a given period (on deck or in situ), and finally terminated by filtration through glass fiber filters. The filters are later analyzed by IRMS to determine the amount of 15N2 transferred from the aqueous phase to the particulate cell material. Montoya et al. (1996) introduced the calculation of the N2 fixation rates using a mass-balance approach:
With V calculated as:
Where M refers to mole nitrogen fixed, L to the volume (liter) and T to the incubation time. APN is the 15N atom % enrichment of the particulate nitrogen (PN) pool as measured by IRMS, at the beginning (t0) and end (tf) of an incubation period; AN2 is the 15N atom % enrichment of the dissolved N2 gas in the incubated seawater; [PN] is the concentration of PN at the end of the incubation [if (PN) is stable over the incubation time; if (PN) varies significantly overtime, an average of initial and final (PN) values is recommended for calculations, see (Montoya et al., 1996)]; and Δt is the duration of the incubation. The values of all the terms in Equation (1) are measured empirically with the exception of AN2. The latter term is theoretically calculated based on the volume of 15N2 injected and the initial concentration of N2 dissolved in seawater based on its temperature and salinity and the N2 solubility equations of Weiss (1970) which have recently been revised by Hamme and Emerson (2004). This theoretical calculation assumes that isotopic equilibration of the 15N2 bubble with the dissolved N2 already present in the incubation bottle is rapid and complete relative to the incubation period. Simple mass balance tracer equations assume a constant isotope enrichment of the source pool over the duration of the incubation (Fry, 2006) an assumption violated if equilibration of 15N2 with seawater is slow or incomplete during the experimental incubation.
Recently, Mohr et al. (2010) reported experimental evidence for a time lag in 15N2 equilibration with the surrounding seawater of up to 24 h, depending on a number of factors such as incubation bottle size, volume of 15N2 injected, bottle shaking, and incubation temperature. Amongst other things, an observed mismatch between 15N2 fixation rates and biomass-specific growth rates motivated Mohr et al. (2010) to re-evaluate the 15N2 bubble method introduced by Montoya et al. (1996). Mohr et al. (2010) proposed a new experimental procedure involving preparation of seawater enriched with 15N2, which provides a near instantaneous enrichment of the dissolved pool of N2 in an incubation bottle. This “enriched water” approach resulted in a 2–6 fold increase of measured N2 fixation rates in comparison to the 15N2 “bubble” method (Großkopf et al., 2012; Wilson et al., 2012). To the best of our knowledge, only a few comparisons of the two methods have been published up to date (11 studies) with only two studies including time series observations (Mohr et al., 2010; Klawonn et al., 2015).
There are several reasons why the bubble method may underestimate true N2 fixation rates: (1) temperature (high temperatures inhibit dissolution of gases), (2) the volume of 15N2 gas injected, (3) the duration of the incubation, (4) the time at which the incubation starts relative to the onset of 15N2 fixation, and (5) possible DOM coating of the 15N2 bubble (Mohr et al., 2010; Klawonn et al., 2015). The enriched water method on the other hand, also seems to be impacted by the mode of incubation, i.e., incubation on deck vs. an in situ array (Wilson et al., 2012).
Adding to these factors, Großkopf et al. (2012) reported that underestimates of N2 fixation rate are lower when the community is dominated by colonial cyanobacteria of the genus Trichodesmium and higher when diazotrophs other than Trichodesmium predominate (e.g., symbionts, unicellular cyanobacteria, and non-cyanobacterial diazotrophs). All these factors vary widely among published works, making a global recalculation of N2 fixation very difficult (Großkopf et al., 2012). On the other hand, a number of authors have not found significant differences between the two methods (Mulholland et al., 2012; Shiozaki et al., 2015, not published personnel communication: Berman-Frank et al., Montoya et. al., Benavides and Wannicke et al., -the latter added as unpublished data set to the meta analysis-). Moreover, using 15N2 enriched water has a number of drawbacks, including the potential introduction of unwanted dissolved constituents (nutrients, dissolved organic matter or trace metals; Klawonn et al., 2015) and the preparation of the labeled water, which is laborious compared to the injection of a gas bubble into an incubation bottle. Degassing of seawater might also alter seawater chemistry in undesirable ways (e.g., by altering dissolved inorganic carbon concentrations or pH), and the overall extent of the degassing affects the final 15N2 enrichment of dissolved N2 dissolution (Klawonn et al., 2015).
The aim of this study is twofold. Firstly, we used a laboratory experiment to determine the equilibrium time of 15N2 in Seawater from the Baltic Sea and used these numbers for an error calculation. By doing so, we tried to generate a measure for the underestimation of 15N2 fixation rates when using the bubble method.
Secondly, we applied a meta- analytical approach to evaluate results from published papers comparing both methods. Variability and heterogeneity of published 15N2 fixation rates were estimated for different incubation times and a mean effect size over all studies was calculated. Finally, considerations are given for the bubble method and its use in future studies.
Materials and Methods
Laboratory Experiment and Error Calculation
Dissolution of 15N2 in Brackish Seawater
We tested the equilibration of 15N2 with filtered seawater empirically using both the 15N2 bubble method (Montoya et al., 1996) and the enriched water method (Mohr et al., 2010). The seawater used in these experiments was collected from the Baltic Sea at the pier off Heiligendamm (54° 8.55′ N, 11° 50.6′ E, salinity of 14) and filtered through 0.2 μm cellulose acetate membranes (Sartorius) using a peristaltic pump. For the bubble method, filtered seawater was then transferred to 1 L polycarbonate Nalgene®bottles fitted with septum caps, taking care to eliminate all headspace from the filled bottles. We then added 1 ml 15N2 gas (98%, Campro Scientific lot # EB1169V) by direct injection through the septum with overpressure released via a cannula. Bottles were gently mixed for 5 min.
We followed the protocol of Mohr et al. (2010) to test the enriched water method using degassed seawater. In brief, degassed seawater was prepared using vacuum in a 1.7 × 5.5 MiniModule (3M Liqui cel) attached to a peristaltic pump (TP4000 E—Economic, Thölen, Germany 950 mbar). We assessed the efficiency of degassing by determining dissolved O2 concentrations in the degassed water by Winkler titration until O2 concentration were below the detection limit. Thereupon, 1.1 liter of degassed water was transferred to a Tedlar bag (Dupont, USA), flushed with helium to ensure absence of air inside the bags to which 11 mL of 15N2 gas (98%, Campro Scientific lot # EB1169V) was added. The bag was agitated for 5 min (in which the bubble did not disappear) at room temperature. 50 mL of the enriched water was added to each 1.1L incubation bottle filled air free with Baltic Sea water.
All bottles were incubated at 15°C on a horizontal shaker (10 rpm, IKA HS 501, USA) located in a walk- in incubator. Incubations were carried out in triplicate and lasted for 24 h. Replicate sets of bottles were sampled immediately (t = 0 h) and at 1, 2, 4, 8, 12, and 24 h after addition of 15N2 for analysis of the 15N atom% enrichment of dissolved N2, for which duplicate sub-samples from each bottle were transferred headspace-free into 12 mL exetainers. Crimp-sealed exetainers were stored in the dark at 4°C for up to 3 days. The 15N atom % enrichment of dissolved N2 was analyzed by measuring the abundance and concentration of masses 29N2 and 30N2 using a manual method similar to the automated gas chromatography-isotope ratio mass spectrometry approach described in Holtappels et al. (2011). In brief, water samples were taken from sealed exetainers with a gas tight glass syringe and a subsample was injected on-column on a 2 m stainless steel packed Porapak Q column (Supelco) with a constant flow of He carrier. Water was removed from the sample cryogenically (liquid nitrogen) and oxygen was removed by passage through a column packed with copper wire heated to 650°C. After purification, the N2 was introduced to a mass spectrometer through an open split interface (Conflo IV, Thermo Scientific) and analyzed on a Delta V Advantage (Thermo Scientific). After every 5th sample air a standard was introduced.
We calculated dissolved 15N2 concentrations according to Dalsgaard and Thamdrup (2002). Results of the bubble method were taken as a basis for error estimation as described below.
Error Estimate for the Bubble Method During Isotopic Equilibration
We performed an error estimation to theoretically quantify the % difference in measured 15N2 fixation rate considering an increasing time lag (Ti) between 15N2 tracer addition and the beginning of diazotrophic 15N2 fixation and the duration of fixation (Tf). The error was estimated relative to instantaneous isotopic equilibration of 15N2 gas upon bubble injection.
This estimate is relevant in case of time delay between addition of the 15N2 tracer and the active beginning of diazotrophic 15N2 fixation and also applies for diazotrophs fixing continuously.
Consider a seawater sample with an initial stable isotope composition of dissolved N2, Ni = δ15Ni. For natural systems, this initial value will be very close to the global natural abundance of 0.366 at% 15N. Into this sample, 15N2 gas is injected and after a period of time (typically a couple of hours), the system reaches its equilibrium isotopic composition, Ne = δ15Neq. The temporal development (Figure 1) of the 15N enrichment in the dissolved N2 pool is:
where ΔN = Ne−Ni is the difference between the equilibrium and initial isotopic compositions and b is an equilibration parameter with units of inverse time. The injection of 15N2 gas has the consequence that Ne > Ni and ΔN > 0.
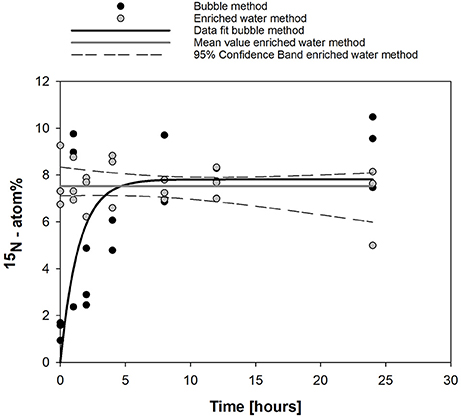
Figure 1. Dissolution kinetics observed in this study for the bubble ( ) and enriched water methods (
 ) over 24 h. Data fit for the bubble method (
 ) was done using y = 7.81 [1–exp (−0.706 t)], (R2 = 0.766, p < 0.0001). For the enriched water method, the mean substrate enrichment and associated 95% confidence interval are shown (
 ).
).
For t → ∞, the equilibrium isotopic composition is reached and Ne = Ni + ΔN. A general assumption of the bubble method is that fixation occurs with the dissolved N2 pool at isotopic equilibrium. Any fixation that occurs before the system reaches equilibrium will contribute to error (underestimate) in the calculated rate, which is inversely proportional to δ15N2. The simplest way to estimate the error is the integration of Equation 6 over the duration of fixation. Equation (2) can be rearranged to:
which allows us to separate our experimental period into phases before and after the system reaches equilibrium. Following addition of 15N2 to an incubation bottle, the mean δ15N of the dissolved N2 will increase and the average enrichment of the 15N2 pool from the start of N2-fixation to any time, t will be:
where the phase lag Ti is the difference in time between gas injection and the start of fixation, while Tf is the duration of N2-fixation. For Ti = 0, the mixing of injected gas and the start of fixation are synchronized, as in the case of a diazotroph that fixes N2 continuously through the day. Integration of Equation (4) yields an expression for the mean δ15N2 during the period of active N2-fixation Tf:
In Equation (5) the mean δ15N2 value can be expressed as equilibrium composition and an error, ε, which represents the underestimation of the N2-fixation rate:
and the relative percent error, R, is then simply:
Fitting Equation (7) to the observations (Figure 1) results in Ni = 0 atom%, Ne = 7.8 atom%, Δ N = 7.8 atom%, b = 0.71 h−1.
Meta-Analysis
We obtained data for meta-analysis from published and unpublished sources (Supplementary Table 1). We conducted literature searches using ISI Web of Science and by personal communication. Data selection continued until September 2016. The studies included in our assessment all included a direct comparison of the enriched water and bubble methods with common samples. In all, 13 studies met the requirements for inclusion (n = 368 observations) along with two unpublished data sets (Supplementary Table 1, Supplementary Figure 1). 15N2 fixation rates were either provided personally by authors, retrieved from tables published in supplemental material or manually digitized from figures in the published studies using the software WebPlotDigitizer (version 3.10) (Ankit Rohatgi, http://arohatgi.info/WebPlotDigitizer/).
Before performing the meta-analysis, we determined the statistical dispersion and variability within the bubble and enriched water data sets. We calculated the mean absolute deviation (MAD) of each data set as follows:
where n is the number of observations and is the mean of the individual observations xi.
Meta-analysis and meta-regression were conducted with R 3.1.2 using the “metafor” package (Viechtbauer, 2010), metafor package of R [http://www.metafor-project.org/], R Development Core Team 2013). To assess the two methods, we used the logarithmically transformed response ratio (Hedges et al., 1999), lnRR, where RR is the ratio of rates (R) measured with the enriched water and bubble methods (RR = Renrichedwater:Rbubble), or the effect size of individual experiments), as well as the corresponding pooled standard deviation. All lnRR values were weighted by the reciprocal of their sampling variance, followed by a random effects model to compute the overall mean effect size, which is equivalent to Cohen's d parameter (Cohen, 1977). The random effects model, based on the DerSimonian-Laird estimator (DerSimonian and Laird, 1986) calculates the between-study variance (σ2) and weights each study by the inverse sum of the individual study variance (νi) and the between- study variance. Mean effect sizes (i.e., Cohen's d) were statistically significant different if their 95% confidence intervals did not overlap zero.
Apart from calculating the mean effect sizes for all 13 studies and 368 observations, we also divided observations into two groups: short incubation time (0–12 h) and long incubation times (24 h). For short incubation times three data sets were available (Mohr et al., 2010; Klawonn et al., 2015; Benavides and Wannicke et al., unpubl.,). Unfortunately, the experiments of Mohr et al. (2010) and Klawonn et al. (2015) lacked replication from single time points. To be able to include this data set in our meta-analysis, we pooled values collected at t = 0 to 12 h. Results from these publications for t = 24 h had to be omitted from the meta-analysis due to lack of replication. Furthermore, we added a subgroup analysis for each meta-analysis to determine mean effect sizes excluding unpublished data sets.
To explore heterogeneity in the meta-analysis, we calculated Cochrane Q-tests for heterogeneity (Cochran, 1954). A significant Q-statistic (p-value of < 0.1) indicates that there is heterogeneity within the mean effect size and a greater variance among individual effect sizes than expected by sampling error. We furthermore, examined the sensitivity of the meta-analysis by examining publication bias (the probability that statistically significant (p < 0.05) results are more likely to be published than non-statistically significant results) using a contour-enhanced funnel plot (Peters et al., 2008; Supplementary Figure 2). The funnel plot represents a scatter plot of the effect estimates from individual studies against the standard error of the effect estimate. Specifically, a contour-enhanced funnel plots display the area of statistical significance on a funnel plot (Peters et al., 2008) to improve the correct identification of the presence or absence of publication bias. Publication bias would be expected when the usual funnel plot is asymmetrical.
Random-effects meta-regression analysis using a linear mixed-effects model was used to evaluate the association between incubation time and the mean effect size of 15N2 fixation.
For interpretation of the meta-analysis we converted Cohen's d value to Cohen's U3 parameter (Cohen, 1977) to give a measure of the degree of separation (i.e., % non-overlap) of data produced by the bubble and enriched water methods according to:
where Φ is the cumulative distribution function of the standard normal distribution, and δ is the population value of Cohen's d.
In addition, we calculated the overlapping coefficient (OVL) of data from the two methods by converting Cohen's d using the following formula (Reiser and Faraggi, 1999)
where Φ is the cumulative distribution function of the standard normal distribution, and δ the population Cohen's d.
The probability of superiority (CL) (Ruscio and Mullen, 2012) i.e., probability that a sample picked at random from the treatment group will have a higher score than a sample picked at random from the control group, was calculated the following (Ruscio, 2008)
where Φ is the cumulative distribution function of the standard normal distribution, and δ the population Cohen's d.
Results
Experimental Dissolution of 15N2 in Brackish Seawater
Dissolution of 15N2 gas according to Montoya et al. (1996) resulted in a maximum 15N atom% enrichment of 9.1 % (mean value for 24 h of incubation, Figure 1). Fitting of data resulted in an atom% enrichment of 7.8% (solid line, Figure 1). The time to reach 50% of the maximum 15N atom% enrichment was 1.7 h and the shift from an exponential rise in dissolved 15N enrichment to a plateau with only minimal changes in 15N atom% enrichment (>60% of maximum) occurred after 4 h. After 8 h, 90% of 15N atom% equilibration was reached. Injection of water pre-enriched with 15N2 gas according to Mohr et al. (2010) resulted in a stable 15N atom% enrichment over 24 h with a mean value of 7.5 ± 0. 9% (Figure 1).
Error Estimate for the Bubble Method During Isotopic Equilibration
When using the bubble method, the rate of 15N2 fixation will be systematically underestimated during the equilibration phase of 15N2 gas with the dissolved pool of N2 (Figure 2A). The overall magnitude of the underestimate during an incubation will depend on the length of the incubation and the timing and duration of 15N2 fixation activity during the incubation period (Figure 2B), which in turn will reflect the nature (light depended or light independent) of the diazotrophic community present. The maximum error of −72% occurs when the time lag between gas injection and start of the 15N2 fixation is zero (Ti = 0 h) and the duration of 15N2 fixation is 1 h (Tf = 1 h, red dot in Figure 2A). In contrast, a 12 h period of active fixation beginning 6 h after the injection of 15N2 gas will result in an error of −0.2% (green square in Figure 2A, green solid line in Figure 2B, Ti = 6 h and Tf = 12 h).
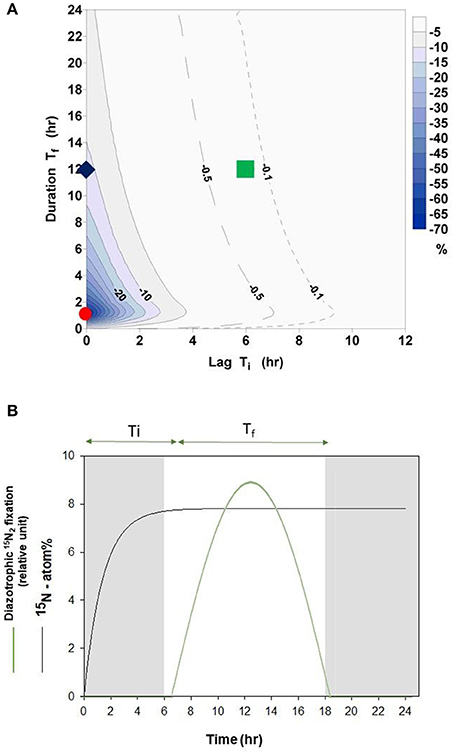
Figure 2. (A) Percentage error according to Equation (7) in relation to phase lag Ti (time lag between gas injection and start of 15N2 fixation by diazotrophs) and to Tf (length of active fixation period). The contour interval is 5%. In addition the −0.5% (dashed) and the −0.1% (dotted) line are added. Red dot = error of −72% (Ti = 0 h, Tf = 1 h), Green square = error of −0.2% (Ti = 6 h, Tf = 12 h), blue diamond = error of −12% (Ti = 0 h, Tf = 12 h). (B) Schematic representation of an experiment reflecting conditions of an error of −0.2% of the bubble method as presented in (A) (Green square). Here, active light depended 15N2 fixation (solid green line) occurs over a 12 h period (Tf). The time lag (Ti) between 15N2 gas injection and beginning of diazotrophic 15N2 fixation is 6 h. Fitted data from experimental dissolution of 15N2 is also shown (black line, see also Figure 1).
When organisms are able to fix N2 continuously, the error would be −12% (blue diamond in Figure 2A, Ti = 0 h and Tf = 12 h) over a 12 h incubation and −6% over a 24 h incubation (Ti = 0 h and Tf = 24 h).
Meta-Analysis
Variability among the replicates of individual studies was quite large as indicated by the standard deviation for the single studies and MAD of the two methods applied (Figure 3). Specifically, the MAD for the enriched water method is 7 and the MAD for bubble method is 5.
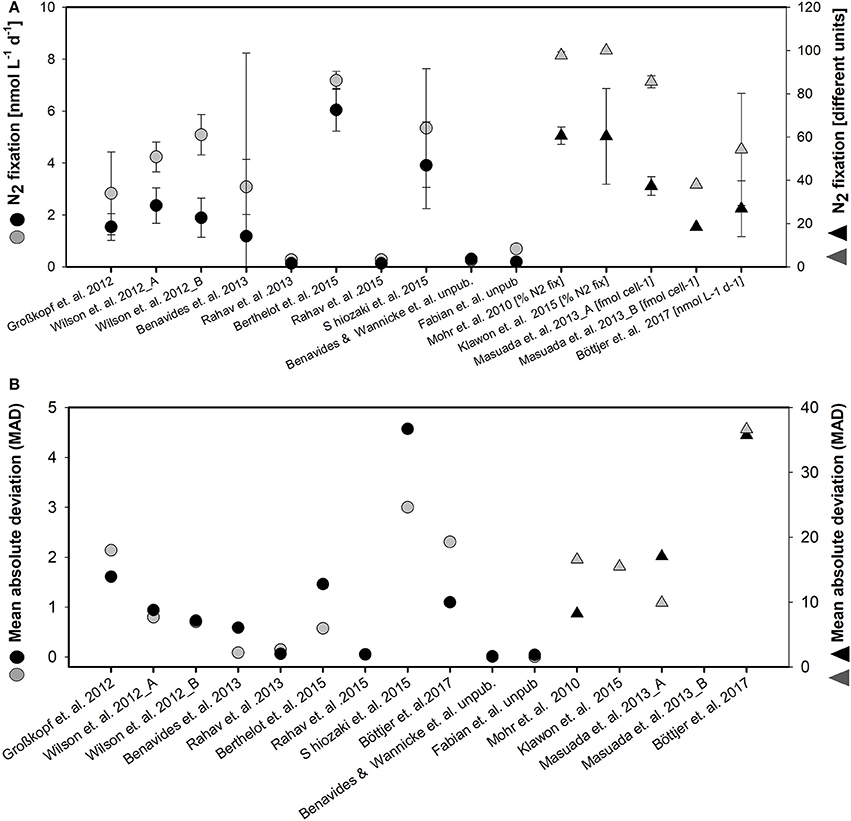
Figure 3. Mean value and standard deviation for N2 fixation (different units) (A) and mean absolute deviation (MAD) (B) for enriched water method (black symbols) and bubble method (gray symbols) of the different studies considered in the meta- analysis. Note the different scales and different units for studies indicated by the second right-handed ordinate (units are given next to the authors name in the abscissae).
To determine a mean effect size (i.e., Cohen's d), we firstly resolved the response ratio (lnRR) of N2 fixation for each study (Figure 4A). Subsequently, we calculated the overall mean effect size across all studies which resulted in a significant Cohen's d of 0.406 ± 0.110, (p < 0.001; Figure 4B). The mean effect size of ~0.4, detected in our analysis suggests that for a method comparison, 65 % of measurements from the enriched water group will be above the mean of the bubble group (Cohen's U3, for subgroup analysis 73%) and that 84% of the measurements in the two groups will overlap (subgroup analysis 76%). In addition, there is a 61% chance that a sample picked at random from the enriched water group will have a higher value than one picked at random from the bubble group (subgroup analysis 66%).
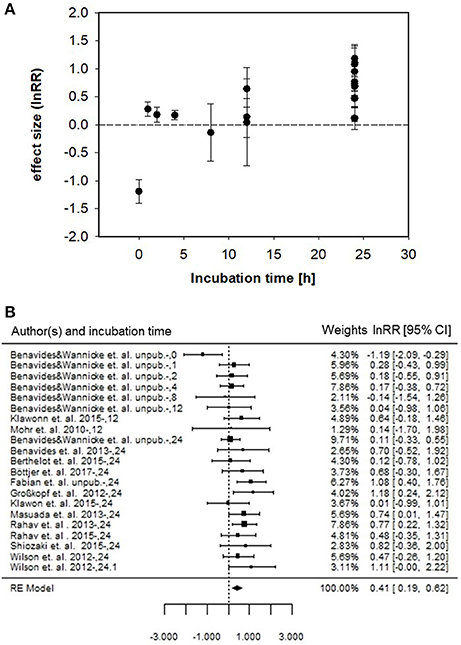
Figure 4. (A) Response ratios (lnRR) of the bubble vs. dissolved enriched water method to detect 15N2 fixation and corresponding standard error for the different studies and incubation time intervals. (B) Forest plot of lnRR and mean effect size (i.e. RE Model) of enriched water vs. bubble method for all incubation times. Left panel indicates authors and incubation time interval. Middle panel denotes each study represented by a filled square and horizontal line (symbol size represents corresponding weighted lnRR, line represents 95% confidence interval). Right panel provides weighted lnRR and 95% confidence interval. Studies with confidence intervals that intersect the vertical line of unity (lnRR = 0) indicate no difference between the enriched water and bubble method. Heterogeneity of the meta-analysis is indicated by QM(df = 20) = 28.99, p = 0.0878.
A subgroup analysis excluding the unpublished data sets revealed a significant mean effect size of 0.631 ± 0.125 (p < 0.001).
We also performed a meta-regression to evaluate the influence of time on the overall mean effect size. No significant impact was detected (data not shown). Moreover, we checked for publication bias, which is expected when scatter of data in the funnel plot is asymmetric. In our analysis, assessment of the contour-enhanced funnel plot indicates an asymmetrical scatter of data and potential publication bias introduced by a lack of non-significant studies (Supplementary Figure 2).
We furthermore, did separate meta- analysis for observations with short incubation times (0–12 h) and long incubation times (24 h only, Supplementary Figures 3A,B). The overall mean effect size of the three studies with short incubation time was not significant with a Cohen's d of 0.057 ± 0.188, (p > 0.1) (Supplementary Figure 3A). Excluding the unpublished data set of Benavides and Wannicke et al., revealed a non-significant mean effect size of 0.557 ± 0.382 (p > 0.1). Furthermore, the meta- analysis for long incubation times of 24 h resulted in a Cohen's d of 0.406 ± 0.101 (p < 0.001) (Supplementary Figure 3B). Excluding unpublished studies resulted in a mean effect size of 0.68 ± 0.136 (p < 0.001).
We found no significant correlations with ocean province or temperature in exploring which factors might influence the mean effect size (data not shown).
Discussion
We combined a theoretical examination of the error associated with the equilibration time of the bubble of 15N2 gas and a meta-analysis of published and unpublished sets of N2-fixation measurements comparing both methods. Our findings allows us to detect mean differences in rate estimates and provide critical insight into the strengths and weaknesses of the two experimental approaches.
Error Estimation of Bubble Method
Our error estimation of the bubble method during a 24 h experiment reveals a negligible error of −0.2% assuming a diazotroph community that fixes only during 12 h daytime and starting of nitrogen fixation 6 h after the injection of 15N2 gas i.e., the addition was done 6 h before sunrise. Considering that the error introduced by using a gas-tight syringe to inject 15N2 gas of ±1% (according to the manufacturer, Hamilton USA), the error introduced by using bubble injection is insignificant. The error introduced by using the bubble method will increase to −6% when diazotrophs fix continuously over 24 h (assuming there is no time lag between bubble injection and start of active fixation). Overall, it is important to adjust incubation times relative to the onset of active N2 fixation (which is in turn is depended on the dominating diazotrophs present), as has been indicated before (Mohr et al., 2010; Wilson et al., 2012).
Meta-Analytical Comparison of the Enriched Water and Bubble Method
Statistical dispersion, as represented by the MAD from the mean value, appears to be higher in the data set based on the enriched water method (mean MAD of all studies 7) than in the data set of studies that used the bubble method (mean MAD of all studies 5). That is, measured N2 fixation rates appear to be more consistent when determined using the bubble method. A larger dispersion of data in experiments using the enriched water method might be introduced in by the process of preparing the enriched water for later usage, i.e., degassing water of different volumes and varying accuracy of degassing. In addition, Wilson et al. (2012) presented evidence for a dispersion of data in experiments using the enriched water method, which was connected to abiotic factors influencing the incubation itself. They noted an interesting contrast between the two methods when comparing samples incubated at sea using either an in situ array or shipboard incubators. Specifically, they found that the enriched water method produced depth-integrated N2-fixation estimates that were 30% greater when samples were incubated aboard ship in deck incubators than when incubated on an in situ array. In contrast, depth-integrated rates measured using the bubble method were not significantly different between incubations carried out on deck and on an in situ array. The 30 % difference among replicates of the enriched water method also overlaps with the divergence of the enriched water and bubble methods referred to by Mohr et al. (2010) and Wilson et al. (2012) in their methods assessments.
Our meta- analysis revealed a large congruence in the estimates of 15N2 fixation rate produced using the two experimental methods. The 84% overlap of rate estimates make it very difficult at this stage to estimate any sort of a global factor to quantify the degree of underestimation of 15N2 fixation rates when using the bubble method. Our literature review moreover revealed that a thorough comparison over a 24-h cycle is needed with only three studies on sort incubation times of 0–12 h. A larger comparative analysis is clearly necessary especially in view of the elevated dispersion (i.e., larger MAD) of 15N2 fixation rates measured using the enriched water method.
As Großkopf et al. (2012) have pointed out, there is an indication for a species-specific potential for underestimation of N2 fixation rates using the bubble method, especially when buoyant diazotrophs are presented. Thus, in habitats dominated by filamentous species like Trichodesmium or Nodularia, underestimation seems to be less severe compared to habitats dominated by unicellular species (UCYN, e.g., Zehr et al., 1998), as well as non-diazotrophic Bacteria and Archaea (e.g., Riemann et al., 2010). In the latter, incubation times have to be adjusted to the equilibration time of 15N2 when using the bubble method. Alternatively, as proposed in the sub-chapter below (see “Experimental Recommendations”) the determination of the final 15N2 (i.e., substrate) enrichment in the incubation bottle enables a concerted calculation of N2 fixation rates.
Dealing With Unpublished Data-Sets
In our analysis, we have included two data sets that are currently unpublished (Benavides and Wannicke et al., Fabian et al., Supplementary Table 1). The literature dealing with the inclusion of unpublished data in meta-analysis clearly recommends inclusion of this sort of “gray literature” (e.g., Cook et al., 1993; McAuley et al., 2000). Exclusion from meta-analysis can lead to exaggerated overestimation of treatment effects (e.g., Cook et al., 1993; McAuley et al., 2000). This is also reflected in our analysis of funnel plot symmetry, where studies displaying no significant effect (Cohen's d of ~ 0) are under-represented and/or missing in our analysis. Overall, publication bias is the greatest threat to the validity of meta-analysis, because combining only the identified published studies uncritically, may lead to an incorrect, unusually one sided, conclusion.
General Experimental Considerations for Future Nitrogen Fixation Measurements
A number of experimental factors have a strong influence on the precision and accuracy of the determination of N2-fixation rates. Firstly, the sensitivity of any experiment using 15N2 depends on the amount of tracer added to the dissolved pool of N2. For example, addition of 1 mL of 15N2 per liter of sample will produce an equilibrium enrichment of ~5–10 atom% 15N, depending on the size of the ambient pool of N2. In contrast, the procedure proposed by Großkopf et al. (2012) results in an enrichment of only 2 atom%. Since N2 availability does not limit N2-fixation activity, greater additions may easily be realized to increase the substrate labeling, thereby increasing the sensitivity of the rate measurement. This is especially important in systems where rates are expected to be low, for example in aphotic deep waters. In general, we recommend adding sufficient 15N2 to raise the 15N content of the dissolved N2 pool to 9–10 at% as noted by Montoya et al. (1996).
Secondly, the natural variability of δ15N of the particulate nitrogen (PN) pool sets a lower limit to rate measurements. If the variability in δ15N of PN is high at the start of the incubation (t0) and the final increase in δ15N values of the PN in the incubation bottles is low due to low N2 fixation rates, then N2-fixation activity may not be detectable. For example, Wasmund et al. (2015) have nicely explored this issue, discussing 15N2 fixation rate measurements in the Benguela upwelling region where they compared initial (t0) and final δ15N measurements of samples incubated with 15N2. The mean values of the two batches of filters differed only by 0.9‰, leading Wasmund et al. (2015) to conclude that 15N2 fixation rates were too low to resolve with the tracer method. Nowadays, mass spectrometers clearly perform analytical precisions of 0.2‰ and better. Therefore, the detection limit of enriched PN is well below 4‰, as original proposed in the paper by Montoya et al. (1996).
Finally, the two experimental approaches differ fundamentally in the degree and nature of experimental manipulation of the sample. The bubble method involves minimal handling (a thourough mixing of water and gas bubble after injection has to be guaranteed, by using e.g., a continuously rotating) and perturbation of the system, but can lead to a systematic underestimate of N2-fixation rate if a significant fraction of the overall activity during the experiment occurs during the isotopic equilibration phase. In contrast, the enriched water method requires extensive processing in advance to prepare the 15N2-labeled water used to inject tracer into the experimental bottle as described by Klawonn et al. (2015) and Mulholland et al. (2012). Ideally, the enriched water should be obtained from the same location and depth as the experimental sample, which imposes a significant cost in time and handling while setting up the experiment, with the added risk of contamination with ammonium, DON, or other dissolved species during handling. If the enriched water is prepared in advance from artificial seawater or water obtained at a different station, it represents an addition of alien water and dissolved species and should be minimized in volume to less than a few percent of the bottle volume. The potential for contamination and the degree to which the addition of enriched water may affect estimates of N2 fixation rates are very difficult to constrain but can clearly compromise the reliability of the final rate estimates. Another approach using the bubble addition followed by the removal of the bubble after only few hours and retrieval of a subsample for determination of 15N2 atom% enrichment requires the tedious determination of the 15N2 atom% enrichment for each incubation bottle (Jayakumar et al., 2017). Although this approach is easy to handle, it requires efficient handling and subsequent stable isotope analysis.
Our dissolution experiments investigating the isotopic equilibration in seawater along with the theoretical error calculation both suggest that incubation times longer than about 6 h are minimally affected by the equilibration of the added 15N2 gas and the dissolved pool of N2 in the experimental bottle (Figures 3A, 4A). In practical terms, 24 h incubations are frequently recommended and used because these experiments integrate over a full day/night cycle.
A final recommendation to improve the accuracy of N2 fixation measurements and potentially help resolve the source of variability among replicates is collection and preservation of a water sample from each experimental bottle for determination of the final 15N2 (i.e., substrate) enrichment. This would improve the accuracy of the enriched water, as well as the bubble method, both of which typically rely on solubility calculations to estimate the size of the ambient pool of N2, which in turn determines the actual 15N2 enrichment of the dissolved pool.
Author Contributions
All authors contributed to the design of the study. Laboratory and analytical work was conducted by NW, MB, JM, and TD. Data search and meta- analysis was performed by NW and MB. Error analysis was contrived by MV and JD and calculated by JD. NW wrote the initial draft of the manuscript and all authors contributed to its revision.
Funding
MB was supported by grant 6108-00013 from the Danish Council for independent research, and grant A1371347 from the German Academic Exchange Service. NW and MV received support from the German Ministry of Science and Technology, BIOACID grant 03F0728F. JM received support from the National Science Foundation grant NSF-OCE-1737078.
Conflict of Interest Statement
The authors declare that the research was conducted in the absence of any commercial or financial relationships that could be construed as a potential conflict of interest.
Acknowledgments
We thank Dr. Sophie Rabouille for handling the editorial process and the two referees whose comments improved this manuscript.
Supplementary Material
The Supplementary Material for this article can be found online at: https://www.frontiersin.org/articles/10.3389/fmars.2018.00120/full#supplementary-material
References
Burris, R. H., and Miller, C. E. (1941). Application of N 15 to the study of biological nitrogen fixation. Science 93, 114–115.
Cochran, W. G. (1954). The combination of estimates from different experiments. Biometrics 10, 101–129. doi: 10.2307/3001666
Cohen, J. (1977). Statistical Power Analysis for the Behavioral Sciences (revised Edn). New York, NY: Academic Press.
Cook, D. J., Guyatt, G. H., Ryan, G., Clifton, J., Buckingham, L., Willan, A., et al. (1993). Should unpublished data be included in meta-analyses?: current convictions and controversies. JAMA 269, 2749–2753. doi: 10.1001/jama.1993.03500210049030
Dalsgaard, T., and Thamdrup, B. (2002). Factors controlling anaerobic ammonium oxidation with nitrite in marine sediments. Appl. Environ. Microbiol. 68, 3802–3808. doi: 10.1128/AEM.68.8.3802-3808.2002
DerSimonian, R., and Laird, N. (1986). Meta-analysis in clinical trials. Control. Clin. Trials 7, 177–188. doi: 10.1016/0197-2456(86)90046-2
Großkopf, T., Mohr, W., Baustian, T., Schunck, H., Gill, D., Kuypers, M. M., et al. (2012). Doubling of marine dinitrogen-fixation rates based on direct measurements. Nature 488, 361–364. doi: 10.1038/nature11338
Hamme, R. C., and Emerson, S. R. (2004). The solubility of neon, nitrogen and argon in distilled water and seawater. Deep Sea Res. Part I Oceanogr. Res. Pap. 51, 1517–1528. doi: 10.1016/j.dsr.2004.06.009
Hedges, L. V., Gurevitch, J., and Curtis, P. S. (1999). The meta-analysis of response ratios in experimental ecology. Ecology 80, 1150–1156. doi: 10.1890/0012-9658(1999)080[1150:TMAORR]2.0.CO;2
Holtappels, M., Lavik, G., Jensen, M. M., and Kuypers, M. M. (2011). 15N-labeling experiments to dissect the contributions of heterotrophic denitrification and anammox to nitrogen removal in the OMZ waters of the ocean. Methods Enzymol. 486, 223–251. doi: 10.1016/B978-0-12-381294-0.00010-9
Jayakumar, A., Chang, B. X., Widner, B., Bernhardt, P., Mulholland, M. R., and Ward, B. B. (2017). Biological nitrogen fixation in the oxygen-minimum region of the eastern tropical North Pacific ocean. ISME J. 11, 2356–2367. doi: 10.1038/ismej.2017.97
Klawonn, I., Lavik, G., Böning, P., Marchant, H. K., Dekaezemacker, J., Mohr, W., et al. (2015). Simple approach for the preparation of 15– 15N2-enriched water for nitrogen fixation assessments: evaluation, application and recommendations. Front. Microbiol. 6:769. doi: 10.3389/fmicb.2015.00769
Luo, Y.-W., Doney, S., Anderson, L., Benavides, M., Berman-Frank, I., Bode, A., et al. (2012). Database of diazotrophs in global ocean: abundance, biomass and nitrogen fixation rates. Earth Syst. Sci. Data 4, 47–73. doi: 10.5194/essd-4-47-2012
McAuley, L., Tugwell, P., and Moher, D. (2000). Does the inclusion of grey literature influence estimates of intervention effectiveness reported in meta-analyses? Lancet 356, 1228–1231. doi: 10.1016/S0140-6736(00)02786-0
Mohr, W., Grosskopf, T., Wallace, D. W., and LaRoche, J. (2010). Methodological underestimation of oceanic nitrogen fixation rates. PLoS ONE 5:e12583. doi: 10.1371/journal.pone.0012583
Montoya, J. P., Voss, M., Kahler, P., and Capone, D. G. (1996). A simple, high-precision, high-sensitivity tracer assay for N (inf2) fixation. Appl. Environ. Microbiol. 62, 986–993.
Mulholland, M. R., Bernhardt, P. W., Blanco-Garcia, J. L., Mannino, A., Hyde, K., Mondragon, E., et al. (2012). Rates of dinitrogen fixation and the abundance of diazotrophs in North American coastal waters between Cape Hatteras and Georges Bank. Limnol. Oceanogr. 57, 1067–1083. doi: 10.4319/lo.2012.57.4.1067
Peters, J. L., Sutton, A. J., Jones, D. R., Abrams, K. R., and Rushton, L. (2008). Contour-enhanced meta-analysis funnel plots help distinguish publication bias from other causes of asymmetry. J. Clin. Epidemiol. 61, 991–996. doi: 10.1016/j.jclinepi.2007.11.010
Reiser, B., and Faraggi, D. (1999). Confidence intervals for the overlapping coefficient: the normal equal variance case. J. R. Stat. Soc. D 48, 413–418. doi: 10.1111/1467-9884.00199
Riemann, L., Farnelid, H., and Steward, G. F. (2010). Nitrogenase genes in non-cyanobacterial plankton: prevalence, diversity and regulation in marine waters. Aquat. Microb. Ecol. 61, 235–247. doi: 10.3354/ame01431
Ruscio, J. (2008). A probability-based measure of effect size: robustness to base rates and other factors. Psychol. Methods 13:19. doi: 10.1037/1082-989X.13.1.19
Ruscio, J., and Mullen, T. (2012). Confidence intervals for the probability of superiority effect size measure and the area under a receiver operating characteristic curve. Multivariate Behav. Res. 47, 201–223. doi: 10.1080/00273171.2012.658329
Shiozaki, T., Nagata, T., Ijichi, M., and Furuya, K. (2015). Nitrogen fixation and the diazotroph community in the temperate coastal region of the northwestern North Pacific. Biogeosciences 12, 4751–4764. doi: 10.5194/bg-12-4751-2015
Viechtbauer, W. (2010). Conducting meta-analyses in R with the metafor package. J. Stat. Softw. 36, 1–48. doi: 10.18637/jss.v036.i03
Wasmund, N., Struck, U., Hansen, A., Flohr, A., Nausch, G., Grüttmüller, A., et al. (2015). Missing nitrogen fixation in the Benguela region. Deep Sea Res. I Oceanogr. Res. Pap. 106, 30–41. doi: 10.1016/j.dsr.2015.10.007
Weiss, R. (1970). The solubility of nitrogen, oxygen and argon in water and seawater Deep Sea Res. Oceanogr. Abstr. 17, 721–735. doi: 10.1016/0011-7471(70)90037-9
Wilson, S. T., Böttjer, D., Church, M. J., and Karl, D. M. (2012). Comparative assessment of nitrogen fixation methodologies, conducted in the oligotrophic North Pacific Ocean. Appl. Environ. Microbiol. 78, 6516–6523. doi: 10.1128/AEM.01146-12
Keywords: 15N2 fixation, enriched water method, bubble method, diazotrophs, meta-analysis
Citation: Wannicke N, Benavides M, Dalsgaard T, Dippner JW, Montoya JP and Voss M (2018) New Perspectives on Nitrogen Fixation Measurements Using 15N2 Gas. Front. Mar. Sci. 5:120. doi: 10.3389/fmars.2018.00120
Received: 20 September 2017; Accepted: 21 March 2018;
Published: 06 April 2018.
Edited by:
Sophie Rabouille, UMR7093 Laboratoire d'océanographie de Villefranche (LOV), FranceReviewed by:
Christine Ferrier-Pagès, Scientific Centre of Monaco, MonacoPatrick Raimbault, UMR7294 Institut Méditerranéen d'océanographie (MIO), France
Copyright © 2018 Wannicke, Benavides, Dalsgaard, Dippner, Montoya and Voss. This is an open-access article distributed under the terms of the Creative Commons Attribution License (CC BY). The use, distribution or reproduction in other forums is permitted, provided the original author(s) and the copyright owner are credited and that the original publication in this journal is cited, in accordance with accepted academic practice. No use, distribution or reproduction is permitted which does not comply with these terms.
*Correspondence: Nicola Wannicke, nicola.wannicke@inp-greifswald.de