Sonification of Animal Tracks as an Alternative Representation of Multi-Dimensional Data: A Northern Elephant Seal Example
 Carlos M. Duarte1*
  Paul Riker2†
  Madhusudhanan Srinivasan2
  Patrick W. Robinson3
  Juan P. Gallo-Reynoso4 Daniel P. Costa3
- 1Red Sea Research Center, King Abdullah University of Science and Technology, Thuwal, Saudi Arabia
- 2Core Labs, King Abdullah University of Science and Technology, Thuwal, Saudi Arabia
- 3Department of Ecology and Evolutionary Biology, University of California, Santa Cruz, Santa Cruz, CA, United States
- 4Centro de Investigación en Alimentación y Desarrollo A. C., Hermosillo, Mexico
Understanding movement of marine megafauna across the ocean is largely based on approaches and models based on analysis of tracks of single animals. While this has led to major progress, the possibility of concerted group dynamics has not been sufficiently examined, possibly due to challenges in exploring massive amounts of data required to this end. Here we report a sonification experiment, where the collective movement of northern elephant seals (Mirounga angustirostris) was explored by coding their group dynamics into sound. Specifically, we converted into sound data derived from a tagging program involving a total of 321 tagged animals tracked over a decade, between 20 February 2004 and 30 May 2014, consisting of an observation period of 90,063 h, composed of 1,027,839 individual positions. The data parameters used to provide the sound are position (longitude) and spread (degree of displacement taken for the active group). These data parameters are mapped to the sonic parameters of frequency (pitch) and amplitude (volume), respectively. Examination of the resulting sound revealed features of motion that translate into specific patterns in space. The serial departure of elephant seals to initiate their trips into waves is clearly reflected in the addition of tonalities, with coherent swimming of the animals conforming a wave reflected in the modulated fluctuations in volume, suggesting coordinated fluctuations in dispersion of the wave. Smooth changes in volume, coordinated with pitch variability, indicate that the animals spread out as they move further away from the colony, with one or a few animals exploring an ocean area away from that explored by the core wave. The shift in volume and pitch also signals at group coordination in initiating the return home. Coordinated initiation of the return to the colony is also clearly revealed by the sonification, as reflected in an increase in volume and pitch of the notes denoting the movement of each animal in a migration wave. This sonification reveals clear patterns of covariation in movement data, which drivers and triggers, whether intrinsic or environmental, cannot be elucidated here but allow to formulate a number of non-trivial questions on the synchronized nature of group behavior of northern elephant seals foraging across the NE Pacific Ocean.
Introduction
The development of tracking devices has allowed fundamental insights into how large marine animals use the vast ocean environment (Costa, 1993; Costa et al., 2012), providing fundamental ecological insights to ensure their conservation (e.g., Maxwell et al., 2013; Hussey et al., 2015; Hays et al., 2016). Satellite tags are particularly appropriate for large marine mammals because they move across considerable distances, often spanning entire ocean basins, surfacing regularly to breath (Hussey et al., 2015). Whereas, most animal tracking papers focus on the detailed analyses of movement of one or a few animals, projects tracking dozens to hundreds of animals are emerging allowing a better understanding of animal use of the ocean ecosystem and how populations of organisms use them (e.g., Block et al., 2011; Costa et al., 2012; Hays et al., 2016; Rodríguez et al., 2017). Indeed, big-data approaches to animal tracking are emerging (e.g., Rodríguez et al., 2017), following developments in human mobility studies enabled by massive data delivered by smart phones (Meekan et al., 2017). However, most studies to date are based on the analysis of trajectories one animal at a time, as the analyses of concerted movements of multiple tagged animals remains challenging, due to the high dimensionality of the data (4-D movement by N animals).
Data sonification, the use of non-speech audio to convey complex information, emerged in the 1990s (cf. Dubus and Bresin, 2013), first as a tool to assist visually-impaired analysts to explore data (e.g., Zhao et al., 2008), as well as an option when visual attention must be devoted to other tasks (e.g., Nees and Walker, 2014; Compare, 2017). The emergence of data sonification as an analytical approach is particularly well-suited for time-related tasks, such as monitoring, synchronization or understanding motion of multiple objects (Dubus and Bresin, 2013). Indeed, Kepler used a sonification of planetary motion around the sun, described in his treatise Harmonices Mundi (1619), as a heuristic tool helping understand the concerted motion leading to his third law of planetary motion. Sonification of movement data can represent both movement relative to a fixed, reference point (e.g., planets relative to the sun in Kepler's model) as well as movement of several objects relative to each other (e.g., planets among themselves in Kepler's model). Hence, data sonification approaches may offer a potential to explore massive data involving simultaneous movement of multiple animals across the ocean, where the movement among the different individuals maybe hypothesized not to be entirely independent. Yet, to the best of our knowledge data sonification has not been explored as a tool to examine animal movement thus far.
Here we present the use of data sonification as an analytical method to explore the collective movement patterns of waves of northern elephant seals (Mirounga angustirostris) traveling across thousands of kilometers in the NE Pacific from California colonies (Le Boeuf et al., 2000). The data set used derives from a tagging program involving a total of 321 tagged animals tracked over a decade, between 20 February 2004 and 30 May 2014, consisting of an observation period of 90,063 h, composed of 1,027,839 individual positions. The sonification presented here focuses on the methodological implementation of the representation, as an additional tool, together with visualizations, also provided here, to explore the collective movement of this species. Hence, we use this as a heuristic tool to pose questions, acknowledging that the interpretation or possible mechanisms driving the observed patterns cannot be resolved and would require a more quantitative approach better suited for hypothesis testing. Hence, terms such as coordinated, concerted or synchronized to refer to features of the data are used here in their phenomenological sense, without implying the existence of specific mechanisms leading to these features in collective movement.
Methods
Tagging of Northern Elephant Seals
The animals studied were adult female northern elephant seals (M. angustirostris) instrumented at two breeding colonies: Año Nuevo state reserve, California, USA (37° 5′N, 122° 16′W; n = 277) and Islas San Benito, Mexico (28° 18′N, 115° 22′W; n = 20). The animals were immobilized following standard techniques (Robinson et al., 2012) and equipped with a 0.5 W ARGOS satellite transmitter (Wildlife Computers, Belleview, WA, USA: SPOT4, SPOT5, MK10-AF; or Sea Mammal Research Unit, St. Andrews, Scotland: SRDL-CTD) using a ~45 s repetition rate, a time-depth recorder (Wildlife Computers MK9, MK10) sampling at least once every 8 s, and a VHF transmitter attached to assist in locating the animals on the beach upon their return (MM170B and MM230B, ATS, Isanti, MN, USA). Further details on the animals tagged and data processing are provided in Robinson et al. (2012). The movement was plotted and summarized as cumulative distance traveled by each animal from departure to arrival to the rookery in each voyage and the group spread, representing the area covered by the group at any one-point time during their time at sea. The data set is available from the Earthdata program of NASA (https://cmr.earthdata.nasa.gov/search/concepts/C1214591971-SCIOPS).
The animal use research protocol was reviewed and approved by the University of California at Santa Cruz Institutional Animal Care and Use Committee and was authorized under National Marine Fisheries Service permits: #786-1463 and #87-143.
Sonification Method
In order to remain faithful to the movements of the animals, we employed a direct parameter mapping sonification of animal movements to sound. The data parameters are position (longitude) and spread (degree of displacement taken for the active group). These data parameters are mapped to the sonic parameters of frequency (pitch) and amplitude (volume), respectively, the two most used auditory dimensions in sonification applications, particularly those related to kinematic data (Dubus and Bresin, 2013). An alternative mode using latitude instead of longitude would also be possible, but prevailing zonal movement of the animals in this case, longitude provides a more faithful aural representation of their movements.
The sonification proceeds in time order at a speed of 100,000 times real-time, allowing the compression of the 10 years of data into a composition played over < 1 h. Relative time values are preserved by deriving the delay times between events directly from the differences between adjacent timestamp values in the data.
Longitude minimum and maximum were identified for the entire dataset. This span defines the total possible longitudinal range for the sonification. We also define an array of musical notes, onto which these positional values will map. This array, is shown as a diatonic collection of musical notes with an intervallic composition (Figure 1) so that there is more frequency space between the lower members of the ordered set. This intervallic arrangement avoids low frequency muddiness when multiple animals map simultaneously to this area of the array, thus preserving clarity and ideal chord voicing. As an animal travels from west to east, the resulting musical note moves correspondingly from low to high pitch in a linear fashion.
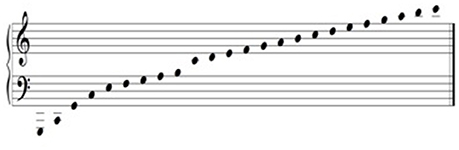
Figure 1. Pitch Frequency array used in the sonification of individual northern elephant seals.
The animals departed from the colony in waves associated with the end of a breeding or molting cycle, each wave by a set of animals constituted a sonification set. For each record in the dataset, we compute the spatial “spread” value for the active group or groups. Taking the minimum and maximum spread values for the data as a whole, we again perform a linear mapping, this time of the spread value onto the amplitude of the animal's note. As the spread value increases, the amplitude decreases so that if a group of animals are widely dispersed, the resulting music is relatively quiet and conversely, a tight group of animals will be relatively loud. Minimum and maximum amplitude values are selected subjectively with the overall musicality in mind.
The calculation of the spatial “spread,” at any time during a group's voyage, is accomplished by computing the geodesic variance of the (lon, lat) positions of the group members, at that point in time. More specifically, for a given group of N elephant seals in a voyage, if pi(t) denotes the (loni(t), lati(t)) position of a seal member i in the group at time t, then the “spread” is defined as
where ||. ||geo calculates the geodesic distance between two points on the surface of earth, and denotes the mean longitude and latitude position of the elephant seals at time t (Rogerson, 2001). Conceptually, the “spread” is a geodesic variance that is representative of the dispersion of elephant seals, or the area of ocean covered by the group, during the course of their voyage.
In this way, the sonification proceeds such that each animal's movement renders a distinct musical line and each group of animals create a counterpoint whose overall intensity is also driven by the group movement, holistically.
In principle, any visualization of the elephant-seal movement must be in complete synchrony with the time-events occurring in the data, as well as with the sonification method employed. For this reason, the sonification engine described above, is the primary “driver” for the visualization interface (Figure 2). The visualization engine itself is a web-based application utilizing a mapping layer overlaid with “real time” animal tracks as the events are encountered from the data. The application also renders a “scrolling” graph indicating spread and cumulative distance traveled as the events are received and processed (Figure 2). The visualization engine is implemented as a web-based application on the same local machine, but independent of the sonification engine. At each time event in the data, all of the relevant information—animal ID number, latitude, longitude, cumulative distance, and spread, needed to visualize the animal tracks is sent to the web-application over network sockets.
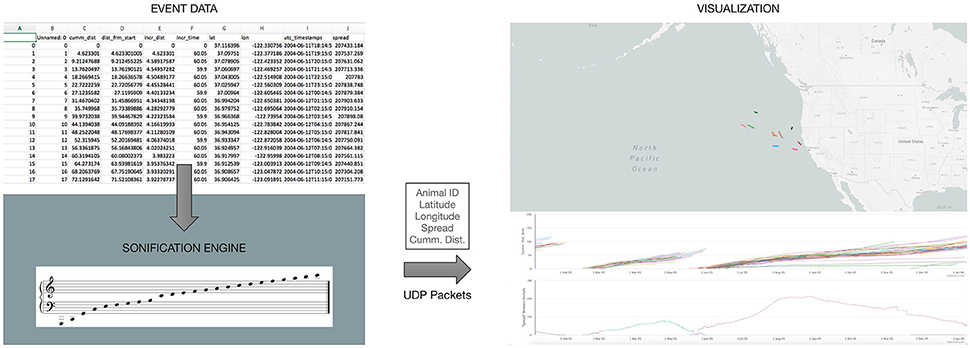
Figure 2. An overview of the web-based visualization interface being driven by our sonification engine, as data events are encountered.
Results
The 10 year data set of northern elephant seal movements included tracks extending from their California colonies across much NE Pacific Ocean (Figure 3), and was summarized in a 54 min audio file (Figure 4), thereby achieving a 1:90,000 compression of the duration of the data set. The sonification results are presented both as an audio file (Figure 4) and a video showing the movement of the animals along the North Pacific Ocean together with the corresponding sonification audio (Figure 5), along with figures showing the cumulative distance traveled and group spread (see below, Figure 6).
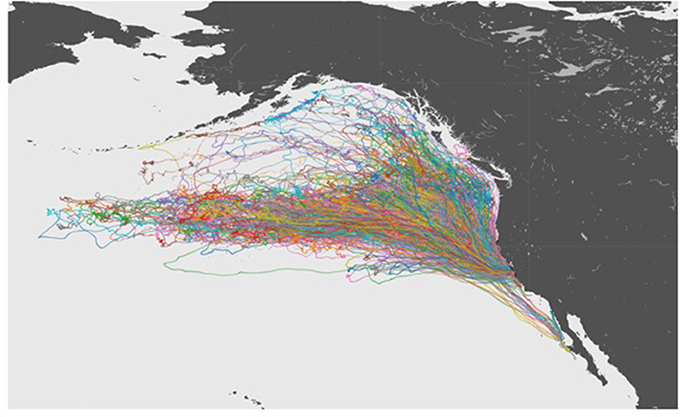
Figure 3. A visualization of tracks for all of the 321 Elephant Seals migrating across the Northeastern Pacific Ocean.
Figure 4. Clickable audio providing the “northern elephant symphony,” a sonification of data on movement across the Northeastern Pacific Ocean of northern elephant seals monitored from 2004 to 2014. Pitch represents the degrees longitude from the rookery (high pitch represents animals closer to the rookery, and low pitch animals moving into the Northeastern Pacific Ocean far away from the rookery), for each of the animals traveling as a group, while volume represents the spatial spread of the animals (i.e., loud music represents a compact group of animals traveling together). Available online at: https://figshare.com/articles/SealSonification_v0_1_wav/6062471.
Figure 5. Clickable video showing the trajectories of individual animals across the Northeastern Pacific Ocean, along with the corresponding sonification (audio) and the cumulative distance travel and spread of the animals (the data moving along time 0) in the figures below, which correspond to an animation of Figure 2 in this manuscript. The video and audio reproduce the sonification summarizing the 10 year record of northern elephant seal migrations across the Northeastern Pacific Ocean along with the corresponding tracks of the animals and displays showing the cumulative distance travel and group spread (bottom panel). Available online at: https://figshare.com/articles/SealSonification_v0_1_mov/6062510.
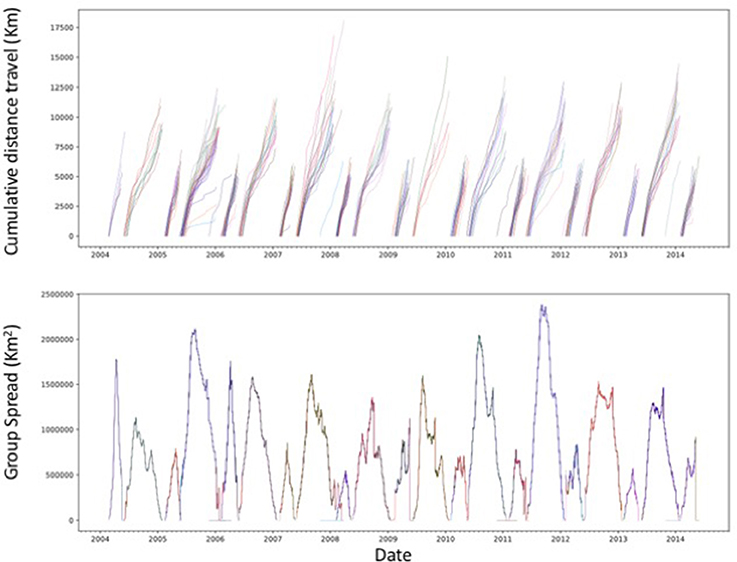
Figure 6. Cumulative distance traveled, from departure to return to the rookery, by the tagged northern elephant seals and the spatial spread of each seal group during the study period. Each line in the upper panel represents a different tagged individual.
The northern elephant seals covered considerable distances, in longitude, to the day-time divide in the middle of the North Pacific Ocean, and to the Bering Sea in the subarctic (Figures 3, 5). The animals departed from the colony in waves, each trip elapsing between 80 (post-breeding) and 300 (Post-molting) days involving waves of 4–27 tagged animals (mean 12.8 ± 1.4 animals, Figure 6), with each departing wave providing a sonification set. The two foraging trips consist of a short post-breeding migration (February–May) and a long post-molting migration (June–January, Robinson et al., 2012). A total of 21 trips were tracked, involving an alternation of two trips per year, a relatively short (cumulative distance traveled about 5,000–6,000 Km over about 80 days) post-breeding migration in early spring preceding molting and a long summer post-molting migration (cumulative distance traveled about 12,000–15,000 Km over about 200 days) when the females are pregnant and return to give birth (Figure 6), resulting in a bimodal frequency distribution of mean distance traveled by the animals involved in each voyages (Figure 7). The spread of the animals, providing the volume in the sonification (Audio 1, Figure 2), represents the area of the North Pacific Ocean being searched and exploited at any one time by the group of animals involved in each trip. The spread of the group of animals showed a similar pattern to that of cumulative distance traveled, with the animals involved in short voyages remaining within relatively compact groups, while those involved in longer, farther trips being far more spread across the North Pacific Ocean (Figure 2).
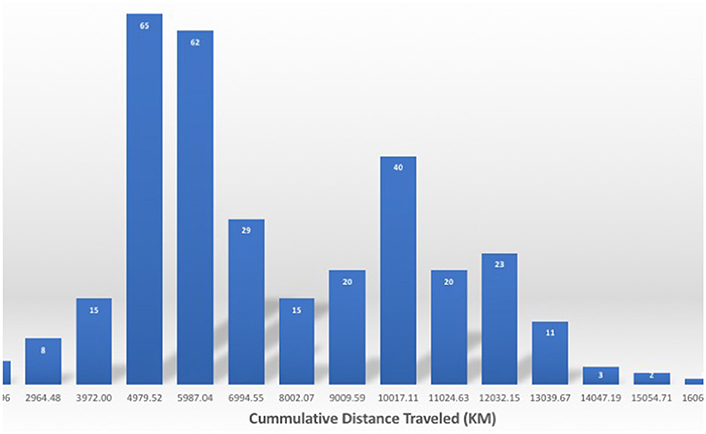
Figure 7. Frequency distribution of the cumulative distance traveled by the northern elephant seals along the Northeastern Pacific Ocean. Numbers on the columns in white indicate the number of individuals performing a migration of that length.
Listening to the resulting sonification (Figure 4) reveals features of motion that translate into specific patterns in space (Figure 5). The serial departure of elephant seals to initiate their trips is clearly reflected in the addition of tonalities, followed by a change (e.g., minute 0:28, Figures 4, 5), when the animals start to disperse, into the N. Pacific Ocean. The wave then proceeds to swim in a coherent manner, with the modulated fluctuations in volume suggesting coordinated fluctuations in dispersion of the wave. The animals in the first wave then start to return (minute 1:00 onwards, Figures 4, 5) to the colony, with volume increase signaling a new migratory wave of animals (minute 1:30, Figures 4, 5) that spread (minute 2:00 onwards, Figures 4, 5) out as reflected in low volume as they move west, as reflected in a lower tone of the notes. The increase in volume and pitch of the notes (after minute 3:30, Figures 4, 5) signals at the onset of the coalescence of the wave prior to initiating (rising volume at minute 4:30, Figures 4, 5) the return of the wave to the colony. A subsequent, larger wave (as indicated by the greater richness in notes) then depart on a second trip (minute 5:20, Figures 4, 5), with the wave remaining in tight proximity as they move away from the colony as denoted by the loud volume of the symphony, until they begin to spread out and move east into the North Pacific (to minute 5:40, Figures 4, 5), as reflected in the declining pitch and volumes. However, in contrast to the first three waves, the animals involved in the fourth trip have a broader array of trajectories, with one wave traveling farther east and the other wave remaining at mid distance from the colony, as reflected (minutes 7:30–8:00, Figures 4, 5) in two waves of high pitch note contrasting with the lower pitch of the rest of notes (i.e., animals). The diversity in pitch is then reduced as the volume increases (around minute 9:00, Figures 4, 5) pointing at the onset of a coordinated movement to return to the colony. The rhythmic increase and decrease of volume (minutes 10:40–12:00, Figures 4, 5), with a pattern, and a divergent, high-pitch note, reveal a wave that moves with a rhythmic pattern of spreading out and aggregating closer together and show the presence, again, of a few animals that depart from the dominant NE direction of the movement to move north along the coast (as high pitch notes). The composition reaches a minimum in pitch and volume (minute 13:00–14:00, Figures 4, 5), which signals the farthermost point of the migration into the Central N. Pacific Ocean, and increases subsequently (minutes 14:00–15:30, Figures 4, 5), signaling the return to the colony of this wave, which is accompanied by a coherent increase in volume and shift toward higher pitch showing the wave getting closer together as they approach the colony (15:20, Figures 4, 5).
The overall pitch of the composition clearly portrays the distance of the centroid of the wave from the colony (e.g., very low pitch at minute 18:10, Figures 4, 5), while the diversity of pitch in the notes is effective at signaling the departure of a few animals from the wave (e.g., note high pitch note at 16:20 and 18:30 indicative of an animal moving far away from the wave, Figures 4, 5), while volume effectively signals the spread of the wave. Smooth changes in volume, coordinated with pitch variability, indicate that the animals spread out as they move further away from the colony, with one or a few animals exploring an ocean area away from that explored by the core wave. The shift in volume and pitch also signals at group coordination in initiating the return home (e.g., 20:30, Figures 4, 5).
Discussion
The insights described above were derived while listening to the sonification (Figure 4), without the visual aid of the trajectory video (Figure 5). In addition to allow the detection of coherent patterns, the sonification is particularly effective at detecting anomalies, as notes of discordant pitch, indicative of one or a few animals migrating to an area far away from the rest. These can also be readily detected visually, but the sonification has the benefit of allowing processing in background mode while other tasks are performed.
The harmony in the sonification suggests a remarkable degree of coherence in the movement of the animals, both in terms of the zonal displacement along the North Pacific, reflected in gradual and coherent changes in pitch along the sonification, as well as the expansion and contraction of the spread between the animals involved in each trip, reflected in the gentle oscillations in volume, and suggesting that in the same way as the initiation of a migration trip is synchronized, the initiation of return is also synchronized, despite the individuals being spread over hundreds, and sometimes, thousands of kilometers across the N. Pacific Ocean (Figure 5). What the drivers of such patterns maybe (e.g., communication between the animals, environmental clues, or biological imperatives, such as reproductive cycles), cannot be resolved from the sonification, which simply provides a tool to explore the data. Studies of acoustic behavior of the elephant seals did not detect seal vocalizations during migratory swimming (Fletcher et al., 1996). However, the coordinated return requires that such vocalizations, shall these be the mechanism leading to coordination of the return, be emitted only at the time the return is initiated. No recordings are available from this critical time and, hence, the role of acoustic communication in the coordination of return cannot be ruled out. Indeed, investigation on the hearing thresholds of pinnipeds have revealed that the northern elephant seal's auditory system is best adapted for underwater functioning, at the expense of aerial hearing sensitivity (Kastak and Schusterman, 1998). Provided the trade-offs with aerial hearing it seems that underwater hearing should be of significant to the animals, which have been demonstrated to be able to detect acoustic signals at relatively low signal-to-noise ratios (Southall et al., 2000). Recently, northern elephants seals have been demonstrated to routinely memorize and recognize the unique tempo and timbre of other animal's voices and use this rhythmic information to individually identify them (Mathevon et al., 2017). This is the first demonstration of the capacity for individual mammalian identification involving sound rhythm, and provides evidence of the significance of sound and auditory skills of northern elephant seals.
Following inspection of the movement trajectories (Figure 3), we selected the longitude and spread as the most parsimonious set of variables to explore covariance in group movement. However, other sonification approaches could have been chosen to represent environmental clues, such as temperature, depth, latitude and solar radiation (e.g., sun rise and sunset at the position). However, temperature, depth, and solar radiation co-vary during the migration of these animals, capable of deep (> 400 m) dives during their migration (Le Boeuf et al., 2000). Moreover, as these environmental variables, except latitude, change within short time scales (hours), it would not have been possible to accelerate time as done here, and the resulting sonification will be too long to be effective as a data exploration tool.
An important advance of sonification over visualization approaches to complex data sets, such as the movement of northern elephant seals over the North Pacific Ocean provided here, is that the sonification allows the detection of pattern and anomalies in background mode while the visual attention of the user is focused on some other task (reading, writing, and driving). Indeed, humans are remarkable at being able to process auditory clues in background mode, i.e., while processing other sensorial clues, a capacity that media exploits to attract the attention of humans in environments with multiple clues (Lang and Chrzan, 2015; Smit et al., 2017). In contrast, visualizations of data require the full span of attention of the observer and is more difficult to reconcile with simultaneous tasks. Despite the high compression of data used here (1:90,000 in time) to summarize 10 years of animal tracking into a 55 min sonification, the required time, about 1 h, to visualize the entire data set remains demanding to maintain attention while visualizing animal movement (Figure 5). In contrast, sonification played in background mode, i.e., while the visual attention is allocated to a different task, allows inspection of the data and is particularly effective at detecting anomalies, such as those exemplified above.
There is increasing evidence that humans evolved an innate musical predisposition, including particular attention to the organization of pitches around a central tone and volume (Peretz and Hyde, 2003), and show an acute sensitivity to slight disruptions of perceived regularity in music (Drake, 1998), such as the implicit tonal knowledge allowing any given individual to detect when a musician strikes a wrong note (Peretz, 2001). Sonification applies these skills to derive patterns from complex data, such as northern elephant seals moving simultaneously across the NE Pacific Ocean. Sound has the capacity to represent basic properties of simple functions, such as distribution properties of data samples, and patterns of covariation between two variables can be effectively displayed by simple auditory graphs involving patterns of pitch variation over time (Flowers et al., 2005). The capacity to detect data covariation is particularly important as we strive at progressing from the serial processing of individual movement data to the search for pattern in animals moving in concert, as exemplified by the data set sonified here. Specifically, the features detected in the sonification allow to formulate a number of non-trivial questions on the group behavior of northern elephant seals scouting the NE Pacific Ocean:
1. Is the movement of northern elephant seals at sea not only synchronized but in some way coordinated?
2. Is the extent of spread, which determines the area of the NE Pacific searched and the resource space exploited, coordinated? or in some way regulated?
3. What is the mechanism that synchronizes the initiation of the return to the colony?
Most importantly, if the answers to any, or all, of the above questions is affirmative, the following subsidiary questions arise:
4. Are there common environmental cues that the seals are monitoring that allows the synchronization of migration? Is there any information exchange between individuals? As sound is the only sensory signal that can travel across ocean basins, are there passive or even active acoustic signal that the animals are using?
5. Can analysis of the covariance structure between animals be used to identify some pattern of which individuals lead or follow the wave? If so, what are the biological traits (age, gender, experience) that determine who leads or follows the wave?
Whereas, the sonification of northern elephant seals searching the NE Pacific Ocean inspired the questions above, formal testing requires numerical, statistical analysis. Yet, the sonification experiment reported here shows the heuristic value of this approach to explore complex and large data sets where patterns in the concerted movement of groups of animals are explored.
Author Contributions
CD, PR, MS, and DC conceived the research; PWR, JG-R, and DC generated the data; PR conducted the sonification; MS analyzed the data; CD, PR, MS, and DC wrote the manuscript. All authors contributed to improving the manuscript.
Conflict of Interest Statement
The authors declare that the research was conducted in the absence of any commercial or financial relationships that could be construed as a potential conflict of interest.
Acknowledgments
This research was conducted as part of the Tagging of Pacific Predators (TOPP) program and was supported in part by the National Ocean Partnership Program (N00014–02-1–1012); the Office of Naval Research (N00014–00-1-0880, N00014–03-1–0651, N00014–08-1–1195, the E&P Sound and Marine Life Joint Industry Project of the International Association of Oil and Gas Producers (JIP2207–23); the University of California Natural Reserve System the Moore, Packard, and Sloan Foundations; and the Sooy Graduate Fellowship and King Abdullah University of Science and Technology through the base-line fund to CD. This research also used resources of the Core Labs of King Abdullah University of Science and Technology (KAUST).
References
Block, B. A., Jonsen, I. D., Jorgensen, S. J., Winship, A. J., Shaffer, S. A., Bograd, S. J., et al. (2011). Tracking apex marine predator movements in a dynamic ocean. Nature 475, 86–90. doi: 10.1038/nature10082
Compare, H. (2017). The effectiveness during multitasking and with background noise of novel pulse oximeter sonifications designed for monitoring premature neonates. J. Pediatr. Child Health 53, 3–117. doi: 10.1111/jpc.13494_121
Costa, D. P. (1993). The secret life of marine mammals novel tools for studying their behavior and biology at sea. Oceanography 6, 120–128. doi: 10.5670/oceanog.1993.07
Costa, D. P., Breed, G. A., and Robinson, P. W. (2012). New insights into pelagic migrations: implications for ecology and conservation. Annu. Rev. Ecol. Evol. Syst. 43, 73–96. doi: 10.1146/annurev-ecolsys-102710-145045
Drake, C. (1998). Psychological processes involved in the temporal organization of complex auditory sequences: universal and acquired processes. Music Percept. 16, 11–26. doi: 10.2307/40285774
Dubus, G., and Bresin, R. (2013). A systematic review of mapping strategies for the sonification of physical quantities. PLoS ONE 8:e82491. doi: 10.1371/journal.pone.0082491
Fletcher, S., Le Boeuf, B. J., Costa, D. P., Tyack, P. L., and Blackwell, S. B. (1996). Onboard acoustic recording from diving northern elephant seals. J. Acoust. Soc. Am. 100, 2531–2539.
Flowers, J. H., Buhman, D. C., and Turnage, K. D. (2005). Data sonification from the desktop: should sound be part of standard data analysis software? ACM Trans. Appl. Percept. 2, 467–472. doi: 10.1145/1101530.1101544
Hays, G. C., Ferreira, L. C., Sequeira, A. M., Meekan, M. G., Duarte, C. M., Bailey, H., et al. (2016). Key questions in marine megafauna movement ecology. Trends Ecol. Evol. 31, 463–475. doi: 10.1016/j.tree.2016.02.015
Hussey, N. E., Kessel, S. T., Aarestrup, K., Cooke, S. J., Cowley, P. D., Fisk, A. T., et al. (2015). Aquatic animal telemetry: a panoramic window into the underwater world. Science 348:1255642. doi: 10.1126/science.1255642
Kastak, D., and Schusterman, R. J. (1998). Low-frequency amphibious hearing in pinnipeds: methods, measurements, noise, and ecology. J. Acoust. Soc. Am. 103, 2216–2228.
Lang, A., and Chrzan, J. (2015). Media multitasking: good, bad, or ugly? Ann. Int. Commun. Assoc. 39, 99–128. doi: 10.1080/23808985.2015.11679173
Le Boeuf, B. J., Crocker, D. E., Costa, D. P., Blackwell, S. B., Webb, P. M., and Houser, D. S. (2000). Foraging ecology of northern elephant seals. Ecol. Monogr. 70, 353–382. doi: 10.1890/0012-9615(2000)070[0353:FEONES]2.0.CO;2
Mathevon, N., Casey, C., Reichmuth, C., and Charrier, I. (2017). Northern elephant seals memorize the rhythm and timbre of their rivals' voices. Curr. Biol. 27, 2352–2356. doi: 10.1016/j.cub.2017.06.035
Maxwell, S. M., Hazen, E. L., Bograd, S. J., Halpern, B. S., Breed, G. A., Nickel, B., et al. (2013). Cumulative human impacts on marine predators. Nat. Commun. 4:2688. doi: 10.1038/ncomms3688
Meekan, M. G., Duarte, C. M., Fernández-Gracia, J., Thums, M., Sequeira, A. M. M., Harcourt, R., et al. (2017). The ecology of human mobility. Trends Ecol. Evol. 32, 198–210. doi: 10.1016/j.tree.2016.12
Nees, M. A., and Walker, B. N. (2014). “Performance of a sonification task in the presence of verbal, visuospatial, and auditory interference tasks,” in Proceedings of the Human Factors and Ergonomics Society Annual Meeting, Vol. 58 (Los Angeles, CA: SAGE Publications), 1194–1198.
Peretz, I. (2001). Brain specialization for music. Ann. N.Y. Acad. Sci. 930, 153–165. doi: 10.1111/j.1749-6632.2001.tb05731.x
Peretz, I., and Hyde, K. L. (2003). What is specific to music processing? Insights from congenital amusia. Trends Cogn. Sci. 7, 362–367. doi: 10.1016/S1364-6613(03)00150-5
Robinson, P. W., Costa, D. P., Crocker, D. E., Gallo-Reynoso, J. P., Champagne, C. D., Fowler, M. A., et al. (2012). Foraging behavior and success of a mesopelagic predator in the northeast pacific ocean: insights from a data-rich species, the northern elephant seal. PLoS ONE 7:e36728. doi: 10.1371/journal.pone.0036728
Rodríguez, J. P., Fernández-Gracia, J., Thums, M., Hindell, M. A., Sequeira, A. M. M., Meekan, M. G., et al. (2017). Big data analyses reveal patterns and drivers of the movements of southern elephant seals. Sci. Rep. 7:112. doi: 10.1038/s41598-017-00165-0
Smit, E. G., Segijn, C. M., van de Giessen, W., Wottrich, V. M., Vandeberg, L., and Voorveld, H. A. M. (2017). “Media multitasking and the role of task relevance in background advertising processing,” in Advances in Advertising Research VIII, eds V. Zabkar and M. Eisend (Springer Fachmedien Wiesbaden), 197–212.
Southall, B. L., Schusterman, R. J., and Kastak, D. (2000). Masking in three pinnipeds: underwater, low-frequency critical ratios. J. Acoust. Soc. Am. 108, 1322–1326. doi: 10.1121/1.1288409
Keywords: Northern elephant seal, movement, NE Pacific, migration, sonification, big data
Citation: Duarte CM, Riker P, Srinivasan M, Robinson PW, Gallo-Reynoso JP and Costa DP (2018) Sonification of Animal Tracks as an Alternative Representation of Multi-Dimensional Data: A Northern Elephant Seal Example. Front. Mar. Sci. 5:128. doi: 10.3389/fmars.2018.00128
Received: 12 December 2017; Accepted: 26 March 2018;
Published: 20 April 2018.
Edited by:
Rob Harcourt, Macquarie University, AustraliaReviewed by:
Nuno Queiroz, CIBIO/InBIO, University of Porto, PortugalDaniel M. Palacios, Oregon State University, United States
Copyright © 2018 Duarte, Riker, Srinivasan, Robinson, Gallo-Reynoso and Costa. This is an open-access article distributed under the terms of the Creative Commons Attribution License (CC BY). The use, distribution or reproduction in other forums is permitted, provided the original author(s) and the copyright owner are credited and that the original publication in this journal is cited, in accordance with accepted academic practice. No use, distribution or reproduction is permitted which does not comply with these terms.
*Correspondence: Carlos M. Duarte, carlos.duarte@kaust.edu.sa
†Present Address: Paul Riker, Boomcloud 360, Encinitas, CA, United States