Rating the Effectiveness of Fishery Closures With Visible Infrared Imaging Radiometer Suite Boat Detection Data
 Christopher D. Elvidge1*
  Tilottama Ghosh2
  Kimberly Baugh2
  Mikhail Zhizhin2,3 Feng-Chi Hsu2 Nilo Selim Katada4 Wilmon Penalosa5
  Bui Quang Hung6
- 1Earth Observation Group, National Centers for Environmental Information, National Oceanic and Atmospheric Administration, Boulder, CO, United States
- 2Cooperative Institute for Research in the Environmental Sciences, University of Colorado, Boulder, CO, United States
- 3Geophysics Department, Russian Space Research Institute, Moscow, Russia
- 4Enforcement Division, Philippines Bureau of Fisheries and Aquatic Resources, Quezon City, Philippines
- 5Negros Occidental Provincial Environmental Management Office, Bacolod, Philippines
- 6Center of Multidisciplinary Integrated Technologies for Field Monitoring, Vietnam National University of Engineering and Technology, Hanoi, Vietnam
Fishery closures are widely used to promote the sustainability of fish stocks. Fishery agencies typically have very little data relevant to planning closure enforcement actions and evaluating the effectiveness of closures, due in part to the vast expanse and remote nature of many closures. In some cases the effectiveness of closures can be evaluated using data from GPS based beacons, such as Automatic Identification System (AIS) or Vessel Monitoring Systems (VMS) installed on fishing boats. In fisheries where few boats are equipped with AIS or VMS, the rating of closures relies on other data sources capable of detecting or inferring fishing activity. One such source comes from low light imaging data collected by the NASA/NOAA Visible Infrared Imaging Radiometer Suite (VIIRS), which can detect fishing boats using lights to attract catch. This is a widely used practice in Asia and several other regions. NOAA has developed an automatic system for reporting the locations of VIIRS boat detections with a nominal 4 h temporal latency. VIIRS boat detection alerts are running for more than 900 fishery closures in the Philippines, with email and SMS transmission modes. These alerts are being actively used in the Philippines to plan enforcement actions and there is a growing list of apprehensions that occurred based on tip-offs from VIIRS. The VIIRS boat detection archive extends back to April 2012. A VIIRS closure index (VCI) has been developed to rate the effectiveness of closures on monthly increments in terms of a percentage. The VCI analysis was performed on three types of closures: an ad hoc fishery closure associated with a toxic industrial discharge, a seasonal fishery closure and a permanent closure in restricted coastal waters. The VCI results indicate that it is possible to rank the effectiveness of different closure, year-to-year differences in compliance levels, and to identify closure encroachments which may warrant additional enforcement effort.
Introduction
Fishery closures are bans on fishing activity for defined spatial regions. The purpose is to curtail fishing effort to accomplish specific management objectives, such as to reduce interference with fish breeding or to protect stocks of juvenile fish (Gell and Roberts, 2003; Ani, 2016). Fishery closures may be seasonal, permanent, or ad hoc (Hall, 2002; Dinmore et al., 2003; Clarke et al., 2015). They may apply to a specific catch species or to an identified class of fishing gear. Many nations use fishery closures as part of their management of fishery resources. Assessing compliance with fishery closures is challenging due to factors such as limits on fishery agency patrol capabilities, inability to know the origin of landed catch, and the vast and remote expanse of many closures (Bergseth et al., 2015). Without data on compliance, managers have very little basis for planning enforcement actions, rating the success of compliance efforts, and the design of new interventions (Arias et al., 2015). Over the years, a number of data sources have been used to assess compliance or effectiveness of fishery closures, including: questionnaires and interviews (Bergseth et al., 2015), onboard observer data (Palka et al., 2008), biological surveys (Lewison et al., 2003; Tewfik and Béné, 2004; McClanahan et al., 2009; Diogo et al., 2016), surveys of derelict fishing nets and lines (Williamson et al., 2014), law enforcement records (Mann, 1995), vessel tracks from GPS beacons (Detsis et al., 2012; Öztürk, 2015; Petrossian, 2015), shore based camera images (Lancaster et al., 2017), aerial observations of fishing boats (Haggarty et al., 2016).
Vessel tracks from GPS beacons refers to onboard Automatic Identification System (AIS) and Vessel Monitoring Systems (VMS) data. AIS and VMS data come in the form of tracks—strings of date/time stamps with associated latitude/longitude positions. These data can be used to identify closure violations in near-real time based on the presence of vessels inside the closure exhibiting the motion pattern associated with fishing activity, as opposed to in-transit motion across a closure. The movement pattern of the vessels can be used to discriminate in-transit segments from fishing activity (Lee et al., 2010). In-transit activity is generally linear portion of the track, with substantial length and at a higher velocity. Fishing activity is indicated by slower movements, shorter length segments, and track curvature.
Rating closure compliance could be easy if all fishing vessels carried AIS or VMS and operated them continuously. However, there are two major shortcomings of VMS and AIS data relevant to the tracking of closure compliance. First, requirements for AIS and VMS generally covers only the larger boats, with smaller boats able to operate “under the radar.” In Indonesia VMS is required on boats over 30 gross tons, which represent ~10% of the domestic fishing fleet. In the USA, VMS is required on fishing boats longer than 19 m and in certain federal waters all fishing boats are required to carry VMS. In other countries, such as the Philippines, there is currently no VMS requirement. The World Maritime Organization (WMO) requires that all boats 300 gross tons and larger carry AIS. Thus, there are vast numbers of fishing boats that lack track reporting. The second shortcoming is that vessel operators are able to evade detection in closures by disabling their AIS or VMS devices, report a false identification, or report a series of false locations (Kowalska and Peel, 2012; Katsilieris et al., 2013; Balduzzi et al., 2014). Because there are large numbers of fishing boats that carry no automatic location broadcasting and the possibility for AIS/VMS tampering, it is clear that these sources should be complimented by other data sources for rating the effectiveness of closures.
Satellites would seem an attractive data source for detecting boats fishing illegally inside active closures. It has been known for many decades that certain satellite remote sensing systems can detect vessels and could be used to track compliance with fishery closures. High spatial resolution optical sensors are able to detect and characterize vessels und low cloud daytime conditions (Daniel et al., 2013; Bannister and Neyland, 2015) Satellite synthetic aperture radar (SAR) systems are also able to detect offshore vessels (Lemoine et al., 2004; Kourti et al., 2005; Brusch et al., 2011; Stastny et al., 2011) and have the advantage of all-weather operations. The downside for these sources are that it may take several days to access the data, there are generally fees associated with the data access and global coverage is not currently available on a daily basis.
Data from meteorological satellite sensors have the favorable characteristics of providing global coverage, data are generally open access and are available in near real time. In addition, there are long term archives for meteorological satellite data, which can used to develop extended temporal records. The major disadvantage of meteorological satellite data is the spatial resolution, typically in the range of 1 × 1 km. This is far too coarse for the detection of vessels using normal spectral bands. The exception to this is the detection of sub-pixel electric lighting deployed on boats at night. The low light imaging on these sensors is designed for the detection of moonlit clouds in the visible, but also enables the detection of electric lights present at the Earth's surface. One of the lighting sources detected are fishing boats deploying lights to attract catch. This capability was first described in the 1970's for data collected by the U.S. Air Force Defense Meteorological Satellite Program (DMSP) Operational Linescan System (OLS) (Croft, 1978). More recently, boat detection has been demonstrated using low light imaging data collected by the NASA/NOAA Visible Infrared Imaging Radiometer Suite (VIIRS) (Elvidge et al., 2015; Straka et al., 2015). The first VIIRS was launched in 2011 and the second in 2017.
Multiple studies report the use of DMSP and VIIRS fishing boats detections to define fishing grounds and to estimate fish stocks based on catch per unit effort analyses (Cho et al., 1999; Rodhouse et al., 2001; Waluda et al., 2002; Kiyofuji and Saitoh, 2004; Maxwell et al., 2004; Choi et al., 2008; Zhang et al., 2013; Liu et al., 2015; Cheng et al., 2016; Cozzolino and Lasta, 2016; Lebona et al., 2016; Guo et al., 2017; Paulino et al., 2017; Syarifudin et al., 2017). To date, there have been no published reports on the use of DMSP or VIIRS boat detection (VBD) data being used to assess compliance fishery closures. Yet, these data sources have some favorable characteristics: global coverage every 24 h, no tasking is required to ensure collection, and open source (free) data. In 2014, NOAA's Earth Observation Group (EOG) began the development of algorithms for the reporting of boat detections from nighttime VIIRS data (Elvidge et al., 2015). The VBD product is now a global product with 4 h temporal latency and the nightly archive extends back to 2012. This opens up the possibility to use near-real time VBD to detect closure violations and to rate the effectiveness of closures using the long term archive of observations.
As with every data source, VBD data have several limitations and characteristics that the users should take into consideration. Some of these are so severe that if not addressed, could lead to misleading results from closure compliance assessments. First, not all fishing boats deploy lights to attract catch. A survey of fishing boats at landing sites in Indonesia found strings of high powered lights on purse seiners, squid boats, and lift net boats. Boats such as trawlers and gill net boats have minimal lighting installed. So VBD only detect a specialized subset of fishing boats. Second, moonlight significantly reduces the number of detections, resulting in cycling in the number of nightly boat detections. Third, thick clouds will block the detection, which results in denied ocean surfaces in the nightly data. Cloud obscuration also contributes to seasonal cycles, with fewer boat detections possible in the stormy months. Another important consideration is that the VIIRS DNB pixel footprint is square and is maintained at 742 × 742 m on a side. Because the footprint is vastly larger than any fishing boat, there are undoubtedly cases where there are more than one boat bearing lights present in single pixels.
In this paper we provide more details on the VBD data characteristics and explore methods for the identification of closure encroachment and the rating of fishery closure compliance levels. An alert system has been developed for near-real time reporting of closure violations, sent by email and to cell phones using SMS (short message service). For rating the long term effectiveness of closure with VBD, we develop a VIIRS closure index (VCI) based on the concept that changes in VBD numbers during closure periods is an expression of the compliance level. VMS and VBD records from Indonesia are used to investigate the type of boats that are routinely detected by VIIRS and answer the question regarding the VIIRS detection numbers for boats lacking VMS records. As part of the study, we develop methods to mitigate for lunar cycle and seasonal effects on VBD numbers. The VCI methods are applied to rate compliance levels for three closures in the Philippines and Vietnam.
Methods
Study Sites
In this paper we analyze VIIRS boat detections for three types of fishery closures. The first is an ad hoc closure induced by a toxic industrial discharge. The second is a seasonal fishery closure, running for 3 months once per year. The third is for restricted coastal waters where commercial fishing is banned. Table 1 provides a summary of the years and months where the closures were active.
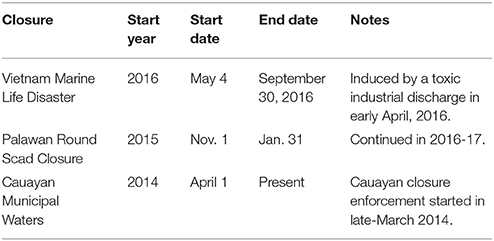
Table 1. Closure names and date range.
The 2016 Vietnam Marine Life Disaster
Also known as the 2016 fish kill, this was a poisoning event traced to the release of toxic waste discharge from the Formosa steel plant located in the Vung Ang Economic Zone. The exact date of the discharge has not been disclosed, but large quantities of dead fish began washing ashore as early as April 6, 2016. The four affected provinces include Ha Tinh, Quang Binh, Quang Tri, and Thua Thien Hue (Figure 1). By early May, 100 tons of dead fish had been removed. In response to concerns over the possible health impacts from the consumption of contaminated sea life, the government announced a ban of processing and selling seafood caught within 20 nautical miles from shore closure on May 4, 2016 (Wikipedia, 2016). The ban on fishing in the upper part of the water column was lifted at the end of September (PhysOrg, 2017).
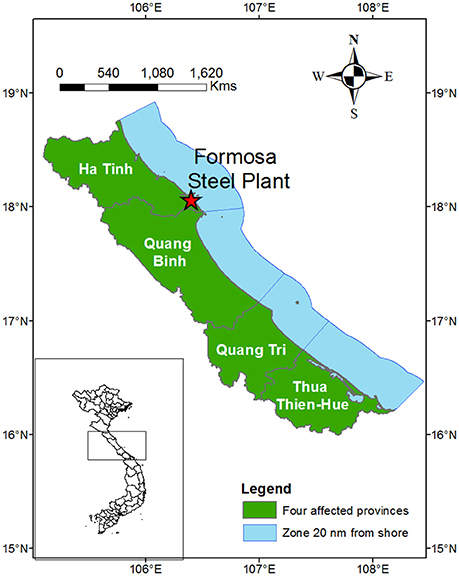
Figure 1. Closure areas associated with the 2016 fish kill event in Vietnam.
Palawan Round Scad Closure
This is a seasonal closure established to protect round scad population number. Round scad, or “galunggong,” is widely regarded as the poorman's fish in the Philippines due to its low cost. The waters off the northern end of Palawan account for more than 90% of the round scad catch in the Philippines. The closure period covers the 3 months when breeding activity is at its peak, from November 1 through January 31. Three gear types are banned from use during the closure: purse seine, ring net, and bag net. Boats using these gear types in the Philippines typically use lights to aggregate catch. The closure was first issued in 2015 (Joint DA-DILG Administrative Order, No. 1, 2015) and was continued each of the subsequent years. In 2015 the closure was voluntary until signed in mid-December. The 3 month closure was repeated for the 2016 and 2017 seasons (Figure 2).
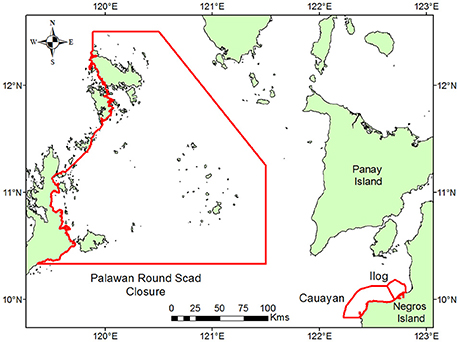
Figure 2. Reference map of the Palawan Round Scad and Cauayan and Ilog municipal water closures in the Philippines.
Cauayan Municipal Waters
The Philippines bans commercial fishing in coastal waters, extending 15 km out from shore. These are known as “municipal waters” and are managed by Local Government Units (LGUs). The purpose of the ban is to promote sustainable fish stocks and to provide catch for small scale indigenous fishermen. These closures have been in effect nationwide since 1998 (Tenth Congress of the Philippines, 1998). Despite this ban, commercial fishing is quite common in many LGU waters. Cauayan LGU, in Negros Occidental province, was known to have a chronic problem with commercial fishing. At the end of March, 2014 the Provincial Environment Management Office (PEMO) and other organizations began a campaign to enforce the ban on commercial fishing boats active in the Cauayan municipal waters. VBD data were also processed for the adjacent Ilog LGU, which had no special effort to enforce the ban on commercial fishing (Figure 2).
VIIRS Boat Detection Processing
The EOG produces a global VBD product in near real time, providing access via https://ngdc.noaa.gov/eog/viirs/download_boat.html. The basic VBD algorithms are described by Elvidge et al. (2015). Nightly VBD records are produced in both csv and kmz formats. The algorithms continue to evolve, with a focus on reducing errors of omission and commission. EOG accesses global VIIRS data from the GRAVITE data pool established by the NOAA Joint Polar Satellite System (JPSS) program office. Data arrive in GRAVITE from the JPSS ground station in Svalbard, Norway. It takes about 2 h for the VIIRS data to show up in the data pool. Much of the delay is associated with the orbital data being stored on-board and downloaded to Svalbard once every ~100 min. The entire archive of usable nighttime VIIRS data, back to April 2012, is periodically reprocessed with the boat detection algorithms to maintain a consistent historical record.
EOG developed a series of specialized software modules for producing near-real time detection alerts for closures and analyzing the effectiveness of closures using the historical record. The alerts provide a map graphic showing the VBD locations within closure boundaries and a text list of the precise locations, detection times, and radiances. Alerts can be sent out to specific recipients in either email or SMS transmissions. A second module generates monthly summary grids of boat detection numbers (VBD) and average radiances. A third module extracts VBD tallies based on spatial boundary vectors to track nightly boat detection records. A fourth module helps in improving the understanding of the product capabilities and limitations. A lunar model is used to calculate lunar illuminance. A tool was developed to match VMS tracks with VBD data.
Analysis of Vessel Types Detected by VIIRS
To determine which types of fishing boats are detected by VIIRS in Asia, VMS/VBD matching was performed using 3,550 Indonesia fishing boats with known gear types for a period spanning the start of 2014 through September 2016 (Table 2). There is generally one VMS readout per hour. The VMS readouts were separated into three activity types based on: landing, in-transit, and fishing. The sorting is based on the vessel proximity to landing sites, heading and velocity (Lee et al., 2010). The key to the matching VMS with VBD is predicting the location of each VMS boat at the time of the nighttime VIIRS observation. If a VBD is found within 1 km of the predicted location—it is marked as a match. The match rates are calculated for each boat for both the in-transit and fishing activity types.
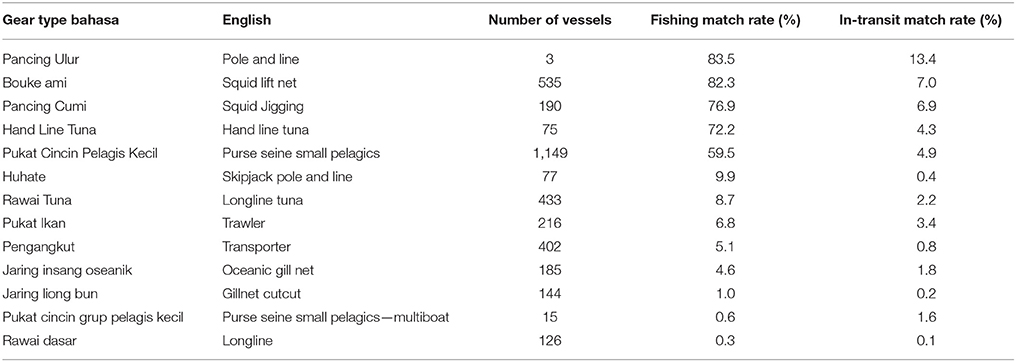
Table 2. VMS/VBD match rates.
Development of a VIIRS Closure Index
We developed two complementary styles of VBD closure indices (VCI): tabular and gridded. Both are calculated from VBD tallies extracted from time series of 15 arc second monthly summary grids. The tabular VCI is calculated using VBD tallies temporally aggregated and covering an entire closure area. The gridded VCI is calculated using temporally aggregated VBD tallies with minimal spatial aggregation (e.g., 30 arc second).
The basic concept of the VCI is to compare boat detection numbers from a closure period with the average boat detection numbers from the non-closure period. Our first attempt at developing a VIIRS based closure index was to simply ratio the number of detections during the closure period (numerator) by the average number of detections in the same months outside the closure period and subtract the ratio from 1.0 and multiply by 100 (Equation 1). Month matching was followed to mitigate for seasonal effects on VBD numbers. The simple ratio index produced reasonable results for cases where there was a decrease in VBD numbers during the closure period. An index value of 90% indicated there was a 90% reduction in VBD during the closure relative to the non-closure portion of the temporal record. Values under 1% indicates more VBD during the closure. But the simple ratio index cannot be calculated in cases where there are zero VBDs in the non-closure period and can reach an infinitely small value in cases where the boat detections increased during the closure period.
To address the shortcomings of the simple ratio VCI, we developed a normalized version of the VCI. To ensure that the VCI has the range −100 to 100, the denominator value is the maximum of the boat detection numbers from either the closure period or the reference period. In cases where the number of detections during the closure period is less than the reference number, the VCI value will be positive, otherwise the VCI value will be negative. With this formulation, a VCI of 50% indicates that the boat detection numbers were reduced by half from the reference period. Conversely a VCI of −50% indicates that the closure month tallied 50% more boat detections than during the reference period. A VCI of −100 indicates 15 arc second grid cells where boats were detected in the closure period but not in the reference period. Conversely, a VCI of 100 occurs in cases where zero boats were detected in the closure period and one or more boats were detected in the reference period.
Where VBDcl denotes the sum of boat detections for the closure period and VBDref is the average sum of boat detections from the pre-closure period.
This formulation was applied to the closure temporal records. The same calculation was performed for the pre-closure period, simply using the temporally aggregated VBD tally in the numerator and keeping the denominator the same as the closure set.
The gridded closure index applies the same analysis on a spatial grid. As with the tabular VCI, the detection numbers during the closure period are compared with the same grid cell from the reference period. The grid approach makes it possible to define spatial variations in compliance levels. The intention is to identify zones with low levels of compliance that may warrant increased efforts to promote compliance.
Statistical Testing
In fishing grounds with substantial numbers of VBD, compliance with the closure will result in higher VCI values. That is to say, decreases in VBDs will increase VCI values during the closure period, relative to the same index calculated from the pre-closure period. To test whether there is a detectable level of compliance, we performed t-tests using a null and alternative hypotheses. The null hypothesis is that there is no difference in the mean VCI values from the closure and pre-closure periods. The alternative hypothesis is that the mean VCI is higher during the closure period. The testing is performed with methods outlined by Freund and Wilson (2003). When the null hypothesis is rejected, the mean VCI during the closure is found to be higher than the pre-closure period.
Results
What Types of Boats Are Detected by VIIRS
VBD is limited to brightly lit boats with sufficient light escaping to the sky to result in a spike in the DNB signal. Based on this, it would not be expected that VIIRS would routinely detect every type of fishing boat, only those that are deploying lights to attract catch. To investigate which gear types are commonly detected by VIIRS, we analyzed VMS and VBD match rates in Indonesia for a 33 month period (January 1, 2014 through September 30, 2016) (Table 2). The match rates were calculated separately for the fishing and in-transit activity types. Gear types with the highest VBD match rates, >59% while fishing include: pole and line, squid lift net, squid jigging, hand line tuna, and purse seine small pelagics. Skipjack pole and line, longline tuna, and trawlers had match rates in the 6–10% range. Gear types with match rates under 5% include: gillnet and longline boats.
Out of 3,550 VMS vessels−1548 (46.6%) are detected by VIIRS 10% or more the time while exhibiting fishing behavior. Small pelagic purse seiners (pukat cincin pelagis kecil) account for 57% of the matches. The fishing vs. in-transit match rates indicate that if a boat is detected by VIIRS, there is a 90% probability that it is fishing. Another important finding is that during the 33 month study period, VIIRS had 1,448,986 boat detections in the Indonesia EEZ. Of these VBDs, 15.6% had VMS matches. Thus, in Indonesia, 84% of the VIIRS detections come from boats lacking VMS.
Temporal Aggregation
There are three variables which affect VBD numbers that make a strong case for temporal aggregation: lunar cycles, seasonal cycles, and cloud obscuration. To define the lunar effects, an extraction of detection tallies was run on the VBD csv records for the Indonesia EEZ. The lunar illuminance (LI) was calculated for each day as the average from the boat detections (Figure 3). The nightly VBD tallies are inversely related to LI, rising during the dark part of the lunar cycle, reaching numbers in the thousands. During the full moon, nightly detection numbers drop into the low hundred, an ~95% drop. The drop can be attributed to the rise in the DNB boat detection threshold under high moon conditions combined with the fact that fishing with lights is not as effective under full moon conditions.
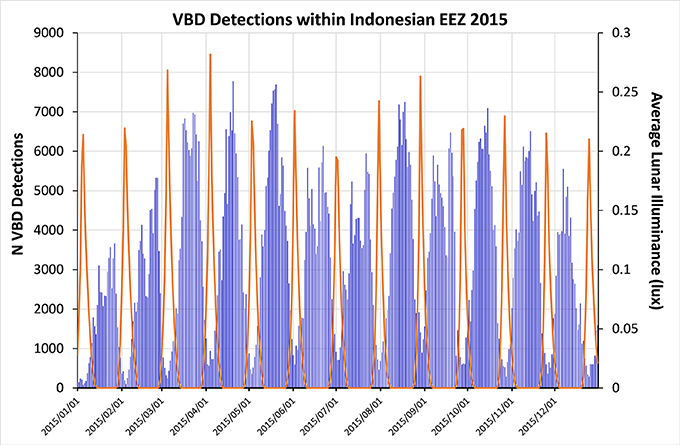
Figure 3. Daily VIIRS boat detection tallies for the Indonesia EEZ spanning 2015. The average lunar illuminance is shown as the orange line.
To rate the compliance rate of a fishery closure we propose to compare the number of VBD during the closure period with the tally from the non-closure period. Is it appropriate to compare data from a single night with the same night from years not covered by closure? For example, consider a closure that stated on November 1, 2016. Are there pitfalls in comparing boat detection numbers from November 1, 2016 with those from the previous four November 1s available in the VIIRS record? There are two reasons why this could lead to spurious results. First, there are lunar cycle effects on the VBD numbers. The lunar cycle is 27.3 days, which does not align with the individual dates in months. As a result, there is variability in lunar illuminance (LI) for the calendar dates across an extended set of years. The second reason for not comparing single nights of data across multiple years is that the quantity and location of cloud cover will surely differ across such a temporal sample.
The purpose of temporal aggregation is to mitigate for lunar, seasonal and cloud effects. The best temporal aggregation scheme would address all three of these issues. Lunar cycle effects propagate into weekly temporal aggregates (Figure 4), making the case for longer temporal aggregation. Given that VBD numbers follow the lunar cycle, what about aggregating the boat detections for individual lunar cycles, which last 27.3 days? This effectively removes lunar cycle effects (Figure 4). Lunar cycle aggregation also mitigate for cloud affects since the clouds move from night to night and often there are annual cycles in cloud cover. Over a lunar cycle the “cloud-free” observations accumulate across the closure area. The difficulty with lunar cycle aggregation is that the temporal increments do not align with months. If one compares date ranges for the third lunar cycle of the year across a series of years, there are year-to-year variations. Over an extended number of years the date ranges in the lunar cycles drift, eventually leading to ambiguities in the selection of the appropriate lunar cycle to include in the VCI analysis for a closure. Seasonal effects also be introduced to the VCI if the date ranges are sliding from year-to-year.
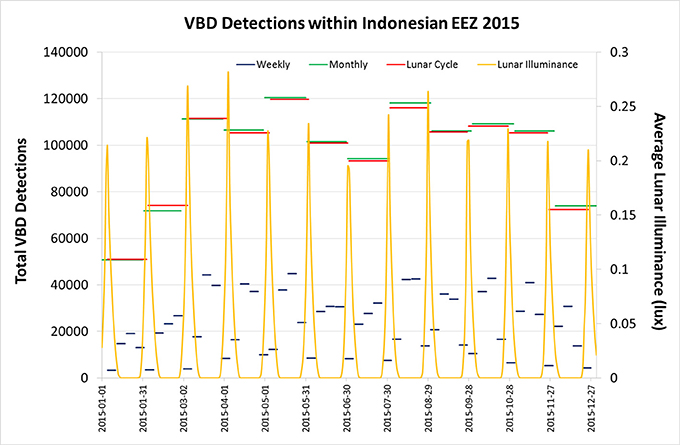
Figure 4. Results from three styles of temporal aggregation of the nightly VBD data shown in Figure 3: weekly, monthly, and lunar cycle. The weekly aggregation is calculated from Monday through Sunday. The lunar cycle aggregation is calculated from full moon to full moon.
Monthly temporal aggregation addresses each of the three criteria: lunar cycle effect, seasonal variation, and cloud cover. The monthly VBD tallies are nearly the same as the lunar cycle set (Figure 4). Monthly aggregation mitigates for lunar cycle effects and gives the entire closure area opportunities for accumulating cloud-free observations. Monthly temporal aggregation simplifies the selection of pre-closure reference data and matches the specification for most seasonal closures, which typically run for sets of full months. With monthly aggregation there are no ambiguities in the selection of data for the VCI calculation. Based on these considerations, the VCI has been calculated on monthly increments. It should be noted that monthly temporal aggregation is widely used in economic analyses to mitigate seasonal effects on economic and fisheries data (Burkhauser et al., 2000; Neidell, 2004; Garza Gil et al., 2005).
VCI Results
The results consist of spreadsheets with charts and gridded images. The charts show monthly VBD boat detection tallies from April, 2012 to January, 2018 as vertical bars and the VCI values plotted as points. The VBD tally scale is on the left, the VCI scale is on the right. For the statistical testing, VCI values are also calculated for the pre-closure periods and are also shown on the charts. The VCI means for the closure and pre-closure periods are marked with horizontal lines. The gridded VCI images have been density sliced to show areas of high compliance (VCI 90–100) as green and negative VCI as red. Grid cells where the VCI ranges from 0 to 90 are shown in grayscale.
Vietnam Fish Kill
Figure 5 shows the analysis for Vietnam. Overlain are the VCI for the individual provinces from the five closure months. The pre-closure period extends for 4 years: 2012–2015. There is a pronounced seasonal cycle in the VBD tallies, with larger numbers of detections during the dry season, running from April through August most years. There are smaller numbers of detections during the wet months, generally from October through January. This reduction is likely due to two factors, heavier cloud cover and inclement seas. The VCI is formulated to minimize the seasonality effects by running the calculation using the average from same months from pre-closure record as the denominator. The two highest closure VCIs came from the first month of the closure for Thua Thien-Hue (70%) and Quang Binh (44%) provinces. The VCI ran negative in 2 months each for Ha Tinh and Quang Tri provinces. Despite the four negative VCI samples, the VCI mean during the closure months is 18%. The mean VCI from the pre-closure period is 3.6%. Statistical testing indicates that the mean VCI during the closure period is larger than the pre-closure value (Table 3). This indicates that compliance was detected by the VCI, but that the compliance rates were modest, under 40% in nearly every case.
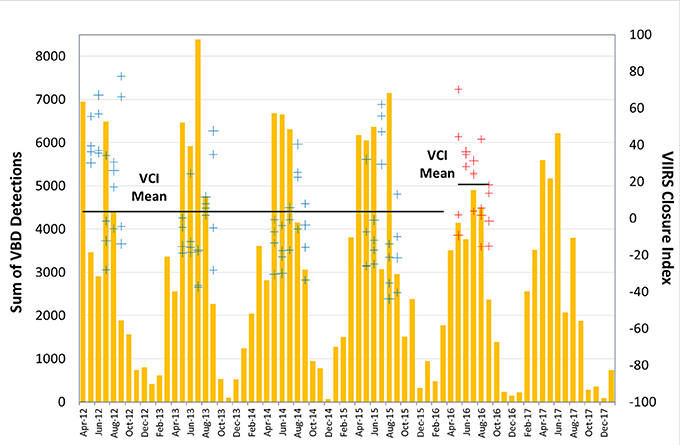
Figure 5. The vertical bars indicate the monthly VIIRS boat detection tallies for the Vietnam closure area from April 2012 through January 2018. The points indicate the VCI values during the closure months and the same set of months in the pre-closure period. The VCI means for the closure and pre-closure periods are marked with black horizontal lines. The closure VCI are red and pre-closure blue.
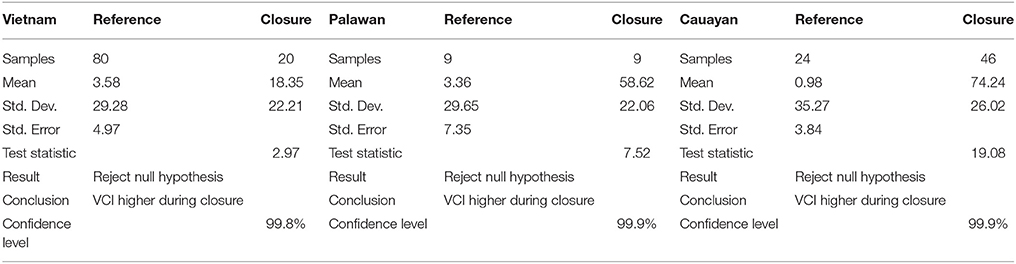
Table 3. Statistical test results.
Palawan Round Scad Closure
As with the Vietnam example, the Palawan tabular VCI shows a distinct annual cycle, with high boat detection counts centered on the dry season: February through April (Figure 6). Lowest boat detection counts typically occur at the end of the wet season, from October through January. The closure runs November—January starting in 2015 and repeated in 2016 and 2017. The VCI was relatively stable in the 2015 season, in the range of 39–49%. The most variable of the three seasons is 2016, which also had the lowest closure VCI−27% in November. The highest closure VCI (94%) is in December 2017. There is an upward trend in compliance rates from 2015 to 2017. The lowest VCI was 41% in November 2016 and highest was the following month, December, with 79%, The VCI mean during the closure months is 58 and 3.36% during the pre-closure period. Statistical testing concludes that the VCI values during the closure period are larger than the values from the pre-closure period (Table 3). This indicates that compliance was detected by the VCI.
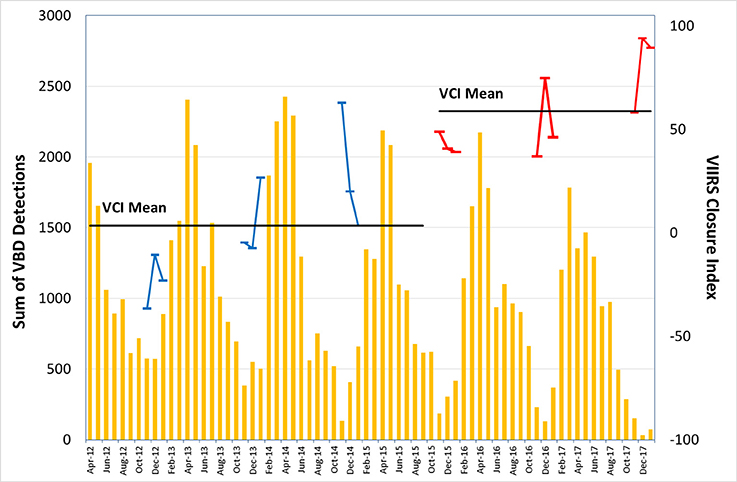
Figure 6. The vertical bars indicate the monthly VIIRS boat detection tallies for the Palawan closure area from April 2012 through January 2018. The points with connecting lines indicate the VCI values, with the axis labels on the right. The closure VCI are red and pre-closure blue.
The gridded VCI for the Palawan round scad closure is presented in Figure 7. A 12 × 12 grid cell spatial aggregation was applied prior to the VCI calculation. A density slice is added to indicate zones with high compliance (90–100%) as green and negative VCI as red. The results indicate widespread compliance in the central and southern sections. In the north there is a distinct and persistent negative VCI zone north of Busuanga Island in the 2015 and 2016 seasons. This triggered Bureau of Fisheries and Aquatic Resources (BFAR) to step up enforcement efforts in the affected zone during the 2017 season. The VCI increased in this zone during the 2017 season, an indication that the increased enforcement increased closure compliance.
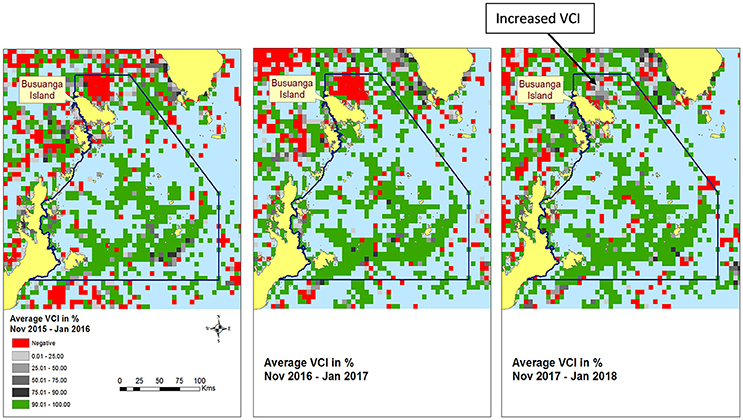
Figure 7. Annual gridded VCI data for the Palawan round scad closure for the 2015, 2016, and 2017 seasons. A density slice is added to indicate zones with high compliance as green and negative VCI as red.
Cauayan Municipal Waters
Figure 8 shows a bar chart showing the monthly sum of VBD from the Cauayan closure. Overlain are the VCI values for the individual months and the horizontal lines mark the VCI means for the closure and pre-closure periods. The pre-closure period extends for 24 months and the enforcement period analyzed spans 46 months. The mean VCI from the closure period is 74 and 1% for the pre-closure period. Statistical testing indicates that the mean VCI during the closure period is larger than the pre-closure value (Table 3). This indicates that compliance was detected by the VCI and in most months the compliance rate was over 75%. Compliance dropped for two-to-three month each year: June-August, 2014; July-September, 2015, and July-August, 2016.
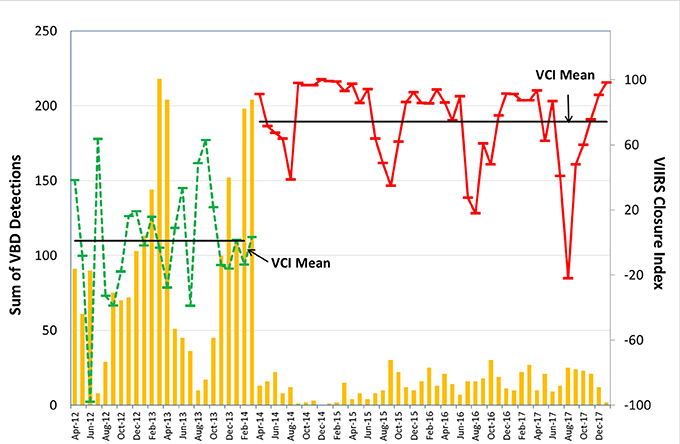
Figure 8. The vertical bars indicate the monthly VIIRS boat detection tallies for the Cauayan closure area from April 2012 through January 2018 The points with connecting lines indicate the VCI values, with the axis labels on the right. The closure VCI are red and pre-closure blue.
Figure 9 shows the annual gridded VCI for the Cauayan closure. A 2 × 2 spatial aggregation was applied prior to the VCI calculation. Also covered are the Ilog municipal waters that had no specific enforcement effort. The 2014 VCI grid covers April–December. Compliance rates are high across most of the fishing ground inside the Cauayan closure, in the range of 90–100%. In each year there is a band of lower VCI values inside the closure boundary. This zone is relatively wide in 2014 for Cauayan and is in the range of 1–2 grid cells in 2015–2017. The Ilog area exhibits compliance in the inner part of the fishing ground in 2014 and 2015. The zone of high compliance in Ilog expanded for 2016 and 2017, leaving only a narrow zone of encroachment along the outer boundary of the closure. The fact that closure compliance in the Ilog municipal waters closely tracks the Cauayan results despite the fact that there was no enforcement effort in Ilog suggest contagion. There is a single fishing ground centered near the intersection of the two LGUs. It is likely that the fishing ground is frequented by a limited set of companies. Faced with increased enforcement in the Cauayan waters, these companies decided to largely adhere to the closure regulations in both municipal waters.
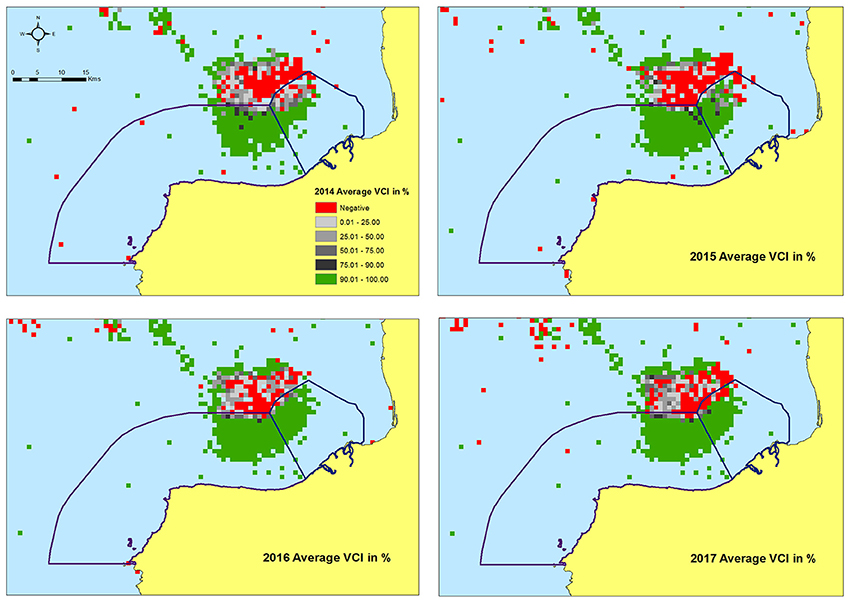
Figure 9. Gridded VCI for the Cauayan and Ilog municipal water closures. The closures were highly effective in each year, with the exception of the narrow strip inside the outer boundary.
Figure 8 shows a seasonal downward spike in VCI values each year centered on or near August. To investigate this phenomena, several of the recent August summary grids were examined and it was determined that the closure boat detections are along the outer boundary of the closure. Could this be due the large footprint size of the DNB pixels (742 × 742 m) with boats outside the closure being recorded in pixels with center point inside the closure? The VIIRS geolocation provide the latitude/longitude of the center points of the pixels. Given that the pixel footprint is 742 m on a side, the light source could be anywhere inside the footprint. Thus, there could be detections of boats just outside the closure with lat/long positions plotting inside the closure. Or is there truly encroachment of fishing boats along the outer boundary? To investigate this we extracted the individual detections for the pixels with center points near the outer edge of the closure and built the outline of the pixel footprints. These results are shown in Figure 10. Most of the boundary detections are clearly inside the closure, indicating encroachment of fishing boats into the closure in certain months. Perhaps the fishing is so good in August that the captains were willing to take the risk of apprehension in order to increase their catch?
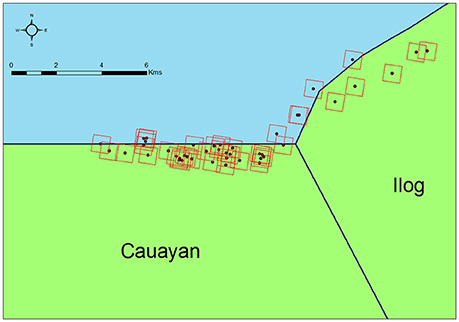
Figure 10. Footprints of VBD pixels plotting along the outer closure boundaries for the Cauayan and Ilog municipal waters from August 2017. Because the light source detected by VIIRS can be located anywhere inside the pixel footprint, those pixels that straddle the boundary line are ambiguous in terms of encroachment. Most of the detections are clearly inside the closure boundary, indicating the presence of closure encroachment.
VBD Alerts
EOG produces and transmits VBD detection alerts for four seasonal fishery closure and 809 municipal water closures in the Philippines. Recipients can opt for email or SMS transmission. The alerts list the name of the closure, the local date and number of VBD found within the closure. Links are provided to graphical maps showing the closure outline and detection location, plus details on the locations, times, and brightness of the detections (Figure 11). The alerts are typically transmitted between 05:00 and 06:00 local time and are used early in the morning to plan enforcement patrols. BFAR reports that the VIIRS tip-offs are resulting in dozens of apprehensions every year.

Figure 11. Examples of the graphical maps that accompany the VBD detection alerts for fishery closures. In the Palawan closure there is a cluster of detections north of Busuanga Island, an area known for frequent encroachment. In Negros Occidental there is a cluster of detection in the outer zone of the Ilog municipal water closure. The alerts are used by BFAR and provincial enforcement teams to plan enforcement patrols.
Discussion and Conclusions
Fishery managers around the world use closures to promote the sustaining boats of fisheries and fish stocks. However, monitoring closure compliance is challenging due to their large spatial extents and remote locations. In some fisheries, all boats are required to carry positional beacons, such as AIS or VMS, which can be used to monitor closure compliance. For closures where boats are not required to carry such devices, fishery agencies must rely on other sources of data to gauge compliance levels.
Over the years a wide range of data sources have been used to rate closure compliance. The most direct data source are detections of fishing boats, which can be extracted from patrol boat observations, shore based cameras, over the horizon radars, airborne and satellite sensors. In fisheries where electric lighting is used to attract catch night, satellite detections of offshore lights have the potential to rate compliance levels. This requires specialized sensors with low-light imaging capabilities. On such sensor is the VIIRS, which collects nightly global data. In this paper, we identify the fishing gear types commonly detected by VIIRS, developed methods for a VCI, analyze compliance rates in three fishery closures, and show examples of near real time detection alerts that are now used for planning enforcement actions in the Philippines.
Using 33 months of Indonesia VMS data we developed VMS/VBD cross-matching rates to determine the gear types that are commonly detected by VIIRS. Small pelagic purse seiners account for 57% of the matches. Only 16% of the VBD matched to VMS, so 84% of the VBD are coming from boats lacking VMS. Only boats 30 GT and higher are required to carry VMS in Indonesia. This is said to be about 10% of the entire fishing fleet in Indonesia. The implication is s that the vast majority of VBD are from boats under 30 GT. Without the VIIRS data, the Indonesia fishery agency would have zero data on the boat locations for more than 90% of the fleet. While not all fishing boats carry sufficient lighting for detection by VIIRS, more than 46% of the VMS boats were routinely detected (10%+ of the time) by VIIRS. More than 90% of the VIIRS matches occur while the vessels movement indicates it is fishing. Based on the large numbers of VBD running from East Asia through S.E. Asia and the finding that 90% of the VMS boats with VBD matches are fishing, the implication is that even when VMS records are not available, VBD can provide a valuable indicator of fishing activity, suitable for rating the effectiveness of fishery closures.
The VCI calculation includes two types of aggregation: spatial and temporal. The monthly temporal aggregation is designed to reduce the impact of lunar cycles on nightly records of VBD numbers. The nightly detection numbers are inversely related to lunar illuminance (LI). By aggregating boat detection numbers into monthly tallies, each month covers slightly more than a full lunar cycle. The other style of temporal cycling seen in long-term VBD records are seasonal, with higher numbers of boat detections during the dry season and fewer boat detections in the wet season. To mitigate for the seasonal variations, the VCI is calculated using the VBD tally in the subject month in the numerator and the average of the same named month from the pre-closure period in the denominator.
Two styles of spatial aggregation were developed for the VCI. In the first, VBD are aggregated across the full area of the closure, defined by a vector boundary. This results in the tabular VCI, with picket-fence charts like Figures 5, 6, 8. The other style of spatial aggregation is to sum up the VBD for blocks of adjacent grid cells for the generation of gridded VCI. The gridded VCI are quite noisy without some level of spatial aggregation. For closures with large spatial extents we used 12 × 12 spatial aggregation. For small closures we used 2 × 2 spatial aggregation. The tabular VCI rates the overall effectiveness of closures, month by month. With the gridded VCI it is possible to identify zones with low or even negative compliance, which may warrant additional effort to promote compliance.
Three types of closures were studied: ad hoc, seasonal, and permanent. In each case, some level of compliance was detected using t-tests applied to the VCI values. The compliance levels, temporal trends and zones of low compliance can be rated using the VCI results.
The ad hoc closure is in Vietnam, associated with a 2016 toxic discharge. For the Vietnam closure, the VCI registered a modest level of compliance, with VCI values ranging from 13 to 44%. These results indicate that a substantial amount of fishing occurred during the closure months. The ban was on the processing and marketing of seafood from the closure zone. So it is possible that the catch was being landed at sites outside of the four closure provinces? Catch may have also been taken by foreign boats and landed outside of Vietnam.
For a seasonal closure, we analyzed data from the Palawan round scad closure. Here the tabular VCI shows compliance rates higher than those from Vietnam, with values from 40 to 80%. The tabular VCI shows that compliance levels have increased from the first year of the closure (2015). The highest compliance levels were recorded in the most recent closure season. The gridded VCI for the Palawan closure shows many areas with high compliance in the central and southern zones, and one limited area having negative VCI values, indicating an increase in fishing boat activity in the closure months for the 2015 and 2016 seasons. The presence of this feature triggered an increase in enforcement actions in the 2017 season and the VCI values increased, indicating higher compliance. BFAR uses the nightly VBD detection alerts for the Palawan closure to keep track of fishing boat activities in the low compliance zone.
For a permanent closure example studies is the Cauayan municipal waters. Here the tabular VCI showed immediate decline in fishing boat activity following a provincial effort to promote compliance, which started in late-March 2014. The provincial government had no specific information on the effectiveness of their efforts until EOG developed the VBD products and services for the Philippines in 2015. The tabular VCI results indicate the closure is highly effective, except for a recurring set of months where compliance rates drop, centered on August each year. The gridded VCI indicate that overall compliance rates are quite high, except for a narrow stip of water on the outer edge of the closure. This encroachment was traced to the seasonal dips in VCI values occurring each year centered on August. Close examination of the VBD pixel footprints indicate that the encroachment is real and cannot be discounted as an artifact of the relatively coarse pixel footprint. While the provincial effort targeted the Cauayan municipal waters, there appears to have been compliance contagion because the VCI in the adjacent Ilog LGU also showed increases in the VCI values during the same time period. This may be due to the fact that the fishing companies who heard the message on Cauayan were operating in the Ilog municipal waters and decided to make moves toward compliance in LGU waters outside the Cauayan closure. The gridded VCI for Cauayan shows that compliance has been high, except to the strip of waters on the outer edge of the closure. For Ilog, the gridded VCI shows largely positive VCI values, with areas of negative VCI on the outer portions of the closure. The gridded VCI shows negative values outside the Cauayan and Ilog closure boundaries, suggesting that the compliant boats had move out of the closure and continued fishing on the other side of the closure boundary.
Obviously, the VCI is only applicable in fishing grounds where there are substantial numbers of VBDs. The VIIRS only detects boats using lighting to attract catch. In Indonesia and Philippines, many purse seiner fish using lights, in some cases up to 100,000 watts of bare bulbs. Certain gear types, such as trawlers and long line fishing boats, have no reason to carry or use extensive lighting and are rarely detected by VIIRS. Comparison of the global distribution of AIS fishing boat grids (Kroodsma et al., 2018) and VBD grids indicates that the two data sources are highly complementary. There are many areas of dense VBD grids with zero representation from AIS equipped boats. This points out the potential value of combining VBD data with other data sources relevant to closure monitoring.
It should be noted that in addition to closure regulations, there are other factors that can affect the VCI. For example, there are interannual variations, such as El Nino, which can affect boat detection numbers. The calculation of VCI using the same month across the time series is designed to reduce seasonal effects, but climate variations propogate into the current version of the VCI. In the future, it may be possible to compensate for climate variations using cloud opacity indices. Similarly, the results from the current method can be affected by long term upward or downward trends in fish stocks. Boat detection numbers can also be affected by economic variables unrelated to closure date ranges, such as fuel costs and market prices for catch. The calculation of the reference boat detection counts from all available non-closure years provides some mitigation for these effects. It would be good practice to review charts similar to Figure 5 to assess whether there are prominent variations across the years.
Another constraint on the use of the VCI is that the earliest usable VIIRS data extends back to April, 2012. It is not possible to calculate VCI for seasonal fishery closures that have operated every year since 2012. It may be possible to extend the VCI analysis back to 1992 using archived data from the DMSP-OLS. Another confounding condition is long term rises or decline in VBD number. It is still possible to calculate VCI values, but the results may be biased by underlying changes in the fishing effort. There may be a way to normalize for long term shifts in fishing effort using the boat detection counts from the non-closure months.
NASA and NOAA have made a long term commitment to provide uninterrupted flow of nightly VIIRS DNB data for many years into the future. Thus, any organization that begins using VIIRS data to track fishery closures can be assured that the product can continue to be generated.
Author Contributions
CE: developed the VCI concept and was the lead author on the paper; TG: made the tabular and gridded VCI data sets; KB: wrote the software to make the monthly summary grids gridded VCI; MZ: wrote the VIIRS boat detection software; F-CH: conducted the VMS cross-matching study and developed the automatic detection alert system; NK: provided details on the Palawan round scad closure; WP: provided details on the Cauayan municipal water closures; BH: provided details of the Vietnam closure.
Conflict of Interest Statement
The authors declare that the research was conducted in the absence of any commercial or financial relationships that could be construed as a potential conflict of interest.
Acknowledgments
The study was jointly sponsored by the U.S. Agency for International Development (USAID), Philippines and the NOAA Joint Polar Satellite Program (JPSS) proving ground program. The source data used in this study are available on an open access basis from https://ngdc.noaa.gov/eog/viirs/download_boat.html.
References
Ani, P. A. B. (2016). Enriching the Philippines Fisheries Resources through Closed Fishing Season Policies. Food and Fertilizer Technology Center. Available online at: http://ap.fftc.agnet.org/ap_db.php?id=690&print=1 (Accessed June 22, 2017).
Arias, A., Cinner, J. E., Jones, R. E., and Pressey, R. L. (2015). Levels and drivers of fishers' compliance with marine protected areas. Ecol. Soc. 20, 1–14. doi: 10.5751/ES-07999-200419
Balduzzi, M., Pasta, A., and Wilhoit, K. (2014). A Security Evaluation of AIS Automated Identification System. New Orleans, LA: ACSAC. Accessed (14 December 08, 2014).
Bannister, N. P., and Neyland, D. L. (2015). Maritime domain awareness with commercially accessible electro-optical sensors in space. Int. J. Remote Sens. 36, 211–243. doi: 10.1080/01431161.2014.990647
Bergseth, B. J., Russ, G. R., and Cinner, J. E. (2015). Measuring and monitoring compliance in no-take marine reserves. Fish Fish. 16, 240–258. doi: 10.1111/faf.12051
Brusch, S., Lehner, S., Fritz, T., Soccorsi, M., Soloviev, A., and van Schie, B. (2011). Ship surveillance with TerraSAR-X. IEEE Trans. Geosci. Rem. Sens. 49, 1092–1103. doi: 10.1109/TGRS.2010.2071879
Burkhauser, R. V., and Wittenburg, D. C. (2000). Who minimum wage increases bite: an analysis using monthly data from the SIPP and the CPS. South. Econ. J. 67, 16–40. doi: 10.2307/1061611
Cheng, T., Zhou, W., Xu, H., and Fan, W. (2016). “Estimation of fishing vessel numbers close to the terminator in the pacific northwest using OLS/DMSP data,” in International Conference on Geo-Informatics in Resource Management and Sustainable Ecosystems (Singapore: Springer), 321–327.
Cho, K., Ito, R., Shimoda, H., and Sakata, T. (1999). Technical note and cover fishing fleet lights and sea surface temperature distribution observed by DMSP/OLS sensor. Int. J. Remote Sens. 20, 3–9. doi: 10.1080/014311699213569
Choi, K., Lee, C. I., Hwang, K., Kim, S. W., Park, J. H., and Gong, Y. (2008). Distribution and migration of Japanese common squid, Todarodes pacificus, in the southwestern part of the East (Japan) sea. Fish. Res. 91, 281–290. doi: 10.1016/j.fishres.2007.12.009
Clarke, A. J., Bailey, D. M., and Wright, P. J. (2015). Evaluating the effectiveness of a seasonal spawning area closure. ICES J. Mar. Sci. 72, 2627–2637. doi: 10.1093/icesjms/fsv144
Cozzolino, E., and Lasta, C. A. (2016). Use of VIIRS DNB satellite images to detect jigger ships involved in the Illex argentinus fishery. Remote Sens. Appl. Soc. Envir. 4, 167–178. doi: 10.1016/j.rsase.2016.09.002
Croft, T. A. (1978). Night-time images of the earth from space. Sci. Am. 239, 68–79. doi: 10.1038/scientificamerican0778-86
Daniel, B. J., Schaum, A. P., Allman, E. C., Leathers, R. A., and Downes, T. V. (2013). “Automatic ship detection from commercial multispectral satellite imagery,” in Algorithms and Technologies for Multispectral, Hyperspectral, and Ultraspectral Imagery XIX, Vol. 8743 (Baltimore, MD: International Society for Optics and Photonics), 874312.
Detsis, E., Brodsky, Y., Knudtson, P., Cuba, M., Fuqua, H., and Szalai, B. (2012). Project catch: a space based solution to combat illegal, unreported and unregulated fishing: Part I: vessel monitoring system. Acta Astronaut. 80, 114–123. doi: 10.1016/j.actaastro.2012.06.009
Dinmore, T. A., Duplisea, D. E., Rackham, B. D., Maxwell, D. L., and Jennings, S. (2003). Impact of a large-scale area closure on patterns of fishing disturbance and the consequences for benthic communities. ICES J. Mar. Sci. 60, 371–380. doi: 10.1016/S1054–3139(03)00010-9
Diogo, H., Pereira, J. G., and Schmiing, M. (2016). Catch me if you can: non-compliance of limpet protection in the Azores. Mar. Policy 63, 92–99. doi: 10.1016/j.marpol.2015.10.007
Elvidge, C. D., Zhizhin, M., Baugh, K., and Hsu, F.-C. (2015). Automatic boat identification system for VIIRS low light imaging data. Remote Sens. 7, 3020–3036. doi: 10.3390/rs70303020
Garza Gil, M. D., Prada-Blanco, M., and Vazquez-Rodriguez, M. X. (2005). Estimating the short-term economic damages from the Prestige oil spill in the Galician fisheries and tourism. Ecol. Econ. 58, 842–849. doi: 10.1016/j.ecolecon.2005.09.009
Gell, F. R., and Roberts, C. M. (2003). Benefits beyond boundaries: the fishery effects of marine reserves. Trends Ecol. Evol. 18, 448–455. doi: 10.1016/S0169-5347(03)00189-7
Guo, G., Fan, W., Xue, J., Zhang, S., Zhang, H., Tang, F., et al. (2017). Identification for operating pelagic light-fishing vessels based on NPP/VIIRS low light imaging data. Trans. Chin. Soc. Agric. Eng. 33, 245–251.
Haggarty, D. R., Martell, S. J., and Shurin, J. B. (2016). Lack of recreational fishing compliance may compromise effectiveness of rockfish conservation areas in British Columbia. Can. J. Fish. Aqu. Sci. 73, 1587–1598. doi: 10.1139/cjfas-2015-0205
Hall, S. (2002). “The use of technical measures in responsible fisheries: area and time restriction,” Chapter 3 in A Fishery Manager's Guidebook. Management Measures and Their Application, ed K. L. Cochrane (Rome: Food and Agriculture Organization of the United Nations).
Joint DA-DILG Administrative Order, No. 1, Series of 2015. (2015). Establishment of a closed season for the management of Galunggong (round scad; Decapterus spp.) in Northern Palawan. Available online at: http://www.bfar.da.gov.ph/LAW?fi=442#post (Accessed June 8, 2017).
Katsilieris, F., Braca, P., and Coraluppi, S. (2013). “Detection of malicious AIS position spoofing by exploiting radar information,” in Information Fusion (FUSION), 2013 16th International Conference on IEEE (Istanbul), 1196–1203.
Kiyofuji, H., and Saitoh, S. I. (2004). Use of nighttime visible images to detect Japanese common squid Todarodes pacificus fishing areas and potential migration routes in the sea of Japan. Mar. Ecol. Prog. Ser. 276, 173–186. doi: 10.3354/meps276173
Kourti, N., Shepherd, I., Greidanus, H., Alvarez, M., Aresu, E., Bauna, T., et al. (2005). Integrating remote sensing in fisheries control. Fish. Manage. Ecol. 12, 295–307. doi: 10.1111/j.1365-2400.2005.00452.x
Kowalska, K., and Peel, L. (2012). “Maritime anomaly detection using Gaussian process active learning,” in Information Fusion (FUSION), 2012 15th International Conference on IEEE (Singapore), 1164–1171.
Kroodsma, D. A., Mayorga, J., Hochberg, T., Miller, N. A., Boerder, K., Ferretti, F., et al. (2018). Tracking the global footprint of fisheries. Science 359, 904–908. doi: 10.1126/science.aao5646
Lancaster, D., Dearden, P., Haggarty, D. R., Volpe, J. P., and Ban, N. C. (2017). Effectiveness of shore-based remote camera monitoring for quantifying recreational fisher compliance in marine conservation areas. Aqu. Conserv. Mar. Freshw. Ecosyst. 27, 804. doi: 10.1002/aqc.2736
Lebona, B., Kleynhans, W., Celik, T., and Mdakane, L. (2016). “Ship detection using VIIRS sensor specific data,” in Geoscience and Remote Sensing Symposium (IGARSS), 2016 IEEE International (Heidelberg: IEEE), 1245–1247.
Lee, J., South, A. B., and Jennings, S. (2010). Developing reliable, repeatable, and accessible methods to provide high-resolution estimates of fishing-effort distributions from vessel monitoring system (VMS) data. Int. Counc. Explor. Sea 67, 1260–1271. doi: 10.1093/icesjms/fsq010
Lemoine, G., Chesworth, J., Schwartz-Juste, G., Kourti, N., and Shepherd, I. (2004). “Near real time vessel detection using spaceborne SAR imagery in support of fisheries monitoring and control operations,” in Geoscience and Remote Sensing Symposium, 2004. IGARSS'04. Proceedings. 2004 IEEE International, Vol. 7 (Anchorage, AK: IEEE), 4825–4828.
Lewison, R. L., Crowder, L. B., and Shaver, D. J. (2003). The impact of turtle excluder devices and fisheries closures on loggerhead and Kemp's ridley strandings in the western Gulf of Mexico. Conserv. Biol. 17, 1089–1097. doi: 10.1046/j.1523-1739.2003.02057.x
Liu, Y., Saitoh, S. I., and Hirawake, T. (2015). Detection of squid and pacific saury fishing vessels around Japan using VIIRS Day/Night Band image. Proc. Asia Pac. Adv. Netw. 39, 28–39. doi: 10.7125/APAN.39.3
Mann, B. Q. (1995). Quantification of illicit fish harvesting in the Lake St Lucia Game Reserve, South Africa. Biol. Conserv. 74, 107–113. doi: 10.1016/0006-3207(95)00019-Z
Maxwell, M. R., Henry, A., Elvidge, C. D., Safran, J., Hobson, V. R., Nelson, I., et al. (2004). Fishery dynamics of the California market squid (Loligo opalescens), as measured by satellite remote sensing. Fish. Bull. 102, 661–670. Available online at: http://aquaticcommons.org/id/eprint/15091
McClanahan, T. R., Graham, N. A., Wilson, S. K., Letourneur, Y., and Fisher, R. (2009). Effects of fisheries closure size, age, and history of compliance on coral reef fish communities in the western Indian Ocean. Mar. Ecol. Prog. Ser. 396, 99–109. doi: 10.3354/meps08279
Neidell, M. J. (2004). Air pollution, health, and socio-economic status: the effect of outdoor air quality on childhood asthma. J. Health Econ. 23, 1209–1236. doi: 10.1016/j.jhealeco.2004.05.002
Öztürk, B. (2015). Nature and extent of the illegal, unreported and unregulated (IUU) fishing in the Mediterranean Sea. J. Black Sea Mediterr. Environ. 21, 67–91. Available online at: http://dergipark.gov.tr/download/article-file/103581
Palka, D., Orphanides, C. D., and Warden, M. L. (2008). Summary of Harbor Porpoise (Phocoena phocoena) Bycatch and Levels of Compliance in the Northeast and Mid-Atlantic Gillnet Fisheries After the Implementation of the Take Reduction Plan: 1 January 1999-31 May 2007. NOAA Technical Memorandum NMFS NE, 212, 89.
Paulino, C., Aroni, E., Xu, H., Alburqueque, E., and Demarcq, H. (2017). Use of nighttime visible images in the study of the spatial and temporal variability of fishing areas of jumbo flying squid (Dosidicus gigas) outside Peruvian EEZ 2004–2015. Fish. Res. 191, 144–153. doi: 10.1016/j.fishres.2017.03.009
Petrossian, G. A. (2015). Preventing illegal, unreported and unregulated (IUU) fishing: a situational approach. Biol. Conserv. 189, 39–48. doi: 10.1016/j.biocon.2014.09.005
PhysOrg (2017). Vietnam Maintains Ban on Deep-Water Fishing in Polluted Area. Available online at: https://phys.org/news/2017-05-vietnam-deep-water-fishing-polluted-area.html (Accessed February 21, 2018).
Rodhouse, P. G., Elvidge, C. D., and Trathan, P. N. (2001). Remote sensing of the global light-fishing fleet: an analysis of interactions with oceanography, other fisheries and predators. Adv. Mar. Biol. 39, 261–303. doi: 10.1016/S0065-2881(01)39010-7
Stastny, J., Hughes, M., Garcia, D., Bagnall, B., Pifko, K., Buck, H., et al. (2011). “A novel adaptive synthetic aperture radar ship detection system,” in Oceans 2011 (Waikoloa, HI: IEEE), 1–7.
Straka, W. C., Seaman, C. J., Baugh, K., Cole, K., Stevens, E., and Miller, S. D. (2015). Utilization of the Suomi national polar-orbiting partnership (NPP) visible infrared imaging radiometer suite (VIIRS) day/night band for arctic ship tracking and fisheries management. Remote Sens. 7, 971–989. doi: 10.3390/rs70100971
Syarifudin, U., Salman, D., and Alam Ali, S. (2017). Application of Viirs-Dnb satellite data to detect ship distribution patterns, fishing activity index and planning instrument of pelagic capture fisheries in bone bay waters. Int. J. Sci. Res. 6, 693–702. doi: 10.21275/ART20174216
Tenth Congress of the Philippines (1998). The Philippines Fishery Code of 1998. Available online at: http://www.lawphil.net/statutes/repacts/ra1998/ra_8550_1998.html (Accessed June 22, 2017).
Tewfik, A., and Béné, C. (2004). The big grab: non-compliance with regulations, skewed fishing effort allocation and implications for a spiny lobster fishery. Fish. Res. 69, 21–33. doi: 10.1016/j.fishres.2004.04.004
Waluda, C. M., Trathan, P. N., Elvidge, C. D., Hobson, V. R., and Rodhouse, P. G. (2002). Throwing light on straddling stocks of Illex argentinus: assessing fishing intensity with satellite imagery. Can. J. Fish. Aqu. Sci. 59, 592–596. doi: 10.1139/f02-049
Wikipedia (2016). 2016 Vietnam Marine Life Disaster. Available online at: https://en.wikipedia.org/wiki/2016_Vietnam_marine_life_disaster (Accessed February 21, 2018).
Williamson, D. H., Ceccarelli, D. M., Evans, R. D., Hill, J. K., and Russ, G. R. (2014). Derelict fishing line provides a useful proxy for estimating levels of non-compliance with no-take marine reserves. PLoS ONE 9:e114395. doi: 10.1371/journal.pone.0114395
Zhang, X., Saitoh, S. I., Hirawake, T., Nakada, S., Koyamada, K., Awaji, T., et al. (2013). An attempt of dissemination of potential fishing zones prediction map of Japanese common squid in the coastal water, southwestern Hokkaido, Japan. Proc. Asia Pac. Adv. Netw. 36, 132–141. doi: 10.7125/APAN.36.19
Keywords: VIIRS, DNB, nighttime lights, fishery closures, restricted coastal waters, Vietnam 2016 marine life disaster
Citation: Elvidge CD, Ghosh T, Baugh K, Zhizhin M, Hsu F-C, Katada NS, Penalosa W and Hung BQ (2018) Rating the Effectiveness of Fishery Closures With Visible Infrared Imaging Radiometer Suite Boat Detection Data. Front. Mar. Sci. 5:132. doi: 10.3389/fmars.2018.00132
Received: 05 September 2017; Accepted: 04 April 2018;
Published: 24 April 2018.
Edited by:
Rochelle Diane Seitz, Virginia Institute of Marine Science, United StatesReviewed by:
Carolyn J. Lundquist, National Institute of Water and Atmospheric Research (NIWA), New ZealandHilmar Hinz, Universidad de les Illes Balears, Spain
Copyright © 2018 Elvidge, Ghosh, Baugh, Zhizhin, Hsu, Katada, Penalosa and Hung. This is an open-access article distributed under the terms of the Creative Commons Attribution License (CC BY). The use, distribution or reproduction in other forums is permitted, provided the original author(s) and the copyright owner are credited and that the original publication in this journal is cited, in accordance with accepted academic practice. No use, distribution or reproduction is permitted which does not comply with these terms.
*Correspondence: Christopher D. Elvidge, chris.elvidge@noaa.gov