An Online Survey of Public Knowledge, Attitudes, and Perceptions Toward Whales and Dolphins, and Their Conservation
 Whitney Naylor
  E. C. M. Parsons*
- Department of Environmental Science and Policy, George Mason University, Fairfax, VA, United States
In 2015, an online survey was conducted to investigate public attitudes and perceptions toward key cetacean (whale, dolphin, and porpoise) conservation and “hot topic” issues such as legislative protection and whaling (n = 858). The vast majority of the participants in this study indicated their permanent residence was the United States (n = 577) or India (n = 251). Perceptions of participants on the conservation priority of cetacean species did not match with the factual IUCN status, where most participants assumed that the larger and more charismatic whales (blue whale, 24.01%; humpback whale, 22.14%; and killer whale, 23.43%) were more endangered or more important to conserve than the small cetacean species such as the Vaquita or Hector's dolphin. Additionally, 39.74% of participants indicated that they thought bottlenose dolphin was the most important to conserve. More members of the public highlighted non-existent (fake) species (e.g., pygmy short-fined whale, lump-headed dolphin, and majestic spotted dolphin) as being of conservation concern than certain species of actual, genuine concern. The majority of participants considered dolphins and whales to be “under protected” or only “slightly protected” (29.95%; 41.96%, respectively) and expressed that marine mammal conservation laws and policies were “very important” or “important” (47.43 and 37.88%, respectively). In addition, 86.83% of participants expressed opposition to the hunting of dolphins and whales (57.93% “strongly opposed” and 28.90% “opposed”); however, only 47.44% of participants were aware that several countries are still involved in whaling. A lack of awareness of the conservation status of whales and dolphins and continued whaling activities suggests that greater outreach to the public about the conservation status of whale and dolphin species is needed.
Introduction
Attitudes toward marine conservation can vary considerably depending upon country of residence and what issue is being discussed. (Eagly 1992) defined attitude as “a tendency or state internal to a person which biases or predisposes a person toward evaluative responses which are to some degree favorable or unfavorable” (pp. 694). A person's attitude is characteristic of his or her evaluation of the representative object (Ajzen and Fishbein, 1977). Furthermore, (Rosenberg 1956) stated that “a strong and stable positive affect toward a given object should be associated with beliefs to the affect that the attitude object tends to facilitate the attainment of a number of important values, while strong negative affect should be associated with beliefs to the effect that the attitude object tends to block the attainment of important values” (pp. 367).
Several different variables can affect the attitudes people have toward the natural environment including gender, locality, ethnicity, age, income, and wildlife activities. (Kellert 1976) found that people's attitudes significantly change with age. Attitudes of children, ranging in ages from 6 to 9, tend to focus around emotional relationships toward animals. They then shift to cognitive or factual attitudes upon becoming a young adolescent (ages 10–13) and then shift again in post-adolescence to attitudes encompassing ethical concern and ecological awareness of the role of animals in their natural habitats (Kellert, 1976). Kellert and Berry (1980) found significant differences between male and female attitudes, knowledge, and behavior toward animals, concluding that gender lies among the most important demographic factors that influence attitudes about animals. The results showed that males tended to value animals for practical and recreational reasons, in contrast to females who were more inclined to express concern for the consumptive exploitation of wildlife and value animals as objects of affection (Kellert and Berry, 1980).
Overall, education is the factor found most likely to change people's attitudes and perceptions (Kellert, 1996; Thompson and Mintzes, 2002). A direct link was also found between an individual's education level and that individual's level of interest, awareness, and concern for environmental issues (Kellert and Berry, 1980; Thompson and Mintzes, 2002). A study by Barney et al. (2005) looked at the effects of education level on knowledge, attitude, and harassment behavior toward bottlenose dolphins and the effects of knowledge structure and attitude on harassment behavior. The study used concept maps to measure the level and complexity of knowledge each individual had regarding dolphins and then had individuals respond to a Likert-type attitudinal inventory to assess their attitudes toward dolphins. Respondents for the tests were students in grades 5, 8, and 11 along with first year university students in general psychology, third year university students in marine biology, and graduate students in the MS program in marine biology. Furthermore, Barney et al. (2005) found that knowledge of dolphins increased with education level and that with increased knowledge, individuals were more likely to have an environmentally friendly attitude toward dolphins and less likely to have a negative attitude. Similar findings were made in studies looking at public knowledge, attitude, and behaviors toward sharks (Thompson and Mintzes, 2002; O'Bryhim and Parsons, 2015).
Thompson and Mintzes (2002) also used concept maps to judge knowledge in a comparable group of students and found that knowledge did increase with grade level. The study concluded an overall positive correlation between scientific and naturalistic1 attitudes and knowledge complexity, in contrast to a negative correlation between utilitarian2 and negative attitudes and knowledge complexity (Thompson and Mintzes, 2002). It should be noted that almost all of the college level students that participated in either study were either taking a marine biology class or were in a marine biology MS graduate study program and had received information regarding these animals prior to participation in the study, which could insert a bias in the results (Thompson and Mintzes, 2002; Barney et al., 2005).
The attitude a person holds toward any animal seeking protection is important because it can affect their behavior toward those animals (Thompson and Mintzes, 2002). (Kraus 1995) stated that attitudes in some fashion can guide, influence, direct, shape, or predict a person's behavior. Furthermore, perceptions of a particular species can be influenced by demographic characteristics, fear of, and empathy toward an animal (Kellert, 1985). Karaffa et al. (2012) asked whether the name used for an animal influenced respondents' opinions regarding its conservation and found that on average species names with negative connotations prompted less support for conservation compared to charismatic sounding names which roused greater support for conservation. They suggest alternative names might make social marketing campaigns more effective and that renaming a species could be a more cost effective way to enhance conservation support (Karaffa et al., 2012).
While many of these species are threatened or endangered, some are also used to focus concern and awareness on less visible problems of ecosystem degradation (Barney et al., 2005). Dolphins and many other marine mammals typically generate positive and aesthetic public attitudes (Kellert, 1999); much of this can be credited to mass media outlets including films, television, and articles in magazines and newspapers (Barney et al., 2005). However, studies have shown a lack of awareness of other high profile threatened species such as whales, penguins, and polar bears (Scott and Parsons, 2004, 2005; Howard and Parsons, 2006; Parsons et al., 2010; Sitar-Gonzales and Parsons, 2012; Luksenburg and Parsons, 2013). Unfortunately, scientists suggest that these attitudes often encourage human-animal encounters that can be harmful or even fatal to the dolphins (Barney et al., 2005). Barney et al. (2005) found that more knowledgeable and environmentally responsible individuals were the least likely to participate in potentially disruptive or harmful harassment behavior toward dolphins.
This study differs from those studies described above as it addresses a more global audience instead of participants in a particular location.
The purpose of this study is to:
• Assess the participants' opinion on dolphin and whale conservation issues, whaling, and captivity;
• Determine if there was a significant relationship between knowledge, attitude, and behaviors as they pertain to dolphins and whales;
• Assess the participant's usage of social media and opinion of usefulness/accuracy for dolphin and whale information;
• Explore the effects of gender and education level on a participant's behavior, attitude, and knowledge.
Methods
The distribution of the survey instrument (see Appendix in Supplementary Material) used in this study was conducted using Amazon Mechanical Turk (MTurk). MTurk boasts a large and diverse workforce of over 100,000 from over 100 countries who complete thousands of tasks daily (Buhrmester et al., 2011). The site “brings together the people and tools that enable task creation, labor recruitment, compensation, and data collection” (Buhrmester et al., 2011). Within the MTurk site, individuals have the option to register as task creators (requesters) or paid task completers (workers). Task creators can create and post surveys, experiments, writing, etc. using technical scripts or simple templates or linking workers to external online survey tools (Buhrmester et al., 2011). Task completers can select available tasks and are subsequently paid upon successful completion of a task.
Surveys were available on MTurk from March to April 2015 to any MTurk task completer that had 1,000 or more Human Intelligence Task's (HITs) approved. No specific individuals were sought out for questioning, and individuals were asked to indicate whether they agreed or declined to participate in the survey. If they declined, the task completer was unable to view the survey questions or submit the survey. The survey instrument in this study as well as the procedure for its distribution was in accordance to the requirements and guidelines of the Human Subjects Review Board at George Mason University, and was approved by this body.
The response rate to the survey was n = 1,020 individuals and an incentive of $0.25 USD was offered to each task completer if the survey was approved. Buhrmester et al. (2011) found that participation in surveys on MTurk is affected by compensation rate and task length; however, participants can still be recruited rapidly and inexpensively. Realistic compensation rates after successfully completing a survey do not affect data quality, and the data obtained from a survey conducted on MTurk is at least as reliable as the data obtained from traditional methods (Buhrmester et al., 2011). Some surveys that were submitted were not filled out in their entirety (n = 162) and information that was provided was not used in this study. For the purpose of this study, 858 completed surveys were utilized. This study is primarily an investigation of attitudes and perceptions in the United States and India, but responses and differences between these two countries are analyzed and explained. An MTurk-based study conducted by Ross et al. (2010) found that over half of survey participants were from the United States and approximately 1/3rd were from India indicating an increase in MTurk international users. Task completers from the United States are offered the option of dispersing earnings from surveys to an Amazon gift card or to a personal bank account; task completers in India also have the option to transfer earnings in Indian Rupees to personal bank accounts. All other international task completers can only transfer earnings into Amazon gift card.
A variety of topics are covered in this survey including conservation, captivity, whaling, and social media, with the number of questions devoted to each issue varying considerably. For many questions, no distinction was made among dolphin and whale species. Twelve attitude questions were included in the survey. Six additional questions focused on knowledge of whales and dolphins. Six behavioral questions were also included on environmental organization membership, subscription to environmental/scientific/animal magazines, participation in whale watching, watching animal programs, preference on observing whales and dolphins, and travel to countries involved in whaling. Demographic questions elicited information on respondent's age, place of residence, occupation, education, and gender.
The program SPSS was used for all statistical analysis of the data.
The survey questions were partitioned into attitude, behavior, and knowledge categories in order to create indexes that would measure a person's knowledge level, attitude, and behavior toward dolphins and dolphin conservation. An index was not created for the demographic and social media questions.
The knowledge index consists of three questions (survey questions 2, 16, and 18) that were each coded into binary inputs. These questions did not have a logical hierarchy, and therefore could not be put into a sequential number input. Question 2 asked which dolphin/whale species listed was the most important to conserve including five known dolphin/whale species, three fake species, one non-cetacean species, and the category “not applicable.” The five known dolphin/whale species were coded as one and all other choices as zero. To create the knowledge index these questions were added together to give a number out of three, with higher scores representing more dolphin/whale knowledge.
The attitudinal index is made up of 12 questions (survey questions 1, 14, 15A-H, 19, and 20), and used to judge a participant's attitudes toward dolphins and dolphin conservation. Question 1 asked how important participants thought dolphin/whale conservation was from very important, important, slightly important, slightly unimportant, unimportant, to very unimportant. This question was scored as a Likert item (scale using levels of agreement or disagreement) with very urgent being worth three and not at all urgent being worth zero. Question 20 was also scored in the same manner. Questions 14 and 19 were scored with an answer of strongly oppose worth two and strongly support as zero. To create the attitude index these questions were added together to give a number out of 18, with higher scores representing a more pro-dolphin/whale attitude.
The behavior index is made up of six questions (survey questions 4, 5, 6, 13, 17, and 27) and used to measure a participant's general behavior toward dolphins. Question 13 asked in which way the individuals would prefer to see dolphin/whales if costs were similar and all options available in a given location. This question was not coded into binary. A selection of dolphin/whales in the ocean from a land-based vantage point received a two, on a dolphin/whale watching boat trip a one, and in a marine park or aquarium a zero. The sum of these questions was used to create an index with a scale of zero to seven with higher scores representing a more pro-dolphin/whale behavior.
As previously mentioned, the demographic questions (survey questions 22 through 26) from the survey were not used to create another index, but rather were used separately for analyses.
A bivariate correlation was used to test for significant relationships between the knowledge, attitude, and behavior indexes. Univariate analysis of variance (ANOVA) tests were used to determine if there was a significant difference between level of education and knowledge, attitude, and behavior indexes. Independent T-tests were also used to see if the mean attitude, knowledge, and behavior indexes of females differed from that of the males who took the survey and if the mean attitude, knowledge, and behavior indexes of participants with a social media account(s) differed from that of participants without a social media account.
Results
Demographics
The majority of the participants were male (60.96%; n = 523), with females making up the remaining 39.04% (n = 335). The age range of the sample population was from 19 to 73 years of age with a mean age of 35 years (SD = 10.9) (Figure 1).
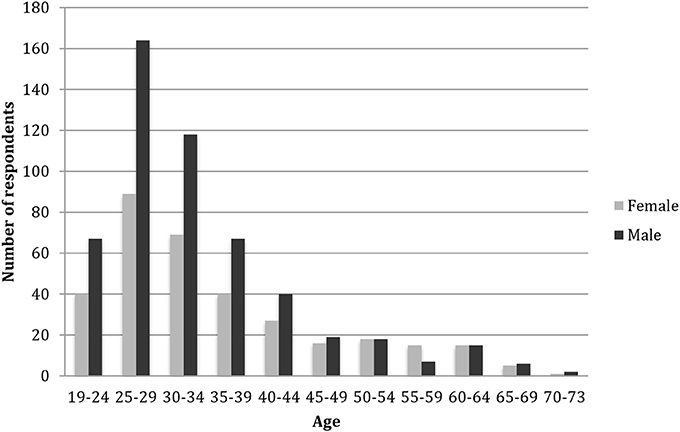
Figure 1. Distribution of ages, separated by males and females, of survey participants (n = 858).
The majority of the participants in this study indicated their permanent residence was the United States (n = 577). Approximately 1/4th of the participants indicated their permanent residence was in India (n = 251) and the remaining participants indicated that their permanent residence was in Canada (n = 3), Croatia (n = 2), United Kingdom (n = 2), France (n = 1), Greece (n = 1), Lithuania (n = 1), Macedonia (n = 2), Mexico (n = 1), New Zealand (n = 1), Nigeria (n = 1), Pakistan (n = 1), Poland (n = 1), Romania (n = 3), Serbia (n = 1), Slovenia (n = 1), South Africa (n = 1), Sri Lanka (n = 1), Taiwan (n = 1), and Thailand (n = 1) (Figure 2).
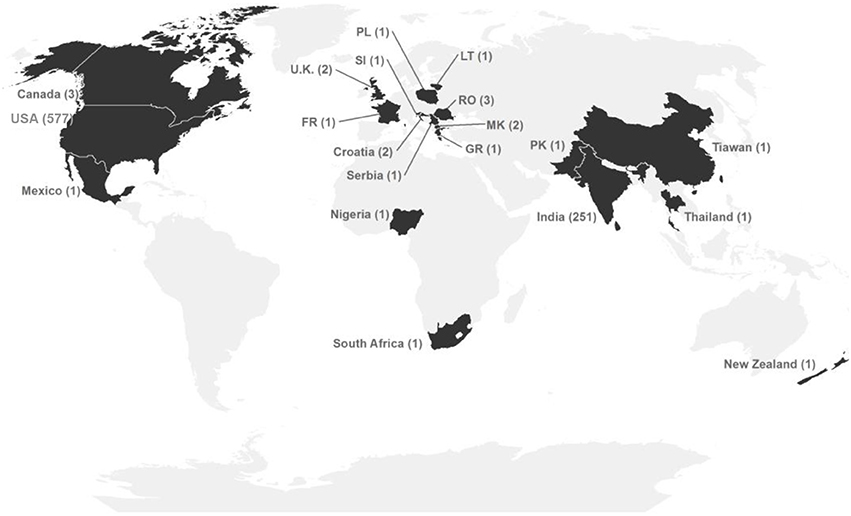
Figure 2. Survey participants' country of permanent residence. The number of participants per country is in parentheses (n = 854).
In terms of education, approximately half of the participants (n = 441) had completed at least an associate's degree, while the remaining half was divided between participants who obtained a higher degree (Masters, Ph.D., M.D, or other terminal degree) (18.53%; n = 159) and participants who had up to some college but no degree (30.07%; n = 258) (Table 1).
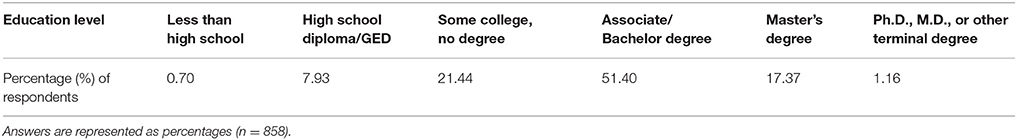
Table 1. Responses to the question “Please indicate the highest level of education that you have completed.”
Knowledge, Attitude, and Behavior
The knowledge index had a minimum possible score of zero and a maximum possible score of three. The participant's scores ranged from zero to three and the mean score was 1.169 (SD = 0.878). Higher index scores reflected a higher level of knowledge about dolphins and whales and related conservation issues (Figure 3).
Figure 3. Range of respondents' knowledge levels, indicating how much or little they know about dolphins and whales. Higher scores indicate more knowledge (n = 858).
An independent t-test was conducted to determine if the mean knowledge level of males differed from the mean knowledge index of females. Data were gathered from samples of 335 females and 523 males, with a female sample mean of 1.12 (SD = 0.845) and a male sample mean of 1.20 (SD = 0.845). The independent t-test indicated that the knowledge level means were not significantly different for males and females (t = −1.405, df = 856, p = 0.160).
An independent t-test was also conducted to determine if the mean knowledge level of participants with a social media account(s) differed from the mean knowledge level of those without a social media account. Data were gathered from samples of 700 participants with a social media account(s) and 158 without, with a social media account(s) mean of 1.21 (SD = 0.881) and a without social media account sample mean of 0.98 (SD = 0.841). The independent t-test indicated that the knowledge level means were significantly different for participants with a social media account(s) and without a social media account (t = −3.084, df = 241.195, p = 0.002). Thus, those participants with a social media account(s) were more likely to report higher knowledge of dolphins and related conservation issues.
A one-way ANOVA was conducted to determine if the mean knowledge level differed by level of education of the participants. The one-way ANOVA was found to not be statistically significant [F(4, 858) = 0.624, p = 0.646, η2 = 0.003].
The attitude index had a minimum possible score of zero and a maximum possible score of 18. Higher scores for this index represented the likelihood that a participant's attitudes would be more dolphin and whale positive and conservation oriented. The participant's scores ranged from one to 18 and the mean score was 10.713 (SD = 3.284) (Figure 4).
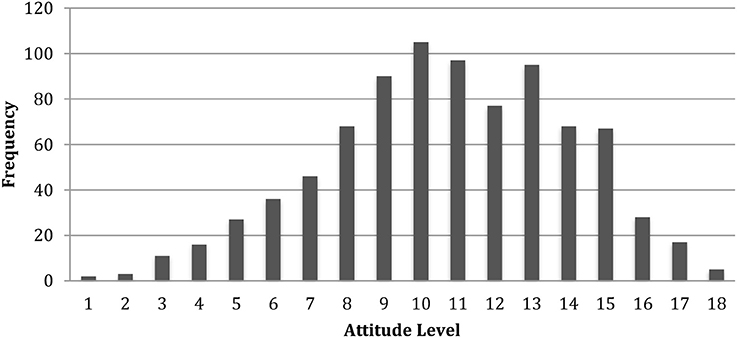
Figure 4. Range of respondents' attitude levels, indicating how pro-dolphin they are. Higher scores indicate a more pro-dolphin attitude (n = 858).
An independent t-test was conducted to determine if the mean attitude level of males differed from the mean attitude level of females. Data were gathered from samples of 335 females and 523 males, with a female sample mean of 11.28 (SD = 3.199) and a male sample mean of 10.53 (SD = 3.290). The independent t-test indicated that the attitude level means were significantly different for males and females (t = 4.065, df = 856, p < 0.0001). Thus, there is a significant difference in attitudes between genders, with females being significantly more positive toward cetaceans than males.
A one-way ANOVA was conducted to determine if the mean attitude level differed by level of education of the participants. The one-way ANOVA was found to be statistically significant [F(4, 858) = 4.171, p = 0.002, η2 = 0.019]. Those participants with Master's Degree were significantly more positive toward cetaceans than a combined group of participants with high school diploma/GED and some college, but no degree.
The behavior index had a minimum possible score of zero and a maximum possible score of seven. The participant's scores ranged from zero to seven and the mean score was 2.334 (SD = 1.189) Higher index scores reflected more pro-dolphin/whale and pro-conservation behavior (Figure 5).
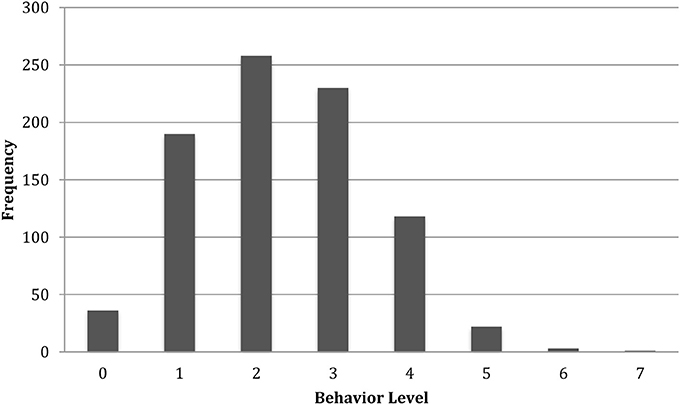
Figure 5. Range of respondents' behavior levels, indicating how pro- or anti-dolphin they would behave. Higher scores indicate more pro-dolphin behavior (n = 858).
An independent t-test was conducted to determine if the mean behavior level of males differed from the mean behavior level of females. Data were gathered from samples of 335 females and 523 males, with a female sample mean of 2.51 (SD = 1.176) and a male sample mean of 2.22 (SD = 1.184). The independent t-test indicated that the behavior level means were significantly different for males and females (t = 3.553, df = 856, p < 0.000). Therefore, female participants more likely to report positive behaviors toward dolphins and dolphin conservation than male participants.
A one-way ANOVA was conducted to determine if the mean behavior level differed by level of education of the participants. Unlike with the attitude index above, the one-way ANOVA was found to not be statistically significant for the behavior index [F(4, 858) = 1.363, p = 0.245, η2 = 0.006].
A Pearson correlation coefficient was computed to determine if there is a relationship between knowledge, attitude, and behavior levels. The null hypothesis that the correlation is 0 was rejected at the 0.01 level of significance. Therefore, there is a positive correlation between knowledge level, attitude level, and behavior level (Table 2). Therefore, higher levels of knowledge was linked to more positive attitudes toward cetaceans and the conducting of more cetacean-positive behaviors.
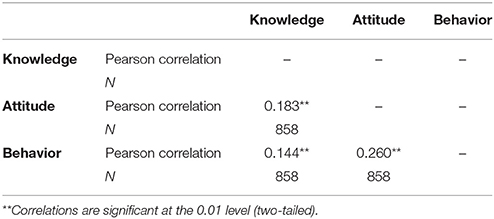
Table 2. Correlation between previously recorded knowledge, attitude, and behavior levels.
Conservation
Survey participants were asked how important they felt whale and dolphin conservation was. The participant's responses are noteworthy because approximately 95% of participants felt conservation was important at some level, with only 4% stating that it was “unimportant” to them (Table 3). Similarly, 96.41% of participants from the US and 95.49% of participants from India felt whale and dolphin conservation was important at some level (Table 4). Participants were then asked which dolphin/whale species from a given list was the most important to conserve (Figure 6). Figure 7 displays which dolphin/whale species from a given list participants from the United States and India felt was the most important to conserve. Table 5 displays the IUCN Red List and US Endangered Species Act (ESA) listing for each dolphin and whale species respondents were asked to choose from. Of note, approximately 40% of respondents felt the bottlenose dolphin was the most important species to conserve. Over 40% of participants from the US thought the bottlenose dolphin was the most important to conserve compared to only 31% of participants from India. Despite essentially being the same species, the “Vaquita porpoise” received more votes than the [Gulf of] California harbor porpoise, 3.61 and 2.68% respectively, but both species were highlighted by more than an order of magnitude less members of the public than noted the bottlenose dolphin as the chief species of concern. Additionally, the three “fake” species (the “Lump-headed dolphin”−6.17%, the “Majestic spotted dolphin”−7.0%, and the “Pygmy short-finned whale”−4.2%) received more votes collectively than the “California harbor porpoise,” the “Vaquita porpoise,” the “Northern right whale”−5.01%, and the “Fin whale”−4.9% (17.37 and 16.02%, respectively). Although not a cetacean, 16% of respondents felt the whale shark was the most important dolphin/whale species to conserve. Of note, significantly more participants from India felt the whale shark was the most important to conserve than participants from the United States.

Table 3. Percentage of respondents whose opinion it was that dolphin/whale conservation was very important, important, slightly important, slightly unimportant, unimportant, or very unimportant (n = 858).
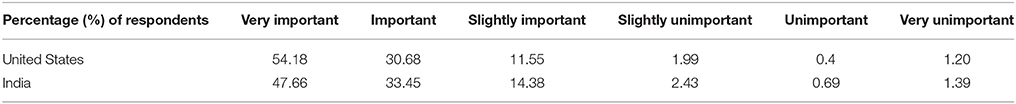
Table 4. Percentage of respondents from the United States and India whose opinion it was that dolphin/whale conservation was very important, important, slightly important, slightly unimportant, unimportant, or very unimportant (US, n = 577; India, n = 251).
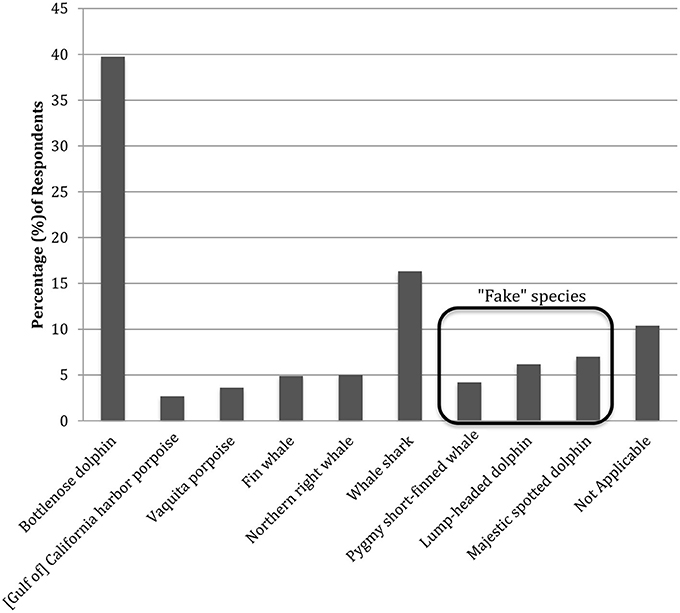
Figure 6. Which dolphin/whale species listed respondents felt was the most important to conserve. The whale shark is not a cetacean species. The Pygmy short-fined whale, the Lump-headed dolphin, and the Majestic spotted dolphin were included as “fake” species (n = 858).
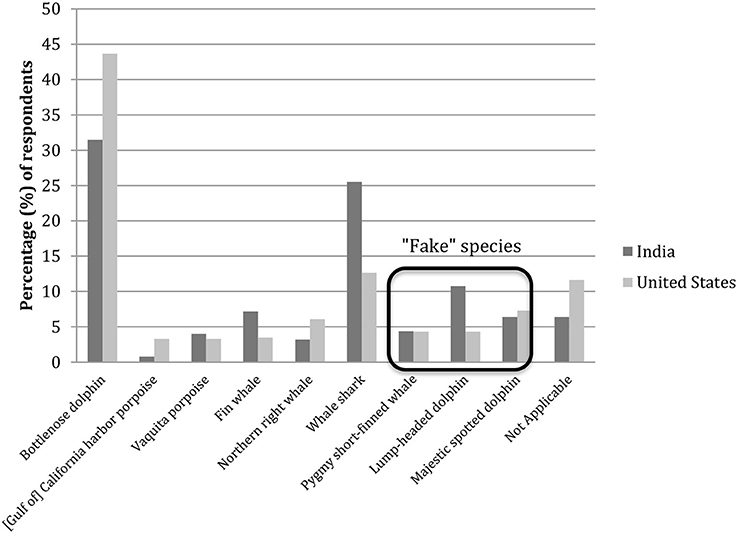
Figure 7. Which dolphin/whale species listed respondents from the United States and India felt was the most important to conserve. The whale shark is not a cetacean species. The Pygmy short-fined whale, the Lump-headed dolphin, and the Majestic spotted dolphin were included as “fake” species (US, n = 577; India, n = 251).
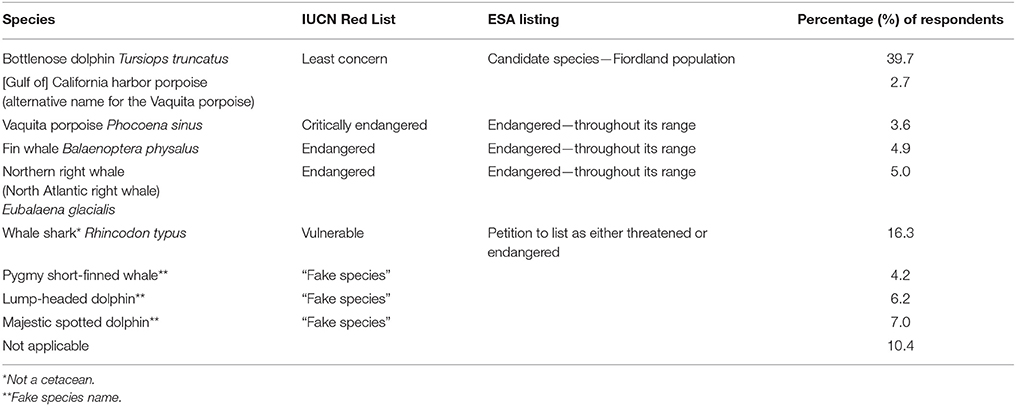
Table 5. Percentage of respondents whom felt the listed dolphin/whale species was the most important to conserve along with the IUCN Red List and US Endangered Species Act (ESA) listing for each species (n = 858).
Participants were also asked to indicate which species listed in the survey was the most endangered (Figure 8). Table 6 displays the IUCN Red List and US Endangered Species Act (ESA) listing for each dolphin and whale species respondents were asked to choose from. Approximately 75% of respondents felt that the blue whale, the humpback whale, and the killer whale were the most important to conserve (24.01, 22.14, and 23.43%, respectively). Of note, significantly more participants from the United States felt the humpback whale was the most endangered and more participants from India felt the blue whale was the most endangered (Figure 9).
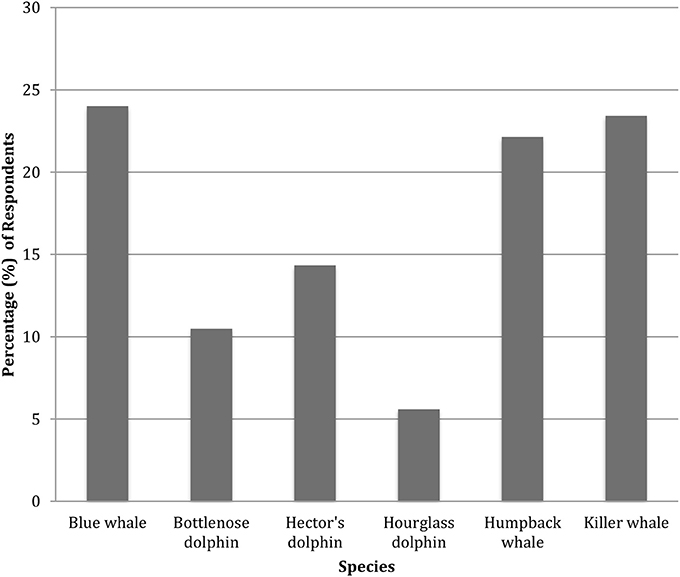
Figure 8. Which dolphin/whale species listed respondents felt was the most endangered (n = 858).
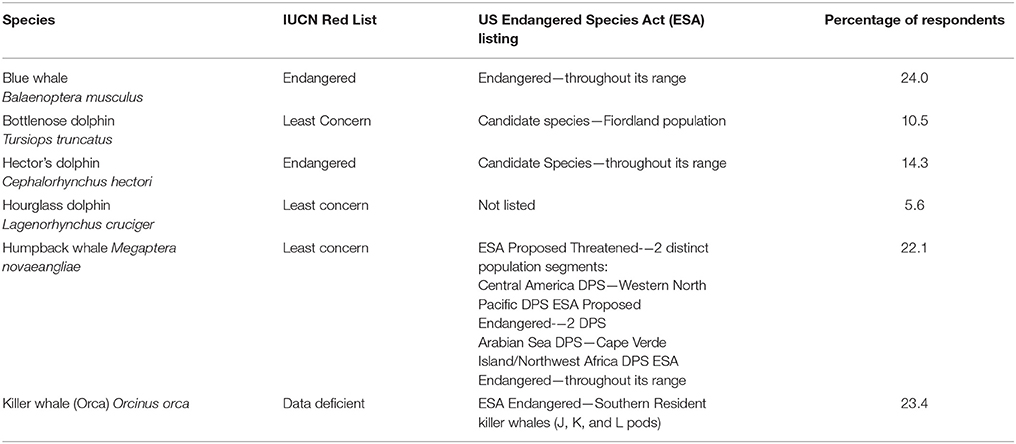
Table 6. Percentage of respondents whom felt the listed dolphin/whale species was the most endangered along with the IUCN Red List and US Endangered Species Act (ESA) listing for each species (n = 858).
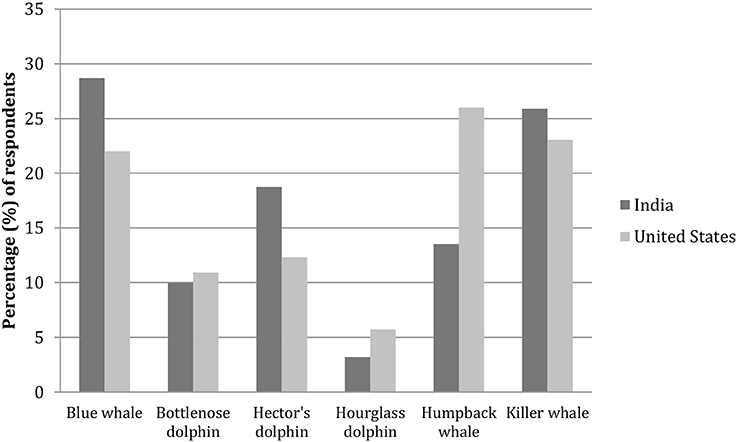
Figure 9. Displays which dolphin/whale species listed respondents from the United States and India felt was the most endangered (US, n = 577; India, n = 251).
Less than 5% of respondents thought that marine mammal conservation laws and policies were unimportant (Table 7). Over one-quarter of the respondents felt that dolphin and whale species were under protected and another two-fifths indicated that dolphin and whale species are only slightly protected (Table 8). Of note, 37.27% of US participants indicated that dolphin and whale species were under protected compared to only 14.34% of participants from India (Table 9).
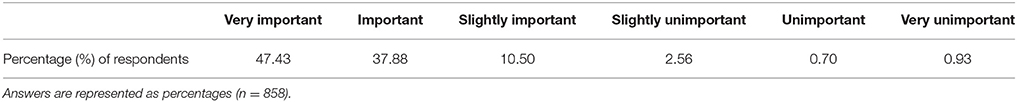
Table 7. Responses to the question “How important do you think marine mammal conservation laws and policies are?”
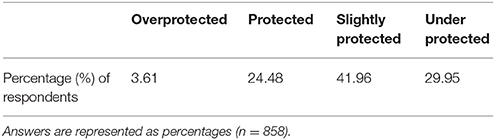
Table 8. Responses to the question “How well do you think dolphin and whale species are protected worldwide?”
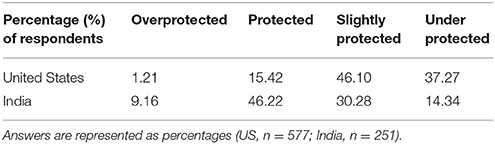
Table 9. Responses from the United States and India to the question “How well do you think dolphin and whale species are protected worldwide?”
A chi-square test of association was conducted to determine if there was a relationship between how important participants felt dolphin and whale conservation was and the which way they would prefer to see dolphins and whales. Sixty percent of the participants prefer to see dolphins and whales on a dolphin/whale-watching boat trip. Participants that feel dolphin/whale conservation is “slightly unimportant” to “very unimportant” have a higher percentage of this preference, while the individuals that felt dolphin and whale conservation was very important had a higher preference to view dolphins and whales in the ocean from a land-based vantage point. However, there is not a significant association between how important participants felt dolphin and whale conservation was and which way they would prefer to see dolphins and whales (x2 = 7.144, df = 6, p = 0.308).
A chi-square test of association was also conducted to determine if there was a relationship between how important participants felt dolphin and whale conservation was and if they were a member of any type of conservation/environmental group. There appears to be an association or relationship between the level of dolphin and whale conservation importance and membership in a conservation/environmental group (x2 = 9.693, df = 3, p = 0.021). Examination of the standardized residuals suggests that respondents who feel dolphin and whale conservation is very important are significantly more likely to be a member of any type of conservation/environmental group (standard residual = 2.2) as compared to all other respondents.
A chi-square goodness-of-fit test was conducted to determine if the sample proportions were the same for how important the respondents felt marine mammal conservation laws and policies were. The study found a statistically significant difference between the levels of importance for marine mammal conservation laws and policies (x2 = 450.485, df = 3, p ≤ 0.001).
Survey Participant Behavior
Table 10 displays responses to four questions pertaining to participant's environmental related activities. Only 14% of respondents indicated they had ever gone on a dolphin/whale research expedition or a dolphin/whale-watching trip. Approximately half of the respondents indicated they watch animal programs on channels such as Discovery, Animal Planet, BBC, or National Geographic. However, only 6% of respondents indicated they subscribed to any environmental/scientific/animal magazine. Of those participants that subscribed, 33% indicated they received National Geographic Magazine. An even lower number of participants, approximately 4%, stated that they were a member of any type of conservation/environmental group.
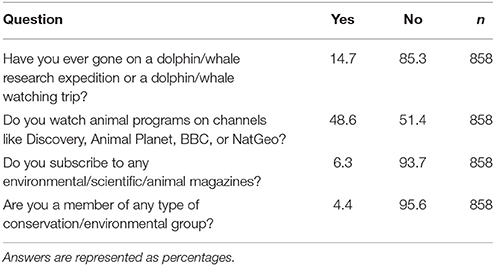
Table 10. Responses to four questions pertaining to participant's environmental related activities.
Whaling
This section considers participants attitudes toward whaling. Slightly less than half of respondents indicated that they were aware that several countries are still involved in whaling (Table 11). Those participants who said they were aware were then asked to indicate which country(ies) are still involved in whaling. Countries indicated by participants included: Japan, China, Greenland and the Faroes, Norway, Iceland, Canada, Russia, the United States, South Africa, Australia, New Zealand, Vietnam, South Korea, Sri Lanka, Sweden, Finland, Thailand, Somalia, Peru, India, and Indonesia. Of those participants, 56% said Japan and 5% said they were aware of countries participating in whaling but did not know which countries. Approximately half of participants indicated they would boycott visiting a country that was involved in whaling with the other half saying they would not (Table 12). Only 13% of respondents indicated they have heard of the International Whaling Commission (Table 13). Finally, over 85% of respondents indicated that they were opposed or strongly opposed to the hunting of whales (Figure 10). Of note, 23.91% of participants from India supported or strongly supported the hunting of whales as compared to only 8.84% of participants from United States (Figure 11).
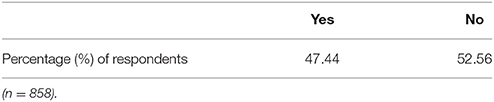
Table 11. Responses to the question “Were you aware that there are several countries that are still involved in whale hunting (whaling)?”
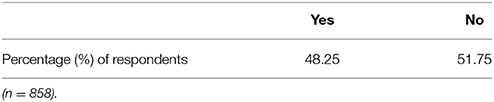
Table 12. Responses to the question “Would you boycott visiting a country involved in whaling?”
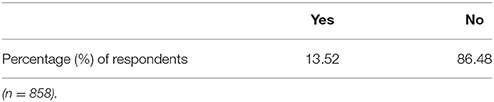
Table 13. Responses to the question “Have you heard of the International Whaling Commission (IWC)?”
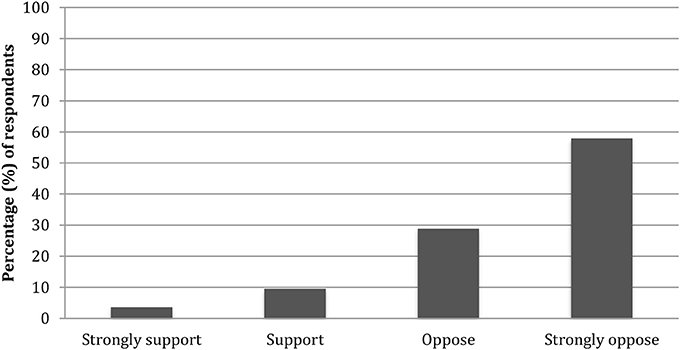
Figure 10. Displays percentage of respondents whose level of support was either strongly supportive, supportive, opposed, or strongly opposed to the hunting of whales (n = 858).
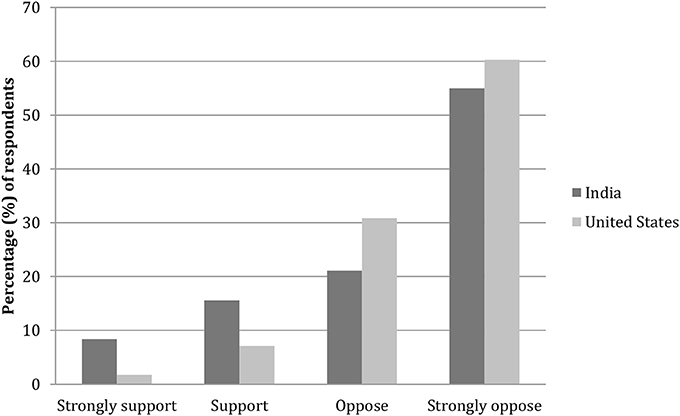
Figure 11. Displays percentage of respondents from the United States and India whose level of support was either strongly supportive, supportive, opposed, or strongly opposed to the hunting of whales (US, n = 577; India, n = 251).
A chi-square goodness-of-fit test was conducted to determine if the sample proportions of how supportive respondents were to the hunting of whales were all the same. The study found a statistically significant difference between the levels of supportiveness (x2 = 265.346, df = 2, p ≤ 0.001). That is to say, the public was significantly more likely to be opposed to whaling.
Discussion
Study Limitations
This survey was conducted in an online format due to time constraints with a sample size of 858 MTurk users 18 years and older. Users of MTurk also tend to come predominantly from two counties: the USA and India, and this was the case in this study. However, efforts were taken to separate and contrast the datasets from these two countries, to investigate differences in attitudes.
(Wright 2005) examined the advantages and disadvantages related to conducting online surveys by reviewing current features, issues, pricing, and limitations associated with products and services including online questionnaire features and services used to facilitate the online survey process. One advantage of conducting internet-based survey research is the ability to reach thousands of people regardless of distance (Bachmann and Elfrink, 1996); data can be collected while other tasks are being performed thus saving time (Llivea et al., 2002; Andrews et al., 2003; de Leeuw, 2012). Additional advantages include the possibility of the survey being more cost effective by eliminating the cost of paper, printing, data entry, and postage (if applicable) (Bachmann and Elfrink, 1996; Llivea et al., 2002; de Leeuw, 2012) and the ability of the survey to reach groups that only exist in cyberspace and do not require face-to-face meetings (Wright, 2005). However, there are concerns surrounding the design, implementation, and evaluation of an online survey. Non-response is problematic in any type of survey. Compared to other methods, including in person interviews and postal surveys, online surveys generally yield a lower response rate (de Leeuw, 2012). Additionally, excessive survey length, lack of interest, and poor survey design can hurt online survey response rates (Dillman et al., 2009). Internet coverage/accessibility of the general population can also be an issue, especially under-coverage of certain sub-groups including the elderly and the less educated (de Leeuw, 2012).
Demographics
Trends exist in who responds to surveys, and who does not, with regard to traditional survey methods (Smith, 2008). In general, younger people are more likely to participate than older people (Moore and Tarnai, 2002); more women are likely to participate than men (Curtin et al., 2000; Moore and Tarnai, 2002); and more educated and more affluent people are more likely to participate than less educated, less affluent people (Curtin et al., 2000). Online surveys are relatively new by comparison but are quickly growing in importance (Dillman et al., 1999).
Most of the participants in this survey were born in the 1981–1990 time frame, which is similar to that of a study by Howard and Parsons (2006) where 21–30 year olds made up 23% of participants. Additionally, in a study looking at potential gender bias in online survey response, (Smith 2008) found a difference in the online survey response rates of female and male participants, having higher response rates for females than males. However, the current study found a higher response rate from males (n = 523) than females (n = 335). Notably, there were a larger number of males between 25 and 34 years of age than females.
Knowledge, Attitude, and Behavior
This study showed that marine mammal conservation issues were important to a majority of the participants. It is possible that participants of this online survey had an interest in conservation or cetaceans and searched for a survey on MTurk using key words such as conservation, cetacean, dolphin, or public attitude. A majority of participants felt that marine mammal conservation laws and policies were important despite a lack of awareness of the conservation status of whales and dolphins. These findings suggest that detailed knowledge of the conservation status of whales and dolphins is not a prerequisite of strong positive attitudes toward cetacean conservation issues. It is possible that strong support for marine mammal conservation issues could be due to the fact that marine mammals are popular among the general public and produce positive, aesthetic, humanistic views (Kellert, 1999).
Additionally, the mean attitude and behavior levels of males and females were found to be significantly different. Kellert and Berry (1980) found that females possess a greater concern for the harassment of animals and seem to value animals as objects of affection, leading to stronger conservation attitudes. The mean attitude level also differed between level of education of the participants with a significant difference between those participants indicating they had a Master's degree and those that had a high school diploma/ GED and some college, or no degree. These findings are supported by a study conducted by (Kellert 1996) who found that education is most likely to change a person's attitude and perception of nature and biodiversity. Thompson and Mintzes (2002) and Kellert and Berry (1980) similarly found a direct relationship between education level and interest, concern, and awareness of environmental issues.
Consistent with findings by Barney et al. (2005), a positive correlation was observed in the current study between knowledge level, attitude level, and behavior level. Barney et al. (2005) found a person's knowledge of bottlenose dolphins increased with age and educational exposure, and were increasingly more likely to have an environmentally friendly, ecoscientific view of dolphins. Many researchers believe that knowledge and attitude are liked to each other and attitude is further connected to behavior (Flamm, 2006). When discussing the environment it can be assumed “if people become more knowledgeable about the environment and its associate, they will, in turn, become more aware of the environment and its problems and thus, be more motivated to act toward the environment in more responsible ways” (Fahlquist, 2009).
Conservation
Similar to the Howard and Parsons (2006) survey and the Scott and Parsons (2005) survey, the overall public concern reported in this survey, regarding dolphin and whale conservation, was high. Almost 50% of participants in the current study thought that dolphin and whale conservation was very important; with another 46.63% indicating it was important or slightly important. In a survey investigating the awareness and attitudes of resident Arubans (in the Dutch Antilles, the Caribbean) and tourists toward marine mammals and their conservation, Luksenburg and Parsons (2013) found that 88.4% of participants felt marine conservation issues were important or very important, with only 2.5% indicating they were unimportant or very unimportant, and 9.0% indicated they had no opinion.
Given a list of whale species, 24% of current survey participants thought the blue whale was the most endangered, 22% thought the humpback whale was the most endangered, and 23% thought the killer whale was the most endangered. Of note, significantly more participants from the United States felt the humpback whale was the most endangered compared to participants from India (26 and 13.54% respectively) and significantly more participants from India felt the blue whale was the most endangered compared to participants from the United States (28.69 and 22.01% respectively). Only 14.33% of current survey participants felt the Hector's dolphin was the most important to conserve. In a preliminary study of American college students, Parsons et al. (2010) found that 39% of participants felt the humpback whale was the most threatened followed by the blue whale with 24.8%; only 4.8% indicated the North Pacific right whale was the most threatened. During the time the Parsons et al. (2010) survey was conducted, the North Pacific right whale was considered to have one of the worst conservation statuses and considered to be one of the most endangered whale species globally. In an additional study of college students by Sitar-Gonzales and Parsons (2012) on the perceived conservation status of polar bears and penguins, 69 and 53% of participants felt polar bears and penguins, respectively, were internationally classified as “endangered.” At the time of the study, the polar bear was listed as “vulnerable” and five penguins were internationally classified as “endangered” and six as “vulnerable” (Sitar-Gonzales and Parsons, 2012).
The blue whale is highly recognizable to the general public. It is known as the largest animal on earth, possibly leading to its identification in this survey as the most endangered whale or dolphin species. Additionally, the blue whale often frequent the coast of India and is a popular species on whale-watching tours around Sri Lanka, possibly leading to the familiarity of the general public of India and leading to more Indian participants feeling the blue whale was the most endangered. The humpback whale, also very familiar to the general public, is often the main focus for the US whale-watching industry, and possibly attracts more media attention than any other large whale (Parsons et al., 2010). The killer whale is listed as “data deficient” by the IUCN but southern resident killer whales are listed as endangered by the US Endangered Species Act (ESA). It is possible that the highly publicized book Death at SeaWorld by David Kirby, or the much-viewed documentary Blackfish could have influenced the high percentage of participants in the current study that felt the killer whale was the most endangered cetacean species. Similar to the Parsons et al. (2010) study in which only a very small number of participants correctly identified the most endangered listed cetacean, the current study only had a small number of participants indicate that the Hector's dolphin was the most important to conserve. The Hector's dolphin is listed as “endangered” by the IUCN and a candidate species throughout its range by the ESA. It has one of the most restricted distributions of any cetacean and has suffered and is drastic decline over the past 30 years with levels of mortality being unsustainable (Reeves et al., 2013).
Participants in the current study were also asked which species listed was the most important to conserve. Almost 40% of respondents indicated the bottlenose dolphin was the most important to conserve, with more participants from the United States indicating this than participants from India. The bottlenose dolphin is listed as a species of “least concern” by the IUCN and is not listed under the ESA (although the Fiordland population in New Zealand is a candidate for ESA listing). Therefore, its identification as the whale and dolphin species most important to conserve was surprising. Similar to the humpback whale, the bottlenose dolphin is very recognizable to the general public, especially in the United States, being one of the most common cetacean species in captivity. Despite their high media profile, awareness of the bottlenose dolphin conservation status, in the sample population, was low, which is consistent with findings on polar bears and penguins from the Sitar-Gonzales and Parsons (2012) study. It was also notable that 16% of respondents felt the whale shark was the most important to conserve. Additionally, significantly more participants from India indicated the whale shark was the most important to conserve than participants from the United States. While the whale shark is listed as “vulnerable” by the IUCN, and is petitioned to be listed as either threatened or endangered by the ESA, it is a fish not a cetacean. The whale shark was heavily exploited during the 1990s off the Gujarat coast of India (Pravin, 2000) but as of 2001 it is protected under the Indian Wildlife (Protection) Act [Wildlife Trust of India (WTI, 2013)], thus possibly leading to the increased number of Indian participants who felt the whale shark was the most important to conserve. It is also possible that respondents did not accurately read the question, or rather disturbingly, they incorrectly viewed the whale shark as a cetacean. Similarly, Scott and Parsons (2004) found that general awareness of the occurrence and diversity of cetaceans in southwest Scotland was low. Participants were show photographs of the four most commonly occurring species; only 30.2% of participants identified one or more of the species correctly. The species most correctly identified in the study was the bottlenose dolphin (19%), followed by the harbor porpoise (17.5%), minke whale (10.7%), and lastly the common dolphin (7.1%) (Scott and Parsons, 2004).
On the list of species presented during this survey, having one of the worst conservation statuses, the Vaquita porpoise is listed as “critically endangered” by IUCN and “endangered” by ESA. Despite being the same species, the Vaquita porpoise received more votes than under an alternative common name of [Gulf of] California harbor porpoise. However, only 6.29% of respondents collectively felt it was the most important dolphin and whale species to conserve. The three “fake” species (the Lump-headed dolphin, the Majestic spotted dolphin, and the Pygmy short-finned whale) received more votes collectively than the [Gulf of] California harbor porpoise, the Vaquita porpoise, the Northern right whale, and the Fin whale (17.37 and 16.02%, respectively). Of the three “fake” species, more participants thought the Majestic spotted dolphin was more important to conserve than the Lump-headed dolphin and the Pygmy short-finned whale (7.0, 6.17, and 4.2%, respectively). These results might be expected as a study by Karaffa et al. (2012) found that on average species names with negative connotations gathered less support for conservation (51%) whereas charismatic/positive sounding names prompted greater support for conservation (65%). Respondents were twice as likely to not conserve a negative sounding species (14%) than a positive sounding species (7%) (Karaffa et al., 2012).
Scott and Parsons (2005) investigated levels of public awareness of cetacean protection finding that 45.6% of participants felt cetaceans in Scotland were not sufficiently protected. Additionally, participants were asked to comment on the level of threat posed to cetaceans in Scottish waters by a variety of activities; oil spills (43.7%), reduction in available prey (41.8%), marine litter (32%), and sewage bacteria (31.1%) were indicated by most participants as posing the greatest threat (Scott and Parsons, 2005). Only 0.8% considered whale watching to be a serious threat (Scott and Parsons, 2005). Similarly, Howard and Parsons (2006) found 33% of participants felt cetacean's protection in Scotland was insufficient. Oil spills (68%), chemical pollution (65%) sewage pollution (63%), depletion of cetacean prey from over-fishing (54%), entanglement in fishing gear (51%), marine litter (44%), and global warming (43%) were considered by participants to be the greatest threats to cetacean populations, with only 3.1% indicating whale watching was a serious threat (Howard and Parsons, 2006). The current study found that 30% of people felt cetaceans were under protected with an additional 42% indicating cetaceans were only slightly protected.
Whaling
Scott and Parsons (2005) noted that 69.4% of participants stated they were aware of commercial and 'scientific' whaling operations being conducted. Almost all participants were against hunting whales (94.4%) with no participants indicating they strongly supported whaling. A large majority of this study's participants (86.83%) indicated they either strongly opposed or opposed hunting with 3.61% of participants strongly supporting whaling. Freeman and Kellert (1992) commissioned Gallup Organization to conduct an opinion poll on whaling in six countries including Australia, England, Germany, Japan, Norway, and the United States. They found that participants from the four non-whaling countries (Australia, England, Germany, and the United States) were highly opposed to whaling as compared to participants from the two whaling countries (Japan and Norway) where only a minority was opposed to whaling. The public of the whaling countries knew more about whaling, but knowledge about whale populations did not differ between the whaling and non-whaling countries. In 1999, Kellert conducted another study of American attitudes finding that 70% of Americans opposed whaling.
Only 48.25% of respondents indicated they would not visit a country involved in whaling, with slightly more Americans indicating they would not visit than Indians (49.05 and 48.61%, respectively). This is contrary to a study by Parsons and Rawles (2003) who found that 79% of whale-watchers in Tobermory, Isle of Mull, Scotland, would boycott a country that conducted hunts for cetaceans. Parsons and Draheim (2009) also found the 77.1% of tourists in the Dominican Republic would be less likely to visit a Caribbean country on vacation that supported the hunting or capture of whales and dolphins.
Conclusions
This study provides an initial indication of online survey participant views toward dolphins and whales, and their conservation.
The results of this study revealed high public concern regarding dolphin and whale conservation. Most participants felt marine mammal conservation laws and policies were important with a large portion of participants indicating that dolphin and whale species are only slightly protected or are under protected.
An over whelming majority of survey participants felt that whale and dolphin conservation was important; however, similar to previous studies, this study suggests a lack of awareness of the actual conservation status of several high-profile species including the bottlenose dolphin, humpback whale, and killer whale. Additionally, the results suggest there is a lack of public awareness of the conservation status of the “critically endangered” Vaquita porpoise, the “endangered” Northern right whale, and the “endangered” Fin whale. Furthermore, the Vaquita porpoise received more votes than by its alternative common name of [Gulf of] California harbor porpoise suggesting that an alternative name or the use of just one name might make social marketing campaigns more effective. Public concern for the three “fake species” exceeded that of actual species of conservation concern. This study noted a possible public misconception about the whale shark being a cetacean rather than a fish species. This study suggests that support for marine mammal conservation issues does not depend on detailed knowledge of the actual conservation status of cetacean species; however, the lack of connection between public awareness and the conservation status of whales and dolphins is concerning and certainly makes conservation efforts more difficult. Greater outreach to the public about the conservation status of whale and dolphin species is recommended.
Widespread opposition was expressed among most participants toward whaling.
This finding is consistent with the results of other studies, although some research has suggested support for the harvest of whale species in countries that currently participate in whaling. Opposition to whaling in the current study occurred among all demographic groups. It is possible that there is an increased awareness that living cetaceans are a valuable resource such as in countries that have whale-watching activities or increased media attention of marine mammals has increased public appeal (Scott and Parsons, 2005). However, only half the participants indicated they were aware that several countries are still involved in whaling. Increased outreach efforts to the general public by groups dealing with whaling issues may be necessary.
The current study only surveyed a restricted group consisting of individuals over the age of 18 utilizing MTurk. Participation was not exclusive to individuals in the United States even though a majority of participants reported the US as their permanent place of residence. A larger sample size could increase reliability of the results and conducting an in-person survey could reduce inaccuracies in provided demographic and characteristic information. The current study results nevertheless suggest that there is a lack of awareness of the conservation status of certain whale and dolphin species, the existence of the IWC and countries that participate in whaling.
Ethics Statement
The study was reviewed and approved by the George Mason University Human Subjects Review Board.
Author Contributions
WN conducted the survey and analysis and wrote the first draft of the manuscript. EP was WN's MS thesis advisor and devised the idea for the project, helped design the survey, provided methodological and analysis advice, and edited the manuscript and provided additional text.
Conflict of Interest Statement
The authors declare that the research was conducted in the absence of any commercial or financial relationships that could be construed as a potential conflict of interest.
The reviewer MG and handling Editor declared their shared affiliation.
Acknowledgments
WN wishes to thank Bryant Naylor for all his support throughout this project. This paper is from WN's MS research (Denham, 2015).
Supplementary Material
The Supplementary Material for this article can be found online at: https://www.frontiersin.org/article/10.3389/fmars.2018.00153/full#supplementary-material
Footnotes
1. ^Interest in direct experience with animals and the exploration of nature (Thompson and Mintzes, 2002).
2. ^Concern for the environment as a system; for inter-relationships between wildlife species and natural habitats (Thompson and Mintzes, 2002).
References
Ajzen, I., and Fishbein, M. (1977). Attitude-behavior relations: a theoretical analysis and review of empirical research. Psychol. Bull. 84, 888–918. doi: 10.1037/0033-2909.84.5.888
Andrews, D., Nonnecke, B., and Preece, J. (2003). Electronic survey methodology: a case study in reaching hard-to-involve Internet users. Int. J. Hum. Comput. Interact. 16, 185–210. doi: 10.1207/S15327590IJHC1602_04
Bachmann, D., and Elfrink, J. (1996). Tracking the progress of e-email versus snail-mail. Market. Res. 8, 31–35.
Barney, E. C., Mintzes, J. J., and Yen, C.-F. (2005). Assessing knowledge, attitudes and behavior toward charismatic megafauna: the case of dolphins. J. Environ. Educ. 36, 41–55. doi: 10.3200/JOEE.36.2.41-55
Buhrmester, M., Kwang, T., and Gosling, S. (2011). Amazon's Mechanical Turk: a new source of inexpensive, yet high-quality, data? Perspect. Psychol. Sci. 6, 3–5. doi: 10.1177/1745691610393980
Curtin, R., and Presser, S. (2000). The effects of response rate changes on the index of consumer sentiment. Public Opin Q. 64, 413–428.
de Leeuw, E. D. (2012). Counting and measuring online: the quality of internet surveys. Bull. Méthodol. Sociol. 114, 68–78. doi: 10.1177/0759106312437290
Denham, W. (2015). Public Knowledge, Attitudes and Behaviour Towards Dolphins and Dolphin Conservation. Master's thesis, George Mason University, Virginia.
Dillman, D. A., Smyth, J. D., and Christian, L. M. (2009). Mail and Interned Surveys: The Tailored Design Method, 2nd Edn. New York, NY: John Wiley and Sons.
Dillman, D., Tortora, R., and Bowker, D. (1999). Principles for Constructing Web Surveys. Available online at: http://www.researchgate.net/profile/Don_Dillman/publication/2465935_Principles_for_Constructing_Web_Surveys/links/549813cb0cf2519f5a1db6de.pdf (Accessed July 17, 2015)
Eagly, A. H. (1992). Uneven progress: social psychology and the study of attitudes. J. Pers. Soc. Psychol. 63, 693–710. doi: 10.1037/0022-3514.63.5.693
Fahlquist, J. N. (2009). Moral responsibility for environmental problem- individual or institutional. J. Agric. Environ. Ethics 22, 109–124. doi: 10.1007/s10806-008-9134-5
Flamm (2006). Environmental Knowledge, Environmental Attitudes, and Vehicle Ownership and Use. Available online at: http://econpapers.repec.org/paper/cdluctcwp/qt6pv1x9xq.htm (Accessed July 18, 2015).
Freeman, M. M. R., and Kellert, S. R. (1992). Public Attitudes to Whales: Results of a Six-Country Survey. New Haven, CT: School of Forestry and Environmental Studies.
Howard, C., and Parsons, E. C. M. (2006). Attitudes of Scottish city inhabitants to cetacean conservation. Biodivers. Conserv. 15, 4335–4356. doi: 10.1007/s10531-005-3740-6
Karaffa, P. T., Draheim, M. M., and Parsons, E. C. M. (2012). What's in a name? Do species' names impact student support for conservation? Hum. Dimen. Wildlife 17:308–310. doi: 10.1080/10871209.2012.676708
Kellert, S. R. (1976). Perceptions of animals in American society. Trans. North Amer. Wildlife Nat. Resour. Conf. 41, 533–546.
Kellert, S. R. (1985). Public perceptions of predators, particularly the wolf and coyote. Biol. Conserv. 31, 167–189. doi: 10.1016/0006-3207(85)90047-3
Kellert, S. R. (1996). The Value of Life: Biological Diversity and Human Society. Washington, DC: Island Press.
Kellert, S. R. (1999). American Perceptions of Marine Mammals and Their Management. Washington, DC: The Humane Society of the United States.
Kellert, S. R., and Berry, J. K. (1980). Knowledge, Affection and Basic Attitudes towards animals in American Society: Phase III United States Fish and Wildlife Service. Washington, DC: United States Department of Interior.
Kraus, S. J. (1995). Attitudes and the prediction of behavior: a meta-analysis of the empirical literature. Pers. Soc. Psychol. Bull. 21, 58–75. doi: 10.1177/0146167295211007
Llivea, J., Baron, S., and Healey, N. M. (2002). Online surveys in marketing research: pros and cons. Int. J. Mark. Res. 44, 361–367. doi: 10.1177/147078530204400303
Luksenburg, J. A., and Parsons, E. C. M. (2013). Attitudes towards marine mammal conservation issues before the introduction of whale-watching: a case study in Aruba (southern Caribbean). Aquat. Conserv. 24, 135–146. doi: 10.1002/aqc.2348
Moore, D. L., and Tarnai, J. (2002). “Evaluating nonresponse error in mail surveys,” in Survey Nonresponse, eds R. M. Groves, D. A. Dillman, J. L. Eltinge, and R. J. A. Little (New York, NY: John Wiley and Sons), 197–211.
O'Bryhim, J. R., and Parsons, E. C. M. (2015). Increased knowledge about sharks increases public concern about their conservation. Mar. Policy 56, 43–47. doi: 10.1016/j.marpol.2015.02.007
Parsons, E. C. M., and Draheim, M. (2009). A reason not to support whaling - a tourism impact case study from the Dominican Republic. Curr. Issues Tourism 12, 397–403. doi: 10.1080/13683500902730460
Parsons, E. C. M., and Rawles, C. (2003). The resumption of whaling by Iceland and the potential impacts on the Scottish tourism industry. Curr. Issues Tourism 6, 444–448. doi: 10.1080/13683500308667964
Parsons, E. C. M., Rice, J. P., and Sadeghi, L. (2010). Awareness of whale conservation status and whaling policy in the US - a preliminary study on American youth. Anthrozoos 22, 119–127. doi: 10.2752/175303710X12682332909891
Pravin, P. (2000). Whale shark in the Indian coast - need for conservation. Curr. Sci. 79, 310–315. Available online at: http://www.jstor.org/stable/pdf/24103359.pdf
Reeves, R. R., Dawson, S. M., Jefferson, T. A., Karczmarski, L., Laidre, K., O'Corry-Crowe, G., et al. (2013). Cephalorhynchus hectori. The IUCN Red List of Threatened Species. Available online at: http://www.iucnredlist.org/details/4162/0 (accessed August 2, 2015).
Rosenberg, M. J. (1956). Cognitive structure and attitudinal affect. J. Abnorm. Soc. Psychol. 53, 367–372. doi: 10.1037/h0044579
Ross, J., Irani, I., Silberman, M., Zaldivar, A., and Tomlinson, B. (2010). “Who are the crowdworkers?: shifting demographics in Amazon Mechanical Turk,” in Conference on Human Factors in Computing Systems (Atlanta, GA), 2863–2872. doi: 10.1145/1753846.1753873
Scott, N. J., and Parsons, E. C. M. (2004). A survey of public awareness of the occurrence and diversity of cetaceans in south-west Scotland. J. Mar. Biol. Assoc. UK 84, 1101–1104. doi: 10.1017/S0025315404010537h
Scott, N. J., and Parsons, E. C. M. (2005). A survey of public opinion in south-west Scotland on cetacean conservation issues. Aquat. Conserv. 25, 299–312. doi: 10.1002/aqc.662
Sitar-Gonzales, A., and Parsons, E. C. M. (2012). The perceived conservation status of polar bears and penguins. Hum. Dimens. Wildlife 17, 225–227. doi: 10.1080/10871209.2012.654316
Smith, G. (2008). Does Gender Influence Online Survey Participation?: A Record-Linkage Analysis of University Faculty Online Survey Response Behavior. Available online at: http://scholarworks.sjsu.edu/cgi/viewcontent.cgi?article=1003&context=elementary_ed_pub (Accessed July 17, 2015).
Thompson, T. L., and Mintzes, J. J. (2002). Cognitive structure and the affective domain: on knowing and feeling in biology. Int. J. Sci. Educ. 24, 645–660. doi: 10.1080/09500690110110115
Wildlife Trust of India WTI (2013). West Coast Marine Conservation Project- Whale Shark Conservation Project. Available online at: http://www.wti.org.in/projects/whale-shark-conservation-project/ (Accessed Aug 23, 2015).
Keywords: public opinion, dolphin, conservation, cetaceans, public attitudes, public awareness, whaling, public knowledge
Citation: Naylor W and Parsons ECM (2018) An Online Survey of Public Knowledge, Attitudes, and Perceptions Toward Whales and Dolphins, and Their Conservation. Front. Mar. Sci. 5:153. doi: 10.3389/fmars.2018.00153
Received: 17 January 2018; Accepted: 13 April 2018;
Published: 08 May 2018.
Edited by:
Luis Cardona, Universitat de Barcelona, SpainReviewed by:
Danielle Kreb, RASI Conservation Foundation, IndonesiaManel Gazo, Universitat de Barcelona, Spain
Copyright © 2018 Naylor and Parsons. This is an open-access article distributed under the terms of the Creative Commons Attribution License (CC BY). The use, distribution or reproduction in other forums is permitted, provided the original author(s) and the copyright owner are credited and that the original publication in this journal is cited, in accordance with accepted academic practice. No use, distribution or reproduction is permitted which does not comply with these terms.
*Correspondence: E. C. M. Parsons, ecm-parsons@earthlink.net