Changing Sediment Dynamics of a Mature Backbarrier Salt Marsh in Response to Sea-Level Rise and Storm Events
 Mark Schuerch
 Tobias Dolch2,3
  Athanasios T. Vafeidis
- 1Cambridge Coastal Research Unit, Department of Geography, University of Cambridge, Cambridge, United Kingdom
- 2Wadden Sea Station Sylt, Alfred Wegener Institute Helmholtz Centre for Polar and Marine Research, List, Germany
- 3Department of Geography, Christian-Albrechts University of Kiel, Kiel, Germany
Our study analyses the long-term development of a tidal backbarrier salt marsh in the northern German Wadden Sea. The focus lies on the development of the high-lying, inner, mature part of the salt marsh, which shows a striking history of changing sediment dynamics. The analysis of high-resolution old aerial photographs and sampled sediment cores suggests that the mature part of the marsh was shielded by a sand barrier from the open sea for decades. The supply with fine-grained sediments occurred from the marsh inlet through the tidal channels to the inner salt marsh. Radiometric dating (210Pb and 137Cs) reveals that the sedimentation pattern changed fundamentally around the early-mid 1980s when the sedimentation rates increased sharply. By analyzing the photographic evidence, we found that the sand barrier was breached during storm events in the early 1980s. As a result, coarse-grained sediments were brought directly through this overwash from the sea to the mature part of the salt marsh and increased the sedimentation rates. We show that the overwash and the channels created by these storm events built a direct connection to the sea and reduced the distance to the sediment source which promoted salt marsh growth and a supply with coarse-grained sediments. Consequently, the original sediment input from the tidal channels is found to play a minor role in the years following the breach event. The presented study showcases the morphological development of a mature marsh, which contradicts the commonly accepted paradigm of decreasing sedimentation rates with increasing age of the marsh. We argue that similar trends are likely to be observed in other backbarrier marshes, developing in the shelter of unstabilized sand barriers. It further highlights the question of how resilient these salt marshes are toward sea level rise and how extreme storm events interfere in determining the resilience of a mature salt marsh.
Introduction
Salt marshes are coastal ecosystems that are widely distributed in estuarine systems and represent a transition zone between marine and terrestrial environments as they are frequently submerged by sea water during high water levels. They are of high ecological value and among the most productive ecosystems in the world (Bouchard and Lefeuvre, 2000; McLusky and Elliott, 2004). Salt marshes make an important contribution to global biodiversity (Doody, 2008; Schmidt et al., 2012) and play an important role in nutrient cycling and the removal of pollutants from coastal waters (Gribsholt et al., 2005; Struyf et al., 2006; Jacobs et al., 2008). Globally, they are recognized to have a great ability to sequester atmospheric carbon (McLeod et al., 2011; Kirwan and Guntenspergen, 2012) and are considered to be important shoreline stabilizers due to their ability to dissipate hydrodynamic energy (Möller, 2006; Gedan et al., 2011).
Dissipation of currents and wave energy is also essential for the salt marshes themselves with regard to their vertical growth through sediment accretion, especially for mineralogenic marshes. Sediments (mainly sandy or clayey silts) are trapped by the physical structure of the salt marsh vegetation that reduces current velocities and turbulence levels in the water column (Fagherazzi et al., 2012) and prevents resuspension by stabilizing the deposited sediment (Möller, 2006; Neumeier and Amos, 2006; Mudd et al., 2010). The rate of sediment accumulation is important for the vertical growth of salt marshes in order to be able to keep pace with rising sea levels (Orson et al., 1985; Nyman et al., 2006). Other factors that influence accumulation rates are the elevation gradient affecting inundation frequency and duration (Stoddart et al., 1989; Temmerman et al., 2003), the distance to the sediment source, such as tidal creeks or the marsh edge (Esselink et al., 1998; Reed et al., 1999; Bartholdy et al., 2004), the suspended sediment concentration (SSC) of the inundating water (Kirwan et al., 2010; Schuerch et al., 2013), and the micro-topography of the salt marsh (Langlois et al., 2003). Accretion rates generally decrease with the distance from the seaward marsh edge and from the tidal creeks, in parallel with a grain-size fining (Reed et al., 1999; Allen et al., 2006; Marion et al., 2009). This means that the oldest and mature parts of the salt marsh, which are high lying and furthest away from the sediment source, show the lowest accretion rates as they receive the least and finest sediment (Temmerman et al., 2003; Rahman and Plater, 2014).
Accelerated sea level rise is regarded as a severe threat to low elevated coastal zones (IPCC, 2013), and may submerge or erode salt marshes (FitzGerald et al., 2008; Craft et al., 2009; Kirwan and Temmerman, 2009; Stralberg et al., 2011; Spencer et al., 2016a). The availability of sediments is a key factor determining whether salt marshes are likely to be drowned and disappear or vertically grow fast enough and sustain (French, 2006; Kirwan et al., 2010).
Future changes in storm patterns may be another corollary of climate change (IPCC, 2013). The role of storm events is often considered to be crucially important for salt marshes. Storms are primarily responsible for salt marsh erosion and resuspension of deposited sediments (van der Wal and Pye, 2004), but they can also increase sediment delivery to marshes (Reed, 1989; Schuerch et al., 2013) and the fraction of coarser sediments. This can be especially significant when many coarse sediments are delivered to the mature and inner parts of the salt marsh, where they may enhance vertical growth (De Groot et al., 2011; Schuerch et al., 2012). However, mature salt marshes are often argued to be subject to continuously decreasing growth rates as a consequence of reduced inundation frequencies due to higher elevations (French, 1993; Allen, 2000; Bartholdy et al., 2004). Meanwhile, it has been suggested that the levee-basin topography becomes more pronounced and the channel network is reduced with increasing age of the salt marsh (Steel and Pye, 1997; van Maanen et al., 2015). For the later stages of the marsh succession there is, however, very little field and modeling evidence, which makes it difficult to estimate the long-term development of mature salt marshes (Allen, 2000).
The present study investigates the long-term morphological development of the mature part of a salt marsh in the northern Wadden Sea during the last century and analyses the evolution of pathways for sediment delivery and sedimentation rates in the mature salt marsh. In doing so, we aim to improve our understanding of the evolution of mature tidal salt marshes and the driving forces involved. We particularly focus on analyzing sediment deposition and vertical marsh growth in the mature part of this backbarrier marsh (following the classification of Allen, 2000) that, unlike many marshes of this type, is located behind a rather small, dynamic sand barrier and analyze the mechanisms of sediment delivery and how these have changed over time.
Study Area
The study was conducted on the island of Foehr (54° 43′ 00″ N, 8° 30′ 00″ E), located in the northern Wadden Sea (south-eastern coastal North Sea, Germany; Figure 1). The island is almost completely surrounded by tidal flats; the tides are semidiurnal, with a mean tidal range of 205 cm (WSV, 2017). The northern part of the island of Foehr belongs to a 290.2 km2 large tidal basin, the Hoernum tidal basin (Spiegel, 1997).
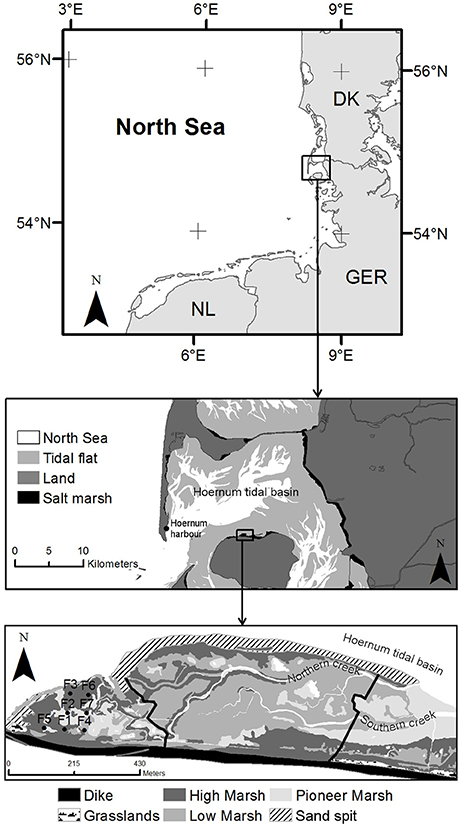
Figure 1. Location of the study area (Oldsumer foreland) along the North Sea coast of Germany. The salt marsh is located in the north of the island of Foehr. Sediment cores (F1 to F7) have been extracted in the western, mature part of the marsh (black dots), southwest of where the overwash breach in the sand spit is located. The vegetation zonation within the study site is aggregated from the TMAP database (Trilateral Monitoring and Assessment Programme, 2007). Vegetation characteristics considerably differ between the western, central, and eastern part of the marsh as defined by the black lines.
The almost round-shaped island of Foehr is entirely embanked. Salt marshes are located in front of the dike (forelands), especially in the north of the island. This study was conducted in a salt marsh named Oldsumer foreland, is located in the north-west of Foehr (54° 45′ 00″ N, 8° 28′ 30″ E). It has a length of 1,460 m (E–W) and a width of 360 m (N–S) and adjoins the dike directly. This salt marsh is characterized by a sand spit with superimposed beach ridges that almost completely encloses and shelters the marsh from prevailing westerly winds and wave wash. The sand spit has an opening in the east connecting the salt marsh with the Hoernum tidal basin (Figure 1). At present, the sand spit appears to be eroding at its north-western front, where a clear overwash breach can be observed (Figure 1).
Water is mainly exchanged through two creeks that enter the salt marsh at the opening in the east and run almost parallel to the course of the dike from east to west (Figure 1). The northern creek has a width of 8 m at the opening and reaches to the very inner, mature part of the salt marsh, while the southern creek measures about 11 m in width at the opening and ends in the central part of the salt marsh.
A clear zonation pattern of the salt marsh vegetation can be observed: the most mature part, predominantly characterized by high marsh vegetation (Artemisia maritima/Festuca rubra type, and Elymus athericus type), is found in the west and has an average elevation of 1.79 m above NHN, while low marsh vegetation (Atriplex portulacoides/Puccinellia maritima type) predominates in the central part (at 1.66 m NHN on average), and young pioneer vegetation (Salicornia spp./Suaeda maritima type, and Spartina anglica type) dominates toward the opening in the east with an average elevation of 1.6 m NHN (Figure 1; Trilateral Monitoring and Assessment Programme, 2007).
This salt marsh was selected as a study site because a long-term data set of high resolution aerial photographs is available revealing the progressive morphological development of the salt marsh, and because it is one of the few natural salt marshes in the Wadden Sea, where the mature part has not been truncated by a dike or seawall. Developed behind a sand barrier that has not yet been artificially stabilized it is representative of other backbarrier salt marshes behind unstabilized sand barriers and dunes. In contrast to most mainland salt marshes, where drainage ditches are abundant, the selected study site is naturally drained except for a series of ditches right at the foot of the dike.
Material and Methods
Aerial Photographs
We used high resolution aerial photographs (ground pixel size ≥1 × 1 m) from six different years (1937, 1958, 1988, 1995, 2003, and 2010) to visually analyze the morphological development of the study site Oldsumer foreland, including the protective sand barrier along the seaward marsh edge. The photographs were provided by the Schleswig-Holstein's Government-Owned Company for Coastal Protection, National Parks and Ocean Protection (LKN-SH) and were all scanned and georeferenced. All images were georeferenced based on a georeferenced digital terrain model, as described below, using fixed reference points behind the seawall (road crossings, pumping station). Estimated errors related to the georeferencing are on average 3.2 m.
To improve the comparability between the different images (greyscale, false color, and true color), we categorized the sand barrier (and its overwash fans) using the fuzzy selection algorithm by Gimp (Version GIMP 2.6.10) with a threshold color range of 15, applied to the composite colors in all six images. Depending on the distinctiveness of the sand barrier, one (image from 1937), two (images from 2003 and 2010) or three (images from 1953 to 1995) iterations of fuzzy color selection were conducted in order to separate the sand barrier (and its overwash fans) from the tidal flats, tidal channels, unvegetated pools, and marsh vegetation in the images.
Water Levels and Suspended Sediment Measurements
The closest official tide gauge, run by the “Wasser- und Schifffahrtsverwaltung” (WSV, 2017), is located in the nearby Hoernum harbor (54°45′29″N/008°17′46″E), 11 km away from the salt marsh opposite of the large inlet into the Hoernum tidal basin Figure 1). Water levels are continuously recorded every minute.
In the marsh, we placed four pressure sensors (Solnist Levellogger Model 3001) to record water levels during a higher-than-normal inundation event, which occurred on 15 March 2014, when the water level exceeded the mean high water level (MHW) by 0.62 m. As indicated in Figure 2, the pressure sensors were located at the seaward border close the overwash breach (LL4), within the main creek entering the mature part of the marsh (LL1) and in the very inner part of the marsh (LL2 and LL3). Raw data readings were corrected for atmospheric pressure variations during the measurement and converted to inundation heights (cm).
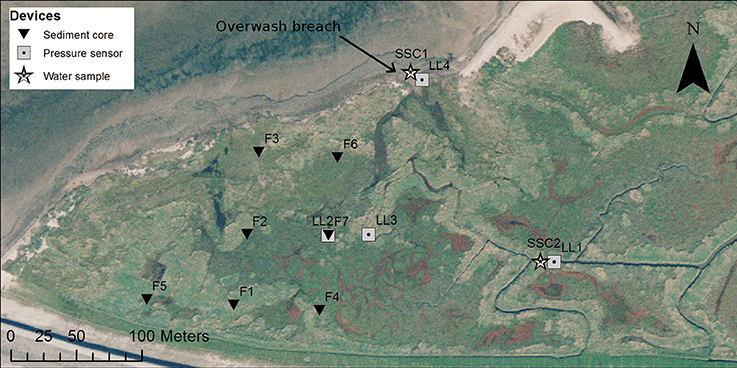
Figure 2. Aerial photograph (from 2010) of the western part of the Oldsumer foreland and locations of sediment cores (F1 to F7), deployed pressure sensors (LL1 to LL4), and water samples collected for analysis of suspended sediment concentrations (SSC1 and SSC2).
Suspended sediment concentrations (SSC) were measured in order to test the hypothesis that SSC in the water inundating the marsh from the tidal creek is lower than SSC in the water entering the marsh through the overwash breach. Water samples of ca. 500 ml each were manually taken from about 10 cm below the water surface close to LL1 (SSC2 in Figure 2) and along the sand spit in vicinity to the overwash breach (SSC1 in Figure 2). Five and seven water samples were collected at the locations SSC1 and SSC2, respectively. In the laboratory, representative subsamples between 295 and 370 ml were analyzed for SSC, using pre-weighed Whatman GF/C glass microfiber filters to analyze the sediment weight (mg) per unit volume (l). After filtration, the filters were cleaned from salt and oven-dried at 105°C for 12 h, before weighing them out. The organic content was determined through loss-on-ignition (%) by combusting the dried sample in a muffle furnace at 550°C for 2 h.
Inundation Modeling
Light detection and ranging (LiDAR) data were used to model the inundation pattern of the Oldsumer foreland for different water levels. The Digital Terrain model (DTM), originating from air-borne surveys between 2005 and 2007, was provided by the State Survey of Schleswig-Holstein, Germany. The horizontal resolution was 1 m with an accuracy of ± 15 cm (1σ), whereas the vertical accuracy was ≤ 7.5 cm (1σ) (Weber, 2008).
Inundation modeling was performed using the bathtub inundation method (Poulter and Halpin, 2008) for water levels between 1 and 3 m above NHN (NHN = Normalhoehennull, which approximates mean sea level) to assess above which water level the Oldsumer foreland floods through the overwash breach (in addition to the water entering through the main tidal channel).
The modeled inundation pattern was verified by field observations during a field survey on 15 March 2014, when the water level at the tide gauge in Hoernum harbor (Figure 1) reached a maximum height of 165 cm NHN at 13:33. The observed inundation pattern was manually recorded by walking around the inundated area, while regularly recording GPS coordinates using a handheld GPS. Despite the low accuracy of this method, it allowed for a rough estimate of the inundation extent and, most importantly, the hydrological connectivity of the marsh, including the small, potentially hidden creeks within the marsh's creek network.
Core Sample Collection and Preparation
Seven marsh cores were collected on 22 January 2009 in order to reconstruct the sedimentation history (F1 to F7, Figure 2). PVC tubes with an inner diameter of 11.8 cm were used. Sampling took place in the western, more mature part of the Oldsumer foreland. Core lengths ranged between 34 and 56 cm, averaging 49.4 cm. Core compaction during sampling was measured while extruding the core from the tube and found to range between 0 and 2 cm over the whole core. After extraction, the cores were sliced into layers of 1–5 cm in thickness with increasing thickness in larger depths.
Sediment Characteristics
Grain size analyses were conducted to study the hydrodynamic conditions during the different sedimentation periods. A subsample of all layers of each core were analyzed using a particle size analyzer (Malvern Mastersizer 2000). Beforehand, the samples were treated to remove the organic carbon, using H2O2, and iron, using sodium bicarbonate, sodium citrate and sodium dithionite. Additionally, the total carbon (TC) content was measured using a CN element analyzer (Hekatech).
Sediment bulk density was calculated as a function of water and organic carbon contents, whereas the organic carbon content was assumed to be represented by TC (for further details see Schuerch et al., 2012).
Sediment Dating and Calculation of Deposition Rates
Measurement of the radioisotopes 210Pb and 137Cs were used for sediment dating. Both methods are commonly employed to investigate soil and sediment processes, in particular to assess sedimentation processes (He and Walling, 1996; Goodbred and Kuehl, 1998; Schuerch et al., 2012; Ruiz-Fernández et al., 2016). A low-background coaxial Ge(Li)detector was used to measure supported and unsupported 210Pb as well as 137Cs via gamma ray activity. 226Ra was used as a proxy for the supported 210Pb, whereas the unsupported 210Pb was calculated as the difference between the total and the supported 210Pb activity. Measurements were conducted by the “Laboratory for Radioisotopes” in Goettingen, Germany (for further details see Schuerch et al., 2012).
Based on the resulting unsupported 210Pb profiles (Supplementary Figures 1–6), the constant rate of supply (CRS) dating model (Appleby and Oldfield, 1978, 1983) was employed to derive the age of each sediment layer. The CRS model is suitable for dating sediments at sites with varying sedimentation rates, but assuming no sheet erosion taking place (Appleby and Oldfield, 1983). For the investigated cores, varying sedimentation rates are a reasonable assumption as the sampling stations of the cores are located in the mid to high marsh, only being inundated during storm surges. Due to the presence of a dense vegetation canopy, it can reliably be assumed that no erosion takes place at and around the marsh cores (Fagherazzi et al., 2012). Sediment ages were determined after normalizing the 210Pb inventories by the grain-size effect as suggested by Ackermann et al. (1983).
A time series of sediment deposition rates (kg m−2 yr−1) was derived from the sediment datings by multiplying the thickness of the sediment layer (m) with the corresponding bulk density (kg m−3) and dividing this by the time period (yrs) within which the layer has been deposited. The advantage of using sediment deposition rates rather than marsh accretion rates is that these are independent of sediment autocompaction, a process that has been reported in many salt marshes of the Wadden Sea (Bartholdy et al., 2010; Nolte et al., 2013).
Data on Storm Events/Surges
In the context of this study, we utilized a dataset, presented by Schuerch et al. (2012) to identify storm events. Thereby, storm events are defined as events of storm surges, which in our study area are caused by strong westerly winds (Gaslikova et al., 2012). The German Maritime and Hydrographic Agency (BSH) defines a storm surge as water levels in excess of 1.5 m above the local MHW level. The long-term MHW level at Hoernum harbor is 0.9 m above NHN (Schuerch et al., 2012). Therefore, we consider all events as storm events when the total water level at the nearby tide gauge Hoernum harbor exceeds 2.4 m above NHN.
Results
Visual Analysis of Aerial Photographs
In 1937, the salt marsh had already established in a sheltered location behind a sand spit in front of the sea dike. The salt marsh had a size of about 26.0 ha. The main water exchange of the marsh happened through the well-developed northern creek as the southern creek was hardly developed yet (Figure 3). The agricultural land located behind the dike was drained through an outlet sluice in the dike that was connected to the northern creek. In 1988, parts of this northern creek have been buried and cut off from the original drainage and creek system (Meyercordt, 1992), while another branch of the northern creek increasingly developed in the south of the original channel (Figure 3). Since then, this newly developed southern branch of the creek transports suspended sediment from the inlet to the inner, mature parts of the salt marsh, where it settles as it reaches the salt marsh platform. While during the considered period (1937–1988) the northern creek has become more pronounced, the southern creek has excelled this development. Appearing for the first time in 1958, it has become a major contributor to the marsh with a water exchange volume that seems to have increased proportionally more than the volume of the northern creek.
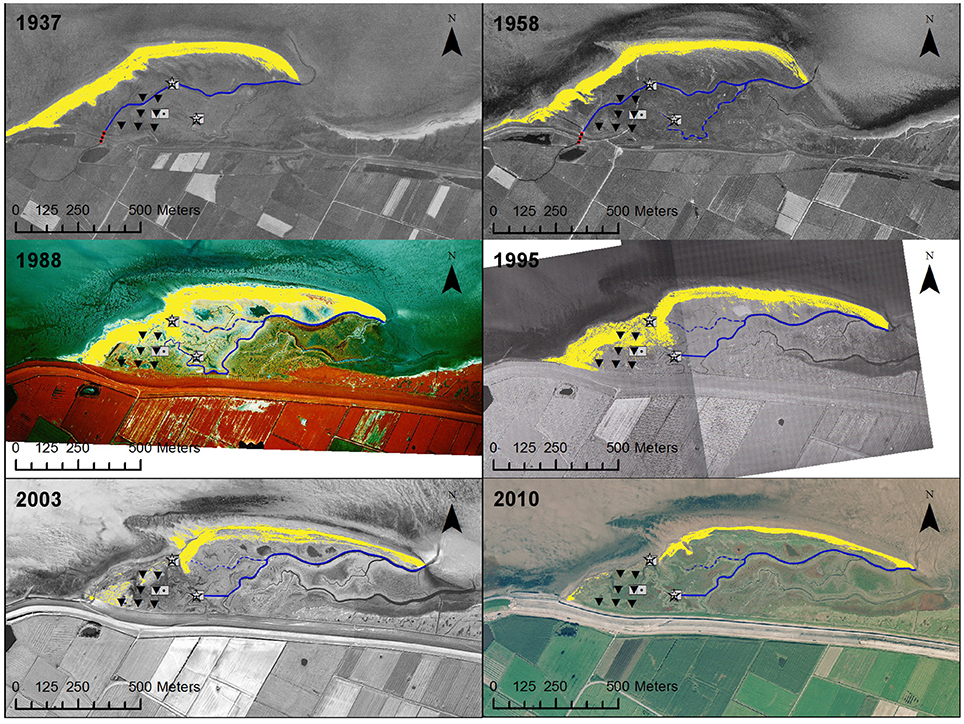
Figure 3. Aerial photographs showing changes in the Oldsumer foreland and outer sand spit (in yellow) from 1937 to 2010. Triangles indicate the sampling locations as described in Figure 2. The squares and stars indicate the locations of the pressure sensors and the SSC measurements, respectively, as displayed in Figure 2. In 1937 and 1958 the outlet sluice in the dike is indicated as a red-dashed line, whereas the (dashed) blue lines indicate the observed shift of the northern creek system following the dissection of the original branch of the creek system during the overwash event.
Between 1937 and 2010, the whole salt marsh showed a continued eastward expansion of 34%, related to a steady elongation/migration of the sand spit, which in 1937 was directly connected to the dike (Figure 3), relatively wide (50–60 m) and clearly developed. In 2010, the sand spit still stretched over a distance of 1,100 m from west to east, but got disconnected from the dike and had a width of only 18–22 m. Meanwhile, the north-western front has been eroded and vegetation has been colonizing the sand spit since 1995. Distinct signs of erosion at the north-western front of the sand spit first become apparent in the aerial photograph from 1958, whereas in the picture from 1988 an overwash breach can be observed in the formerly continuous sand spit. The resulting overwash fan on the salt marsh is also clearly visible in the 1988 photograph, and not only dissected the original northern creek, but also buried large parts of the salt marsh. The overwash is still very pronounced in 1995, while the area of the overwash fan has been partly revegetated and the breach is gradually closing since then.
Nevertheless, the remainings of the overwash breach are still visible in the form of a topographic depression and a creek entering the marsh along the north-western front (Figure 4).
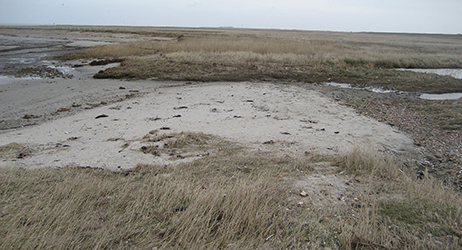
Figure 4. Photograph of the overwash breach, taken on 15 March 2014 (by Julian Bisgwa).
Water Level Observations During Tidal Inundation
The current MHW level at Hoernum harbor (2001–2010) is 1.03 m (NHN) (Ministerium für Energiewende, Landwirtschaft, Umwelt und ländliche Räume des Landes Schleswig-Holstein, 2013). During the field survey, on 15 March 2014, the maximum water level reached a height of 1.65 m (NHN) at 13:33, thereby exceeding this MHW level by 62 cm. Four pressure sensors placed at different locations in the salt marsh recorded water levels during this tidal inundation. Pressure sensor LL1, located in the northern creek is characterized by a fast rising tide with a maximum inundation height of 0.89 m at about 14:32 and a slightly longer, slower falling tide. The sensors LL2 and LL3, placed in smaller branches of the northern creek, show maximum inundation heights of 0.14 and 0.17 m with a delay of 57 min (LL2) and 21 min (LL3) respectively compared to LL1 (Figure 5). It can also be observed that the tide rises fast and falls slow, which is especially true for LL2.
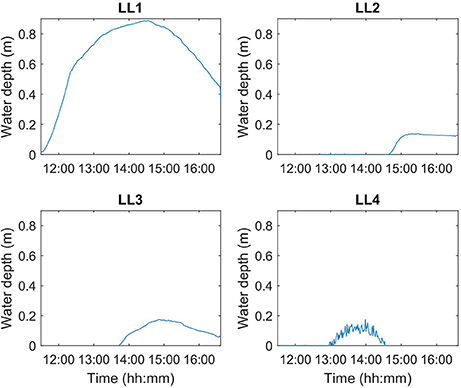
Figure 5. Measured inundation heights (m) on 15 March 2014 for the sites as indicated in Figure 2. Heights (m) are derived from the pressure sensor measurements, corrected for variations in atmospheric pressure.
The water level measured at the overwash breach (LL4) shows that the breach was inundated for about 93 min with a maximum inundation height of 0.17 m at 13:59 and a much larger variability in water levels than in other locations, due to the stronger wave activity. The water inflow into the salt marsh via the overwash breach therefore happened before the inner marsh sites (LL2 and LL3) were inundated.
Tidal Inundation Pattern of Marsh Platform on 15 March 2014
On 15 March 2014, the study site was affected by the south-western sector of a low pressure system over southern Scandinavia1. A strong westerly wind of 8 m/s on average, gusting up to 24 m s−1 (Deutscher Wetterdienst Data, 2016) induced a maximum water level set up of 62 cm above the MHW level at the tide gauge in the Hoernum harbor.
Most parts of the investigated marsh were inundated, whereas the observed inundation pattern is very similar to the inundation pattern produced by the bathtub modeling approach on the basis of the LiDAR-derived DTM. The modeled inundation area is, however, smaller than the recorded inundation, confirming that the DTM cannot fully resolve the marsh's tidal creek network.
Both the modeled and measured inundation pattern show an inflow of water through the overwash breach at the measuring station LL4 (SSC1), but no inflow of water into the interior of the marsh platform (Figure 6). This is in accordance with the pressure sensor measurements on the marsh platform (LL2 and LL3) peaking later than the pressure sensor measurements in the overwash breach (LL4) (Figure 5).
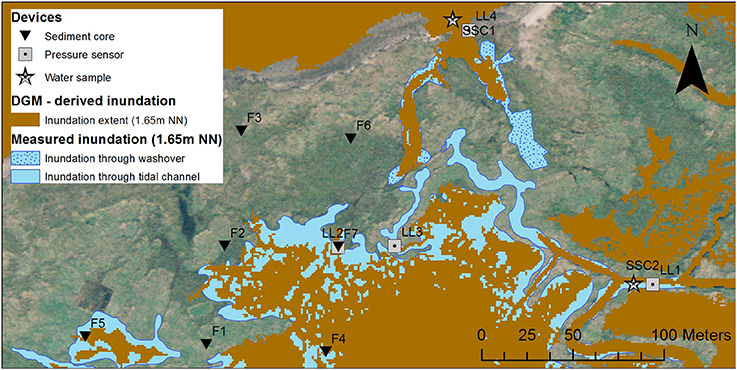
Figure 6. Map of inundated marsh areas on 15 March 2014 (blue and blue dotted areas). Blue areas indicate flooding through the tidal channel system. Blue-dotted areas indicate flooding through the overwash breach. Brown-colored areas indicated the inundation pattern derived from the Digital Elevation Model (DGM), assuming an inundation height of 1.65 m (NHN).
Presumably, another 5–15 cm of water level set-up would lead to an inflow of water through the overwash breach into the interior of the marsh, which would most likely modify the inundation patterns considerably and change the characteristics of the water and the sediments flooding the inner marsh.
Sediment Cores
Sediment Age and Deposition Rates
The 210Pb isotope analysis was conducted for all cores, except for core F3, where sediments were too coarse. Sandy sediments are not suitable of radioisotope analysis as their lower specific surface area, compared to mud and clay particles, results in undetectable 210Pb activities. The ages of the measured marsh sediment range from 1892 to 2010 (Figure 7A). The longest reconstruction of marsh growth is presented for core F2, followed by the cores F1 and F7. As a general pattern, we recognize a slow growth of the marsh in early years and an acceleration of growth in recent decades. When comparing the marsh growth to the development of the local mean sea level (MSL), we find that the marsh appears to keep pace with the rising sea levels (Figure 7A).
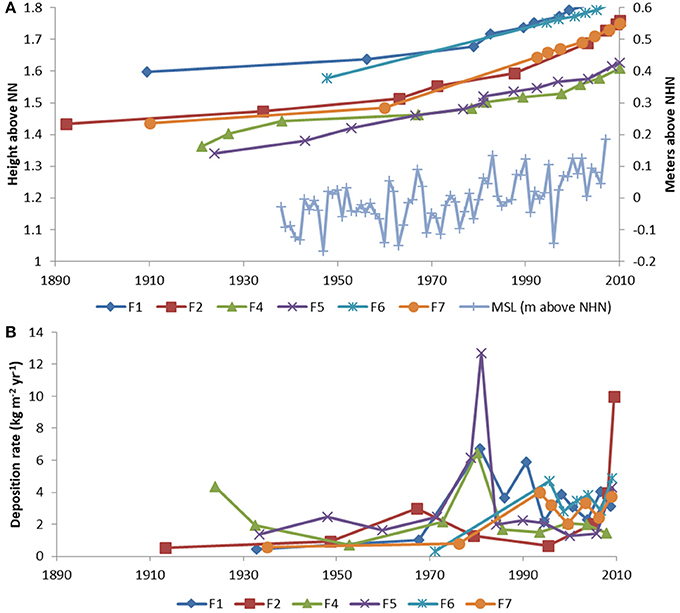
Figure 7. (A) Historic evolution of the marsh surface elevation (m above NHN) from 1890 to 2010 for the cores F1, F2, F4, F5, F6, F7 in comparison to the annual average of the mean sea level in Hoernum harbor. (B) Time series of sediment deposition rates within the same time period.
Visual analysis of marsh growth and deposition data suggests a regime shift around 1980. Until about 1980, all cores except F4, indicate a continuously slow growth with comparable sediment deposition rates between 0.5 and 5 kg m−2 yr−1 (Figure 7B). F4 grows faster from 1929 to 1940 and remains rather constant until about 1980. After 1980, sediment deposition rates significantly increase in F1and F7 (p < 0.001), whereas no significant increase is observed in the cores F2 (p = 0.31), F4 (p = 0.91) and F5 (p = 0.88). F6 only has one value prior to 1980, which is much lower than the mean after 1980. For the normally distributed cores F1, F2 and F7 a heteroscedastic t-test was used and for the non-normally distributed cores F4 and F5, the non-parametric Wilcoxon-test was used. Meanwhile, around 1980 deposition rates in the cores F1, F3, and F5 show a distinct peak, which does not apply for the cores F2, F6, and F7, although it has to be considered that the respective data points may just be missing in cores F6 and F7.
Apart from the peak in deposition rates around 1980, the deposition rate in the cores F1, F6, and F7 also seem to peak during the early 1990s. It is noteworthy that the deposition rates during the peak periods may exceed average deposition rates by up to a factor of six.
The activity profiles of 137Cs were used to validate the deposition dates derived from the CRS dating model (using the 210Pb activities). 137Cs activities in the area are known to build two distinct marker horizons, corresponding to the peak period of the nuclear bomb tests in 1963 and to the nuclear accident in Chernobyl in 1986. Due to the thick sand layer in the cores F6 and F7, neither of the two 137Cs markers could be found, whereas the 1986 marker could not be found in F2. Generally, the 137Cs dates are no more than 7 years apart from the 210Pb-derived year of deposition except for the 1963 peak in core F4, which located the sediment deposited in 1963 much lower than the 210Pb dating method (Table 1).
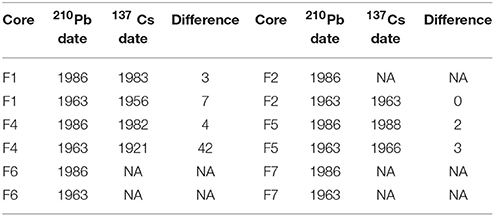
Table 1. Comparison between 210Pb and 137Cs dates for the cores displayed in Figure 7.
Grain Size Composition
Except for core F3 all cores are composed of sand, silt and clay in different proportions. Meanwhile F3 is only composed of the sand fraction in depths below 2 cm (Supplementary Figure 5). Apart from core F3, in all cores grain size composition in the upper 10 cm is very similar with about 10% clay, 70% silt and 20% sand (Supplementary Figure 7). There is a clear increase in the proportion of sand in depths between 10 and 30 cm in all cores. In the cores F6 and F7, this sand layer is particularly pronounced as sand compromises 90 to 100% of the sediment, while the sand contents in F1, F4, and F5 only reach up to 50% (Supplementary Figure 7). F6 and F7 do not only have the highest sand content but also show the coarsest median grain sizes (Table 2). The sediment compositions below 30 cm vary between the cores, but no spatial pattern can be recognized (Supplementary Figure 7).
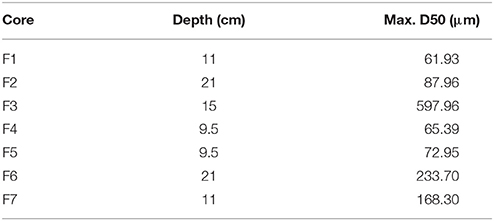
Table 2. Depth and median grain sizes of the sandy layer, where it is most pronounced.
When applying the above sediment ages to the respective layers, we find that the time periods of increased sandiness range from 1980 to 2000 in the cores F1, F4, and F5 and from 1970–2000 in core F2. Meanwhile, the identification of the sandy peak is much more difficult in the cores F6 and F7, since they are dominated by sand in depths below 10 cm (Supplementary Figure 7).
Suspended Sediment Concentrations (SSC)
The SSC measurements during the inundation event on 15 March 2014 show higher values at the overwash breach (SSC1) in comparison to the levels measured within the northern creek that supplies the marsh with sediment during regular inundation events. At both sites SSC appears to be higher during flood tide than during ebb tide, suggesting sediment deposition on the marsh platform during the inundation event (Figure 9). Meanwhile the reduction in SSC after high water (HW) at SSC1 (HW at 13:59) is more pronounced than at SSC2 (HW at 14:32). Furthermore, we find the organic content of the sediment samples increases with lower SSC, and it is generally higher within the creek system than at the overwash breach (Figure 9).
Discussion
Storm Induced Changes in the Sediment Dynamics of a Mature Salt Marsh
The investigated salt marsh represents a coastal setting, which is dominated by a longshore sediment drift (eastward) that triggered the formation and migration of a sand spit in front of the sea dike and allowed the salt marsh to establish in the enclosed area behind the spit (Ehlers, 1988). As such the investigated system is sensitive to changes in storm patterns. Our analysis revealed the storm associated processes that act on the morphological development of this salt marsh. It shows that the development and eastward expansion of the sand spit inhibited the direct delivery of sediment over the sand spit until one or several storms breached the sand barrier and allowed for a direct inflow of sediment through the overwash breach. Not only the direct sand input from the breach event, but also the longer term modification of the tidal creek network, caused increased sedimentation in the oldest part of the salt marsh, contradicting the widely accepted paradigm of decreasing sedimentation rates of aging salt marshes (French, 1993; Allen, 2000).
This significant overwash event as first observed in 1988 covered large parts of the marsh with sand and created a breach into the sand spit that enabled a direct water exchange between the Hoernum tidal basin and the inner mature part of the salt marsh. Because of the greater sediment load of the water inundating the marsh and the shorter distance between the sediment source and the inner marsh, sedimentation has significantly increased in parts of the mature salt marsh after the overwash event (French and Spencer, 1993; Christiansen et al., 2000; Temmerman et al., 2003; van Proosdij et al., 2006).
The breaching event must have occurred between 1958 and 1988, although we assume that the event occurred only a few years before the 1988 photograph was taken, since parts of the previous creek system (in particular the major creek in the northern part of the marsh) are still visible and intact and the notch in the sand spit created by the overwash event is still visible and not straightened by the longshore sediment drift yet. The assumption that the overwash event occurred during the early/mid 1980s is further supported by the storm surge data of Schuerch et al. (2012), who found a considerably increased storm frequency during the early 1980s and the early 1990s. These data show that 1984 was the year with the second highest frequency of storm surge events (10 storms with water levels exceeding 2.4 m NHN in Hoernum) since 1938, while 1990 was the year with the most storm events (11 storms). Additionally, our grain size data suggests that the deposition of the sand layer from the overwash event and the sand input during the following years started in the early 1980s (Figure 8).
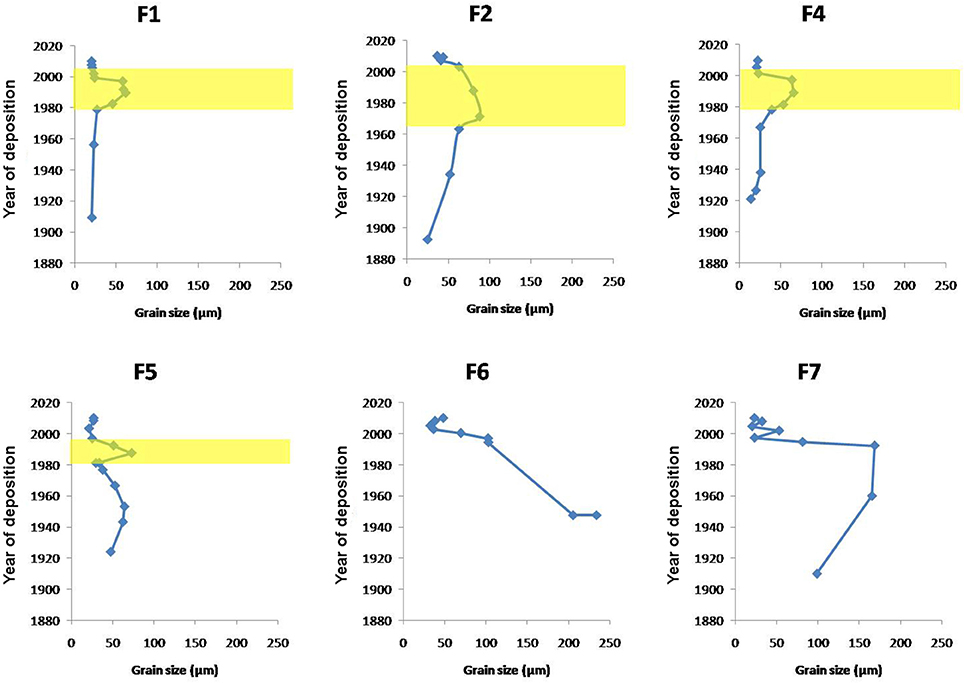
Figure 8. Median grain sizes (μm) of the sediment in the cores F1, F2, F4, F5, F6, F7 plotted against the respective age of the sediment layer. Distinct coarse grained zones within the cores are indicated by horizontal yellow bars. Due to the lack of fine sediments below 2 cm, no datings are available for core F3.
In the years directly following the overwash event, parts of the additionally imported sediment likely originated from the breached sand spit directly and the following reworking of the overwash fan. In the cores F1, F4, and F5, which are located further away from the overwash fan and in a 12–24 cm lower elevation (Figure 2), this leads to a period of distinctively higher deposition rates (up to six times the average deposition rates in core F5) between 1980 and 2000 and a well-defined sand layer, but no significant long-term effect on deposition rates could be observed in cores F4 and F5 (Figure 7B). Due to their lower elevation, these are regularly inundated during normal conditions, making the absence of increased deposition relatively less important compared to the higher located core locations, which are inundated during storm water levels only. However, following the actual event sediment deposition rates in the cores F1, F6, and F7 remained about five times higher compared to pre-overwash rates, even when the direct sand input decreased, suggesting the increased sediment deposition to be a result of the changes in the creek network.
After 1995, the overwash fan appears to be recolonized by marsh vegetation, whereas the sand spit along the north-western edge of the marsh has disappeared almost completely. Moreover, a new creek system is establishing with its origin at the former overwash breach. Our inundation modeling suggests that at present, the inner part of the marsh is supplied with sediment from the northern creek system as long as the water level is lower than ca. 1.7 m above NHN. During higher surge events, the inner marsh additionally receives water and sediment through the overwash breach and the young creek system, which, as we show, is characterized by a much higher SSC (factor of 10 during the measured inundation event) compared to the water within the main tidal channel entering from the east (Figure 9). The increased SSC within the overwash breach is likely related to wave-induced sediment resuspension, triggered by the considerable wave setup as observed along the seaward side of the sand spit, represented by the large variability in water levels (Figure 5: LL4).
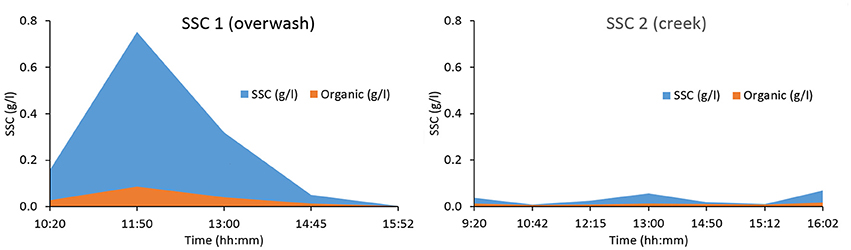
Figure 9. Suspended sediment concentrations and organic matter content during the inundation event on 15 March 2014 for the site located within the overwash breach (SSC1) and within the northern creek (SSC2).
Future Development of the Salt Marsh
At present, the Wadden Sea area is experiencing a relatively calm period with respect to storm activity and storm surges (Schuerch et al., 2012). This enables the overwash breach to be closed through the dominant eastward alongshore sediment transport reducing the number of events that overtop the breach and flood the mature marsh through the newly built creek system. Until the next overwash event, the mature salt marsh may therefore experience a further reduction in sediment supply and decreasing sedimentation rates. In some cores (F2, F3, F7) we observe an ongoing reduction in the grain size of the deposited material (Supplementary Figure 7), indicating continuously decreasing hydrodynamic energy conditions during sediment deposition (Rahman and Plater, 2014). These locations are increasingly supplied with fine sediment that is brought through the tidal creek during regular inundation events and decreasingly through the overwash breach.
Even though the sand spit currently seems to rebuild, future rising sea levels may exert an additional pressure on the system, and future storms could well reopen the overwash breach or breach the sand spit at another location. The observed changing magnitude and the spatial pattern of marsh sedimentation goes along with the dissection of the existing tidal creek system and with a fragmentation of the mature salt marsh, including the formation of unvegetated tidal pools. In addition, the overwash breach appears to make the marsh more vulnerable to lateral and channel erosion as the marsh is more exposed to extreme storm events that may follow the event creating the overwash breach. Increased lateral erosion of the sand spit and the salt marsh behind has already been observed during the storm period in the 1980s and 1990s, resulting in the retreat of the sand spit by more than 100 m between 1958 and 1995. In recent years, the reduced storm activity has led to the recolonization of the overwash sediments and the enforcement of the sand spit, hence protecting the marsh against lateral erosion during storm events (Spencer et al., 2016b).
Validity of the Observed Processes for Other Marsh Systems
The investigated marsh system can be categorized as a natural open coast backbarrier marsh (Allen, 2000), which developed in front of a seawall due to the prevailing longshore sediment transport. Unlike other backbarrier marshes in the Wadden Sea, where tidal creeks are often aligned across-shore, regularly spaced between each other, our system is dominated by only two alongshore-oriented tidal creeks that supply the marsh with sediment and grow with the continued eastward expansion of the system. Furthermore, it is located behind a sand spit that has not yet been artificially stabilized as many other sand barriers and dunes on inhabited barrier islands (e.g., the neighboring Sylt).
Storm activity has also been shown to enhance the ability of a neighboring salt marsh in the southern part of Sylt to adapt to sea level rise, where Schuerch et al. (2012) identified a direct link between increased storm activities and marsh sedimentation rates. It is argued that increased sediment resuspension during storm events rather than the input of overwash sediments is responsible for the immediate increase in sedimentation during storm periods (Schuerch et al., 2013; Mariotti and Carr, 2014). No such direct link between the strength and/or the frequency of storm events and the sedimentation rates and/or the marsh stratigraphy could be established within this system (Schuerch, unpublished data), as the storm related sediment input is rather controlled by the morphological changes of the sand spit and the associated changes in the salt marsh. As such our study site represents a natural system, such as for example found in the eastern parts of some of the East Frisian Wadden Sea islands (e.g., Wangerooge, Spiekeroog) or in parts of the barrier island system along the US east coast (e.g., Brigantine, Virgina barrier islands), where overwash breaches and the processes outlined in our study may still occur (Walters et al., 2014).
Our data highlight the importance of overwash processes, which are typical for all backbarrier marshes behind unstabilized sand barriers and dunes and show that a single overwash event may dissect the previous tidal creek system and modify the sources of sediment supply for the mature salt marsh in the long term. In fact, our data suggest that the current paradigm of reduced sediment availability and vertical marsh growth with age is not necessarily valid for this type of backbarrier marshes, where overwash events may sporadically occur. Similarly, De Groot et al. (2011) detected overwash channels on backbarrier salt marshes on three islands within the Dutch and the Danish Wadden Sea and highlight their importance as a significant source of sediment for salt marsh. De Groot et al. (2011), however, claim that the overall contribution of overwash sediments toward the total sedimentation on the salt marsh is negligible, whereas our data suggests that the indirect effects of the overwash event and the following creation of a new tidal channel system may substantially increase the amount and the spatial variability of the sedimentation in vicinity of the overwash breach.
It should be noted that the derivation of historic marsh dating and sediment deposition rates is related with uncertainties, originating from the background radiation toward the low energy gamma-ray spectrum, where 210Pb activity is measured (46.6 keV). Errors associated to the dating of the sediment layers typically are about ±5 years, which makes it unsuitable for the calculation of very recent sediment dynamics (Schuerch et al., 2012). Validation of 210Pb dating is therefore performed using the independent marker horizons of the radioisotope 137Cs, attributed to the distinct deposition events in the years 1963 and 1986 (Schuerch et al., 2012).
Only one or none of the two 137Cs peaks could be identified in three of our cores (F2, F6, and F7), either due to a gap in the dataset (F2) or due the thick sand layer within the core (F6 and F7), which reduces the specific surface area of the sediment particles, thus 137Cs (and 210Pb) concentrations may decrease below the detection limit (He and Walling, 1996). The reduced radiometric activity within the overwash sediment may therefore limit our ability to capture the direct contribution of the overwash event to the overall sediment deposition in the cores closest to the overwash breach (F6 and F7). In core F4, the 137Cs peak was found but in a much lower depth than the 210Pb is suggesting, possible due to its mobilization and downward transport into the soil column.
Broader Implications of our Findings
Coastal salt marshes in the German Wadden Sea are an essential part of the State's coastal protection strategy, particularly marshes located in front of seawalls (Hofstede, 2003). Our research on the Oldsumer Foreland suggests that vertical sedimentation on the marsh surface is keeping up with sea level rise, in particular due to the storm-induced breach of the sand spit in the early 1980s. The observed process, leading to an increased resilience of the mature salt marsh, is directly related to the presence of an unstabilized sand barrier, which on the one hand protects the salt marsh from lateral erosion by effectively reducing hydrodynamic energy and on the other a hand facilitates vertical marsh growth through overwash breaches.
With respect to storm-induced sediment deposition, the backbarrier salt marshes on most inhabited and well developed barrier islands (as well as most other salt marshes directly exposed to the tidal flat and the open sea, including the salt marshes along the mainland in the Wadden Sea) will respond more directly to storm-induced sediment deposition (Schuerch et al., 2012) and their elevation trajectory will rather follow the traditional paradigm of reduced sedimentation rates with increasing age. In the context of the Wadden Sea, where the salt marshes in front of dikes along the mainland (mainland forelands) generally show higher sedimentation rates than the salt marshes located behind the barrier islands due to their artificial drainage systems (Bakker et al., 1993; Dijkema, 1997), we argue that the stabilization of the dunes on the barrier islands may be one of the contributing factors for this difference.
Our data suggest that enhancing natural dynamics in coastal salt marshes situated behind sand barriers, such as sand spits and beach ridges or dune systems may increase the marsh's adaptive capacity to global sea level rise by increasing the sediment deposition rates in response to extreme storm events. Barrier breaching and overwash processes thereby play a key role, but the morphological responses to storm events differ from open coast marshes in that the sediment deposition rates are not directly linked to individual storm events. Rather, they respond to significant morphological changes following a (series of) extreme event(s). Such extreme events were shown to be able to modify the sedimentary regime and thereby increase the sediment deposition rates of the salt marsh for decades following the actual event.
Conclusions
i) Sedimentation rates on backbarrier marshes do not necessarily follow the commonly accepted paradigm of decreasing sedimentation rates with increasing age of the marsh.
ii) Overwash events may dissect the existing tidal creek system of a backbarrier marsh and result in significantly increased sediment deposition rates in the mature part of the marsh. With the following recovery of the sand barrier, the sediment deposition rates will eventually be reduced to their pre-overwash rates.
iii) While facilitating increased vertical marsh growth, overwash events also destabilize the sand spit, which protects the marsh against lateral erosion and therefore increase the vulnerability of the marsh toward lateral erosion.
Author Contributions
MS and AV: planned and designed the research; MS, TD, and JB: performed the field work and the laboratory analysis; MS, TD, and JB: conducted the data analysis; MS, TB, and AV: contributed in the manuscript writing. All authors reviewed the manuscript.
Funding
This study was financially supported by the Deutsche Forschungsgemeinschaft (DFG) through the Cluster of Excellence 80 The Future Ocean, funded within the framework of the Excellence Initiative on behalf of the German federal and state governments, and the personal research fellowship of Mark Schuerch (Project Number 272052902).
Conflict of Interest Statement
The authors declare that the research was conducted in the absence of any commercial or financial relationships that could be construed as a potential conflict of interest.
Acknowledgments
Wiebke Schulz is gratefully acknowledged for her support in the data work. We also thank the laboratory technicians of the Department of Geography in Kiel, Ms. Berger, and Ms. Bock for their support with the laboratory analysis.
Supplementary Material
The Supplementary Material for this article can be found online at: https://www.frontiersin.org/articles/10.3389/fmars.2018.00155/full#supplementary-material
Footnotes
1. ^http://www.wetterzentrale.de/reanalysis.php?jaar=2014&maand=3&dag=15&uur=000&var=1&map=1&model=avn, 24.03.2017.
References
Ackermann, F., Bergmann, H., and Schleichert, U. (1983). Monitoring of heavy metals in coastal and estuarine sediments - a question of grain-size: <20 μm versus >60 μm. Environ. Technol. Lett. 4, 317–328. doi: 10.1080/09593338309384212
Allen, J. R. L. (2000). Morphodynamics of holocene salt marshes: a review sketch from the Atlantic and Southern North Sea coasts of Europe. Quat. Sci. Rev. 19, 1155–1231. doi: 10.1016/S0277-3791(99)00034-7
Allen, J. R. L., Haslett, S. K., and Rinkel, B. E. (2006). Holocene tidal palaeochannels, Severn Estuary levels, UK: a search for granulometric and foraminiferal criteria. Proc. Geol. Assoc. 117, 329–344. doi: 10.1016/S0016-7878(06)80042-8
Appleby, P. G., and Oldfield, F. (1978). The calculation of lead-210 dates assuming a constant rate of supply of unsupported 210Pb to the sediment. Catena 5, 1–8. doi: 10.1016/S0341-8162(78)80002-2
Appleby, P. G., and Oldfield, F. (1983). The assessment of 210Pb data from sites with varying sediment accumulation rates. Hydrobiologia 103, 29–35. doi: 10.1007/BF00028424
Bakker, J. P., de Leeuw, J., Dijkema, K. S., Leendertse, P. C., Prins, H. H. T., and Rozema, J. (1993). Salt marshes along the coast of The Netherlands. Hydrobiologia 265:73. doi: 10.1007/BF00007263
Bartholdy, J., Christiansen, C., and Kunzendorf, H. (2004). Long term variations in backbarrier salt marsh deposition on the Skallingen peninsula - the Danish Wadden Sea. Mar. Geol. 203, 1–21. doi: 10.1016/S0025-3227(03)00337-2
Bartholdy, J., Pedersen, J. B. T., and Bartholdy, A. T. (2010). Autocompaction of shallow silty salt marsh clay. Sediment. Geol. 223, 310–319. doi: 10.1016/j.sedgeo.2009.11.016
Bouchard, V., and Lefeuvre, J. C. (2000). Primary production and macro-detritus dynamics in a European salt marsh: carbon and nitrogen budgets. Aquat. Bot. 67, 23–42. doi: 10.1016/S0304-3770(99)00086-8
Christiansen, T., Wiberg, P. L., and Milligan, T. G. (2000). Flow and sediment transport on a tidal salt marsh surface. Estuar. Coast. Shelf Sci. 50, 315–331. doi: 10.1006/ecss.2000.0548
Craft, C., Clough, J., Ehman, J., Joye, S., Park, R., Pennings, S., et al. (2009). Forecasting the effects of accelerated sea-level rise on tidal marsh ecosystem services. Front. Ecol. Environ. 7, 73–78. doi: 10.1890/070219
De Groot, A. V., Veeneklaas, R. M., and Bakker, J. P. (2011). Sand in the salt marsh: contribution of high-energy conditions to salt-marsh accretion. Mar. Geol. 282, 240–254. doi: 10.1016/j.margeo.2011.03.002
Dijkema, K. S. (1997). Impact prognosis for salt marshes from subsidence by gas extraction in the Wadden Sea. J. Coastal Res. 13, 1294–1304.
Deutscher Wetterdienst Data (2016). Historical Daily Station Observations (Temperature, Pressure, Precipitation, Wind, Sunshine Duration, etc.) for Germany. Climate Data Center. Available online at: https://www.dwd.de/EN/climate_environment/cdc/cdc_node.html
Esselink, P., Dijkema, K. S., Reents, S., and Hageman, G. (1998). Vertical accretion and profile changes in abandoned man-made tidal marshes in the Dollard estuary, the Netherlands. J. Coastal Res. 14, 570–582.
Fagherazzi, S., Kirwan, M. L., Mudd, S. M., Guntenspergen, G. R., Temmerman, S., D'Alpaos, A., et al. (2012). Numerical models of salt marsh evolution: Ecological, geomorphic, and climatic factors. Rev. Geophys. 50:RG1002. doi: 10.1029/2011RG000359
FitzGerald, D. M., Fenster, M. S., Argow, B. A., and Buynevich, I. V. (2008). Coastal impacts due to sea-level rise. Annu. Rev. Earth Planet. Sci. 36, 601–647. doi: 10.1146/annurev.earth.35.031306.140139
French, J. R. (1993). Numerical simulation of vertical marsh growth and adjustment to accelerated sea-level rise, north Norfolk, U.K. Earth Surf. Processes Landforms 81, 63–81. doi: 10.1002/esp.3290180105
French, J. R. (2006). Tidal marsh sedimentation and resilience to environmental change: exploratory modelling of tidal, sea-level and sediment supply forcing in predominantly allochthonous systems. Mar. Geol. 235, 119–136. doi: 10.1016/j.margeo.2006.10.009
French, J. R., and Spencer, T. (1993). Dynamics of sedimentation in a tide-dominated backbarrier salt marsh, Norfolk, UK. Mar. Geol. 110, 315–331. doi: 10.1016/0025-3227(93)90091-9
Gaslikova, L., Grabemann, I., and Groll, N. (2012). Changes in North Sea storm surge conditions for four transient future climate realizations. Nat. Hazards 66, 1501–1518. doi: 10.1007/s11069-012-0279-1
Gedan, K. B., Kirwan, M., Wolanski, E., Barbier, E., and Silliman, B. R. (2011). The present and future role of coastal wetland vegetation in protecting shorelines: answering recent challenges to the paradigm. Clim. Change 106, 7–29. doi: 10.1007/s10584-010-0003-7
Goodbred, S. L., and Kuehl, S. A. (1998). Floodplain processes in the Bengal basin and the storage of Ganges-Brahmaputra river sediment: an accretion study using 137Cs and 210Pb geochronology. Sediment. Geol. 121, 239–258. doi: 10.1016/S0037-0738(98)00082-7
Gribsholt, B., Boschker, H. T. S., Struyf, E., Andersson, M., Tramper, A., De Brabandere, L., et al. (2005). Nitrogen processing in a tidal freshwater marsh: a whole-ecosystem N-15 labeling study. Limnol. Oceanogr. 50, 1945–1959. doi: 10.4319/lo.2005.50.6.1945
He, Q., and Walling, D. E. (1996). Interpreting particle size effects in the adsorption of 137Cs and unsupported 210Pb by mineral soils and sediments. J. Environ. Radioact. 30, 117–137. doi: 10.1016/0265-931X(96)89275-7
Hofstede, J. L. A. (2003). Integrated management of artificially created salt marshes in the Wadden Sea of Schleswig-Holstein, Germany. Wetlands Ecol. Manage. 11, 183–194. doi: 10.1023/A:1024248127037
IPCC (2013). “Summary for Policymakers”, in Climate Change 2013: The Physical Science Basis. Contribution of Working Group I to the Fifth Assessment Report of the Intergovernmental Panel on Climate Change, eds T. F. Stocker, G.-K. Qin, M. Plattner, S. K. Tignor, J. Allen, A. Boschung, A. Nauels, Y. Xia, V. Bex, and P. M. Midgley (Cambridge; New York, NY: Cambridge University Press), 3–29.
Jacobs, S., Struyf, E., Maris, T., and Meire, P. (2008). Spatiotemporal aspects of silica buffering in restored tidal marshes. Estuar. Coast. Shelf Sci. 80, 42–52. doi: 10.1016/j.ecss.2008.07.003
Kirwan, M. L., and Guntenspergen, G. R. (2012). Feedbacks between inundation, root production, and shoot growth in a rapidly submerging brackish marsh. J. Ecol. 100, 764–770. doi: 10.1111/j.1365-2745.2012.01957.x
Kirwan, M. L., Guntenspergen, G. R., D'Alpaos, A., Morris, J. T., Mudd, S. M., and Temmerman, S. (2010). Limits on the adaptability of coastal marshes to rising sea level. Geophys. Res. Lett. 37:L23401. doi: 10.1029/2010GL045489
Kirwan, M., and Temmerman, S. (2009). Coastal marsh response to historical and future sea-level acceleration. Quat. Sci. Rev. 28, 1801–1808. doi: 10.1016/j.quascirev.2009.02.022
Langlois, E., Bonis, A., and Bouzille, J. B. (2003). Sediment and plant dynamics in saltmarshes pioneer zone: Puccinellia maritima as a key species? Estuar. Coast. Shelf Sci. 56, 239–249. doi: 10.1016/S0272-7714(02)00185-3
Marion, C., Anthony, E. J., and Trentesaux, A. (2009). Short-term (<=2 yrs) estuarine mudflat and saltmarsh sedimentation: high-resolution data from ultrasonic altimetery, rod surface-elevation table, and filter traps. Estuar. Coast. Shelf Sci. 83 475–484. doi: 10.1016/j.ecss.2009.03.039
Mariotti, G., and Carr, J. (2014). Dual role of salt marsh retreat: long-term loss and short-term resilience. Water Resour. Res. 50, 2963–2974. doi: 10.1002/2013WR014676
McLeod, E., Chmura, G. L., Bouillon, S., Salm, R., Björk, M., Duarte, C. M., et al. (2011). A blueprint for blue carbon: toward an improved understanding of the role of vegetated coastal habitats in sequestering CO2. Front. Ecol. Environ. 9, 552–560. doi: 10.1890/110004
McLusky, D. S., and Elliott, M. (2004). The Estuarine Ecosystem, Ecology, Threats and Management, 3rd Edn. Cambridge: New York, NY: Oxford University Press.
Meyercordt, J. (1992). Untersuchungen zum Langaehrigen Verlauf von Schwermetalldepositionen in Ausgewaehlten Schleswig-Holsteinischen Salzmarschen auf der Basis von Radionuklidmessungen. Geesthacht: GKSS-Forschungszentrum.
Möller, I. (2006). Quantifying saltmarsh vegetation and its effect on wave height dissipation: results from a UK East coast saltmarsh. Estuar. Coast. Shelf Sci. 69, 337–351. doi: 10.1016/j.ecss.2006.05.003
Mudd, S. M., D'Alpaos, A., and Morris, J. T. (2010). How does vegetation affect sedimentation on tidal marshes? Investigating particle capture and hydrodynamic controls on biologically mediated sedimentation. J. Geophys. Res. Earth Surf. 115:F03029. doi: 10.1029/2009JF001566
Neumeier, U., and Amos, C. L. (2006). The influence of vegetation on turbulence and flow velocities in European salt-marshes. Sedimentology 53, 259–277. doi: 10.1111/j.1365-3091.2006.00772.x
Nolte, S., Müller, F., Schuerch, M., Wanner, A., Esselink, P., Bakker, J. P., et al. (2013). Does livestock grazing affect sediment deposition and accretion rates in salt marshes? Estuar. Coast. Shelf Sci. 135, 296–305. doi: 10.1016/j.ecss.2013.10.026
Nyman, J. A., Walters, R. J., Delaune, R. D., and Patrick, W. H. (2006). Marsh vertical accretion via vegetative growth. Estuar. Coast. Shelf Sci. 69, 370–380. doi: 10.1016/j.ecss.2006.05.041
Orson, R., Panageotou, W., and Leatherman, S. P. (1985). Response of tidal salt marshes of the U.S. Atlantic and Gulf Coasts to rising sea levels. J. Coastal Res. 1, 29–37.
Poulter, B., and Halpin, P. N. (2008). Raster modelling of coastal flooding from sea-level rise. Int. J. Geogr. Inform. Sci. 22, 167–182. doi: 10.1080/13658810701371858
Rahman, R., and Plater, A. J. (2014). Particle-size evidence of estuary evolution: a rapid and diagnostic tool for determining the nature of recent saltmarsh accretion. Geomorphology 213, 139–152. doi: 10.1016/j.geomorph.2014.01.004
Reed, D. J. (1989). Patterns of sediment deposition in subsiding coastal salt marshes, Terrebonne Bay, Louisiana: the role of winter storms. Estuaries 12, 222–227. doi: 10.2307/1351901
Reed, D. J., Spencer, T., Murray, A. L., French, J. R., and Leonard, L. (1999). Marsh surface sediment deposition and the role of tidal creeks: implications for created and managed coastal marshes. J. Coastal Conserv. 5, 81–90. doi: 10.1007/BF02802742
Ruiz-Fernández, A. C., Sanchez-Cabeza, J.-A., Serrato de la Peña, J. L., Perez-Bernal, L. H., Cearreta, A., Flores-Verdugo, F., et al. (2016). Accretion rates in coastal wetlands of the southeastern Gulf of California and their relationship with sea-level rise. Holocene 26, 1126–1137. doi: 10.1177/0959683616632882
Schmidt, J. A., McCleery, R., Seavey, J. R., Cameron Devitt, S. E., and Schmidt, P. M. (2012). Impacts of a half century of sea-level rise and development on an endangered mammal. Glob. Chang. Biol. 18, 3536–3542. doi: 10.1111/gcb.12024
Schuerch, M., Rapaglia, J., Liebetrau, V., Vafeidis, A., and Reise, K. (2012). Salt marsh accretion and storm tide variation: an example from a Barrier Island in the North Sea. Estuaries Coasts 35, 486–500. doi: 10.1007/s12237-011-9461-z
Schuerch, M., Vafeidis, A., Slawig, T., and Temmerman, S. (2013). Modeling the influence of changing storm patterns on the ability of a salt marsh to keep pace with sea level rise. J. Geophys. Res. Earth Surf. 118, 84–96. doi: 10.1029/2012JF002471
Ministerium für Energiewende, Landwirtschaft, Umwelt und ländliche Räume des Landes Schleswig-Holstein. (2013). Generalplan Kuestenschutz. Kiel: MELUR-SH.
Spencer, T., Möller, I., Rupprecht, F., Bouma, T. J., van Wesenbeeck, B. K., Kudella, M., et al. (2016b). Salt marsh surface survives true-to-scale simulated storm surges. Earth Surf. Processes Landforms 41, 543–552. doi: 10.1002/esp.3867
Spencer, T., Schuerch, M., Nicholls, R. J., Hinkel, J., Lincke, D., Vafeidis, A. T., et al. (2016a). Global coastal wetland change under sea-level rise and related stresses: the DIVA Wetland change model. Glob. Planet. Change 139, 15–30. doi: 10.1016/j.gloplacha.2015.12.018
Spiegel, F. (1997). Zur Morphologie der Tidebecken im schleswig-holsteinischen Wattenmeer. Die Kueste 59, 115–142.
Steel, T. J., and Pye, K. (1997). The development of saltmarsh tidal creek networks: evidence from the U.K. Proc. Can. Coastal Conf. 1997, 267–280.
Stoddart, D. R., Reed, D. J., and French, J. R. (1989). Understanding saltmarsh accretion. Scolt Head Island, Norfolk, England. Estuaries 12, 228–236. doi: 10.2307/1351902
Stralberg, D., Brennan, M., Callaway, J. C., Wood, J. K., Schile, L. M., Jongsomjit, D., et al. (2011). Evaluating tidal marsh sustainability in the face of sea-level rise: a hybrid modeling approach applied to San Francisco Bay. PLoS ONE 6:e27388. doi: 10.1371/journal.pone.0027388
Struyf, E., Dausse, A., Van Damme, S., Bal, K., Gribsholt, B., Boschker, H. T. S., et al. (2006). Tidal marshes and biogenic silica recycling at the land-sea interface. Limnol. Oceanogr. 51, 838–846. doi: 10.4319/lo.2006.51.2.0838
Trilateral Monitoring Assessment Programme (2007). Salt Marshes, TMAP. Databases. Available online at: http://www.waddensea-secretariat.org/monitoring-tmap/tmap-databases
Temmerman, S., Govers, G., Wartel, S., and Meire, P. (2003). Spatial and temporal factors controlling short-term sedimentation in a salt and freshwater tidal marsh, Scheldt estuary, Belgium - SW Netherlands. Earth Surf Processes Landforms 28, 739–755. doi: 10.1002/esp.495
van der Wal, D., and Pye, K. (2004). Patterns, rates and possible causes of saltmarsh erosion in the Greater Thames area (UK). Geomorphology 61, 373–391. doi: 10.1016/j.geomorph.2004.02.005
van Maanen, B., Coco, G., and Bryan, K. R. (2015). On the ecogeomorphological feedbacks that control tidal channel network evolution in a sandy mangrove setting. Proc. R. Soc. A 471:201500115. doi: 10.1098/rspa.2015.0115
van Proosdij, D., Davidson-Arnott, R. G. D., and Ollerhead, J. (2006). Controls on spatial patterns of sediment deposition across a macro-tidal salt marsh surface over single tidal cycles. Estuar. Coast. Shelf Sci. 69, 64–86. doi: 10.1016/j.ecss.2006.04.022
Walters, D., Moore, L. J., Duran Vinent, O., Fagherazzi, S., and Mariotti, G. (2014). Interactions between barrier islands and backbarrier marshes affect island system response to sea level rise: insights from a coupled model. J. Geophys. Res. Earth Surf. 119, 2013–2031. doi: 10.1002/2014JF003091
Weber, J. (2008). Laserscandaten zum Aufbau eines DGM2 in Schleswig-Holstein und einige Anwendungsbeispiele. Kiel: Landesvermessungsamt Schleswig-Holstein.
WSV (2017). Wasserstraßen- und Schifffahrtsverwaltung des Bundes. (2017) Stammdaten Pegel Hörnum (Messstellennummer 9570050). Available online at: http://www.pegelonline.wsv.de/gast/stammdaten?pegelnr=9570050
Keywords: tidal salt marsh, Wadden Sea, sediment deposition, overwash, tidal creek, storm activity
Citation: Schuerch M, Dolch T, Bisgwa J and Vafeidis AT (2018) Changing Sediment Dynamics of a Mature Backbarrier Salt Marsh in Response to Sea-Level Rise and Storm Events. Front. Mar. Sci. 5:155. doi: 10.3389/fmars.2018.00155
Received: 04 December 2017; Accepted: 13 April 2018;
Published: 03 May 2018.
Edited by:
Mario Barletta, Departamento de Oceanografia da Universidade Federal de Pernambuco (UFPE), BrazilReviewed by:
Christian Joshua Sanders, Southern Cross University, AustraliaPedro De Souza Pereira, Department of Geoscience of Federal University of Santa Catarina State, Florianópolis, Brazil
Copyright © 2018 Schuerch, Dolch, Bisgwa and Vafeidis. This is an open-access article distributed under the terms of the Creative Commons Attribution License (CC BY). The use, distribution or reproduction in other forums is permitted, provided the original author(s) and the copyright owner are credited and that the original publication in this journal is cited, in accordance with accepted academic practice. No use, distribution or reproduction is permitted which does not comply with these terms.
*Correspondence: Mark Schuerch, ms2358@cam.ac.uk