Predicting Optimal Sites for Ecosystem Restoration Using Stacked-Species Distribution Modeling
 Amanda J. Zellmer1*
  Jeremy T. Claisse1,2
  Chelsea M. Williams1,2
  Stuart Schwab3
  Daniel J. Pondella II1
- 1Department of Biology, Vantuna Research Group, Occidental College, Los Angeles, CA, United States
- 2Department of Biological Sciences, California State Polytechnic University, Pomona, Pomona, CA, United States
- 3Department of Evolution, Ecology and Organismal Biology, University of California, Riverside, Riverside, CA, United States
Habitat restoration is an important tool for managing degraded ecosystems, yet the success of restoration projects depends in part on adequately identifying preferred sites for restoration. Species distribution modeling using a machine learning approach provides novel tools for mapping areas of interest for restoration projects. Here we use stacked-species distribution models (s-SDMs) to identify candidate locations for installment of manmade reefs, a useful management tool for restoring structural habitat complexity and the associated biota in marine ecosystems. We created species distribution models for 21 species of commercial, recreational, ecological, or conservation importance within the Southern California Bight based on observations from long-term reef surveys combined with high resolution (200 m × 200 m) geospatial environmental data layers. We then combined the individual species models to create a stacked-species habitat suitability map, identifying over 800 km2 of potential area for reef restoration within the Bight. When considering only the 21 focal species, s-SDM scores were positively associated with observed bootstrap species richness not only on natural reefs (linear model: slope = 0.27, 95% CI = 0.17–0.36, w = 1), but also this result was supported by two independent test datasets. The predicted richness from this linear model was associated with observed species richness when considering only the focal species on manmade reefs (linear model: slope = 0.52, 95% CI = 0.13–0.92, w = 1) and also when considering 204 other non-focal species on both natural and manmade reefs in southern California (slope = 3.65, 95% CI = 2.93–4.37, w = 1). Finally, our results demonstrate that the existing manmade reefs included in our study on average are located in regions with habitat suitability that is not only less suitable than natural reefs (t-value = –5.4; p < 0.05), but also only slightly significantly better than random (p < 0.05), demonstrating a need for more biologically informed placement of manmade reefs. The stacked-species distribution model provides insight for marine restoration projects in southern California specifically, but more generally this method can also be widely applied to other types of habitat restoration including both marine and terrestrial.
Introduction
Increasing habitat loss and degradation worldwide threatens many of the world’s species (Foley et al., 2005), resulting in population declines (Bender et al., 1998), loss of genetic diversity (Sih et al., 2000), and even species extinctions (Barnosky et al., 2011). Habitat restoration is an important tool for managing degraded ecosystems (Polak and Saltz, 2011), in an effort to restore and prevent species loss (Pavlik, 1996). Yet, habitat restoration initiatives are not always successful (Fischer and Lindenmayer, 2000; Godefroid et al., 2011). One key factor that influences the success of habitat restoration projects is the quality of sites chosen for management (Bottin et al., 2007). For example, manmade habitat structures can fail when placed in areas with non-ideal environmental conditions (e.g., Frissell and Nawa, 1992). To prevent such failures, it is crucial that we develop and test methods for identifying candidate sites for habitat restoration.
Species distribution modeling (a.k.a. ecological or environmental niche modeling) has been proposed as tool for identifying sites for habitat restoration (Pearce and Lindenmayer, 1998) and is increasingly being utilized for this purpose (Rodríguez et al., 2007). Using observation data in conjunction with spatially gridded environmental data, species distribution modeling identifies environmental predictors of species occurrence, creating a model that is then projected across the landscape to identify other areas of suitable habitat (Elith and Leathwick, 2009; Elith et al., 2011). Species Distribution Models (SDMs) have been used to predict optimal sites for restoration for a wide variety of species, including plants (Yang et al., 2013) and animals (Pearce and Lindenmayer, 1998; Wilson et al., 2011). Yet, while many of these efforts focus on single keystone or focal species (e.g., Pearce and Lindenmayer, 1998; Wilson et al., 2011; Yang et al., 2013), for some degraded habitats, restoration is needed for entire communities (Palmer et al., 1997). Stacked-SDMs, where SDMs are first created for individual species and then combined, provide an opportunity to identify suitable habitat across multiple species. Stacked-SDMs have been used for studying spatial patterns of environmental suitability across a range of taxa (Dubuis et al., 2011; Guisan and Rahbek, 2011; Hof et al., 2012; Calabrese et al., 2014; Hof and Svahlin, 2016; da Mata et al., 2017).
Here we implement stacked-SDMs (s-SDMs) to predict optimal locations for the placement of manmade reefs to restore habitat for shallow rocky reef-associated marine fish, invertebrate, and algal communities. To conduct this research, we take advantage of long-term reef survey datasets (Caselle et al., 2015; Pondella et al., 2015a; Zahn et al., 2016) to build SDMs for the entire extent of rocky reefs within the Southern California Bight (SCB). The rocky reefs of the SCB are a habitat of particular interest because this region is on par with some of the most highly productive ecosystems in the world (Hubbs, 1960; Horn and Allen, 1978; Pondella et al., 2005; Horn et al., 2006). Here, cool waters of the California current from the north meet with warm waters from the south to create a set of unique environmental conditions that support a wide variety of marine species (Horn and Allen, 1978; Bograd and Lynn, 2003; Pondella et al., 2005; Horn et al., 2006; Hamilton et al., 2010). Naturally occurring hard substrates make up the base of rocky reef habitats from which wide ranging giant kelp forests (Macrocystis pyrifera) grow, providing extensive habitat for many marine fish, invertebrate, and algal species (Graham, 2004; Stephens et al., 2006). Yet at the same time, this productive ecosystem is located next to one of the world’s largest megacities, Los Angeles (Nicholls, 1995). As a result, there is intense anthropogenic pressure exerted on this critical ecosystem, including overfishing (Love, 2006; Zellmer et al., 2018), habitat modification due to landslides (Kayen et al., 2002) or development (Ambrose, 1994), and pollution (Schaffner et al., 2015).
Manmade (artificial) reefs have long been used as a successful option for restoration of marine ecosystems (Bohnsack and Sutherland, 1985; Bohnsack et al., 1994). Many hard substrates create manmade reefs, from purposefully designed quarry rock structures to breakwalls, pier pilings, and even sunken shipwrecks (Morris et al., 2018). When standardized, comparisons with natural reefs suggest that manmade reefs can sustain similar levels of species richness and abundance (Carr and Hixon, 1997; Pondella et al., 2002, 2006). Further, some of the best manmade reefs, for example tall quarry rock reefs with high rugosity and steel oil platform structures with extensive spatial coverage, even show evidence of sustaining higher productivity than natural reefs (DeMartini et al., 1994; Johnson et al., 1994; Claisse et al., 2014; Granneman and Steele, 2014; Pondella et al., 2015b). By using environmental data and SDMs to select preferred sites for placement of such manmade reefs, it may be possible to further optimize restoration efforts.
Yet, creating species distribution models for manmade reef restoration poses some unique challenges. Species distribution modeling has been used to study a number of marine ecosystems (Brodie et al., 2018) and for the conservation of marine species (Robinson et al., 2017), including for habitat restoration. For example, Adams et al. (2016) created SDMs for eelgrass restoration. However, rocky reef ecosystems differ from systems like eelgrass communities as they require specific habitat structures that are largely independent of environmental conditions – rocky infrastructure can and is built in many different places (e.g., manmade reefs, breakwalls, jetties; Morris et al., 2018) – and themselves are not constrained by environmental conditions. Further, such projects are time consuming and costly, requiring a significant amount of planning, collaboration, and management. Thus, it is necessary to establish an approach for identifying preferred candidate sites for rocky reef infrastructure by modeling environmental constraints of species found inhabiting these reefs.
To investigate the utility of SDMs for optimizing the placement of manmade reefs, we created individual-SDMs for 21 species and combined them to create stacked-SDMs to identify hotspots for habitat suitability across multiple species. We validate this approach for identifying candidate sites for habitat restoration by assessing whether the s-SDM values for reefs are positively associated with observed richness of the 21 focal species from reef surveys on already established manmade reefs as well as for an independent dataset of non-focal species that includes 204 fish, invertebrate, and algal species on all surveyed reefs. If SDMs provide an accurate tool for identifying candidate sites, then we would expect multi-species habitat suitability from the s-SDM to increase with observed richness of established manmade reefs.
Materials and Methods
Species Distribution Modeling
To determine optimal habitat for each of the focal species, we utilized species distribution modeling using a machine learning approach in the program MaxEnt (Phillips et al., 2006a). This approach allows us to develop a model of habitat suitability for each species based on the environment in places where each species has been observed (Elith and Leathwick, 2009). We can then project that model over all other locations to identify additional suitable habitat. To construct SDMs, we first collated observation data for each of the focal species and downloaded and created spatial environmental data layers.
Observation Data
We initially chose 39 fish, invertebrate, and algal species for this analysis that are targeted commercial or recreational species (CDFG, 2001) or of particular ecological concern for the SCB (Supplementary Table S1), including representative fish (e.g., Rockfish, Sebastes sp.), invertebrate (e.g., Red sea urchin, Mesocentrotus franciscanus), and algal species (e.g., Giant kelp, Macrocystis pyrifera). Spatial locality information was collected for each of the focal species from long-term monitoring surveys from the Vantuna Research Group (VRG; Pondella et al., 2015a; Zahn et al., 2016), Channel Islands National Park Kelp Forest Monitoring Program (KFM; Kushner et al., 2013), and the Partnership for the Interdisciplinary Studies of Coastal Oceans (PISCO; Hamilton et al., 2010; Caselle et al., 2015; Pondella et al., 2015a). These observations were made from transect surveys on rocky reefs across the entire SCB at 296 sites during 35 years from 1982–2017 (Kushner et al., 2013; Caselle et al., 2015; Pondella et al., 2015a; Zahn et al., 2016). In short, divers conducted subtidal surveys up to 30 m deep with a depth-stratified random sampling design at each site in which randomly located transects were sampled using four methods: (1) fish density and size distribution are recorded along 30 m belt transects on the reef, in the midwater and in the top section of the water column if kelp canopy is present, (2) density of large (>2.5 cm) motile invertebrates and macroalgae recorded along 30 m “Swath” transects, (3) percent cover of sessile invertebrates, turf algae, and habitat characteristics are estimated using uniform point contact along 30 m transects on the reef and (4) size frequency data for commercially and ecologically important invertebrates (Kushner et al., 2013; Caselle et al., 2015; Pondella et al., 2015a; Zahn et al., 2016). We used only presence and absence data from these surveys.
We divided the dataset into localities from natural rocky reefs (578 sites) and manmade reefs (38 sites). The natural reef data were split into training and test data (described below), whereas the manmade reef data were used only for validating the models. To prevent spatial bias, we used spatial thinning to remove points within 1km of one another. Spatial thinning was completed using the “spThin” R package (Aiello-Lammens et al., 2015). Only species with at least 30 unique observed localities on natural reefs greater than 1km apart were included in subsequent analyses. The SDM method used in this study, MaxEnt (described below), is less sensitive to small sample sizes (10–30) than other distribution modeling methods available, although caution should still be taken in interpreting models with the smallest sample sizes (Wisz et al., 2008). Preliminary analyses of species with fewer than 30 unique observations resulted in SDMs with low support. Of the initial 39 focal species, 21 had at least 30 unique observed locations at least 1 km apart (Table 1). These 21 species included 16 fish, six invertebrates, and one algal species.
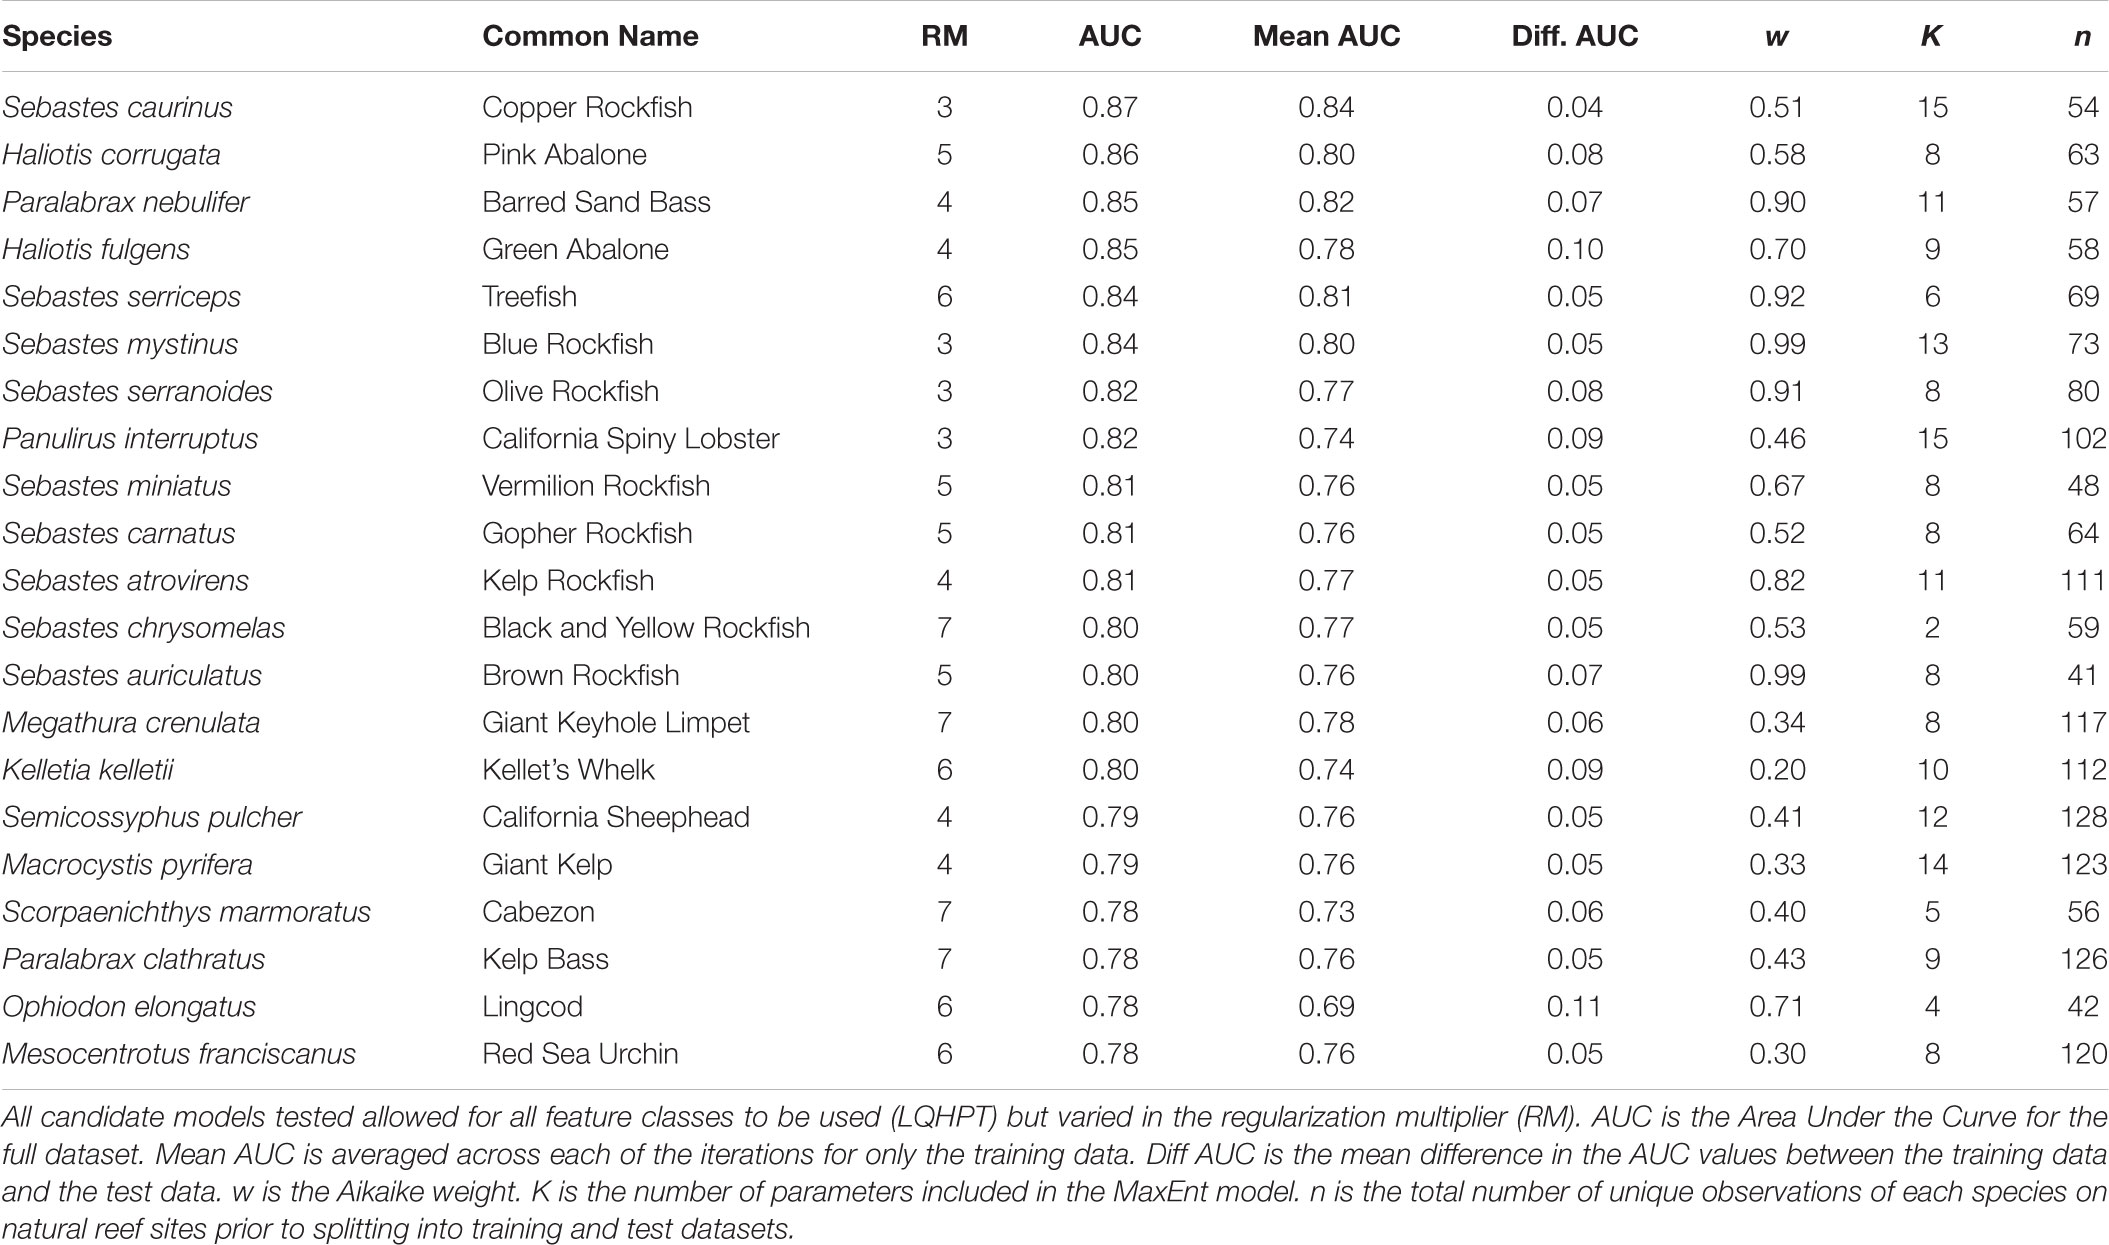
Table 1. Best fit MaxEnt model selected for each of the 21 focal species.
Environmental Data
Spatially gridded environmental data was collected for the entire SCB. We used six environmental variables at a resolution of 200 m2, including: aspect, bathymetry, mean annual Chlorophyll-A (ChlA), distance to the 200 m isobath (a proxy for upwelling potential), slope, and mean annual sea surface temperature (SST). For bathymetry, we used a seafloor bathymetry digital elevation model (DEM) which is a product of the California Department of Fish and Wildlife Bathymetry Project. This coastwide 200 by 200 m DEM was clipped to the extent of the Southern California Bight. Seafloor aspect and slope were derived from the bathymetry DEM using the Aspect and Slope tools in ArcMap 10.3. We collated data from MODIS-derived sea surface temperature (SST; degrees Celsius) and Chlorophyll-A (ChlA; mg⋅m-3) from the University of California San Diego, Scripps Institution of Oceanography Photobiology Group1. The raw data consists of 15 day averages throughout the California Current Large Marine Ecosystem. We took the mean of each year from 2002–2017 and then took the grand mean of all years. Both SST and ChlA were down-sampled in R using the bilinear method. All data layers were projected to the WGS 1984 UTM Zone 11N coordinate system to limit distortion. We masked each of the environmental layers using the 45 m isobath contour to restrict all analyses to only cells with average depths shallower than or equal to 45 m, since all reef survey observation data is limited to this region. We tested for correlations among each of the environmental variables at each of the unique locations from the thinned dataset using Pearson Correlation Coefficient. None of the 15 pairwise comparisons of the six environmental variables were highly correlated at observed focal species localities, with |r|≤ 0.5 for all.
Reef presence across the SCB was identified based on a composite of hard-bottom substrate and historical kelp canopy cover (Williams et al., unpublished; Zellmer et al., 2018). We created a second stack of environmental data layers with all variables masked by reef presence. This masked raster stack was used to build individual-SDMs on current established reefs and then the full raster stack was used to project the individual-SDMs across the remaining area in order to identify candidate sites for restoration in the SCB.
Individual-SDMs
Individual SDMs were developed for each species using MaxEnt v. 3.4.1, a presence-only machine learning approach to modeling species distributions (Phillips et al., 2006b) called through the R programming language (R Core Team, 2015). MaxEnt includes two options, feature classes and a regularization multiplier, to customize models and control overparameterization. Feature classes are a transformation of the environmental variables to enable modeling of complex relationships and include linear, product, hinge, threshold, and quadratic (Elith et al., 2010), whereas the regularization multiplier adds a penalty for overparameterization (Elith et al., 2010; Shcheglovitova and Anderson, 2013). By default, MaxEnt allows all feature classes to be selected in training the model and uses a regularization multiplier of one as determined by optimization from empirical studies across a variety of species (Phillips and Dudík, 2008). However, these parameters need to be optimized for each species to prevent overly simplified or overly complex models (Radosavljevic and Anderson, 2014; Morales et al., 2017). Thus, we utilized a model selection approach to compare models based on the corrected Akaike information criterion (AICc) approach for SDMs developed by Warren and Seifert (2011) and implemented in the “ENMeval” R package (Muscarella et al., 2014). For each species, we tested a set of 12 candidate models each with a different regularization multiplier (1–12, increasing by one) and allowed all feature classes in each model. We used the “block” method for model evaluation to account for spatial autocorrelation. This approach divides the data into four spatial blocks. The model is then run four times with three blocks set as training data and one block set as test data for each iteration and evaluation metrics are then summed across the iterations (Muscarella et al., 2014).
Models were evaluated first by comparing the mean Receiver Operating Characteristic Area Under the Curve (AUC) for the training data to the test data. This value measures the true positive rate to the false positive rate at varying thresholds for classifying habitat suitability. AUC values close to one indicate good fit of the model to the data whereas an AUC value of 0.5 indicates the model is no better than random. Comparing the AUC values for the training to test data allows us to validate how well the models fit an independent dataset, thus smaller differences in the training and test data AUCs indicate better transferability. In addition, we calculated AICc scores to compare the 12 candidate models for each species, allowing us to evaluate the fit of each model while accounting for the number of parameters in each model. The model with the lowest AICc score was considered a best model of the candidate models (Burnham and Anderson, 2002) and was used for subsequent analyses. To identify suitable habitat for reef restoration, the best-fit model was then projected across the entire study area using the complementary log-log link (cloglog) function, which is more appropriate for estimating probability of presence than the previous MaxEnt default, a logistic transformation (Phillips et al., 2017).
Stacked-SDMs
To create a model for predicting preferred locations for manmade reefs that optimizes suitability across most of our focal species, we constructed a stacked-species distribution model (s-SDM) by combining each of the individual-SDMs. To do this, we simply added together each of the individual-SDMs as derived by Calabrese et al. (2014). We selected this approach as opposed to combining thresholded binary habitat suitability classification, since combining thresholds has been shown to result in biased s-SDMs (Calabrese et al., 2014).
S-SDM and Species Richness
To assess the quality of the SDMs for identifying high quality habitat for restoration, we evaluated the extent to which the s-SDM is associated with species richness. We calculated observed species richness at each reef site and tested for a positive linear relationship with the s-SDM score for each reef site using linear regression. We performed this analysis first at all of the natural reef sites for the 21 focal species and then used the linear regression to predict species richness at already established manmade reef sites (test dataset 1) and at all reef sites for 204 other non-focal fish, invertebrate, and algal species (test dataset 2).
Species richness was calculated using only the VRG reef survey data (Pondella et al., 2015a; Zahn et al., 2016) to ensure standardized sampling. To quantify species richness, we estimated species richness using the R “vegan” package using the bootstrap estimator, since sites were surveyed an uneven number of times. We calculated bootstrap species richness for all fish and swath (algae and invertebrate) surveys separately then added the estimates together for each site. We used linear regression to statistically evaluate the relationship between observed bootstrap species richness and s-SDM scores. We include two covariates in the model to account for variation in quality of individual reef sites, depth zone and standard deviation (SD) of reef relief. Depth zone describes the different depths at which a reef was surveyed: inner (∼5 m), middle (∼10 m), outer (∼15 m) and deep (∼25 m). Reef relief was measured at 31 points along each survey transect and a higher standard deviation of these relief measurements indicates greater fine scale habitat heterogeneity. The linear regression was evaluated using AICc by comparing to a null model with SD relief and depth zone alone. The linear model was then used to calculate predicted species richness at manmade reef sites. Observed versus predicted bootstrap richness at manmade reef sites was evaluated using linear regression and AICc by comparing to a null model. In addition, we tested whether predicted values from the linear model were correlated with observed bootstrap richness for the 204 other non-focal fish, algae, and invertebrate species surveyed at all reef sites. This additional independent dataset allows us to test not only the validity of the model but also whether the focal species list is sufficient to predict restoration sites for the reef-associated communities or if only applicable to the species included in the model.
Identifying Candidate Restoration Sites
To identify candidate sites for reef restoration, we isolated regions where there is high predicted habitat suitability across multiple species but no existing reefs using the reef data layer. High predicted habitat suitability was defined as the s-SDM score at or above which the linear model predicts species richness as equal to half the number of focal species. We calculated the proportion of cells with an s-SDM score above this threshold for the entire study region as well as for only cells outside of existing reef areas. Cells outside of existing reef areas with greater than the s-SDM threshold are considered candidate regions for installation of manmade reefs, whereas cells within existing reef areas with greater than the s-SDM threshold are considered candidate regions for restoration or rehabilitation of existing reef habitat.
Existing Manmade Reef Quality Assessment
We further assessed the predicted habitat suitability of already established manmade reef sites in the SCB to determine the current quality of restored habitats. We extracted s-SDM scores for all manmade reefs in our study region (n = 21) and for all natural reef survey sites (n = 250) and calculated the mean for both. We compared mean s-SDM scores for manmade and natural reef sites with a t-test. We then conducted a permutation analysis by randomly sampling sites across the study region (n = 21) and calculating the mean value of the s-SDM at those sites iterated 1000 times. We then compared the mean s-SDM value of the manmade sites as well as the mean s-SDM value of the natural sites to the distribution to quantify significance. As habitat restoration may be limited to areas where reefs do not currently exist and therefore random selection of sites may be artificially biased as being more suitable, we recalculated the null distribution from only areas in the SCB where there is no existing reef habitat and reran the analyses.
Results
Individual-SDMs
For each species, we selected the best fit model (ΔAIC = 0) from the 12 candidate models with varying values for the regularization multiplier (Supplementary Figures S1–S21). Based on mean AUC values for the test data, all models predicted test observations well (mean AUC range: 0.69–0.84; Table 1) and were not overfit (difference between training and test AUC range: 0.04–0.11; Table 1). The optimal regularization multiplier selected for each species was higher than the default value in MaxEnt (1) and ranged from 3–7 (Table 1). Of the nine environmental predictors, Slope (52%), Distance to 200m (22.6%), and Bathymetry (8.7%) on average contributed the most to each of the individual-SDMs (Figure 1). This pattern was consistent among fish and algae species, although for invertebrate species, Distance to 200 m contributed more on average than Slope (Figure 1).
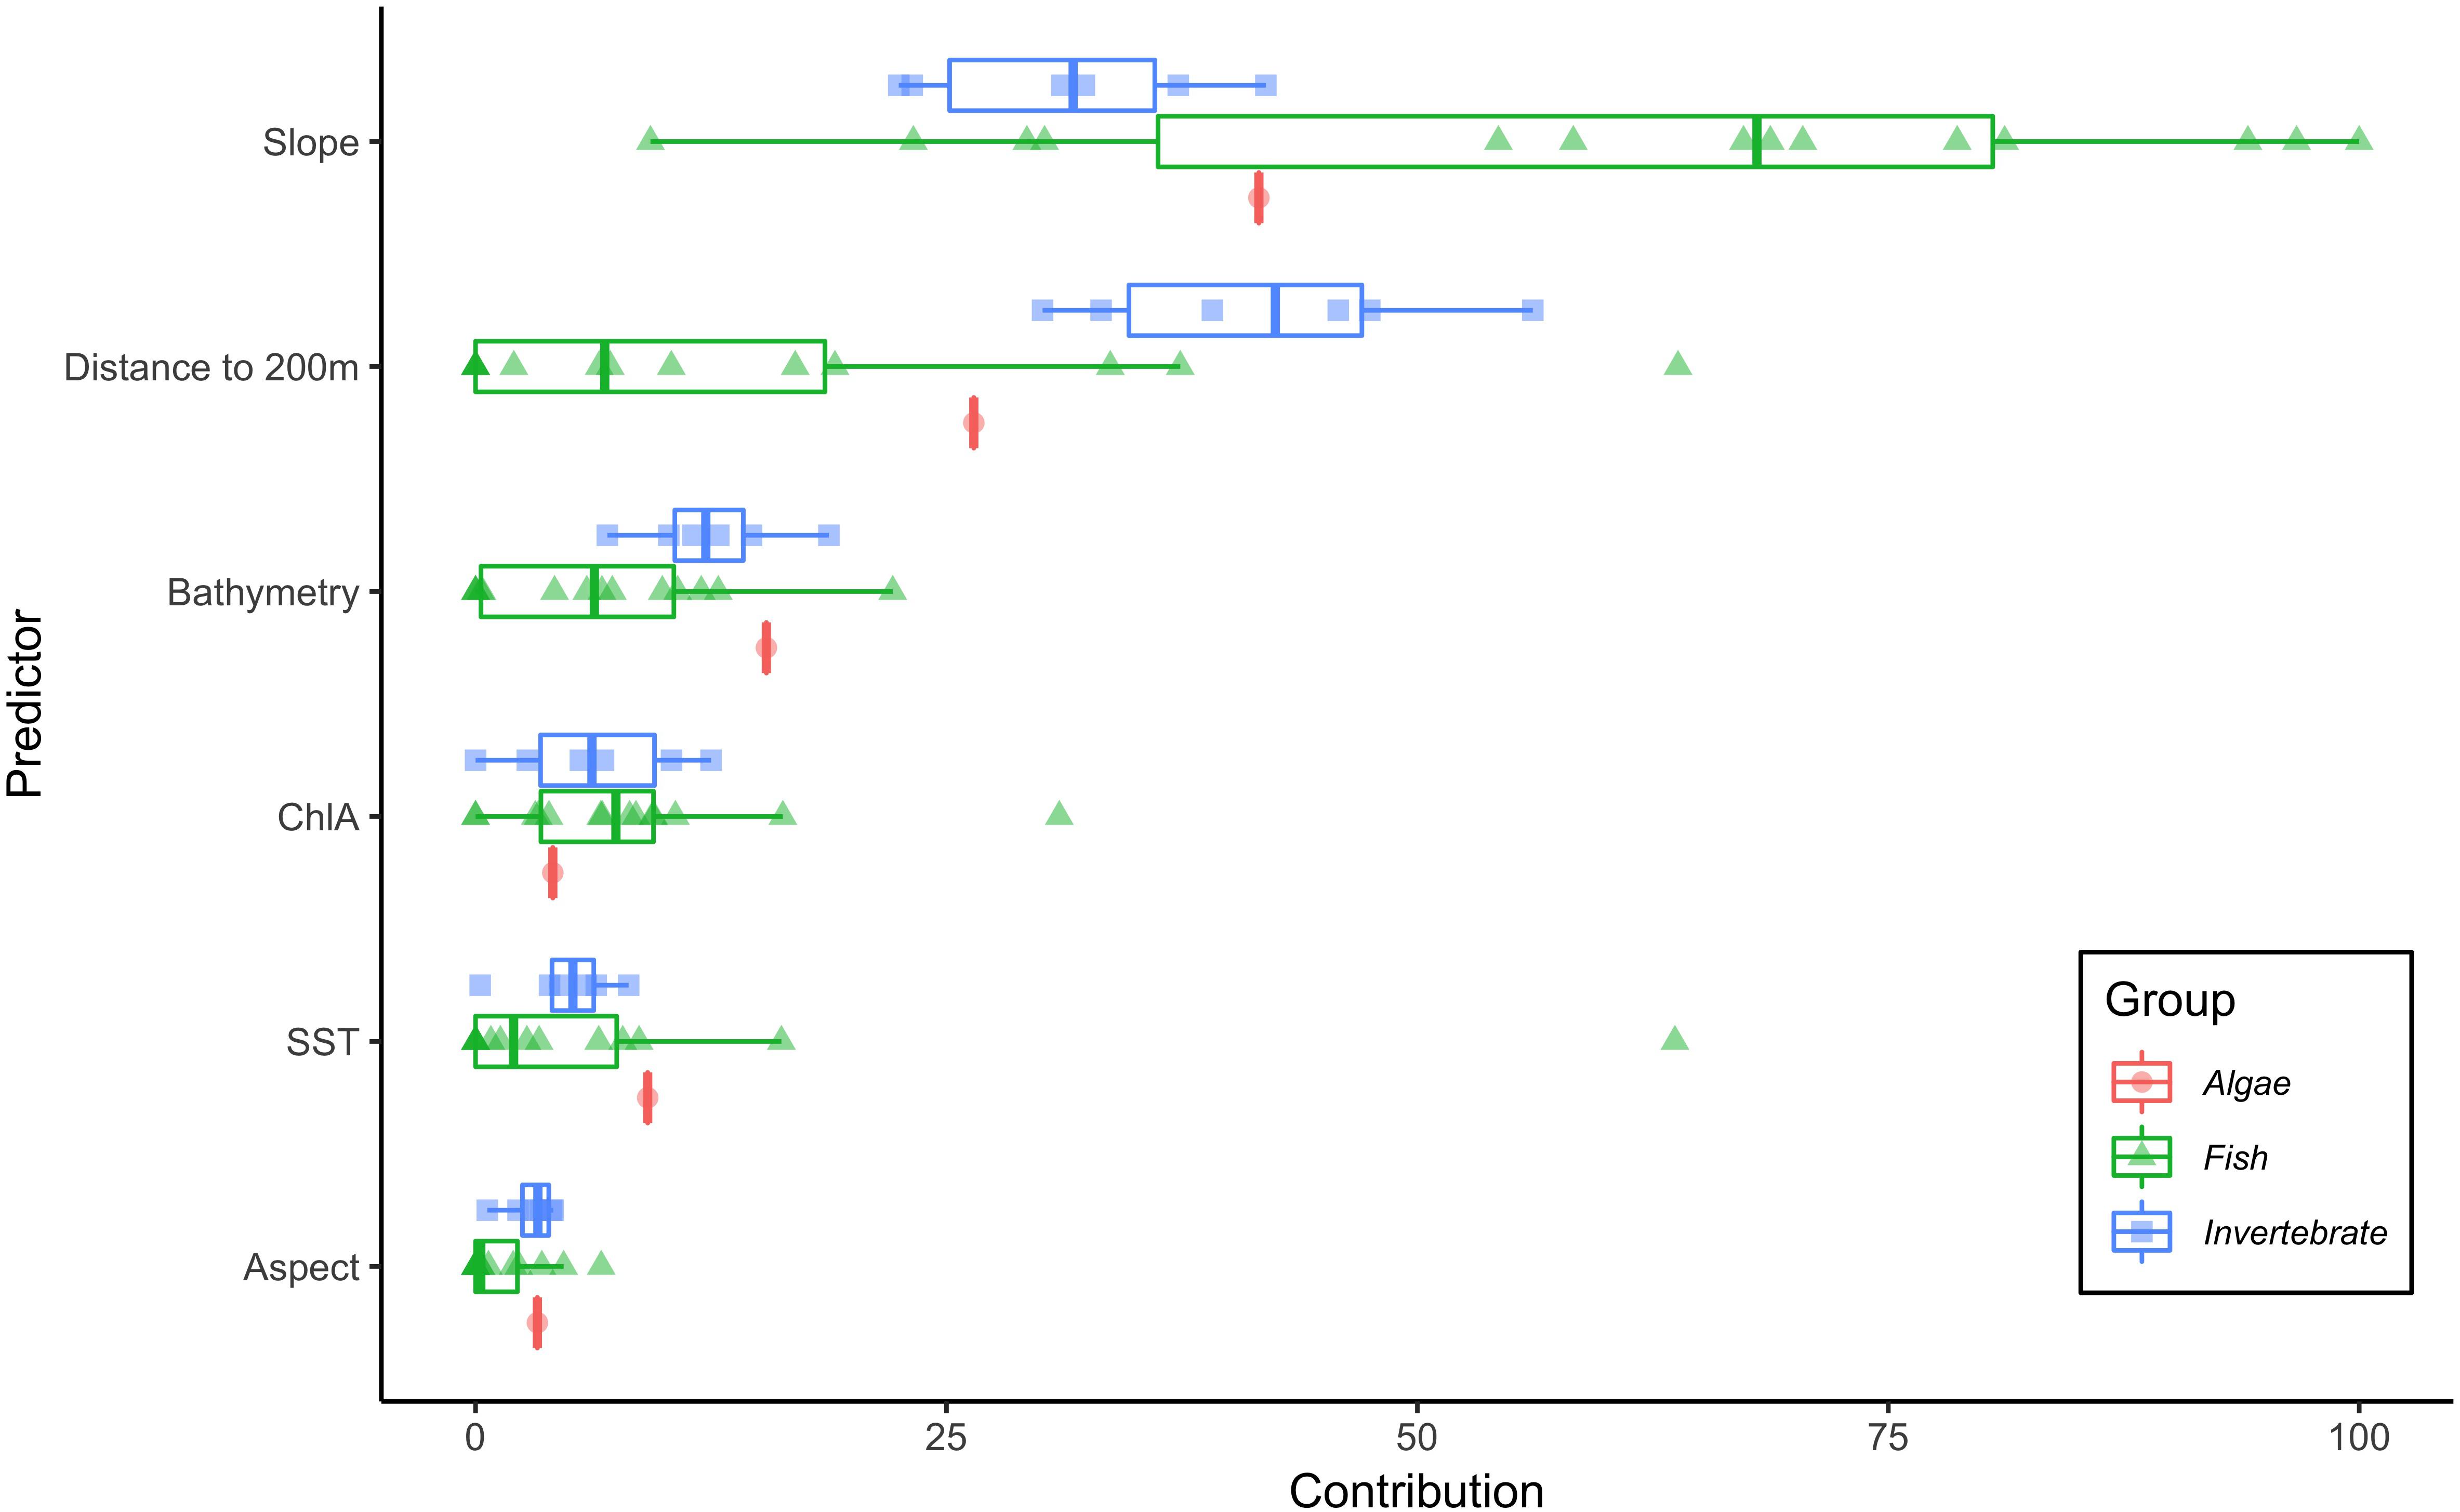
Figure 1. Percent contribution of each of the six predictor variables to the individual-SDMs. Interquartile ranges shown for the three taxonomic groups, algae (red circles), fish (green triangles), and invertebrates (blue squares).
Stacked-SDM
The s-SDM showed high variation in predicted multi-species habitat suitability across the Southern California Bight coastline for the 21 focal species (Figure 2). Approximately 38.7% (1132 km2) of the studied region included habitat that is predicted to be suitable for many of the focal species. In general, average habitat suitability was lower inside bays and higher along points and around islands. The model identified multiple regions with high average predicted habitat suitability that do not already contain reef habitat (Figure 2). After removing cells with existing reef habitat, there remained approximately 33% (804 km2) of the remaining study region that included habitat that is predicted to be suitable for many of the focal species.
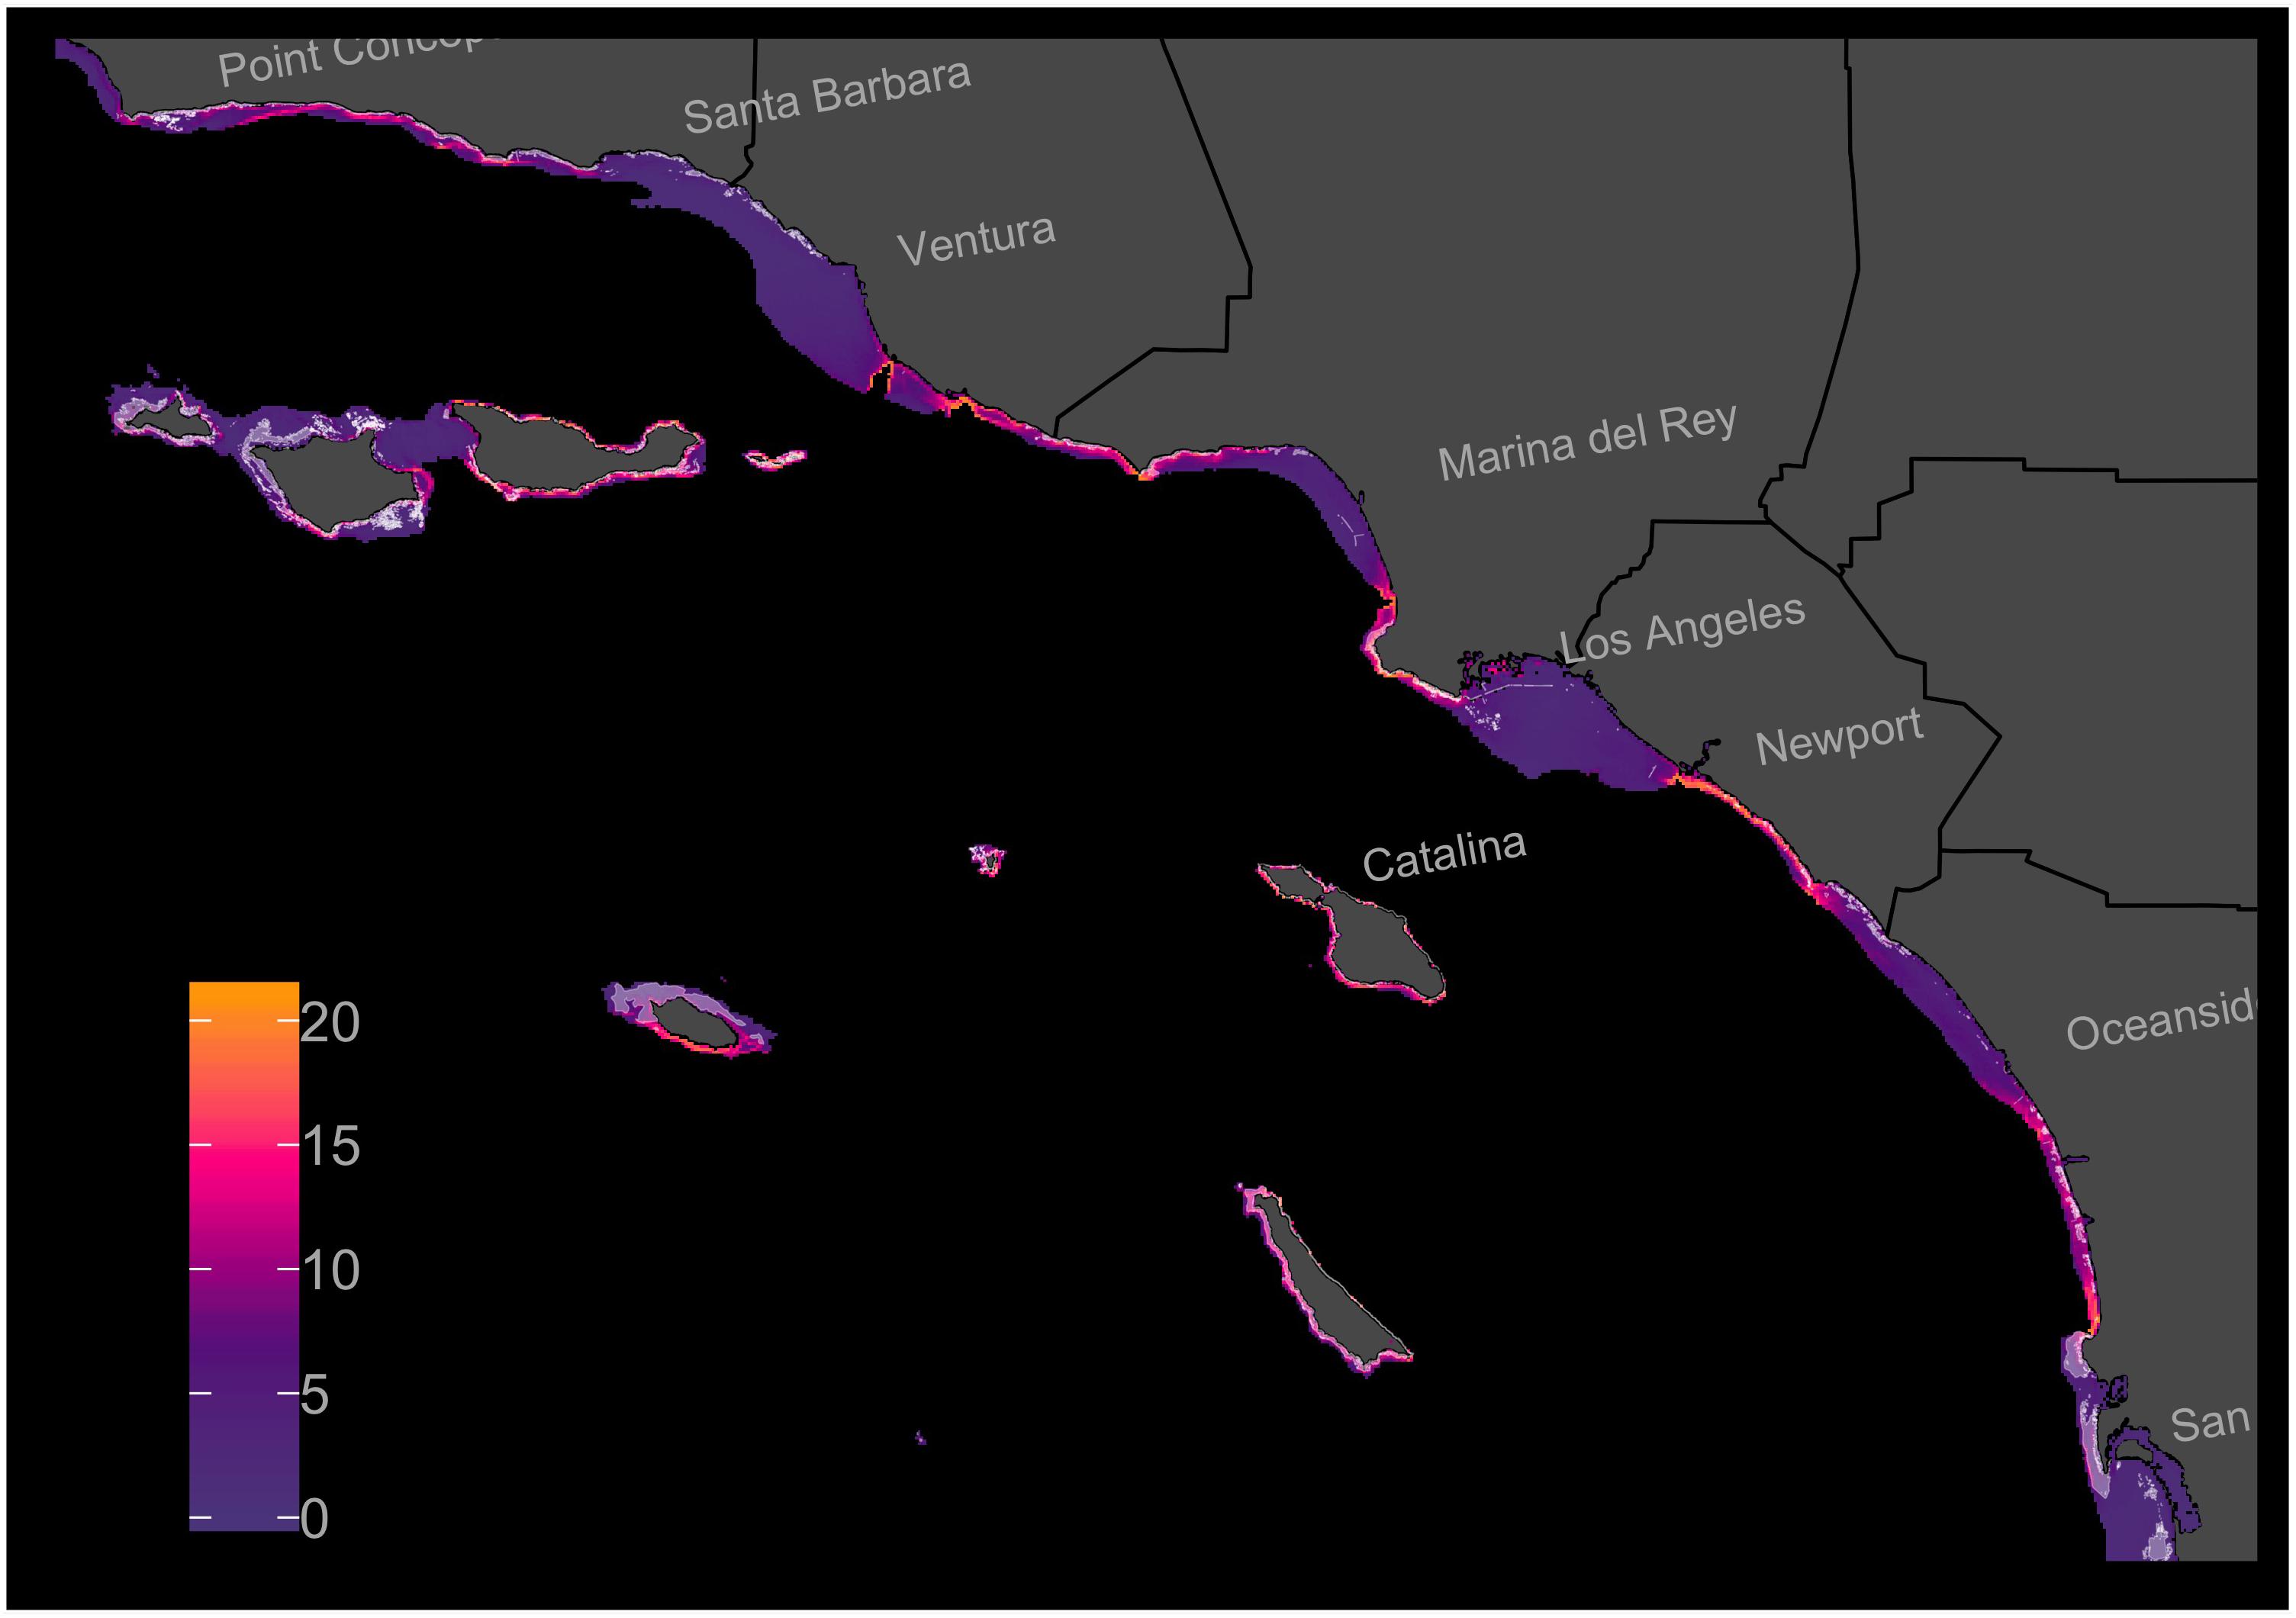
Figure 2. Stacked-Species Distribution Model (s-SDM) showing predicted multi-species habitat suitability at a resolution of 200 × 200 m and within the 45 m isobath in the Southern California Bight. Individual-SDMs were created for 21 focal fish, invertebrate, and algal species across existing reef habitat and then projected across the entire study region. The individual-SDMs were then added together to create an s-SDM. Existing reef habitat shaded with white. Color ramp shows s-SDM scores.
For the focal species on natural reefs, the model including s-SDM scores and the two covariates, SD relief and depth zone, better predicted observed bootstrap species richness than the null model with only the two covariates (w = 1; Table 2 and Figure 3). Observed bootstrap species richness increased with increasing s-SDM scores (R2 = 0.22, slope = 0.27, 95% CI = 0.17–0.36). When this model was used to predict species richness for the established manmade reefs, there was high support for a relationship between observed and predicted species richness (slope = 0.52, 95% CI = 0.13–0.92, w = 1; Table 2 and Figure 4A). Similarly, predicted species richness values from this linear model were positively associated with observed bootstrap species richness when considering 204 other non-focal fish, invertebrate, and algal species that were surveyed on both natural and manmade reefs (slope = 3.65, 95% CI = 2.93–4.37, w = 1; Table 2 and Figure 4B).
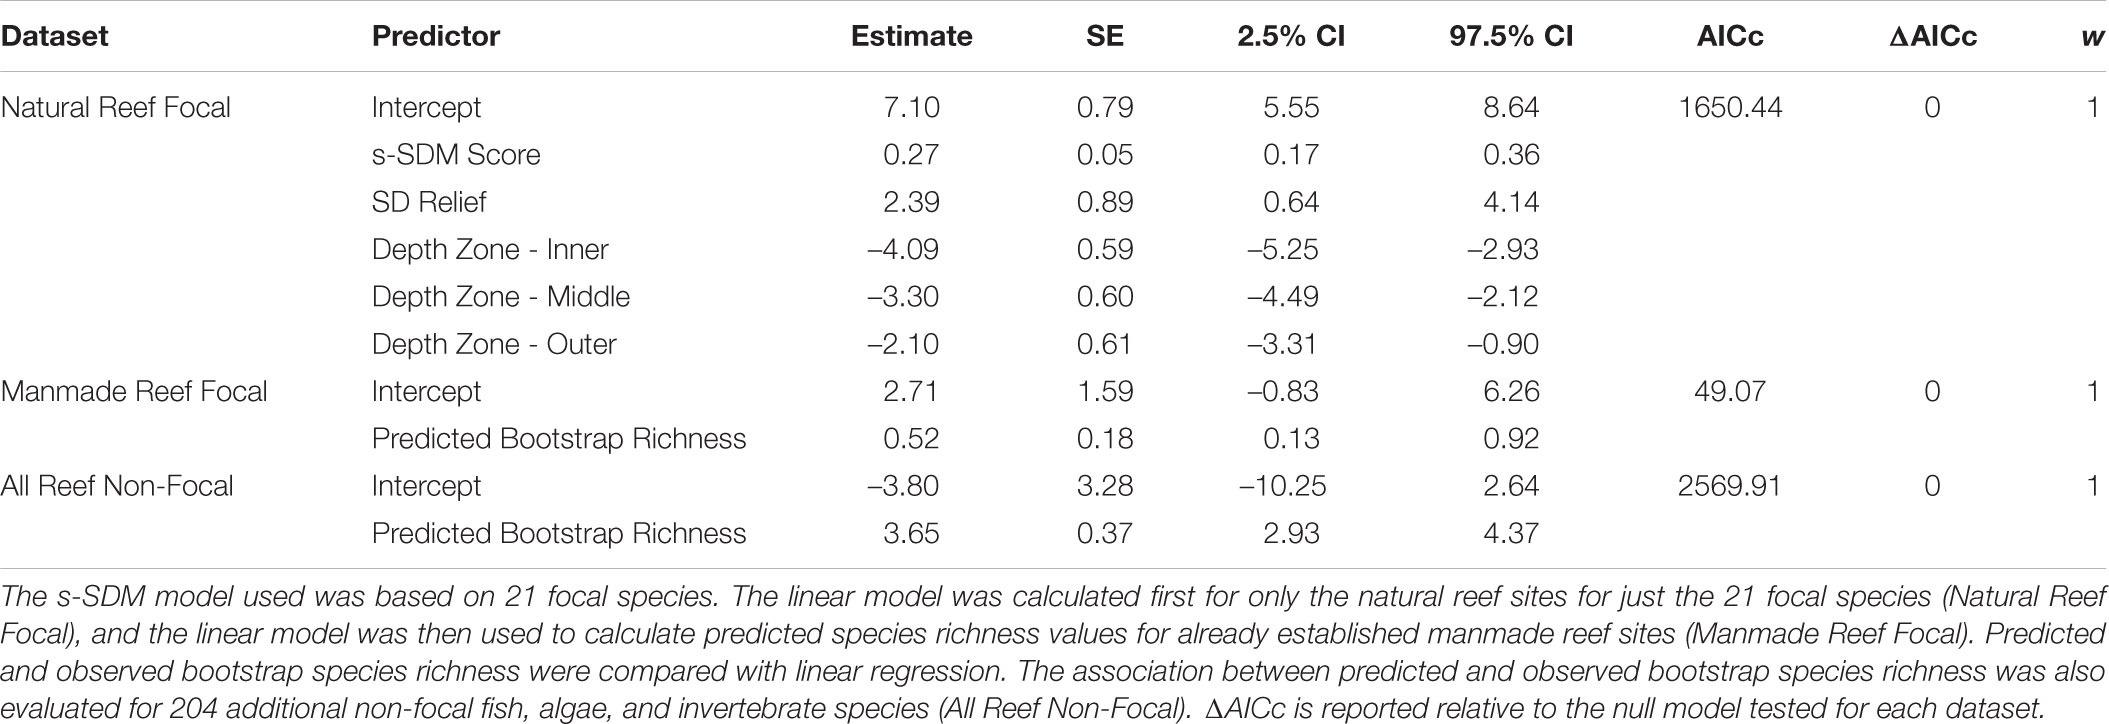
Table 2. Linear regression results comparing s-SDM score with observed bootstrap species richness.
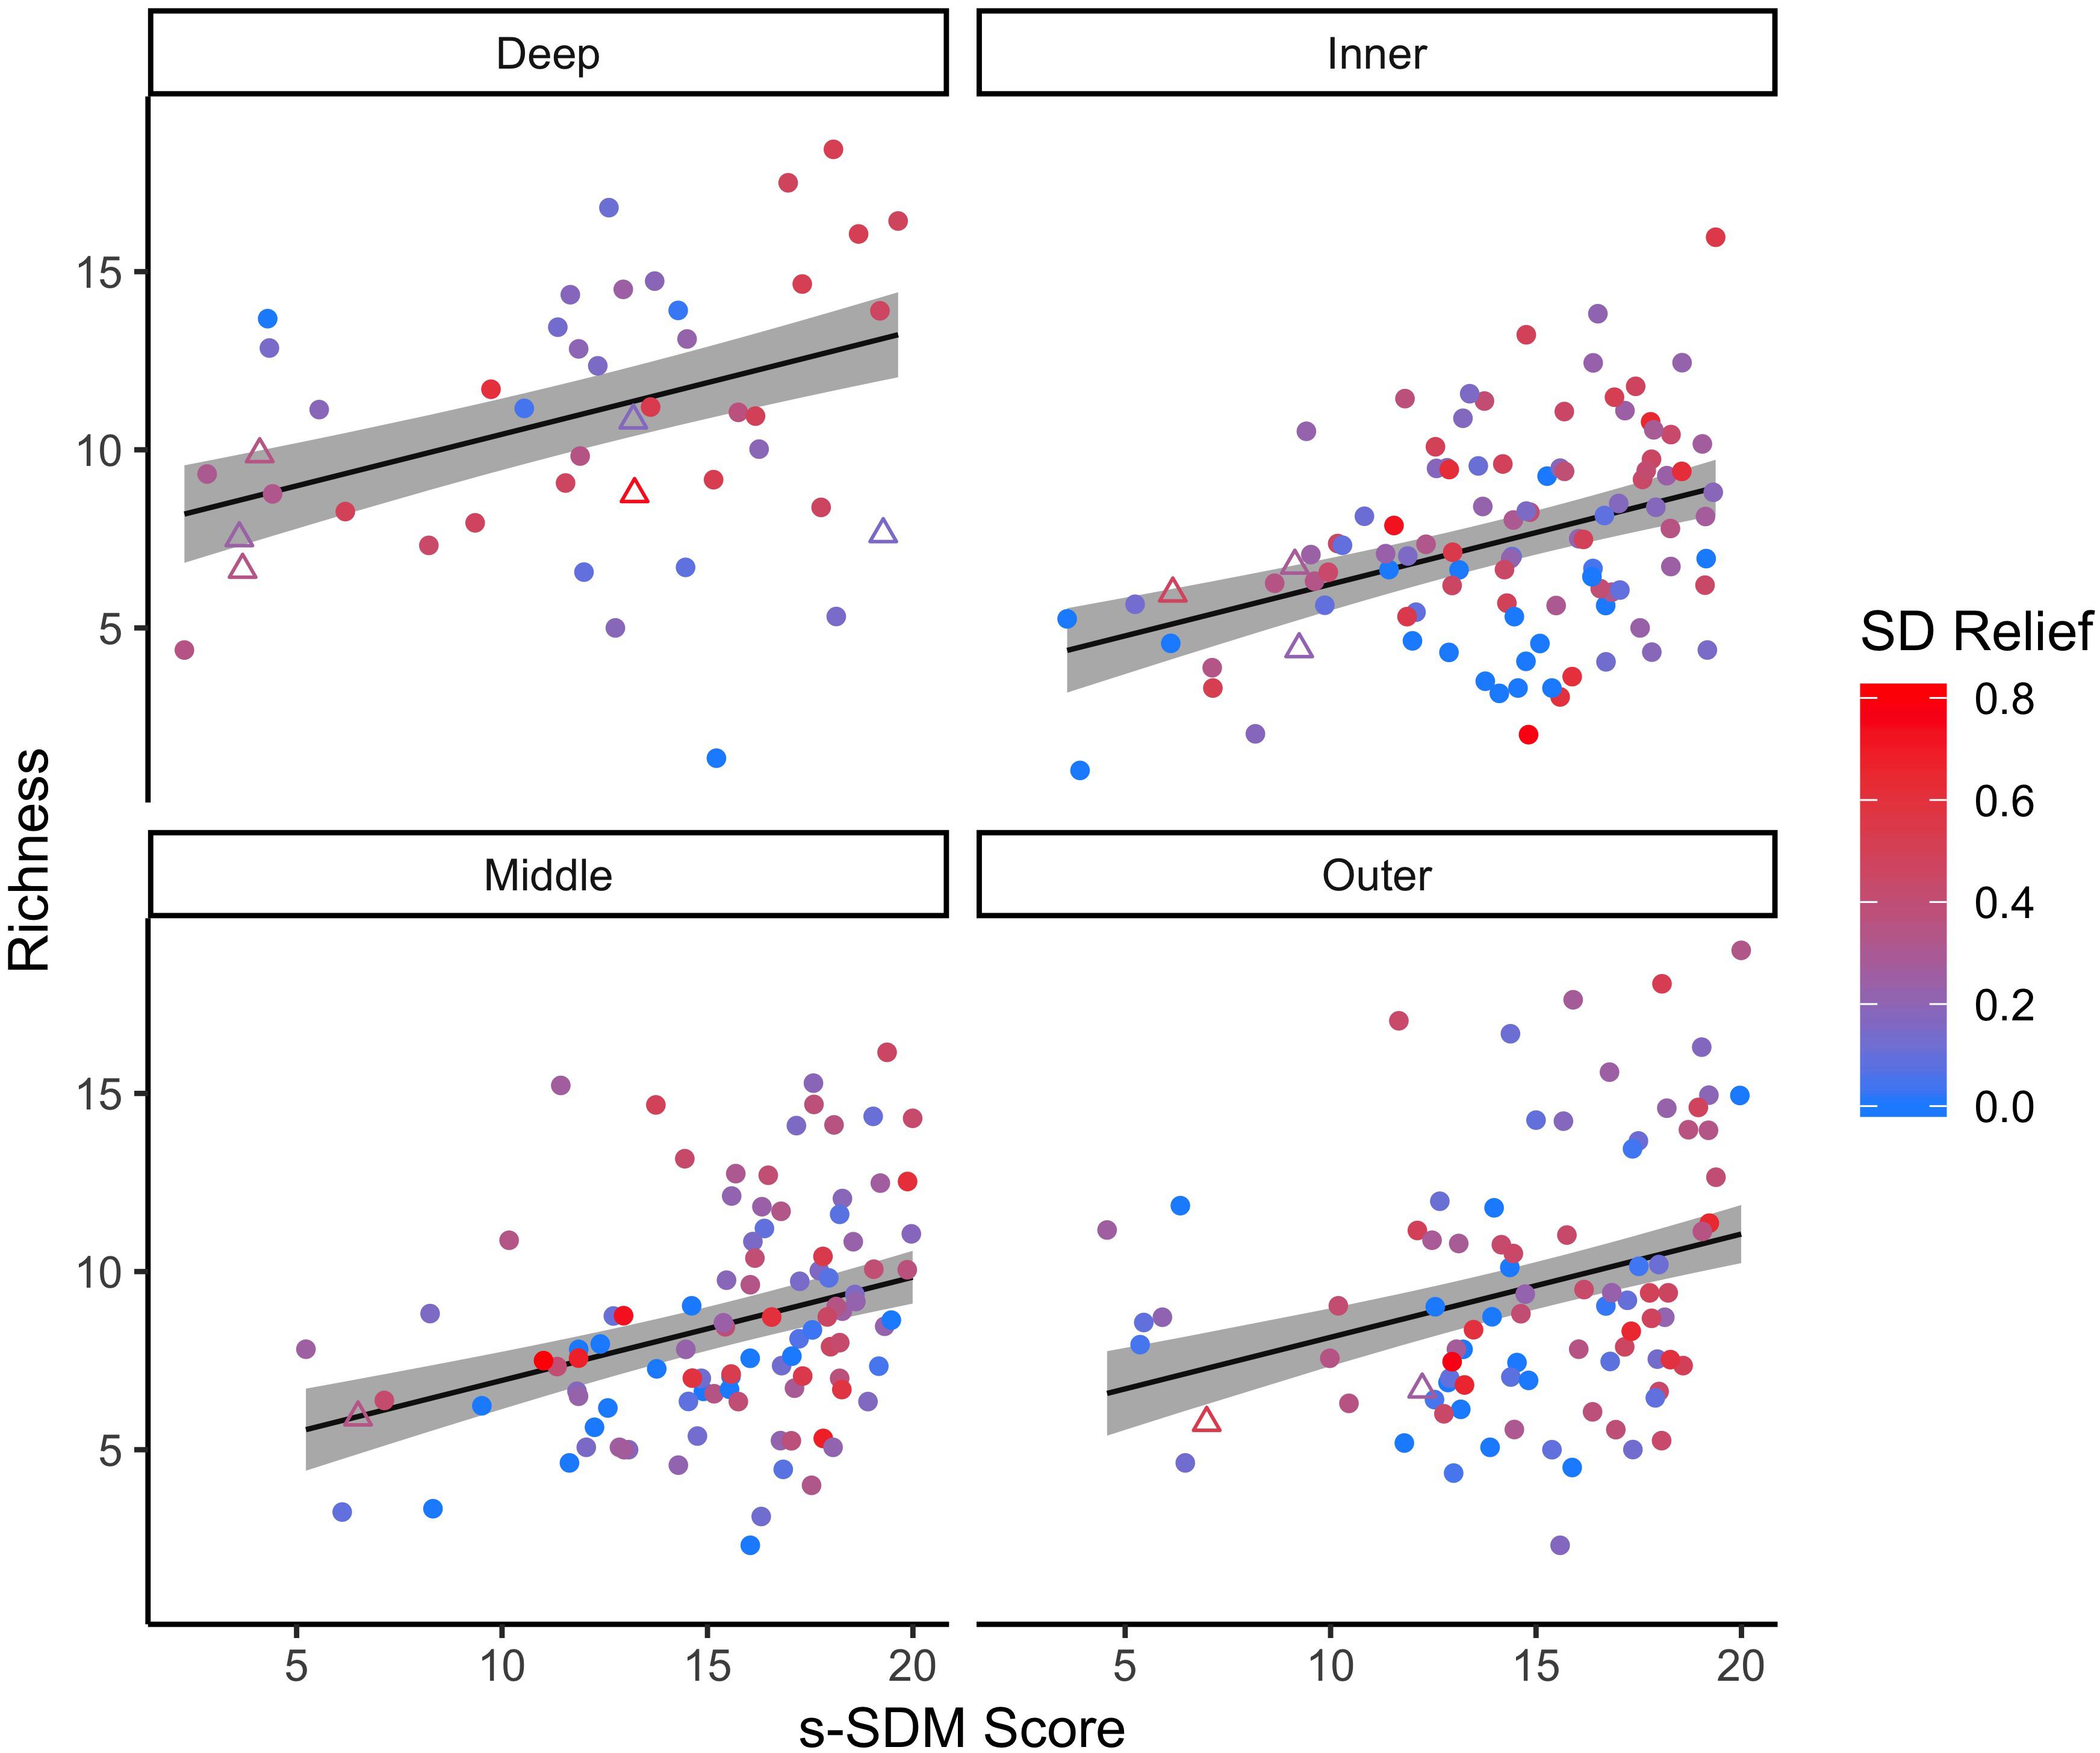
Figure 3. Linear relationship between predicted s-SDM score and observed bootstrap species richness for the 21 focal species. The linear regression was completed for the 21 focal species on all natural reef sites (circles) at four depth zones: inner (∼5 m), middle (∼10 m), outer (∼15 m) and deep (∼25 m). Established manmade reef sites (triangles) for reference. Colors indicate standard deviation (SD) of relief at each reef site, from low (blue) to high (red) fine scale habitat heterogeneity. 95% confidence intervals of the regression lines are shown in gray.
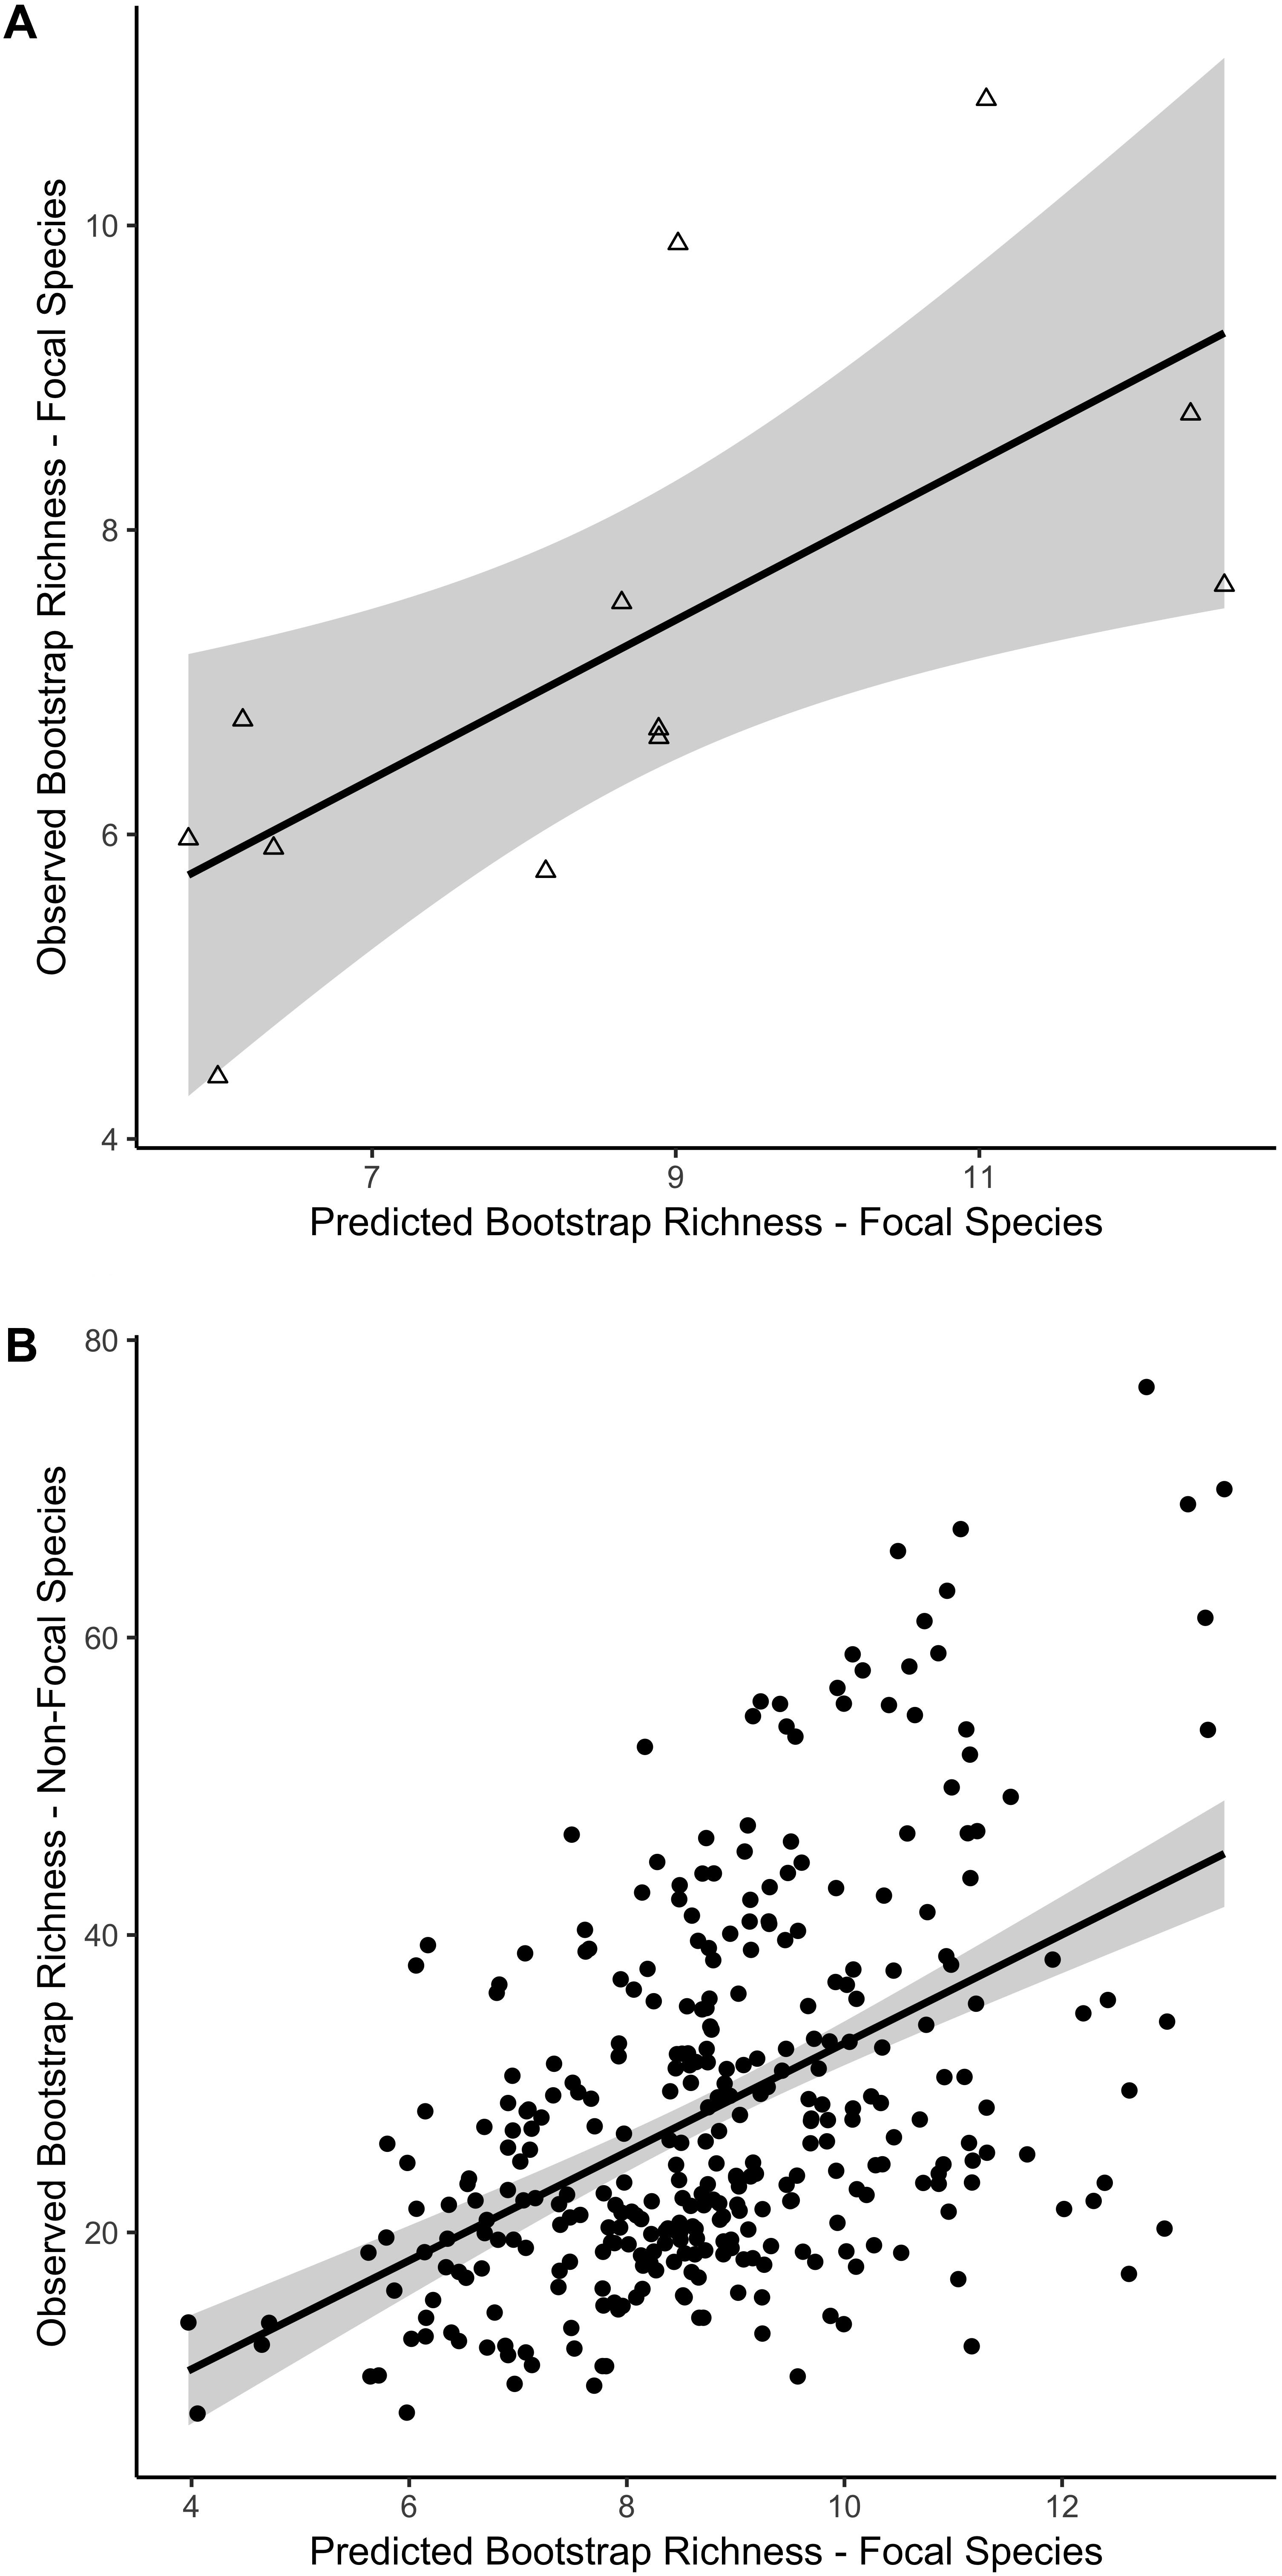
Figure 4. Linear relationship between predicted and observed bootstrap species richness for two independent datasets based on the best fit model for natural reefs. Predicted versus observed species richness for (A) the 21 focal species on established manmade reefs and (B) the 204 non-focal fish, algae, and invertebrate species on all reef sites, including natural and manmade, at four depth zones. Colors indicate mean standard deviation (SD) of relief at each reef site, from low (blue) to high (red) relief. 95% confidence intervals of the regression lines are shown in gray.
Quality of Existing Manmade Reefs
To assess the habitat suitability of previously established manmade reefs, we extracted the s-SDM score for each survey site and compared s-SDM scores among natural and manmade reefs to one another and relative to a random distribution. Manmade reefs (mean = 8.7) significantly differed on average from natural reefs (mean = 14.2) in s-SDM scores (t-value = –5.4, P-value = 1.8e–05; Figure 5A). Manmade reefs had an average s-SDM score that was slightly although significantly greater than randomly selected sites, both when the entire study region was considered (Figure 5B) and when only areas with no existing reef was considered (P-value < 0.01) (Figure 5C).
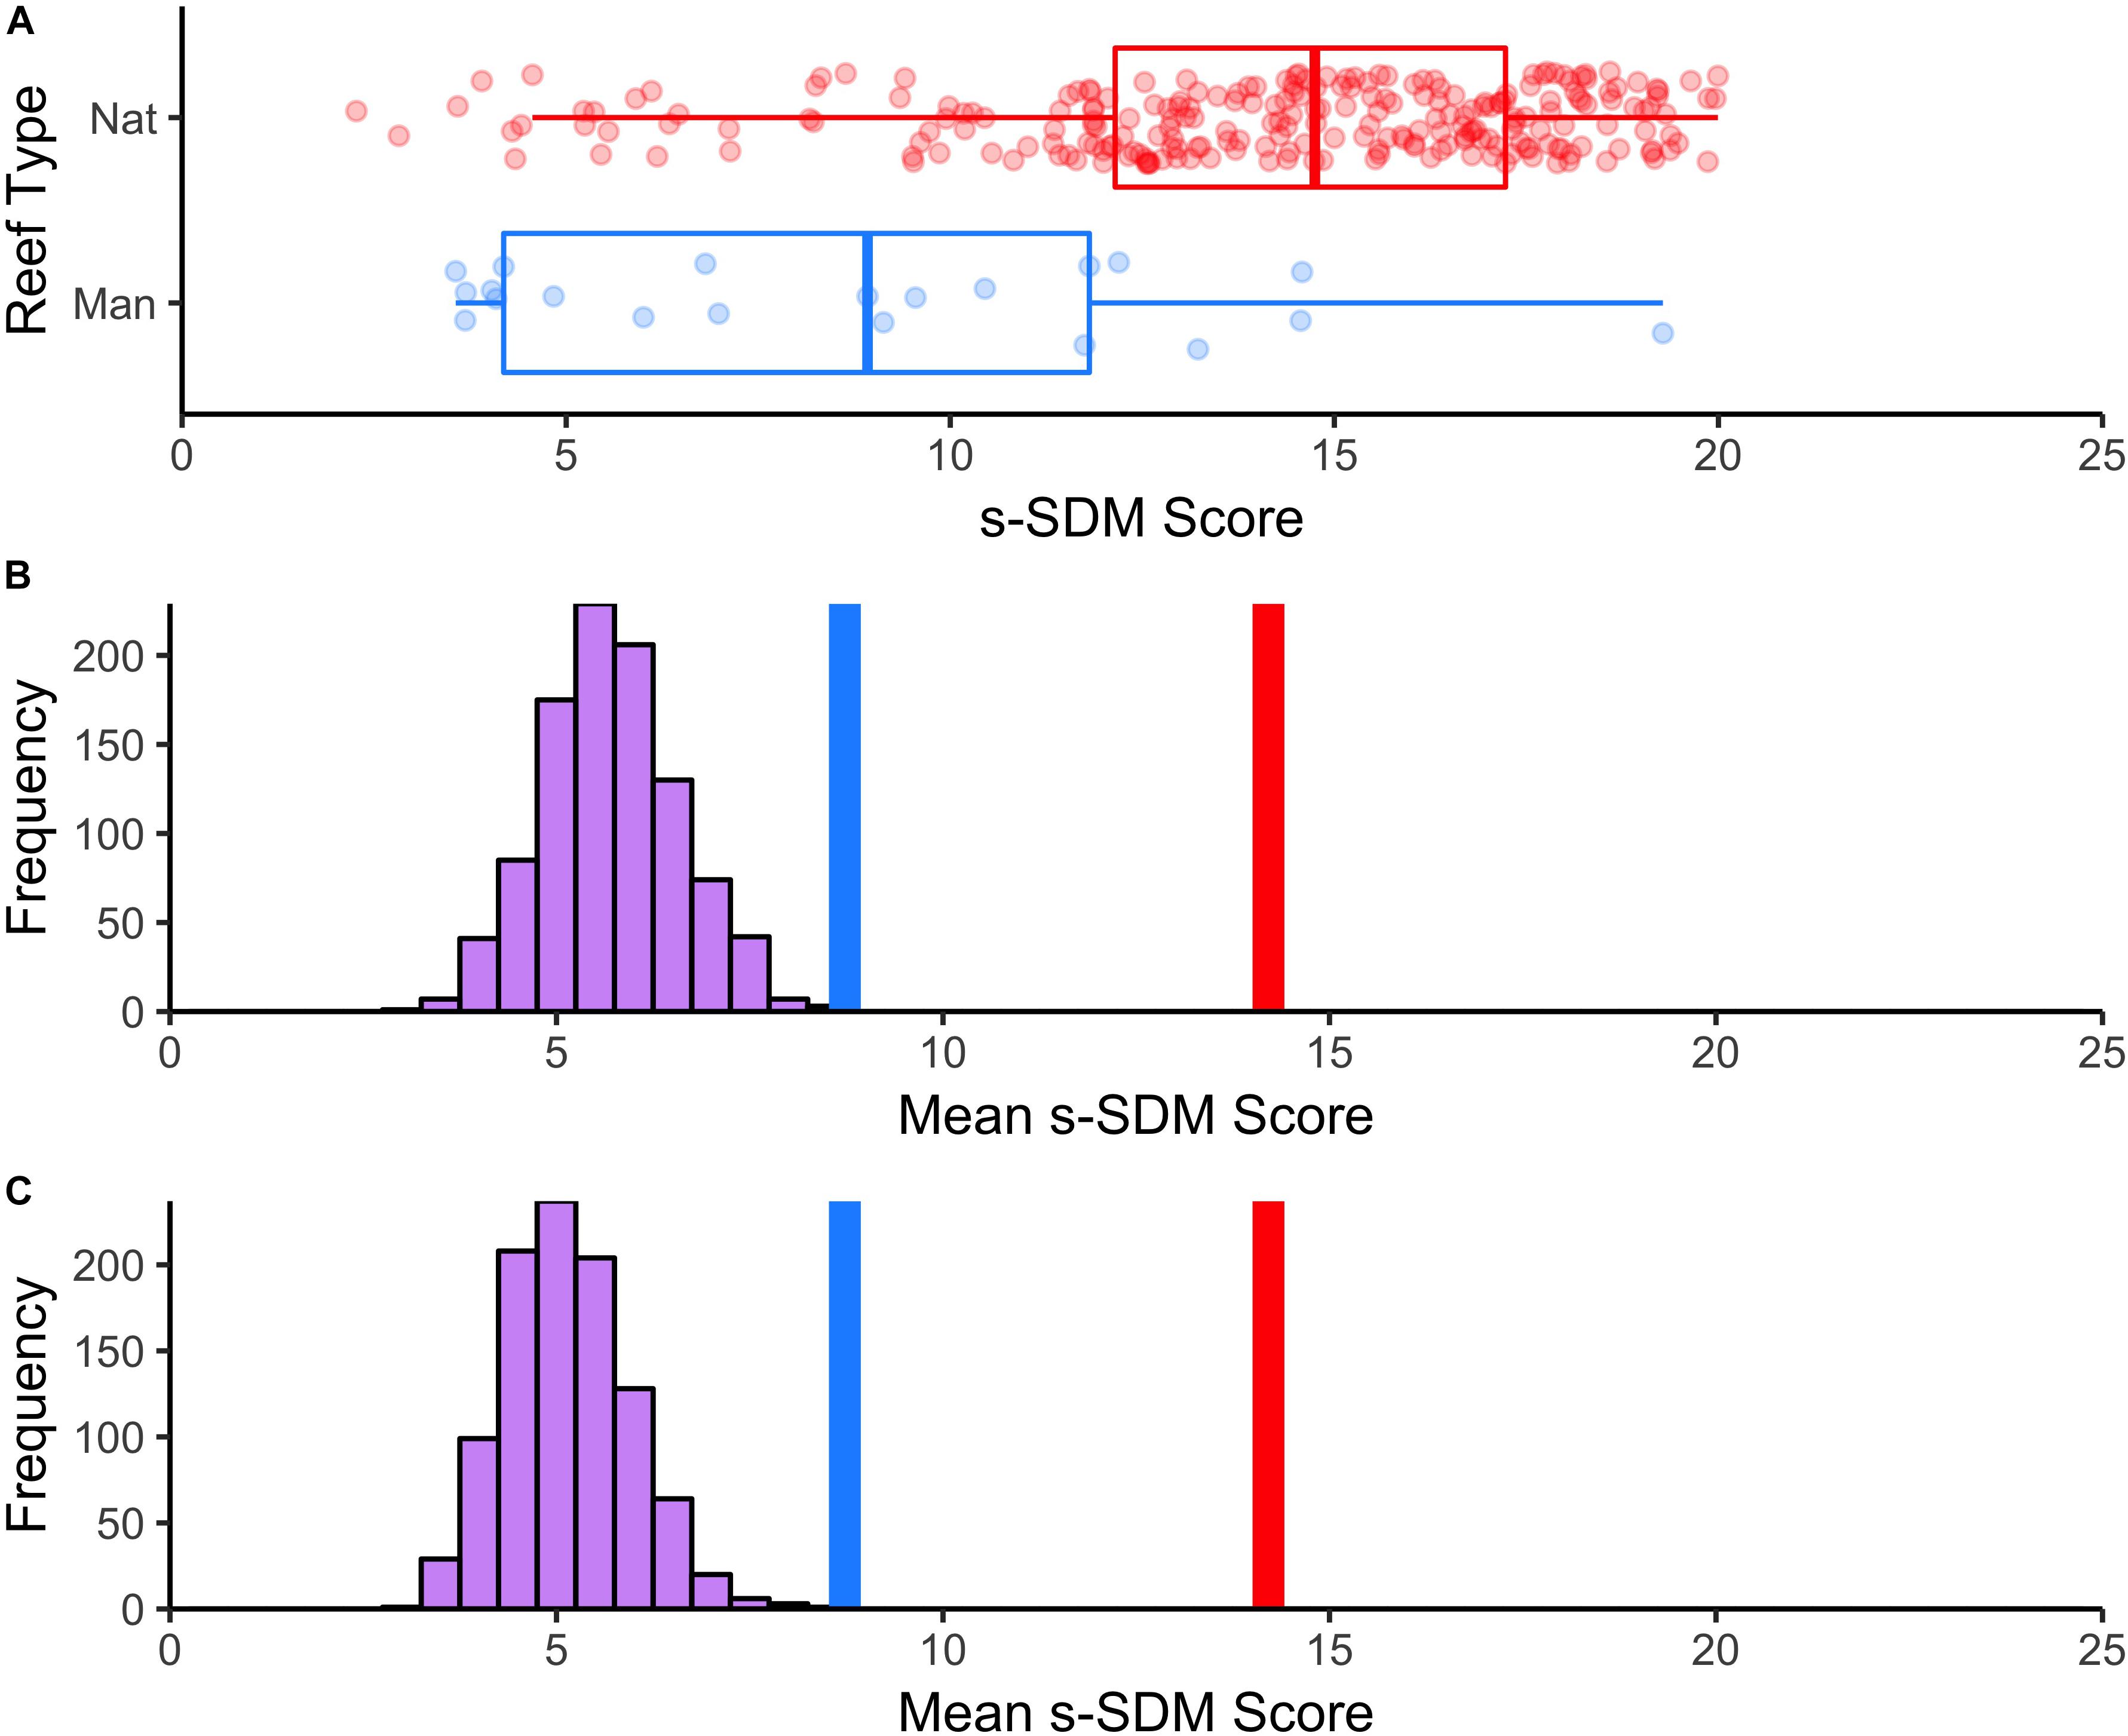
Figure 5. Mean s-SDM scores of existing manmade reefs relative to natural reefs and compared to random. (A) Boxplot of differences in s-SDM scores for natural (blue) and manmade (red) reef sites. Mean s-SDM score was calculated for the already existing solitary manmade reefs within the SCB (n = 21, blue line) and for each of the natural reef sites (n = 250, red line). The means were compared to a permuted distribution of 21 randomly selected sites iterated 1000 times. (B) Random sites chosen from anywhere in the SCB. (C) Random sites chosen from only areas with no existing reef.
Discussion
Improving the success of habitat restoration projects is a necessity as ecosystems worldwide continue to face increasing anthropogenic pressures and habitat loss. This need is especially great in marine ecosystems, due to increasing coastal urbanization (Dafforn et al., 2015; Morris et al., 2018). Species distribution modeling can be used as an important tool in identifying the best places where habitat restoration is likely to be successful by identifying suitable habitat (Pearce and Lindenmayer, 1998). Here we apply this method to the ecosystem level by calculating individual species distribution models for 21 focal species from shallow rocky reefs and stack these SDMs to identify areas with suitable habitat for a majority of the species. Our results illustrate a number of potential areas within the Southern California Bight – an area with immense human pressure due to proximity to major metropolitan areas – where habitat is predicted to be suitable for the majority of our focal species, including many areas that do not already contain natural or manmade reefs (Figure 2 and Supplementary Figures S1–S21). This approach allows us to identify sites for habitat restoration using organism-based habitat considerations rather than simply landscape-(or seascape-)based considerations, which is crucial when restoring habitat for multiple species (Miller and Hobbs, 2007).
Moreover, when the individual-SDMs were combined together as the s-SDM, there was a positive linear relationship between s-SDM scores and observed bootstrap species richness on the natural reefs when considering only the 21 focal species (Table 2 and Figure 3), and this relationship was validated by two independent datasets. First, the predicted richness values from this linear model were associated with observed bootstrap species richness at manmade reefs when considering only the 21 focal species (Table 2 and Figure 4A). Second, the predicted richness values from this linear model were also correlated with increases in observed species richness when considering all other 204 fish, invertebrate, and algae species surveyed on Southern California shallow rocky reefs (Table 2 and Figure 4B). Thus, by identifying crucial focal species and combining distribution models for each of these species, it is possible to identify areas that may support greater species richness. For restoration projects in which species diversity or richness is a primary goal (Wortley et al., 2013), this method may provide an opportunity for managers to successfully select more-ideal locations for restoration.
While species richness generally increases with increasing s-SDM scores, there is a high degree of variability, particularly for sites with the highest s-SDM scores. This pattern suggests that additional factors influence suitability of a site beyond just environmental suitability. While our approach identifies environmental suitability and potential locations for habitat restoration, suitability does not guarantee success on its own (Higgs, 1997). Additional factors that need to be considered when selecting sites, include: habitat design (Baine, 2001), species relationships (e.g., Jude and Deboe, 1996), cultural needs (Higgs, 1997), and public participation and socioeconomic factors (Wortley et al., 2013). With Species Distribution Models, species relationships are especially important to consider as SDMs do not inherently account for ecological relationship such as competition and predation (Freeman and Mason, 2015). Thus, some variation could be explained by which species are present at particular reefs.
Additionally, and possibly alternatively, the variation in species richness of high quality sites may instead reflect habitat degradation. For instance, highly suitable sites may be overfished (Zellmer et al., 2018) or exposed to pollution (Schaffner et al., 2015). In fact, some of the natural sites for which there is lower than expected species richness despite high s-SDM scores include some of the more degraded reef sites in our study (high s-SDM score, low richness; Figures 3, 4B). Since many of the best predicted s-SDM scores are on or near existing reefs, our results suggest that there may be immense opportunity for restoring natural reefs as opposed to simply building manmade structures in areas where rocky reefs did not previously exist. In other words, it is important to consider the difference between habitat “restoration” or “rehabilitation” versus habitat “conversion” (Erftemeijer and Lewis, 1999). Restoring previously existing reefs may not only be more cost effective, but as our results suggest, may also be more likely to succeed based on habitat suitability.
Further, the variability observed could also be explained by the physical structure and design of reefs. Previous research has shown that reef structure is an important component of restoration success (Baine, 2001; Pondella et al., 2006). Consistent with this previous research, our analyses suggest that even when environmental conditions are suitable, reef structure may influence species presence as predicted species richness was more accurate for purposefully designed manmade reef structures as opposed to unintended manmade reef structures. Thus, once candidate sites are selected based on habitat suitability, restoration should be done in conjunction with expert opinion as to the specific design of manmade reefs.
Regardless of the specific causes of the variability, our model provides an estimate of areas that are predicted to be suitable for multiple species, suggesting that at least some of the focal species could persist in these locations. Conservation managers should consider the locations identified by this model as a set of candidate locations from which they can then select sites after considering these other factors. Thus, this approach adds an additional tool to help managers consider holistic success of habitat restoration. However, while the s-SDM identifies sites where there is high habitat suitability across a majority of the focal species, for some species, such as rare or endangered species (e.g., Abalone, Haliotis sp.), more directed conservation measures may be necessary. For such species, the individual-SDMs can be used to help in identifying diverse sites for ecosystem restoration.
Interestingly, the manmade reefs included in this study that are already established in the SCB are in regions that are on average not only less suitable than natural reefs, but are in regions only slightly more suitable than sites selected at random (Figure 5). For example, some manmade reefs are placed in gently sloping, sandy-bottom regions. If these reefs had been placed in areas with higher predicted habitat suitability, then it is possible more species could be observed. While we do still observe some species at these locations (Pondella et al., 2015a; Zahn et al., 2016), the lack of habitat suitability suggests that these manmade reefs may be hosting sink populations (van Horne, 1983; Smallwood, 2001). Based on these results, there is strong evidence that habitat restoration may have the most potential when completed at sites with degraded reefs (e.g., inundated by landslides) as opposed to constructing reefs far from existing reef structures. Not only are these more distant sites potentially less suitable, but also have lower connectivity with existing, productive reef habitat (Pondella et al., 2018). With clear predictions for habitat suitability across multiple species, managers can be best prepared to advocate for selection of appropriate sites.
Future Directions
To ensure that habitat restoration is successful in these locations, future studies should focus on continued monitoring and follow up research. While habitat restoration has become an essential tool in conservation biology, long-term assessments of restoration success remain limited (Godefroid et al., 2011; Wortley et al., 2013). Further, future research should consider species specific differences in how they contribute to community biodiversity and success. Finally, species distribution modeling also offers an opportunity to assess how habitat suitability might vary under future global environmental change (Peterson et al., 2002). As global environmental changes continue to occur, it is crucial to consider how those changes influence the goals of habitat restoration (Higgs et al., 2014). Future research should focus on assessing changes in habitat restoration priorities based on potential changes in habitat suitability across multiple species under numerous possible climate scenarios.
Author Contributions
AZ envisioned the project, ran the computational analyses, and wrote the manuscript. JC envisioned the project, contributed to field work, data analysis, and writing. CW and SS contributed to the data analysis, field work, and writing. DP envisioned the project, managed and contributed to the field work, and contributed to data analysis and writing.
Funding
The work was supported by the NOAA Saltonstall-Kennedy Grant #NA15NMF4270320.
Conflict of Interest Statement
The authors declare that the research was conducted in the absence of any commercial or financial relationships that could be construed as a potential conflict of interest.
Acknowledgments
We thank Jenn Casselle at PISCO UC Santa Barbara, and David Kushner and Josh Sprague at the Channel Islands National Park Kelp Forest Monitoring Program for access to their long-term monitoring data. We also thank four reviewers for their helpful comments on the manuscript. Special thanks to Robert F. Zellmer.
Supplementary Material
The Supplementary Material for this article can be found online at: https://www.frontiersin.org/articles/10.3389/fmars.2019.00003/full#supplementary-material
Footnotes
References
Adams, M. P., Saunders, M. I., Maxwell, P. S., Tuazon, D., Roelfsema, C. M., Callaghan, D. P., et al. (2016). Prioritizing localized management actions for seagrass conservation and restoration using a species distribution model. Aquat. Conserv. Mar. Freshw. Ecosyst. 26, 639–659. doi: 10.1002/aqc.2573
Aiello-Lammens, M. E., Boria, R. A., Radosavljevic, A., Vilela, B., and Anderson, R. P. (2015). spThin: an R package for spatial thinning of species occurrence records for use in ecological niche models. Ecography 38, 541–545. doi: 10.1111/ecog.01132
Ambrose, R. F. (1994). Mitigating the effects of a coastal power plant on a kelp forest community: rationale and requirements for an artificial reef. Bull. Mar. Sci. 2, 694–708.
Baine, M. (2001). Artificial reefs: a review of their design, application, management and performance. Ocean Coast. Manag. 44, 241–259. doi: 10.1016/S0964-5691(01)00048-5
Barnosky, A. D., Matzke, N., Tomiya, S., Wogan, G. O. U., Swartz, B., Quental, T. B., et al. (2011). Has the earth’s sixth mass extinction already arrived? Nature 471, 51–57. doi: 10.1038/nature09678
Bender, D. J., Contreras, T. A., and Fahrig, L. (1998). Habitat loss and population decline: a meta-analysis of the patch size effect. Ecology 79, 517–533. doi: 10.1890/0012-9658(1998)079[0517:HLAPDA]2.0.CO;2
Bograd, S. J., and Lynn, R. J. (2003). Long-term variability in the Southern California current system. Deep Sea Res. Part II Top. Stud. Oceanogr. 50, 2355–2370. doi: 10.1016/S0967-0645(03)00131-0
Bohnsack, J. A., Harper, D. E., McClellan, D. B., and Hulsbeck, M. (1994). Effects of reef size on colonization and assemblage structure of fishes at artificial reefs off southeastern Florida. U.S.A. Bull. Mar. Sci. 55, 796–823.
Bohnsack, J. A., and Sutherland, L. (1985). Artificial reef research: a review with recommendations for future priorities. Bull. Mar. Sci. 37, 11–39.
Bottin, L., Le Cadre, S., Quilichini, A., Bardin, P., Moret, J., and Machon, N. (2007). Re-establishment trials in endangered plants: a review and the example of Arenaria grandiflora, a species on the brink of extinction in the Parisian region (France). Ecoscience 14, 410–419. doi: 10.2980/1195-6860(2007)14[410:RTIEPA]2.0.CO;2
Brodie, S., Jacox, M. G., Bograd, S. J., Welch, H., Dewar, H., Scales, K. L., et al. (2018). Integrating dynamic subsurface habitat metrics into species distribution models. Front. Mar. Sci. 5:219. doi: 10.3389/fmars.2018.00219
Burnham, K. P., and Anderson, D. R. (2002). Model Selection and Multimodel Inference: A Practical Information-Theoretic Approach, 2nd Edn. New York, NY: Springer Science & Business Media.
Calabrese, J. M., Certain, G., Kraan, C., and Dormann, C. F. (2014). Stacking species distribution models and adjusting bias by linking them to macroecological models. Glob. Ecol. Biogeogr. 23, 99–112. doi: 10.1111/geb.12102
Carr, M. H., and Hixon, M. A. (1997). Artificial reefs: the importance of comparisons with natural reefs. Fisheries 22, 28–33. doi: 10.1371/journal.pone.0172360
Caselle, J. E., Rassweiler, A., Hamilton, S. L., and Warner, R. R. (2015). Recovery trajectories of kelp forest animals are rapid yet spatially variable across a network of temperate marine protected areas. Sci. Rep. 5:14102. doi: 10.1038/srep14102
CDFG (2001). California’s Living Marine Resources: A Status Report. Available at: http://www.dfg.ca.gov/marine/status/status2001.asp
Claisse, J. T., Pondella, D. J., Love, M., Zahn, L., Williams, C. M., and Williams, J. P. (2014). Oil platforms off California are among the most productive marine fish habitats globally. Proc. Natl. Acad. Sci. U.S.A. 111, 15462–15467. doi: 10.1073/pnas.1411477111
da Mata, R. A., Tidon, R., de Oliveira, G., Vilela, B., Diniz-Filho, J. A. F., Rangel, T. F., et al. (2017). Stacked species distribution and macroecological models provide incongruent predictions of species richness for Drosophilidae in the Brazilian savanna. Insect Conserv. Divers. 10, 415–424. doi: 10.1111/icad.12240
Dafforn, K. A., Glasby, T. M., Airoldi, L., Rivero, N. K., Mayer-Pinto, M., and Johnston, E. L. (2015). Marine urbanization: an ecological framework for designing multifunctional artificial structures. Front. Ecol. Environ. 13:82–90. doi: 10.1890/140050
DeMartini, E. E., Barnett, A. M., Johnson, T. D., and Ambrose, R. F. (1994). Growth and production estimates for biomass-dominant fishes on a southern California artificial reef. Bull. Mar. Sci. 55, 484–500.
Dubuis, A., Pottier, J., Rion, V., Pellissier, L., Theurillat, J. P., and Guisan, A. (2011). Predicting spatial patterns of plant species richness: a comparison of direct macroecological and species stacking modelling approaches. Divers. Distrib. 17, 1122–1131. doi: 10.1111/j.1472-4642.2011.00792.x
Elith, J., Kearney, M., and Phillips, S. (2010). The art of modelling range-shifting species. Methods Ecol. Evol. 1, 330–342. doi: 10.1111/j.2041-210X.2010.00036.x
Elith, J., and Leathwick, J. R. (2009). Species distribution models: ecological explanation and prediction across space and time. Annu. Rev. Ecol. Evol. Syst. 40, 415–436. doi: 10.1146/annurev.ecolsys.l
Elith, J., Phillips, S. J., Hastie, T., Dudík, M., Chee, Y. E., and Yates, C. J. (2011). A statistical explanation of MaxEnt for ecologists. Divers. Distrib. 17, 43–57. doi: 10.1111/j.1472-4642.2010.00725.x
Erftemeijer, P. L. A., and Lewis, R. R. I. (1999). “Planting mangroves on intertidal mudflats – habitat restoration or habitat conversion,” in Paper presented at ECOTONE-VIII Seminar “Enhancing Coastal Ecosystem Restoration for the 21st Century Ranong and Phuket 23-28 May 1999, (Bangkok), 156–165.
Fischer, J., and Lindenmayer, D. B. (2000). An assessment of the published results of animal relocations. Biol. Conserv. 96, 1–11. doi: 10.1016/S0006-3207(00)00048-3
Foley, J. A., Defries, R., Asner, G. P., Barford, C., Bonan, G., Carpenter, S. R., et al. (2005). Global consequences of land use. Science 8, 570–574. doi: 10.1126/science.1111772
Freeman, B. G., and Mason, N. A. (2015). The geographic distribution of a tropical montane bird is limited by a tree: acorn woodpeckers (Melanerpes formicivorus) and Colombian Oaks (Quercus humboldtii) in the Northern Andes. PLoS One 10:e0128675. doi: 10.1371/journal.pone.0128675
Frissell, C. A., and Nawa, R. K. (1992). Incidence and causes of physical failure of artificial habitat structures in streams of Western Oregon and Washington. North Am. J. Fish. Manag. 12, 182–197. doi: 10.1577/1548-8675(1992)012<0182:IACOPF>2.3.CO;2
Godefroid, S., Piazza, C., Rossi, G., Buord, S., Stevens, A. D., Aguraiuja, R., et al. (2011). How successful are plant species reintroductions? Biol. Conserv. 144, 672–682. doi: 10.1016/j.biocon.2010.10.003
Graham, M. H. (2004). Effects of local deforestation on the diversity and structure of southern california giant kelp forest food webs. Ecosystems 7, 341–357. doi: 10.1007/s10021-003-0245-6
Granneman, J. E., and Steele, M. A. (2014). Fish growth, reproduction, and tissue production on artificial reefs relative to natural reefs. ICES J. Mar. Sci. 71, 2494–2504. doi: 10.1093/icesjms/fsu082
Guisan, A., and Rahbek, C. (2011). SESAM – a new framework integrating macroecological and species distribution models for predicting spatio-temporal patterns of species assemblages. J. Biogeogr. 38, 1433–1444. doi: 10.1111/j.1365-2699.2011.02550.x
Hamilton, S. L., Caselle, J. E., Malone, D. P., and Carr, M. H. (2010). Incorporating biogeography into evaluations of the channel Islands marine reserve network. Proc. Natl. Acad. Sci. U.S.A. 107, 18272–18277. doi: 10.1073/pnas.0908091107
Higgs, E., Falk, D. A., Guerrini, A., Hall, M., Harris, J., Hobbs, R. J., et al. (2014). The changing role of history in restoration ecology. Front. Ecol. Environ. 12:499–506. doi: 10.1890/110267
Higgs, E. S. (1997). What is good ecological restoration? Conserv. Biol. 11, 338–348. doi: 10.1046/j.1523-1739.1997.95311.x
Hof, A. R., Jansson, R., and Nilsson, C. (2012). Future climate change will favour non-specialist mammals in the (Sub) arctics. PLoS One 7:e52574. doi: 10.1371/journal.pone.0052574
Hof, A. R., and Svahlin, A. (2016). The potential effect of climate change on the geographical distribution of insect pest species in the Swedish boreal forest. Scand. J. For. Res. 31, 29–39. doi: 10.1080/02827581.2015.1052751
Horn, M. H., and Allen, L. G. (1978). A distributional analysis of California coastal marine fishes. J. Biogeogr. 5, 23–42. doi: 10.2307/3038105
Horn, M. H., Allen, L. G., and Lea, R. N. (2006). “Biogeography,” in The Ecology of Marine Fishes: California and Adjacent Waters, eds L. G. Allen, D. J. Pondella, and M. H. Horn (Berkeley: University of California Press), 3–25.
Hubbs, C. L. (1960). The marine vertebrates of the outer coast. Syst. Zool. 9, 134–147. doi: 10.2307/2411962
Johnson, T. D., Barnett, A. M., Demartini, E. E., Craft, L. L., Ambrose, R. F., and Purcell, L. J. (1994). Fish production and habitat utilization on a southern California artificial reef. Bull. Mar. Sci. 55, 709–723. doi: 10.1002/ieam.1689
Jude, D. J., and Deboe, S. F. (1996). Possible impact of gobies and other introduced species on habitat restoration efforts. Can. J. Fish. Aquat. Sci. 53, 136–141. doi: 10.1139/f96-001
Kayen, R. E., Lee, H. J., and Hein, J. R. (2002). Influence of the Portuguese Bend landslide on the character of the effluent-affected sediment deposit, Palos Verdes margin, southern California. Cont. Shelf Res. 22, 911–922. doi: 10.1016/S0278-4343(01)00111-X
Kushner, D. J., Rassweiler, A., McLaughlin, J. P., and Lafferty, K. D. (2013). A multi-decade time series of kelp forest community structure at the California Channel Islands. Ecology 94:2655. doi: 10.1890/13-0562R.1
Love, M. S. (2006). “Subsistence, commercial, and recreational fisheries,” in The Ecology of Marine Fishes: California and Adjacent Waters, eds L. G. Allen, D. J. Pondella, and M. H. Horn (Berkeley: University of California Press), 567–594.
Miller, J. R., and Hobbs, R. J. (2007). Habitat restoration – do we know what we’re doing.pdf. Restor. Ecol. 15, 382–390. doi: 10.1111/j.1526-100X.2007.00234.x
Morales, N. S., Fernández, I. C., and Baca-González, V. (2017). MaxEnt’s parameter configuration and small samples: are we paying attention to recommendations? A systematic review. PeerJ 5:e3093. doi: 10.7717/peerj.3093
Morris, R. L., Porter, A. G., Figueira, W. F., Coleman, R. A., Fobert, E. K., and Ferrari, R. (2018). Fish-smart seawalls: a decision tool for adaptive management of marine infrastructure. Front. Ecol. Environ. 16, 278–287. doi: 10.1002/fee.1809
Muscarella, R., Galante, P. J., Soley-Guardia, M., Boria, R. A., Kass, J. M., Uriarte, M., et al. (2014). ENMeval: an R package for conducting spatially independent evaluations and estimating optimal model complexity for MAXENT ecological niche models. Methods Ecol. Evol. 5, 1198–1205. doi: 10.1111/2041-210X.12261
Nicholls, R. J. (1995). Coastal megacities and climate change. GeoJournal 37, 369–379. doi: 10.1007/BF00814018
Palmer, M. A., Ambrose, R. F., and Poff, N. L. (1997). Ecological theory and community restoration ecology. Restor. Ecol. 5, 291–300. doi: 10.1046/j.1526-100X.1997.00543.x
Pavlik, B. (1996). “Defining and measuring success in rare plant reintroductions,” in in Restoring Diversity Strategies for Reintroduction of Endangered Plants, eds D. A. Falk, M. Olwell, and C. I. Millar (Lansing, MI: University of Michigan), 127–155.
Pearce, J., and Lindenmayer, D. (1998). Bioclimatic analysis to enhance reintroduction biology of the endangered helmeted honeyeater (Lichenostomus melanops cassidix) in southeastern Australia. Restor. Ecol. 6, 238–243. doi: 10.1046/j.1526-100X.1998.00636.x
Peterson, A. T., Ortega-Huerta, M. A., Bartley, J., Sánchez-Cordero, V., Soberón, J., Buddemeier, R. H., et al. (2002). Future projections for Mexican faunas under global climate change scenarios. Nature 416, 626–629. doi: 10.1038/416626a
Phillips, S. J., Anderson, R. P., Dudík, M., Schapire, R. E., and Blair, M. E. (2017). Opening the black box: an open-source release of Maxent. Ecography 40, 887–893. doi: 10.1111/ecog.03049
Phillips, S. J., Anderson, R. P., and Schapire, R. E. (2006a). Maximum entropy modeling of species geographic distributions. Ecol. Modell. 190, 231–259. doi: 10.1016/j.ecolmodel.2005.03.026
Phillips, S. J., Dudík, M., and Schapire, R. E. (2006b). Maxent Software for Modeling Species Niches and Distributions (Version 3.4.1). Available at: http://biodiversityinformatics.amnh.org/open_source/maxent/
Phillips, S. J., and Dudík, M. (2008). Modeling of species distributions with Maxent: new extensions and a comprehensive evaluation. Ecography 31, 161–175. doi: 10.1111/j.0906-7590.2008.5203.x
Polak, T., and Saltz, D. (2011). Reintroduction as an ecosystem restoration technique. Conserv. Biol. 25, 424–425. doi: 10.1111/j.1523-1739.2011.01669.x
Pondella, D. J. I, Piacenza, S., Claisse, J. T., Williams, C. M., Williams, J. P., and Zellmer, A. J. (2018). Characterizing drivers of fish biomass on nearshore rocky reefs in the Southern California Bight. Los Angeles, CA: Occidental College, Vantuna Research Group.
Pondella, D. J., Allen, L. G., Craig, M. T., and Gintert, B. (2006). Evaluation of eelgrass mitigation and fishery enhancement structures in San Diego Bay, California. Bull. Mar. Sci. 78, 115–131.
Pondella, D. J., Caselle, J. E., Claisse, J. T., Williams, J. P., Davis, K., Williams, C. M., et al. (2015a). South Coast Baseline Program Final Report: Kelp and Shallow Rock Ecosystems. Available at: https://caseagrant.ucsd.edu/sites/default/files/SCMPA-27-Final-Report_0.pdf
Pondella, D. J., Zahn, L. A., Love, M. S., Siegel, D., and Bernstein, B. B. (2015b). Modeling fish production for southern California’s petroleum platforms. Integr. Environ. Assess. Manag. 11, 584–593. doi: 10.1002/ieam.1689
Pondella, D. J., Gintert, B. E., Cobb, J. R., and Allen, L. G. (2005). Biogeography of the nearshore rocky-reef fishes at the southern and Baja California islands. J. Biogeogr. 32, 187–201. doi: 10.1111/j.1365-2699.2004.01180.x
Pondella, D. J., Stephens, J. S., and Craig, M. T. (2002). Fish production of a temperate artificial reef based on the density of embiotocids (Teleostei: perciformes ). ICES J. Mar. Sci. 59, S88–S93. doi: 10.1006/jmsc.2002.1219
R Core Team (2015). R Core Team. R A Language Environment Statistical Computing. Available at: http://www.mendeley.com/research/r-language-environment-statistical-computing
Radosavljevic, A., and Anderson, R. P. (2014). Making better Maxent models of species distributions: complexity, overfitting and evaluation. J. Biogeogr. 41, 629–643. doi: 10.1111/jbi.12227
Robinson, N. M., Nelson, W. A., Costello, M. J., Sutherland, J. E., and Lundquist, C. J. (2017). A systematic review of marine-based Species Distribution Models (SDMs) with recommendations for best practice. Front. Mar. Sci. 4:421. doi: 10.3389/fmars.2017.00421
Rodríguez, J. P., Brotons, L., Bustamante, J., and Seoane, J. (2007). The application of predictive modelling of species distribution to biodiversity conservation. Divers. Distrib. 13, 243–251. doi: 10.1111/j.1472-4642.2007.00356.x
Schaffner, R., Steinberg, S., and Schiff, K. (2015). A GIS Tool to Compute a Pollutant Exposure Index for the Southern California Bight. Redlands, CA: ESRI Press. doi: 10.17128/9781589483651_6
Shcheglovitova, M., and Anderson, R. P. (2013). Estimating optimal complexity for ecological niche models: a jackknife approach for species with small sample sizes. Ecol. Modell. 269, 9–17. doi: 10.1016/j.ecolmodel.2013.08.011
Sih, A., Jonsson, B. G., and Luikart, G. (2000). Habitat loss: ecological, evolutionary and genetic consequences. Trends Ecol. Evol. 15, 132–134. doi: 10.1016/S0169-5347(99)01799-1
Smallwood, S. K. (2001). Linking habitat restoration to meaningful units of animal demography. Restor. Ecol. 9, 253–261. doi: 10.1046/j.1526-100X.2001.009003253.x
Stephens, J. S., Larson, R. J., and Pondella, D. J. (2006). “Rocky reefs and kelp beds,” in The Ecology of Marine Fishes: California and Adjacent Waters, eds L. G. Allen, D. J. Pondella, and M. H. Horn (Berkeley: University of California Press), 227–252.
van Horne, B. (1983). Density as a misleading indicator of habitat quality. J. Wildl. Manage. 47:893. doi: 10.2307/3808148
Warren, D. L., and Seifert, S. N. (2011). Ecological niche modeling in Maxent: the importance of model complexity and the performance of model selection criteria. Ecol. Appl. 21, 335–342. doi: 10.1890/10-1171.1
Wilson, C. D., Roberts, D., and Reid, N. (2011). Applying species distribution modelling to identify areas of high conservation value for endangered species: a case study using Margaritifera margaritifera (L.). Biol. Conserv. 144, 821–829. doi: 10.1016/j.biocon.2010.11.014
Wisz, M. S., Hijmans, R. J., Li, J., Peterson, A. T., Graham, C. H., Guisan, A., et al. (2008). Effects of sample size on the performance of species distribution models. Divers. Distrib. 14, 763–773. doi: 10.1111/j.1472-4642.2008.00482.x
Wortley, L., Hero, J. M., and Howes, M. (2013). Evaluating ecological restoration success: a review of the literature. Restor. Ecol. 21, 537–543. doi: 10.1111/rec.12028
Yang, X.-Q., Kushwaha, S. P. S., Saran, S., Xu, J., and Roy, P. S. (2013). Maxent modeling for predicting the potential distribution of medicinal plant, Justicia adhatoda L. in Lesser Himalayan foothills. Ecol. Eng. 51, 83–87. doi: 10.1016/j.ecoleng.2012.12.004
Zahn, L. A., Claisse, J. T., Williams, J. P., Williams, C. M., and Pondella, D. J. (2016). The biogeography and community structure of kelp forest macroinvertebrates. Mar. Ecol. 37, 770–785. doi: 10.1111/maec.12346
Keywords: ecological niche modeling, MaxEnt, rocky reefs, southern California, habitat restoration
Citation: Zellmer AJ, Claisse JT, Williams CM, Schwab S and Pondella DJ II (2019) Predicting Optimal Sites for Ecosystem Restoration Using Stacked-Species Distribution Modeling. Front. Mar. Sci. 6:3. doi: 10.3389/fmars.2019.00003
Received: 28 September 2018; Accepted: 07 January 2019;
Published: 12 February 2019.
Edited by:
Stelios Katsanevakis, University of the Aegean, GreeceReviewed by:
Anouschka R. Hof, Wageningen University and Research, NetherlandsGermana Garofalo, Istituto per le Risorse Biologiche e le Biotecnologie Marine (IRBIM), Italy
Chris Rooper, National Marine Fisheries Service (NOAA), United States
Copyright © 2019 Zellmer, Claisse, Williams, Schwab and Pondella. This is an open-access article distributed under the terms of the Creative Commons Attribution License (CC BY). The use, distribution or reproduction in other forums is permitted, provided the original author(s) and the copyright owner(s) are credited and that the original publication in this journal is cited, in accordance with accepted academic practice. No use, distribution or reproduction is permitted which does not comply with these terms.
*Correspondence: Amanda J. Zellmer, zellmer@oxy.edu